Article

Design and Finite Element Analysis of Reducer Housing Based on ANSYS

1
School of Mechanical Engineering, Shandong Huayu University of Technology, Dezhou 253034, China
2
School of Mechanical-Electronic and Vehicle Engineering, Beijing University of Civil Engineering and Architecture, Beijing 100044, China
3
National Lab of Auto Performance and Emission Test, School of Mechanical and Vehicular Engineering, Beijing Institute of Technology, Beijing 100081, China
*
Author to whom correspondence should be addressed.
Symmetry 2025, 17(10), 1663; https://doi.org/10.3390/sym17101663
Submission received: 9 July 2025 / Revised: 5 August 2025 / Accepted: 5 September 2025 / Published: 6 October 2025

Abstract

As a pivotal component of the single-gear reducer, the casing of the miniature car reducer not only safeguards the internal transmission system but also interfaces seamlessly with the external structure. Currently, the structural design of domestic single-stage reducers primarily leans on experience and standardized specifications. To guarantee the reliable and stable operation of the casing, a high safety factor is often incorporated, which inevitably results in increased weight and necessitates secure bolting connections. This study presents an innovative scheme to design the flange with the box and realize the lightweight nature of the box by finite element analysis to reduce the manufacturing cost. Based on the working state of maximum torque and maximum speed, this study obtains the stress distribution of each bearing seat under different working conditions and carries out static and dynamic analysis combined with other coupling constraints. The analysis results show that the structure has high stiffness and strength, which is suitable for lightweight design, and that the first ten spontaneous vibration frequencies are far away from the excitation frequency of the inner and outer boundary, avoiding the resonance phenomenon. Moreover, this study proposes a new structure design method, which effectively improves the stiffness of the structure. Through the calculation of volume ratio before and after three optimizations, the optimal volume ratio of 30% is selected, unnecessary materials around the bearing seat are removed, and the layout of ribs is determined. After structural optimization, the weight of the shell is reduced by 10.2%, and both the static and dynamic characteristics meet the design requirements.

1. Introduction

With the rapid development of the automotive industry and the continuous increase in vehicle ownership, pollutant emissions have been rising, leading to increasingly prominent environmental issues. The development of new energy vehicles has thus become a major trend for the future of the automotive industry. The reducer is one of the core components of the electric vehicle transmission system, directly bearing the rotational impact from both the motor and the wheels. Its service life directly affects the reliability and economic efficiency of electric vehicles. Therefore, research and development of reducers for new energy vehicles are of great significance [1].
Significant research achievements have been made in the field of small car reducer housing design and finite element analysis based on ANSYS in recent years. Jianchao Bian et al. used Matlab_R2020b and ANSYS17.0 software to optimize the design and modal analysis of the worm gear transmission of a belt conveyor reducer, providing new ideas for the optimization of the reducer housing transmission system. Meanwhile, S. Elizabeth Amudhini Stephen also conducted design optimization research on the housing problem of the speed reducer using Matlab_R2020b and ANSYS17.0, effectively improving the performance of the reducer through simulation analysis. In addition, although Pinto V D et al.’s research focused on the thermal and electrical performance analysis of lightweight micro thermal cogeneration systems and did not directly involve small car reducers, it also demonstrated the widespread application of ANSYS in mechanical system performance analysis [2]. These studies all indicate that foreign scholars are actively using ANSYS software for in-depth design.
As the supporting and protective component of the reducer, the housing not only needs to possess sufficient strength and rigidity to ensure the normal operation of the internal transmission system but also must withstand the loads generated by gear meshing. The weight of the housing typically accounts for more than 30% of the total weight of the assembly. Studies have shown that reducing the overall vehicle weight by 10% can increase the driving range by 5.5%. Therefore, lightweight design of the reducer housing is crucial for improving the vehicle’s range [3,4,5].
A domestic company has designed a single-stage reducer housing mainly based on traditional experience and standards, resulting in a relatively conservative design. Due to the heavy weight of the housing itself and the use of screw connections between the flange and the housing, the assembly efficiency of the reducer is reduced and the manufacturing cost for the company is increased. This study, based on the company’s existing reducer drive system parameters and in accordance with traditional design standards for the housing, integrates the flange connected to the motor with the reducer housing. This approach aims to reduce the number of machined surfaces and improve the assembly efficiency of the reducer. On this basis, the finite element method is used to study the static and dynamic characteristics of the housing structure. By combining topology optimization and size optimization, the structural design of the housing is optimized—removing material near the support seat, adding ribs, and adjusting key parameters such as housing thickness—to obtain a housing model that reduces product weight while meeting usage requirements. This provides a reference for the development of similar products.
Due to various constraints such as technology and cost, both domestic and international micro passenger cars currently tend to adopt the “motor–reducer–rear axle” configuration to replace the traditional “motor–rear axle” structure. By adding a reduction device, vehicles can obtain greater torque when climbing, meeting the operational requirements of steam-powered vehicles. In the power transmission systems of small passenger cars, this structure has the following four configuration forms:
In terms of mechanical drive type, the engine is directly replaced by the motor while other components such as the clutch, transmission, and final drive still use conventional vehicle drive methods. Although this drive mode can improve the starting torque of pure electric vehicles, it has many drawbacks, such as numerous components, large mass, and low transmission efficiency. As a result, it can no longer meet the performance requirements of micro vehicles and is gradually being phased out by the market.
The centralized drive mode features advantages such as lighter weight, smaller size, and longer service life. However, it places higher demands on the output torque and power of the motor. At present, it remains the main power transmission mode for small-displacement passenger cars and is moving towards the integration of the motor and reducer.
Wheel-side motor drive systems impose higher requirements on the starting torque and power performance of the motor, and each motor’s control system must possess high precision and reliability. However, this drive mode is overly compact, which brings inconvenience to subsequent maintenance and disassembly.
In-wheel motor drive forms two different drive types: one in which the motor directly drives the wheel, and another in which the motor’s power is transmitted to the wheel via a transmission system. However, due to high costs and structural complexity, this technology is not widely used in engineering applications.
Inside the reducer, multiple pairs of gears mesh to reduce speed and increase torque. The exterior of the reducer is the housing, which connects and cooperates with internal components through parts such as bearings and seals, ensuring smooth transmission. During operation, the reducer housing bears the load from the weight of various components and is prone to damage, so strength analysis of the reducer housing is necessary during the design process.
Currently, the overall performance of domestic micro passenger car reducers still lags behind the international advanced level. For example, international brand TESLA vehicles have a maximum input speed of 16,000 rpm, a total reduction ratio of 9.73, and a maximum power of 306 kW and have developed vehicles with independent intellectual property rights on this basis. The BMW i3 powertrain also adopts a similar drive mode, with a maximum motor torque of 125 kW, 250 Nm, and a total reduction ratio of 9.665 [6,7,8]. The domestic Chongqing Qingshan EF135 reducer has a maximum torque capacity of 350 Nm and a maximum speed of 9.11 m/s [9,10]. The 138 series reducer has a maximum input speed of 6000 rpm, a total reduction ratio of 8, and a maximum input torque of 60 Nm [11,12,13].

2. Finite Element Modeling of Reducer Housing

2.1. Basic Theory of the Finite Element Method

The finite element analysis (FEA) process includes the establishment of the finite element model, mesh generation, definition of material properties, application of loads and boundary conditions, data analysis and computation, as well as visualization and output of analysis results. As a numerical analysis technique based on the principles of structural mechanics, FEA is widely used to solve complex problems in mathematics and physics. The key to this technique lies in the use of the piecewise approximation method, which subdivides the region of interest into multiple small subregions and then approximates these subregions with simple functions, thereby addressing more complex overall problems.
In recent years, with significant advancements in computer technology, the finite element method has been widely applied to solve problems in solid mechanics. Traditional product design processes often rely on experience, combined with current data and product requirements for continuous optimization. However, this approach is lacking in parameter optimization, resulting in a certain degree of blindness in the design process and affecting design efficiency. By adopting the finite element method, potential problems in product design can be prevented and various hypothetical conditions can be quickly and efficiently verified, thereby reducing manufacturing costs and improving product quality and reliability. The finite element method is widely used in fields such as aerospace, mechanical engineering, and civil construction. Its analysis process generally includes three stages: pre-processing, solving, and postprocessing.

2.2. The Structure and Working Principle of the Reducer

The single-speed reducer equipped in small passenger cars mainly consists of several components, including the left housing, right housing, bearings, gear shafts, gears, differential, and sealing rings. The center distance from the input shaft (from point A to point B) to the output shaft (from point E to point F) is 136 plus 0.015 mm, while the center distance from the intermediate shaft (from point C to point D) to the output shaft (from point E to point F) is 85 plus 0.013 mm. The torque input from the motor is transmitted via gear Z2 located on the secondary shaft at the position from point C to point D. This secondary shaft (from point C to point D) meshes with gear Z1 on the input shaft (from point A to point B), and the reduction gear Z3 at the other end of the secondary shaft transmits power to gear Z4 mounted on the differential housing, thereby achieving power output. As shown in Figure 1.

2.3. Structural Design of the Reducer Housing

2.3.1. Design Requirements for the Shell

The reducer housing is responsible for protecting the internal transmission components and providing structural support. With the continuous advancement of the automotive industry, the design requirements for reducer housings have become increasingly stringent, demanding not only higher strength and rigidity but also reduced noise and weight. The specific requirements are as follows:
When designing the housing, comprehensive consideration must be given to the noise and vibration generated during the operation of the gearbox. Proper handling of conditions such as bypassing and connecting the rotation of the motor and internal gear meshing is necessary to enhance the structural performance of the housing.
The housing design should incorporate lubrication channels to reduce wear during high-speed gear operation and to facilitate heat dissipation for internal components. On the premise of meeting operational performance requirements, lightweight structural design should be adopted to reduce the overall weight of the reducer.

2.3.2. Design Guidelines for the Shell

The structural design of the reducer housing must be based on the company’s internal drive system parameters as well as the specified dimensions and positions of external connection screw holes. The reducer housing consists of left and right shells, with the flange integrated into the left shell. This integration reduces the machining area of the housing and eliminates the need for screw connections between the two shells, thereby improving assembly efficiency and reducing manufacturing costs. This project draws on relevant domestic and international research findings and proposes design specifications for key components such as the housing material, shape, reinforcing ribs, wall thickness, and bonding anchorage.
Verification during the housing structural design phase is conducted through simulation analysis, which, according to the function and requirements of the housing, can be categorized into three main types. Housing sealing simulation verification: the surface pressure at the housing joint must be ≥2 MPa, the opening displacement at the joint <0.01 mm, and the slip displacement <0.07 mm. Different manufacturers may have slight variations in these requirements, but the primary goal is to prevent sealing failure at the joint, avoid oil leakage or seepage, and thus prevent poor lubrication and overheating damage to bearings and gears. Housing strength simulation verification: includes loading at one and multiple times the input torque, 28 working conditions, vibration, and impact to ensure that the housing’s stress and strain meet the mechanical properties of the material. Housing stiffness simulation verification: includes modal analysis and dynamic stiffness at bearing bores and mounting bosses to ensure the housing’s resistance to deformation and prevent deformation from affecting the gear shaft’s transmission accuracy, thereby ensuring excellent NVH (Noise, Vibration, and Harshness) performance. Therefore, the rationality and lightweight design of the housing should be discussed and optimized under the premise of meeting its functional requirements.
To meet the weight requirements of the housing, die-cast aluminum alloy was selected as the housing material after careful consideration. For the cylindrical housing proposed in this paper, the addendum arc dimension represents the minimum envelope size, and the clearance between the housing and the tip of the rotating gear should be controlled within 5 to 8 mm to achieve a more compact envelope.
The housing wall thickness must be designed to meet rigidity and strength requirements. Insufficient rigidity can lead to deformation, affecting gear meshing and bearing operation inside the housing. Insufficient strength can result in cracks or even failure at weak points under heavy loads. Generally, greater wall thickness increases hardness and strength, but excessive thickness can cause shrinkage, reducing structural rigidity and strength. Thin-wall designs should be minimized. Based on the company’s experience in housing structural design, the wall thickness is set between 4 and 7 mm.
Similar to areas subjected to high forces and stress concentrations such as bearing seats, bolt holes, and end caps, the rational arrangement of ribs can enhance the housing’s strength and stiffness. To prevent excessive thermal gradients and internal shrinkage caused by intersecting ribs, the thickness of reinforcing ribs should be 0.5 to 1 times the wall thickness, and the spacing should be five times the wall thickness.
Chamfer design can effectively prevent cracks at stress concentration points within the housing. Fillets should be provided at all connections between cylindrical sections to ensure obtuse angles at joints, with a transition fillet radius of 0.5 to 1 times the wall thickness.
The screw design at the joint surface between the left and right shells ensures good sealing performance. The left and right shells are tightened together with screws and then sealed with adhesive. The bolt hole spacing at the corners of the joint surface should be symmetrical. The bolt diameter should be 10 times, typically 1.7 to 2 times the protruding diameter of the bolt.
When designing the mesh housing structure, appropriate datum references should be selected. The “one face, two pins” and positional tolerance design can ensure assembly accuracy of all components during assembly, thereby improving assembly efficiency.
When arranging two annular ribs, it is evident from the polyline diagram that placing the ribs on the inner side and in the middle provides the best housing stiffness with minimal weight increase. This is because both ribs are close to the bearing seat, and the contour range that the ribs need to connect is small, i.e., the rib length is much less than that of the outer rib. When three annular ribs are arranged, the housing stiffness is significantly improved, but the housing weight is also the greatest, which is not conducive to lightweight design. Dense annular ribs are only recommended when the housing strength and stiffness are particularly poor and need urgent reinforcement. The above describes only one type of housing design specification. Other aspects, such as oil holes, oil grooves, draft angles, and noise reduction design, are not detailed here.

2.3.3. Establishment of the Housing Mode

Based on the above, this study utilized SolidWorks software (SolidWorks 2023) to carry out the three-dimensional solid modeling of the reducer. The reducer described in this paper is specifically designed for small electric vehicles and includes a spigot for connection to the vehicle’s rear axle housing. Detailed parameters are provided in Table 1. The installation method involves both bolt connection and housing flange connection.
According to the aforementioned housing design guidelines, the wall thickness of the housing is set at 6 mm. Based on the arrangement of internal components such as gear shafts, the edge wall thickness profile is designed using the minimum structural envelope method, with the distance from the inner wall of the housing at the output shaft gear to the addendum circle of the gear set at 5 mm. Referring to similar reducers, bolts are symmetrically arranged at the corners of the joint surfaces on both sides of the housing for fastening, and locating pin holes are added at two opposing bolt hole positions to facilitate rapid assembly and ensure dimensional accuracy during assembly.
The flange abandons the traditional design of being fixed to the left housing by bolts; instead, the left housing and the flange are designed as an integrated unit, reducing the number of machined surfaces. The diameter of the flange base cylinder is inscribed within the outer diameter of the corner bolt bosses, and 5 mm wide reinforcing ribs are provided at the tangent points to reduce stress concentrations in these areas.
Since the center distance of the external motor bolt holes is 140 mm, to ensure proper fit and avoid interference with the spigot, the size of the flange on the end face is reduced accordingly.
Under normal circumstances, the bearing seat is responsible for withstanding the most critical axial and radial loads on the housing. When designing the support area, a relatively large thickness should be considered. The overall stiffness and strength of the mesh housing structure can be improved by adding stiffening ribs. However, in practical engineering applications, relying solely on empirical experience to determine the layout of stiffeners is highly subjective. If the arrangement of the reinforcing ribs is unreasonable, it may not enhance the overall performance of the structure and could instead increase the mass of the housing, resulting in unnecessary losses.
To address this issue, topology optimization techniques can be employed to determine the optimal load transfer paths, providing reliable data support for the arrangement of ribs. The area near the bearing seat can be regarded as the optimal solution region (as shown by the dark area in Figure 2), while other regions are not optimal choices.
With regard to the detailed design of the housing—such as small chamfers, oil holes, and oil grooves—these features have minimal impact on the overall structural response of the housing during finite element analysis. However, retaining these features can lead to mesh distortion, significantly degrading mesh quality and adversely affecting the accuracy of the analysis results. If distorted mesh elements are refined in the finite element model, it not only requires substantial manual effort but also greatly increases computational time without a significant improvement in the accuracy of the analysis results. Therefore, these detailed features are temporarily omitted at this stage. They will be incorporated into the final housing model after the analysis is completed and the detailed design is finalized.

2.4. Finite Element Modeling of the Reducer Housing

Throughout the analysis process, the pre-processing steps—including importing the geometric model, assigning material properties, meshing, applying loads, and setting boundary conditions—are the most time-consuming. Therefore, proficiency in the pre-processing modules of analysis software can significantly reduce the overall analysis time. There are many commonly used finite element analysis software packages, such as ABAQUS, ANSYS, and Hyper Mesh. In this study, ANSYS is used for the analysis.
ANSYS provides two methods for constructing finite element models. The first method involves importing a geometric model that has been pre-built in 3D modeling software, followed by meshing within ANSYS to generate the finite element model. The second method utilizes the solid modeling capabilities of the ANSYS pre-processor to create the finite element model using key points and elements. Considering the complexity of the geometry and the modeling cycle, the second method is rarely used in practical analysis.
Given the structural complexity and modeling time considerations, the latter approach is not recommended in engineering applications. During the pre-processing stage, model simplification requires the removal of small features from the model. Simplifying these minor features can reduce computation time and improve efficiency while maintaining the accuracy of the approximate solution. This was fully considered in the design of the reducer housing; no pre-processing was performed in advance, and instead, the 3D solid model built in SolidWorks was used directly for modeling.
Due to its advantages in strength, weight, and cost, aluminum alloy is widely used in the manufacturing of reducer housings. In this study, the material selected for the reducer housing is aluminum alloy ADC12 (YL113), with specific parameters shown in Table 2. The left and right housings are connected by bolts, and a bonded contact constraint is used at the interface to ensure a tight connection between the two housings. The combined left and right housings are then meshed. The choice of element type is critical for the accuracy of numerical simulation, and as the order of the shape function increases, the computation time also increases.
ANSYS offers three meshing methods: free meshing, mapped meshing, and sweep meshing. During the meshing of the reducer housing, the mesh size and method used greatly affect the accuracy of the results. In finite element simulation of the housing, it is difficult to balance accuracy and efficiency. Generally, increasing the number of mesh elements improves accuracy but also increases computational load, which can lead to excessive computation time or even system crashes. Therefore, within the limits of computational resources, reasonable meshing should be performed to maximize computational accuracy. The number of mesh elements directly affects both accuracy and computation time; while increasing the mesh density can improve accuracy, it also prolongs computation time, so a proper balance must be struck.
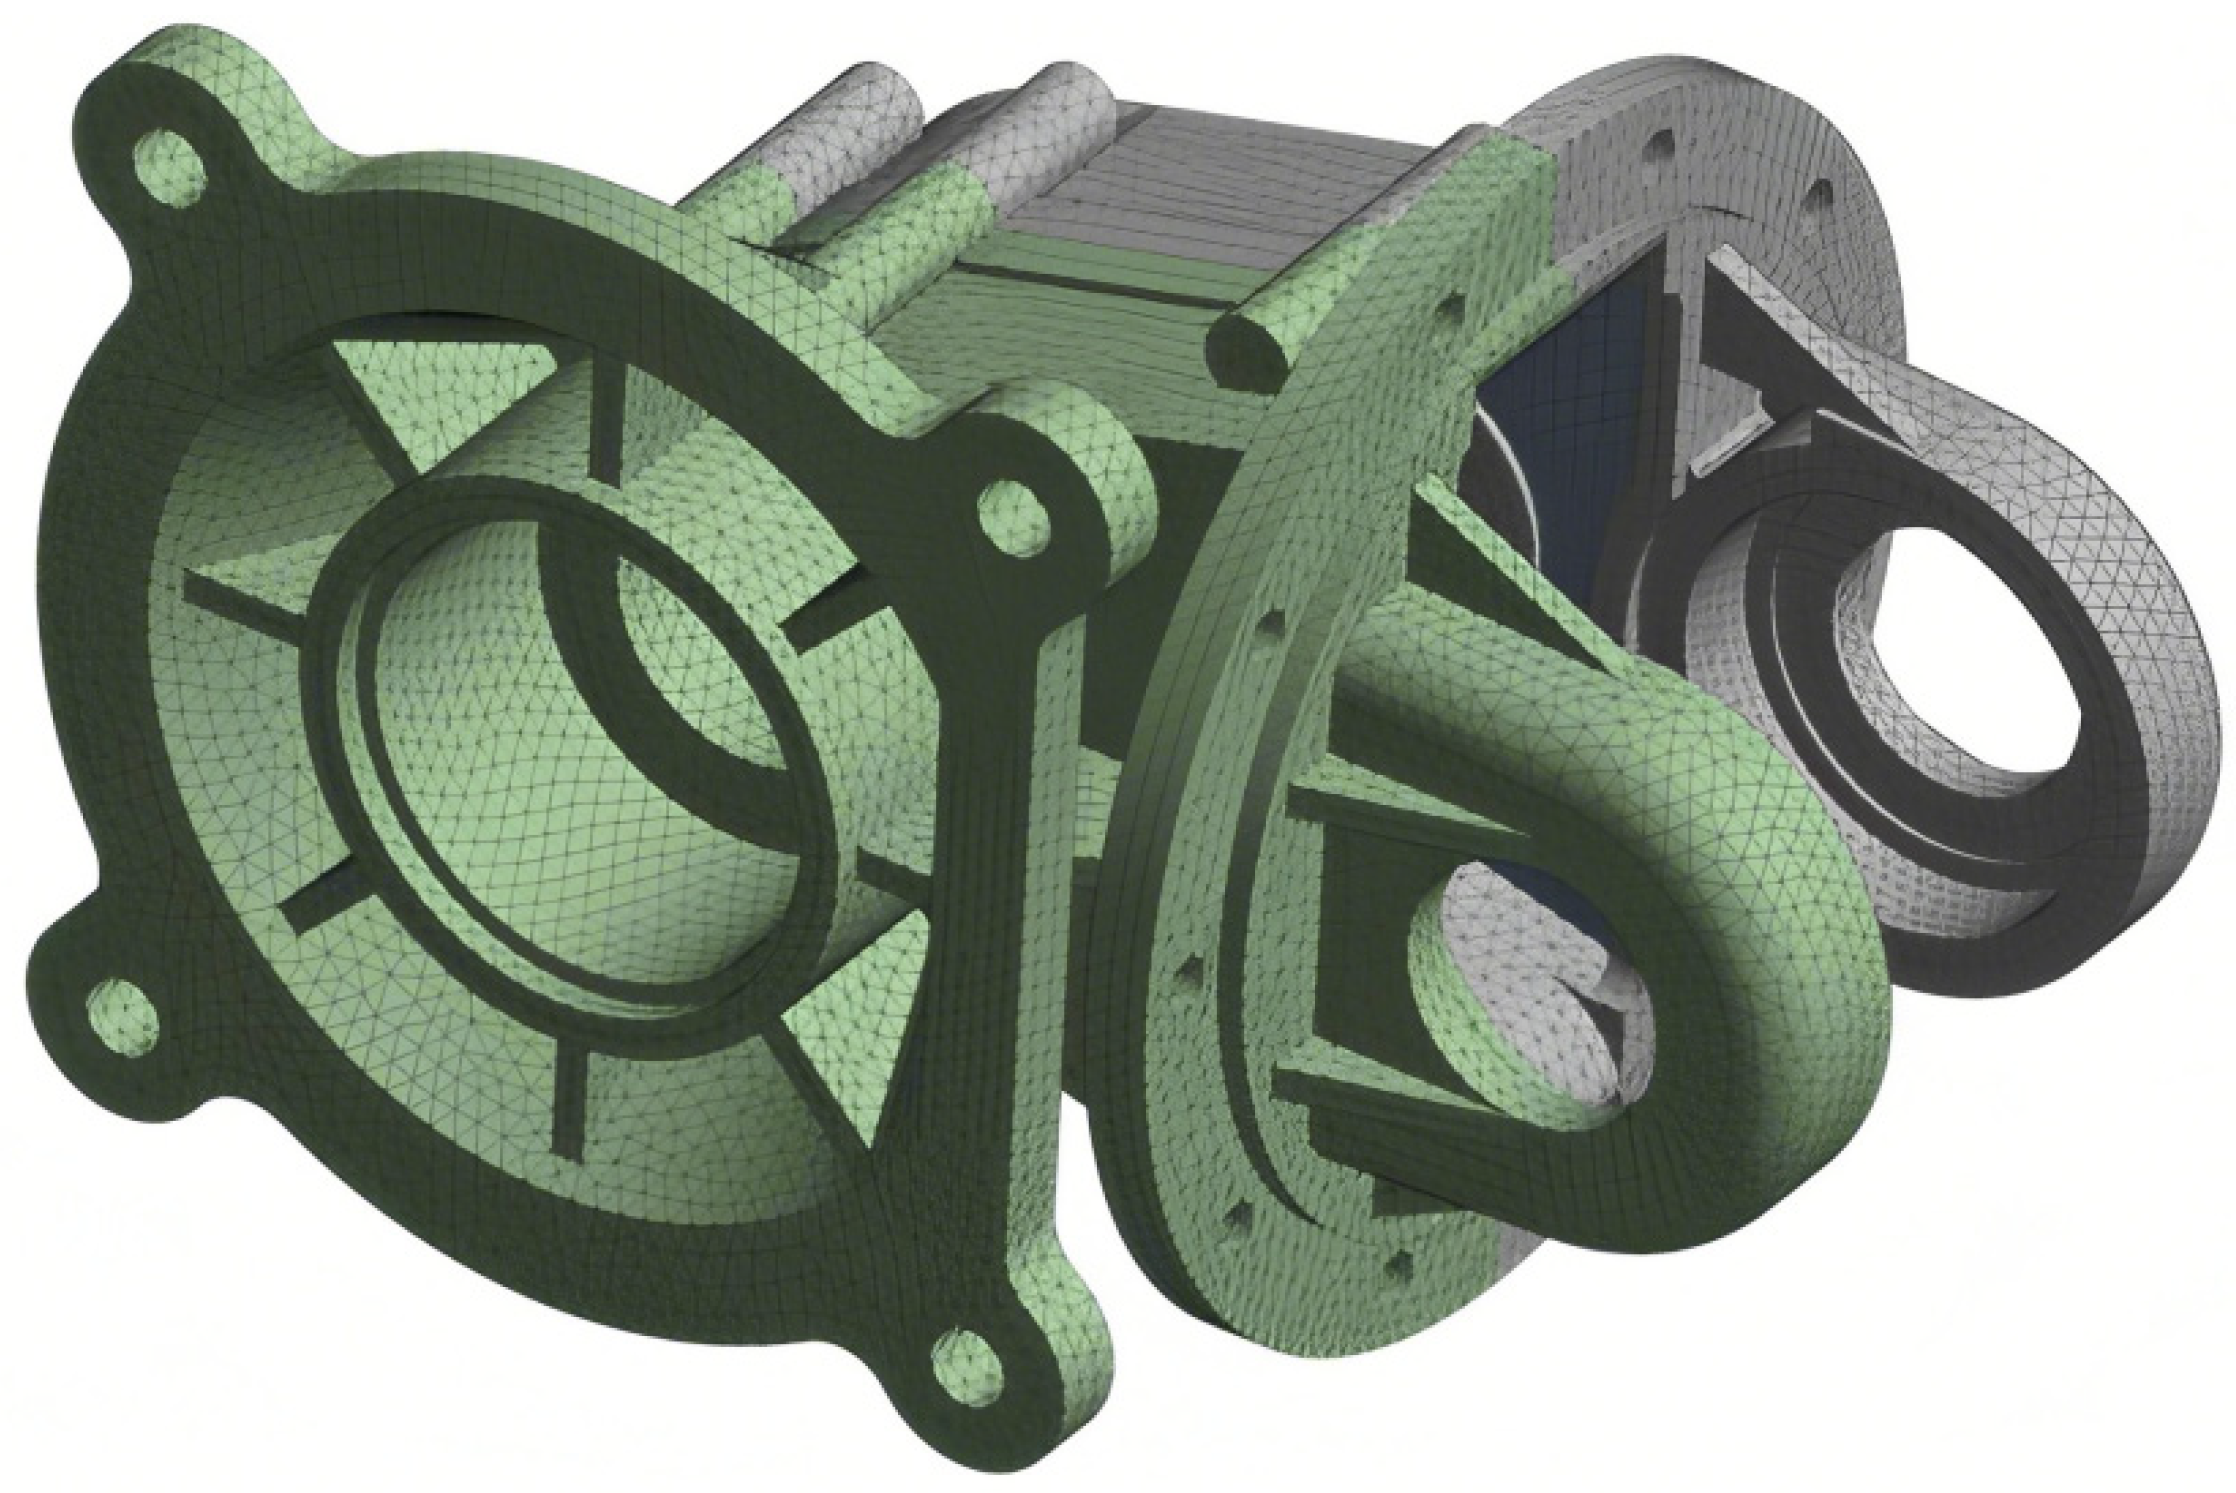
Due to the complex structure of the reducer housing, a second-order tetrahedral mesh is used, with a mesh size of 4 mm. In the highly loaded bearing seat area, the mesh is locally refined to increase the number of elements and improve solution accuracy. The finite element model of the meshed reducer housing is shown in Figure 3, with a total of 194,283 nodes and 305,230 elements. The steps for applying loads and boundary conditions will be described in subsequent sections.
Based on the preceding content, this paper provides an overview of the theoretical foundations of finite element analysis as well as a comprehensive review of its advantages and application scope. Furthermore, the composition of the internal drive system of the designed reducer is described in detail. In accordance with the design standards for reducer housings, and taking into account both the layout of internal transmission system parameters and the dimensions of external connecting bolt holes, an integrated design of the flange and the left housing is proposed, along with a preliminary housing model in which the left and right housings are connected by bolts. On this basis, SolidWorks software was used to carry out three-dimensional modeling of the reducer, and the selection of relevant parameters is explained. To address the current lack of accuracy and reliability in the load transfer path of the bearing seat, this study intends to import the model without stiffening ribs into Workbench software. By selecting the mesh type and determining the mesh size, a finite element mesh model of the reducer housing is established.

3. Finite Element Analysis of Reducer Housing

The preliminary design parameters of the reducer housing are determined according to design specifications and by referencing engineering experience. Its structure is relatively rough and heavy, necessitating improvement and optimization through the finite element method to gradually achieve the goal of lightweight design. Within this research framework, the project intends to comprehensively apply both structural optimization and size optimization strategies. By optimizing the load-bearing conditions of the bearing seat, the optimal load-bearing scheme can be identified, thereby providing theoretical support for structural optimization design. Structural optimization aims to improve the housing structure [14] to achieve better performance. Both optimization methods are based on structural static analysis and modal analysis, requiring an in-depth investigation of these characteristics to verify whether parameters such as stiffness and strength are excessive under constraint conditions and to determine whether resonance with external excitation frequencies may occur under these constraints.

3.1. Static Analysis of the Shell

The reducer housing plays a critical role in supporting and protecting components, as well as connecting to external structures. Its load-bearing performance and operational reliability are gradually becoming focal points of research. The stiffness and strength of the housing have a significant impact on the transmission characteristics and positional accuracy of the internal gears. During operation, the housing is subjected to impacts from the internal gears, which poses a severe test of its stiffness and strength. If the housing lacks sufficient rigidity, deformation may occur under external forces, affecting the precise meshing of the internal gear–shaft system and the positioning of the left and right supports, thereby compromising the stability of the entire transmission system. If the housing lacks adequate strength, weak points may develop cracks or even fracture under load, which can adversely affect normal operation. This paper proposes an innovative structural design method. In this structure, the maximum load occurs when the drive motor reaches its maximum torque. Therefore, a static analysis of the structure is required, along with an evaluation of its stiffness and strength.

3.1.1. Theory and Procedure of Static Analysis

(1)
Theory of Static Analysis
In the field of structural static analysis, linear analysis is the most widely used approach. Static analysis involves studying a series of issues such as the magnitude of loads, resistance, and their effects on the structure under applied loads. Reducer housings are generally made of plastic aluminum alloy materials, which exhibit plastic yielding when subjected to specific loads [15]. In view of this, this paper presents a calculation method based on the fourth strength theory to evaluate and analyze the relevant issues.
σ i = 2 2 ( σ 1 σ 2 ) 2 + ( σ 2 σ 3 ) 2 σ
In the above equation, σi represents the stress at any given point, σ1, σ2, σ3 are the principal stresses of the element, and [σ] is the allowable stress of the material (unit: MPa). The formula is as follows:
σ = σ s s
In the formula, σs is the yield strength of the selected material and s is the safety factor of the selected material.
(2)
The static analysis process of the shell
The static analysis procedure for the reducer housing includes a series of steps such as pre-processing, applying constraints, solving, and post-processing. Post-processing involves organizing and interpreting the data obtained from the solution in order to comprehensively understand the performance of the reducer housing under static loads.

3.1.2. Dynamic Modeling of the Transmission System Inside the Shell

(1)
Force analysis of the transmission system
The reducer described in this text achieves its function through two pairs of internally meshed helical gears. Its exterior is connected to the input shaft via a flange, which in turn is coupled to the motor, thereby transmitting power to the left and right output shafts of the differential. As a type of helical gear, the shaft–gear system experiences forces that can be decomposed into three components: the tangential force Ft, the axial force Fa, and the radial force Fr. These forces are transmitted through the drive shaft to the two bearings [16]. The internal stress regions of the reducer housing are primarily concentrated at the contact points between the housing and the bearings; thus, the static loads acting on the reducer housing are conveyed to the housing itself via the bearings. Table 3 provides a detailed listing of the relevant parameters for each helical gear.
In actual operating conditions, power manifests in the form of peak torque during specific time intervals. This study conducts analysis and validation to achieve a maximum torque of 65 Nm. The diagram below illustrates a simplified representation of the forces acting on each shaft system. As shown in Figure 4, Figure 5 and Figure 6.
In the accompanying diagrams and tables, nodes A through F sequentially denote the positions of the bearing housings located on both sides of the housing. Nodes G through J represent different gear stages in order. Z1 to Z4 correspond sequentially to the internal helical gears. The forces Fti, Fai, and Fri represent the tangential, axial, and radial forces acting on the helical gears, respectively. FNX, FNY, and FNZ denote the components of the reaction force at the bearing housings in the X, Y, and Z directions, respectively.
(2)
Dynamic Modeling and Results
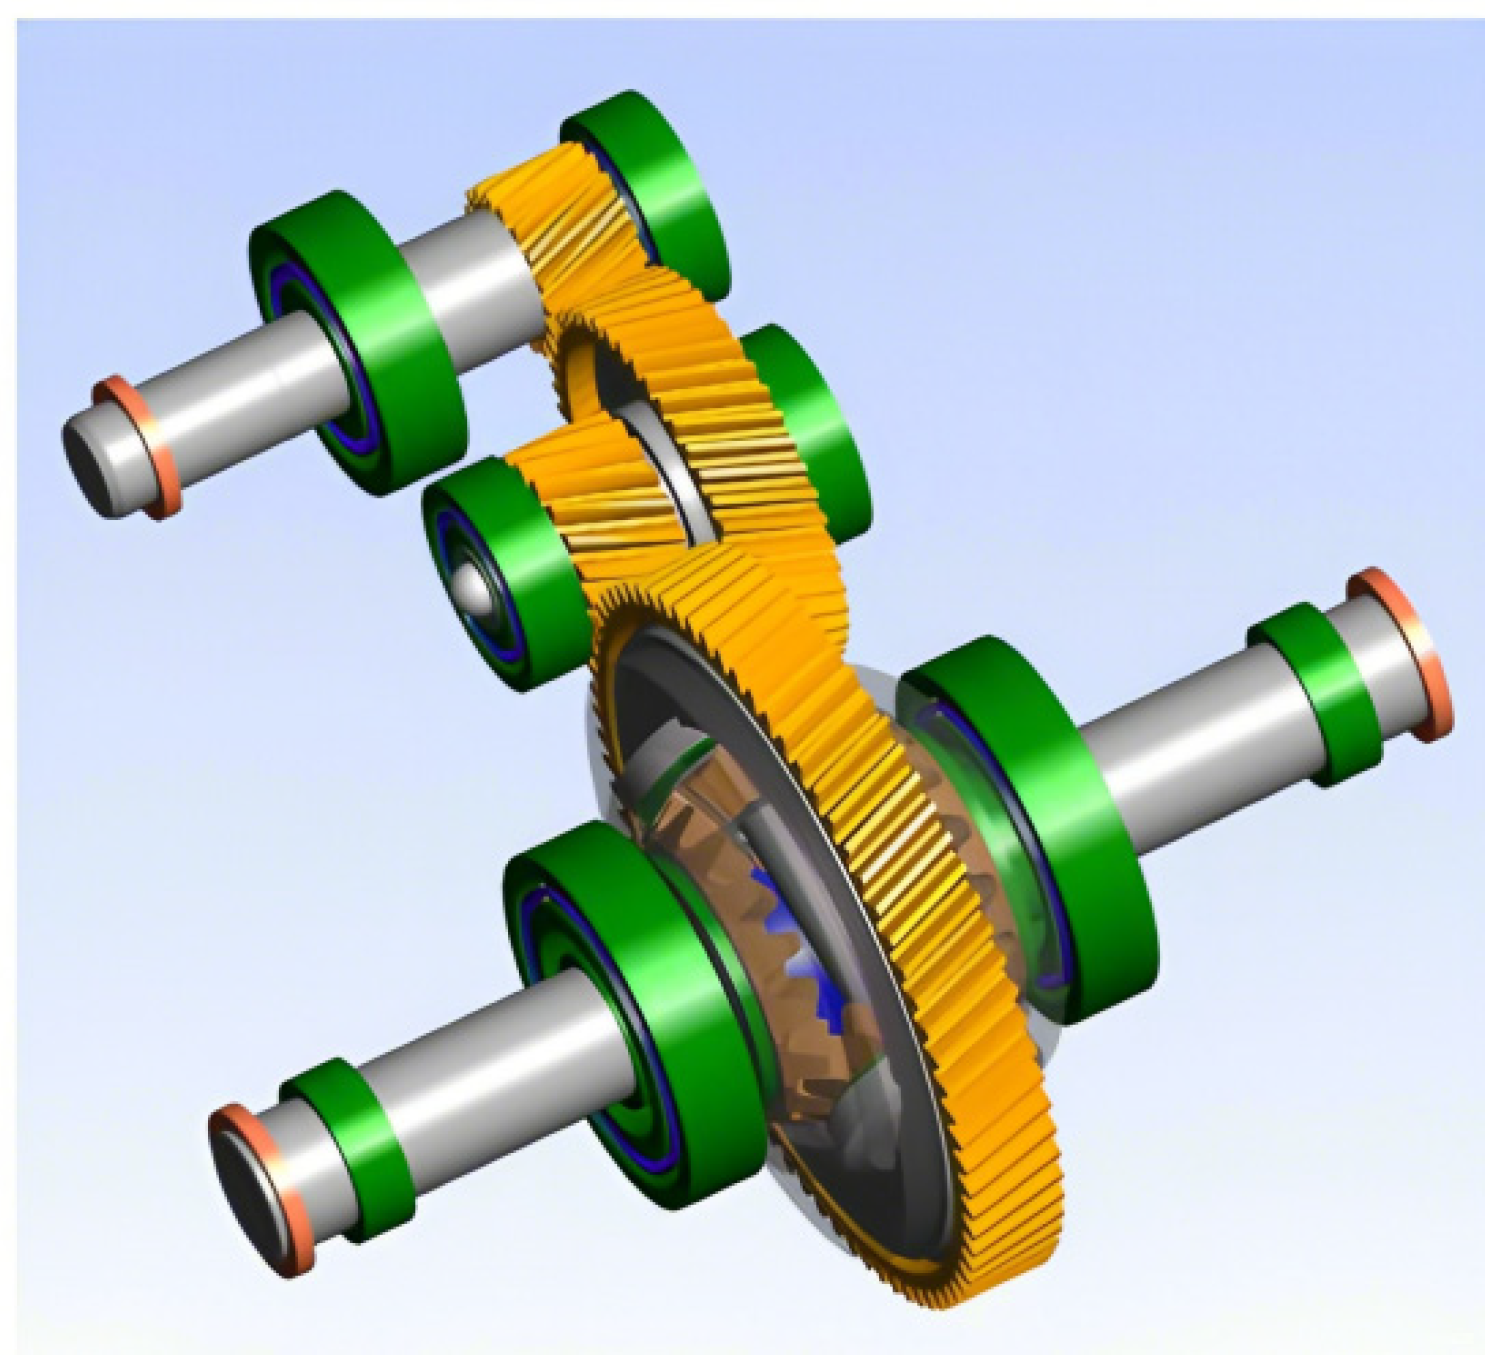
The construction of the internal drive system model for the reducer involves the following major steps: first, determining the geometry and spatial positions of the shafts, which constitute the differential case; next, assembling two sets of matching gear pairs on the shafts; subsequently performing simulated welding of the corresponding large wheel hub and shaft to secure the assembly; then, building the internal drive system of the differential wheel, which includes establishing the planetary gear set and incorporating conceptual bearings; additionally, mounting double-sided SKF bearings; and finally, defining the input power and rotational speed [17]. Figure 7 shows its dynamic model.
Typically, the model’s boundary conditions are defined based on a load spectrum, which is subdivided into real working conditions and bench test scenarios. Various operational states are then aggregated to form the complete load spectrum. Utilizing the ANSYS platform, a dynamic modeling and analysis of the reducer was conducted. Under load conditions, the drive model was operated with a peak torque of 65 Nm and an input speed of 881.5 r/min from the external motor as the load parameters. Based on the referenced force directions established from the aforementioned force schematic, the forces acting on the bearing housings at nodes A through F in all three directions were calculated. The detailed results are presented in Table 4.

3.1.3. The Setting of Shell Boundary Conditions

During analysis, appropriate boundary conditions must be applied to the research subject based on the external environment encountered during operation.
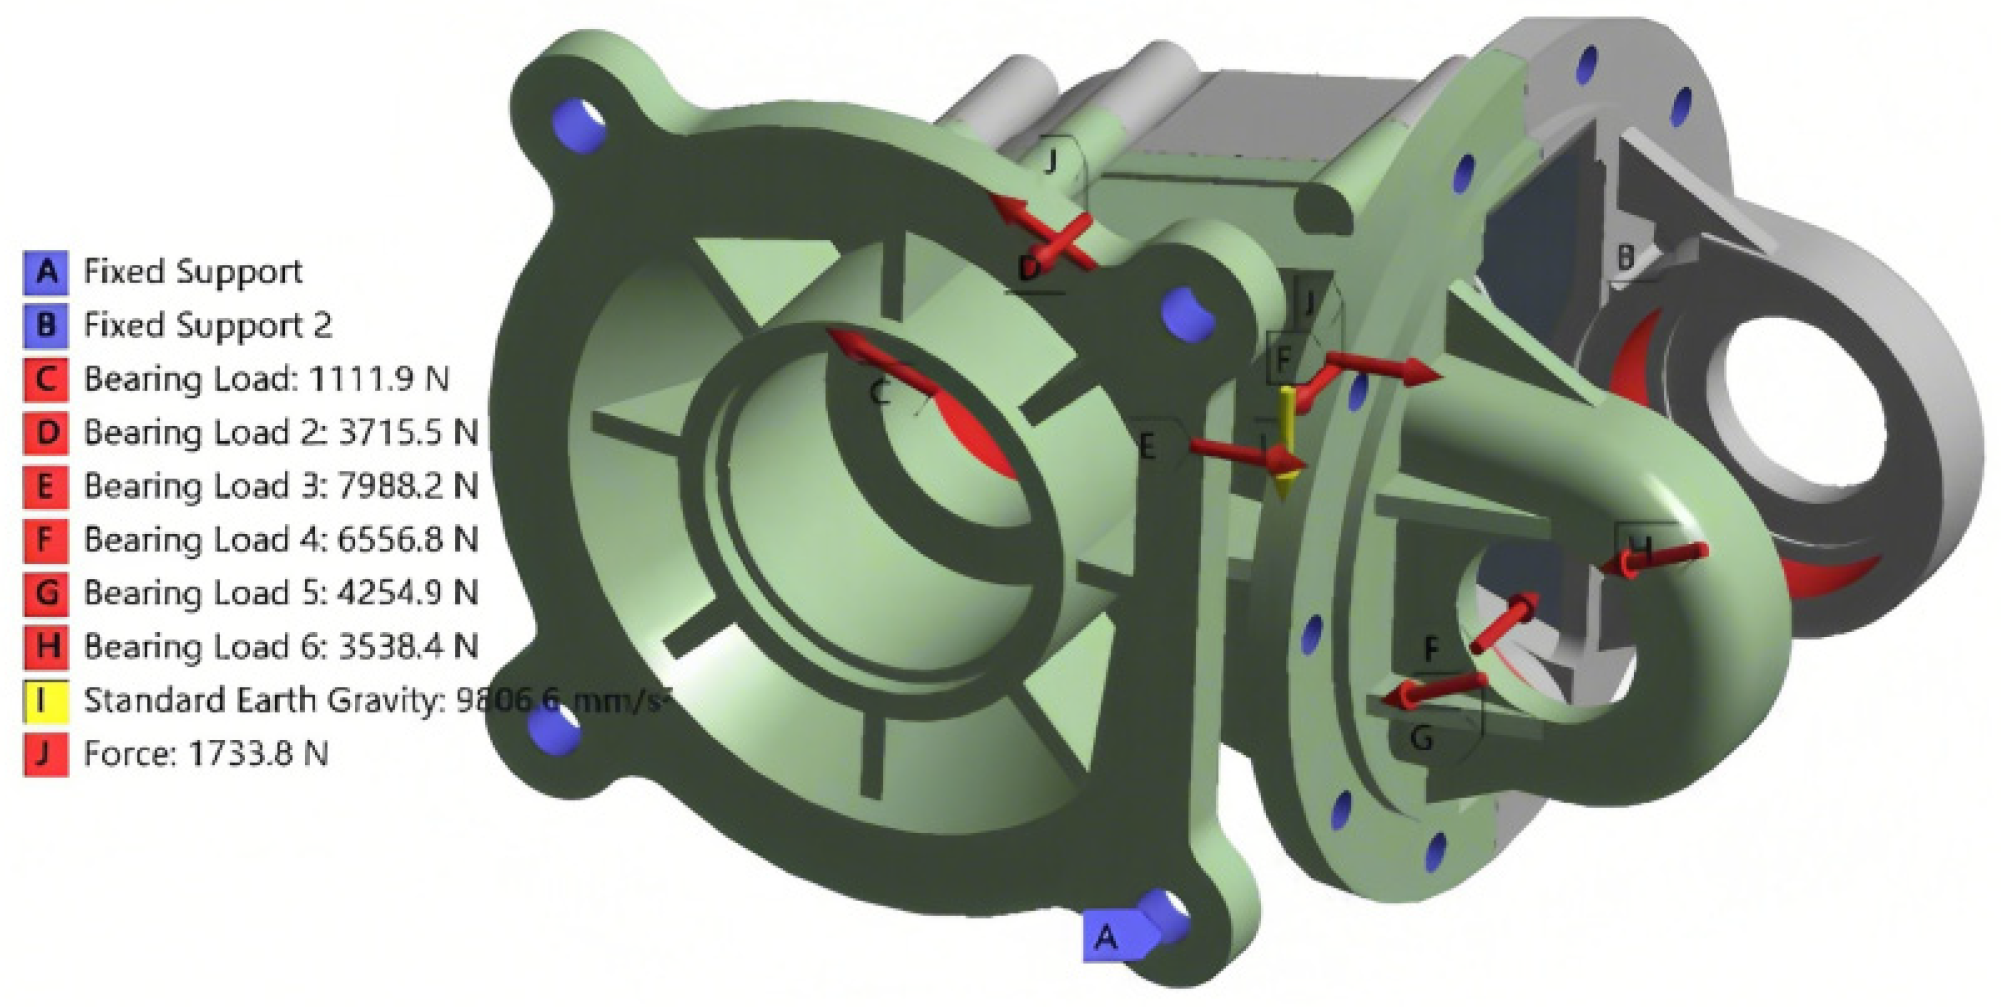
In directions A to F, the axial force comprises the resultant force FR in the Y and Z directions, whereas the force in the X direction is FX. Since the bearings at points A to F in the reducer are deep groove ball bearings, they are capable of withstanding a certain magnitude of axial load. These forces are transmitted through all the balls within the bearings and are exerted on the end face of the bearing housing rather than acting directly in the axial direction. During bearing operation, only a portion of the balls bear the radial load, and the radial load is distributed along the inner circumference of the bearing housing in the form of a cosine function [18]. The Bearing Load function is used to simulate the radial force applied to the inner cylindrical surface of the supporting block. After the load application and constraints are implemented, the appearance of the housing is shown in Figure 8.

3.1.4. Evaluation of the Static Analysis Results of the Shell

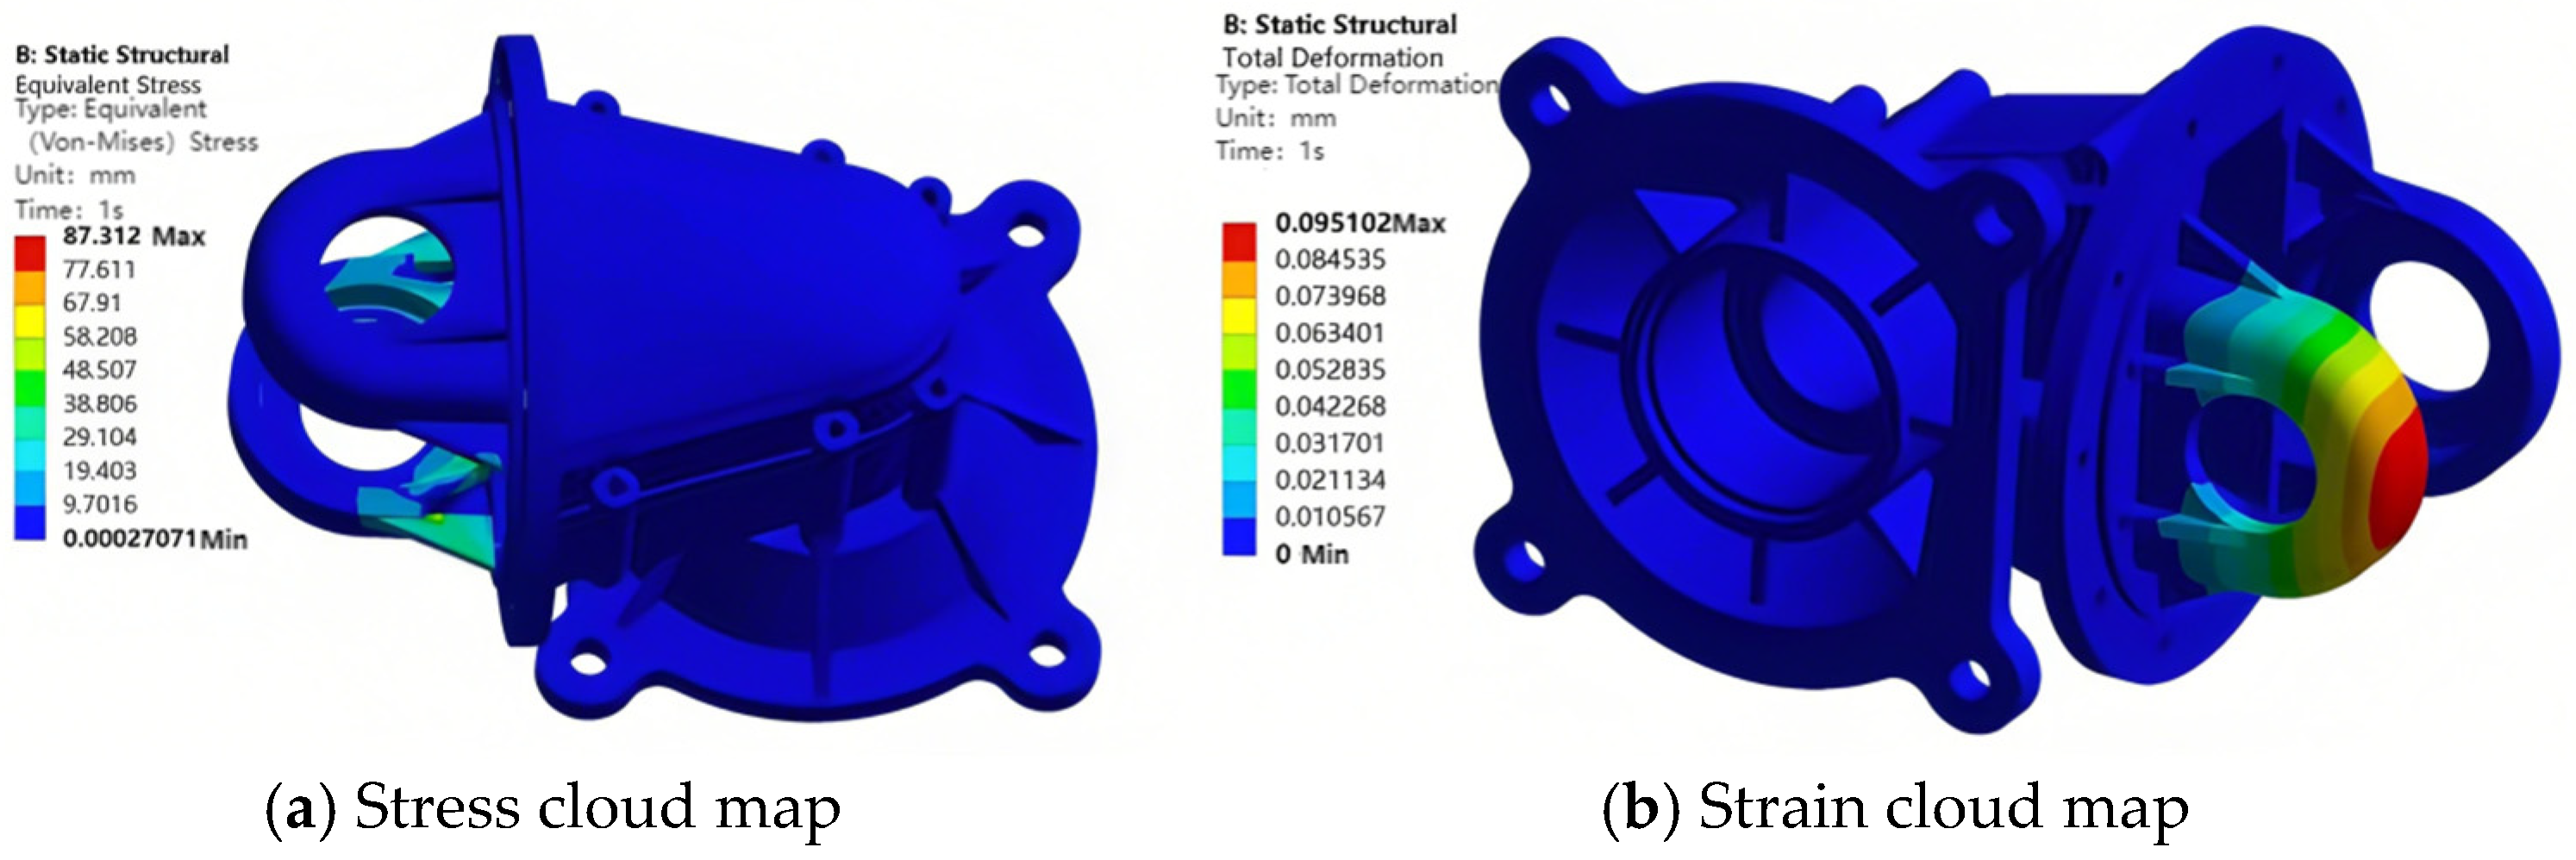
A static simulation was performed on the housing to obtain the stress and strain values of the initial housing under the peak torque conditions. The specific results are shown in Figure 9.
The housing is made of plastic aluminum alloy ADC12, which has been verified by four strength theories. Its yield strength can reach 170 MPa, and the allowable stress for the material is 100 MPa. When examining the initial strain contour of the housing, it can be observed that the maximum stress experienced by the housing is 87.312 MPa. This stress value occurs at the output shaft E and is lower than the maximum yield limit of the material, thus meeting the allowable stress requirement for the housing. the maximum deformation of the drive axle housing should not exceed 1.5 mm/m. From the initial strain contour of the housing, it is observed that the maximum deformation of the housing is 0.095 mm. The reducer mentioned in this study is designed for a wheel track of 1310 mm, and the calculated result indicates that the maximum deformation of the reducer housing is 0.072 mm. This value complies with the structural performance requirements.

3.2. Shell Constraint Mode Analysis

There are numerous transmission components inside the reducer, which are subjected to both internal and external excitations during operation. These excitations, such as road surface spectral excitation, internal gear rotation excitation, and gear meshing impact excitation, generate various types of vibration and noise within the housing. In the design process, it is essential to ensure that the natural frequencies of the housing maintain appropriate separation from the aforementioned excitation frequencies [19] in order to avoid resonance and prevent potential structural damage.

3.2.1. Modal Analysis Theory and Process

(1)
Modal Analysis Theory
Based on this situation, a novel non-linear dynamic system response analysis method has been developed in this study. This approach utilizes finite element techniques for numerical simulation to determine the natural frequencies and modal shapes of each order in the system, thus laying a theoretical foundation for the subsequent dynamic response analysis. Under the condition that the structural mass and stiffness remain unchanged, the differential equation for forced vibration can be expressed as follows:
M x | C x + C ( t ) + K x = F ( t )
where [M] denotes the system mass matrix, [C] represents the system damping matrix, and [K] is the system stiffness matrix. {x(t)} and {x(t)} correspond to the system’s displacement, velocity, and acceleration vectors, respectively. {F(t)} represents the external excitation acting on the system. If damping in the structure is neglected and neither the load nor the displacement varies with time, the equation can be simplified as
M x i + K x i = 0
Both [M] and [K] are non-diagonal matrices, making the solution process relatively complex. In the case of free harmonic vibration, the displacement and acceleration can be expressed as
x i = ϕ i sin ( w i t + θ i )
x i = w i 2 ϕ i sin ( w t + θ i )
where {xi} denotes the displacement vector of the i-th mode and {xi} represents the acceleration vector. Here, ωi refers to the natural frequency of the i-th mode, while Ai gives the amplitude vector at each node corresponding to the i-th mode. θi is the phase angle associated with the i-th mode. Substituting these expressions into the equation yields:
( K w i 2 M ) ϕ i = 0
Considering that in this equation, {φ}i represents the amplitude vector at the corresponding nodes during the structural vibration process, and its values are not zero, it follows that
K w i 2 M = 0
By solving the equations, the system’s n natural frequencies ωi (in Hz) for different modes can be obtained. At the same time, the corresponding mode shapes {φ}i for each order of natural frequency are also determined.
(2)
Modal Analysis Procedure for the Housing
The calculation procedure for the modal analysis of the gearbox housing primarily comprises four stages: pre-processing, constraint setting, solution. During the pre-processing stage, it is necessary to finely construct the model of the gearbox housing and set relevant parameters to ensure the model’s accuracy and completeness. In the constraint setting stage, appropriate boundary conditions for the housing must be determined based on the actual operating conditions so as to simulate its real working state [20]. In the solution stage, specialized algorithms are employed to perform numerical calculations on the model, obtaining relevant modal data. Finally, the post-processing stage involves a thorough analysis and interpretation of the results to extract valuable information, thus providing a strong basis for the design and optimization of the gearbox housing.

3.2.2. Analysis Results of Shell Constraint Mode

In practical applications, the low-order vibration modes of a gearbox are often close to the internal and external boundary frequencies, which makes them more susceptible to resonance with each other. The modal characteristics of the housing are its inherent properties and are closely related to the mass and stiffness of the housing but are independent of external loads. When performing free vibration modal analysis, it is sufficient to consider only the natural frequencies and mode shapes of the structure itself [21], without accounting for the effects of boundary conditions or external loads. In contrast, the constrained vibration modes are determined according to the actual boundary conditions present during operation of the housing, thereby providing a more accurate reflection of practical engineering applications. As shown in Figure 10.
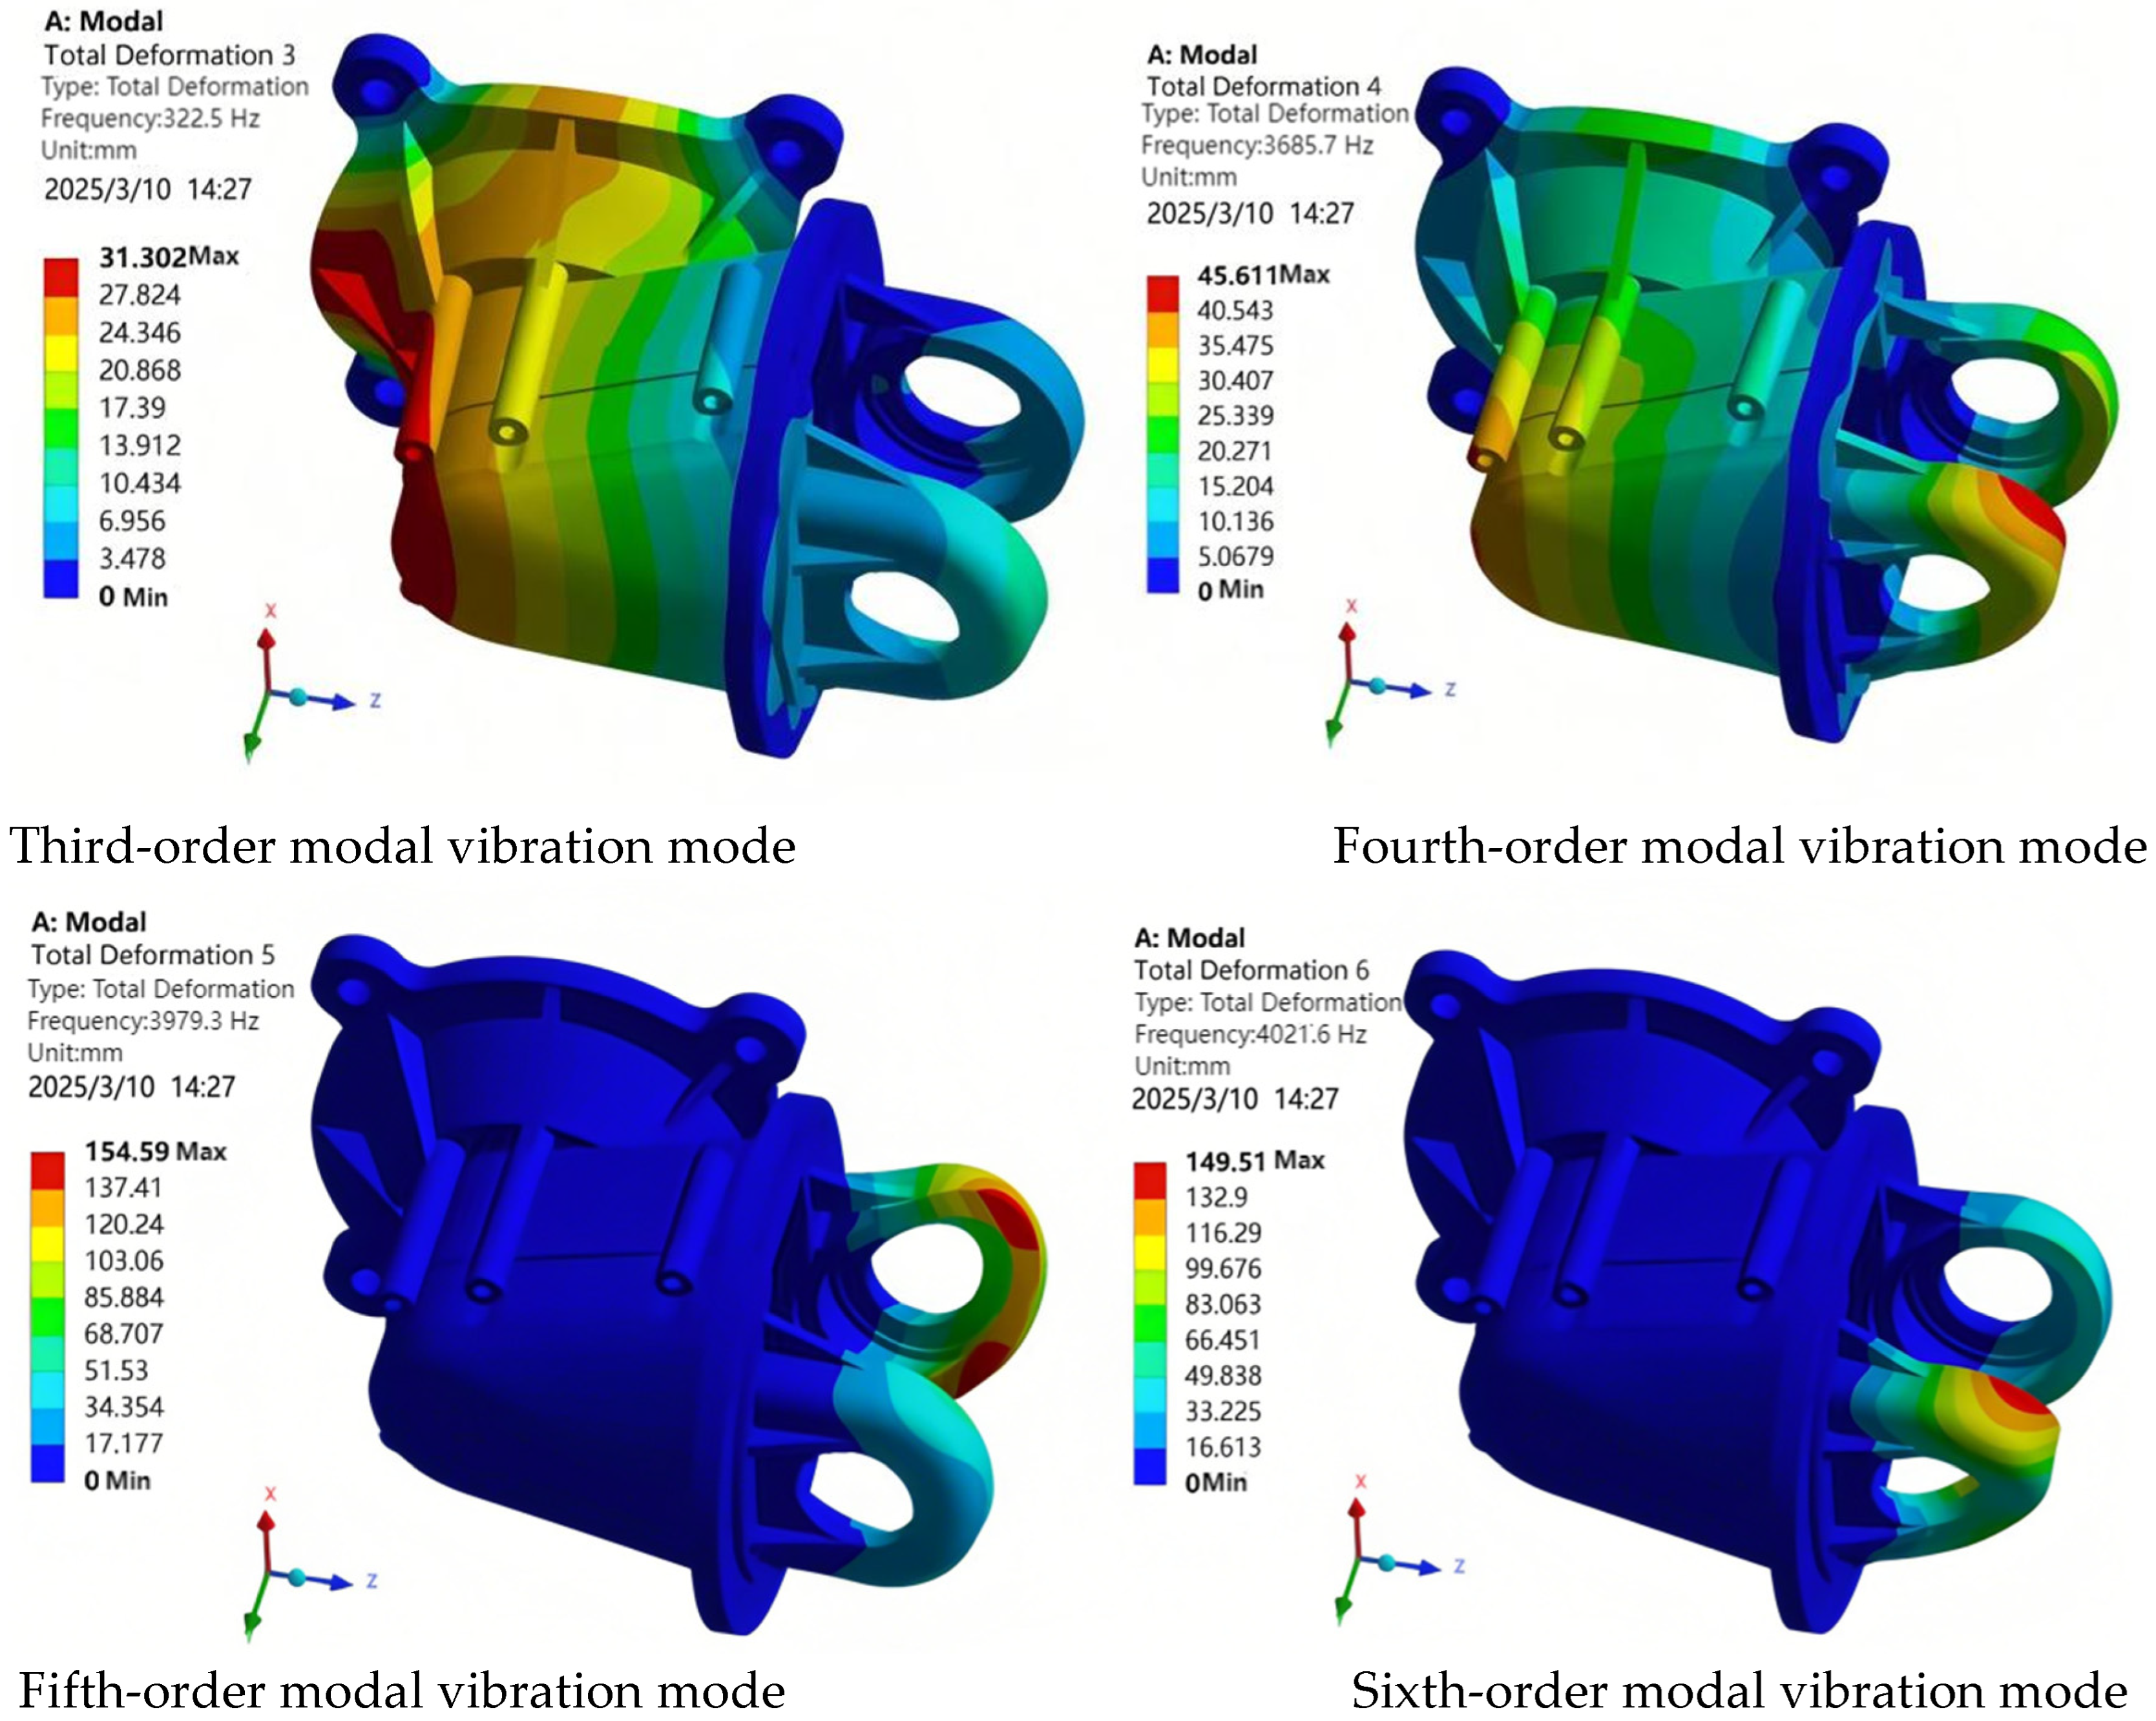
In this study, the first ten constrained modes were calculated using the Lanczos method. Due to space limitations, only the analysis results of the first six vibration modes are presented in this paper, as shown in Figure 11. The corresponding natural frequencies are detailed in Table 5.

3.2.3. Evaluation of Shell Constraint Modal Analysis Results

Under the influence of external excitations, the gearbox housing may experience resonant noise. These excitations include various sources, such as excitation generated by motor operation, excitation induced by the road spectrum, excitation produced during the rotation of the internal gear shaft, as well as excitations resulting from gear meshing and impact [22].
(1)
Excitation Frequency of Internal Gear Shaft Self-Rotation, fx:
For small vehicles, the typical speed range during normal driving is v = 20–45 km/h. The compatible tire model is 155/65/R13, with a radius of r = 259.35 mm. The transmission ratio between the gearbox input shaft and the intermediate shaft, i1, i2, is 4.05, and the transmission ratio between the intermediate shaft and output shaft, i2, i3, is 2.55.
The rotational speed of the output shaft n3 can be calculated as follows:
n 3 = v 2 π r
where n denotes the rotational speed (in r/min) and v represents the vehicle speed (in km/h).
The transmission ratios between two adjacent shafts, ix and ix+1, and the corresponding shaft speeds, nx and nx+1, are related by the following equation:
i x , x + 1 = n x n x + 1
The rotational frequency fx of each shaft inside the reduction gearbox
f x = n x 60
is found to range from 3.38 Hz to 79.50 Hz.
(2)
Motor shaft rotational excitation frequency fn
According to the relevant parameters of the drive motor shown in Table 5, the motor excitation frequency is fn = 102 Hz.
(3)
Gear meshing frequency ft
f t = n x z x 60
In the formula, zx represents the number of teeth for each gear. By substituting the numbers of teeth for each helical gear from Table 3 into the calculation, the gear meshing frequency ft is found to range from 246.38 Hz to 1430.30 Hz. According to the above analysis and calculation, the range of internal and external excitation frequencies acting on the reducer housing is 3.38 Hz to 1430.30 Hz, while the frequency range for the first ten modes of the housing is 2480.6 Hz to 5754.1 Hz. Both internal and external excitation frequencies are significantly lower than the low-order natural frequencies of the housing, indicating that during operation, the housing will not resonate with internal or external excitations and thus meets the modal resonance performance requirements.
This paper first provides a brief explanation of the fundamental principles and procedures for the static and modal analysis of the housing. Subsequently, finite element modeling of the housing is carried out using ANSYS software to determine its stress distribution. Then, loads and boundary constraints are applied using Workbench to analyze the static performance of the housing under constrained conditions. The results of the static analysis verify that the structure possesses high strength and stiffness, which provides the possibility for further lightweight structural optimization.

4. Multi-Objective Optimization of Reducer Housing Based on Approximate Model

On this basis, a novel dimensional optimization method is proposed. Currently, when applying structural optimization theory and methods, parameters such as the width of stiffening ribs and wall thickness are often selected based on empirical experience, which introduces a certain degree of arbitrariness. In order to achieve structural light-weighting, it is necessary to further perform parameter optimization on key structural dimensions.

4.1. Optimization Process of Reducer Housing Size

Topology optimization is a commonly used design optimization method. In the initial structural modeling stage, topology optimization can be understood as formulating the optimal design scheme, thereby providing reliable data support for subsequent size and shape optimization [23]. The purpose of topology optimization is to determine the optimal material layout or the most efficient load transfer path within the design space, so as to minimize weight while maximizing the overall structural performance. Depending on the type of structure being analyzed, topology optimization can be categorized into two types: discrete structure topology optimization and continuum structure topology optimization.

4.2. Dimensional Optimization of the Reducer Housing

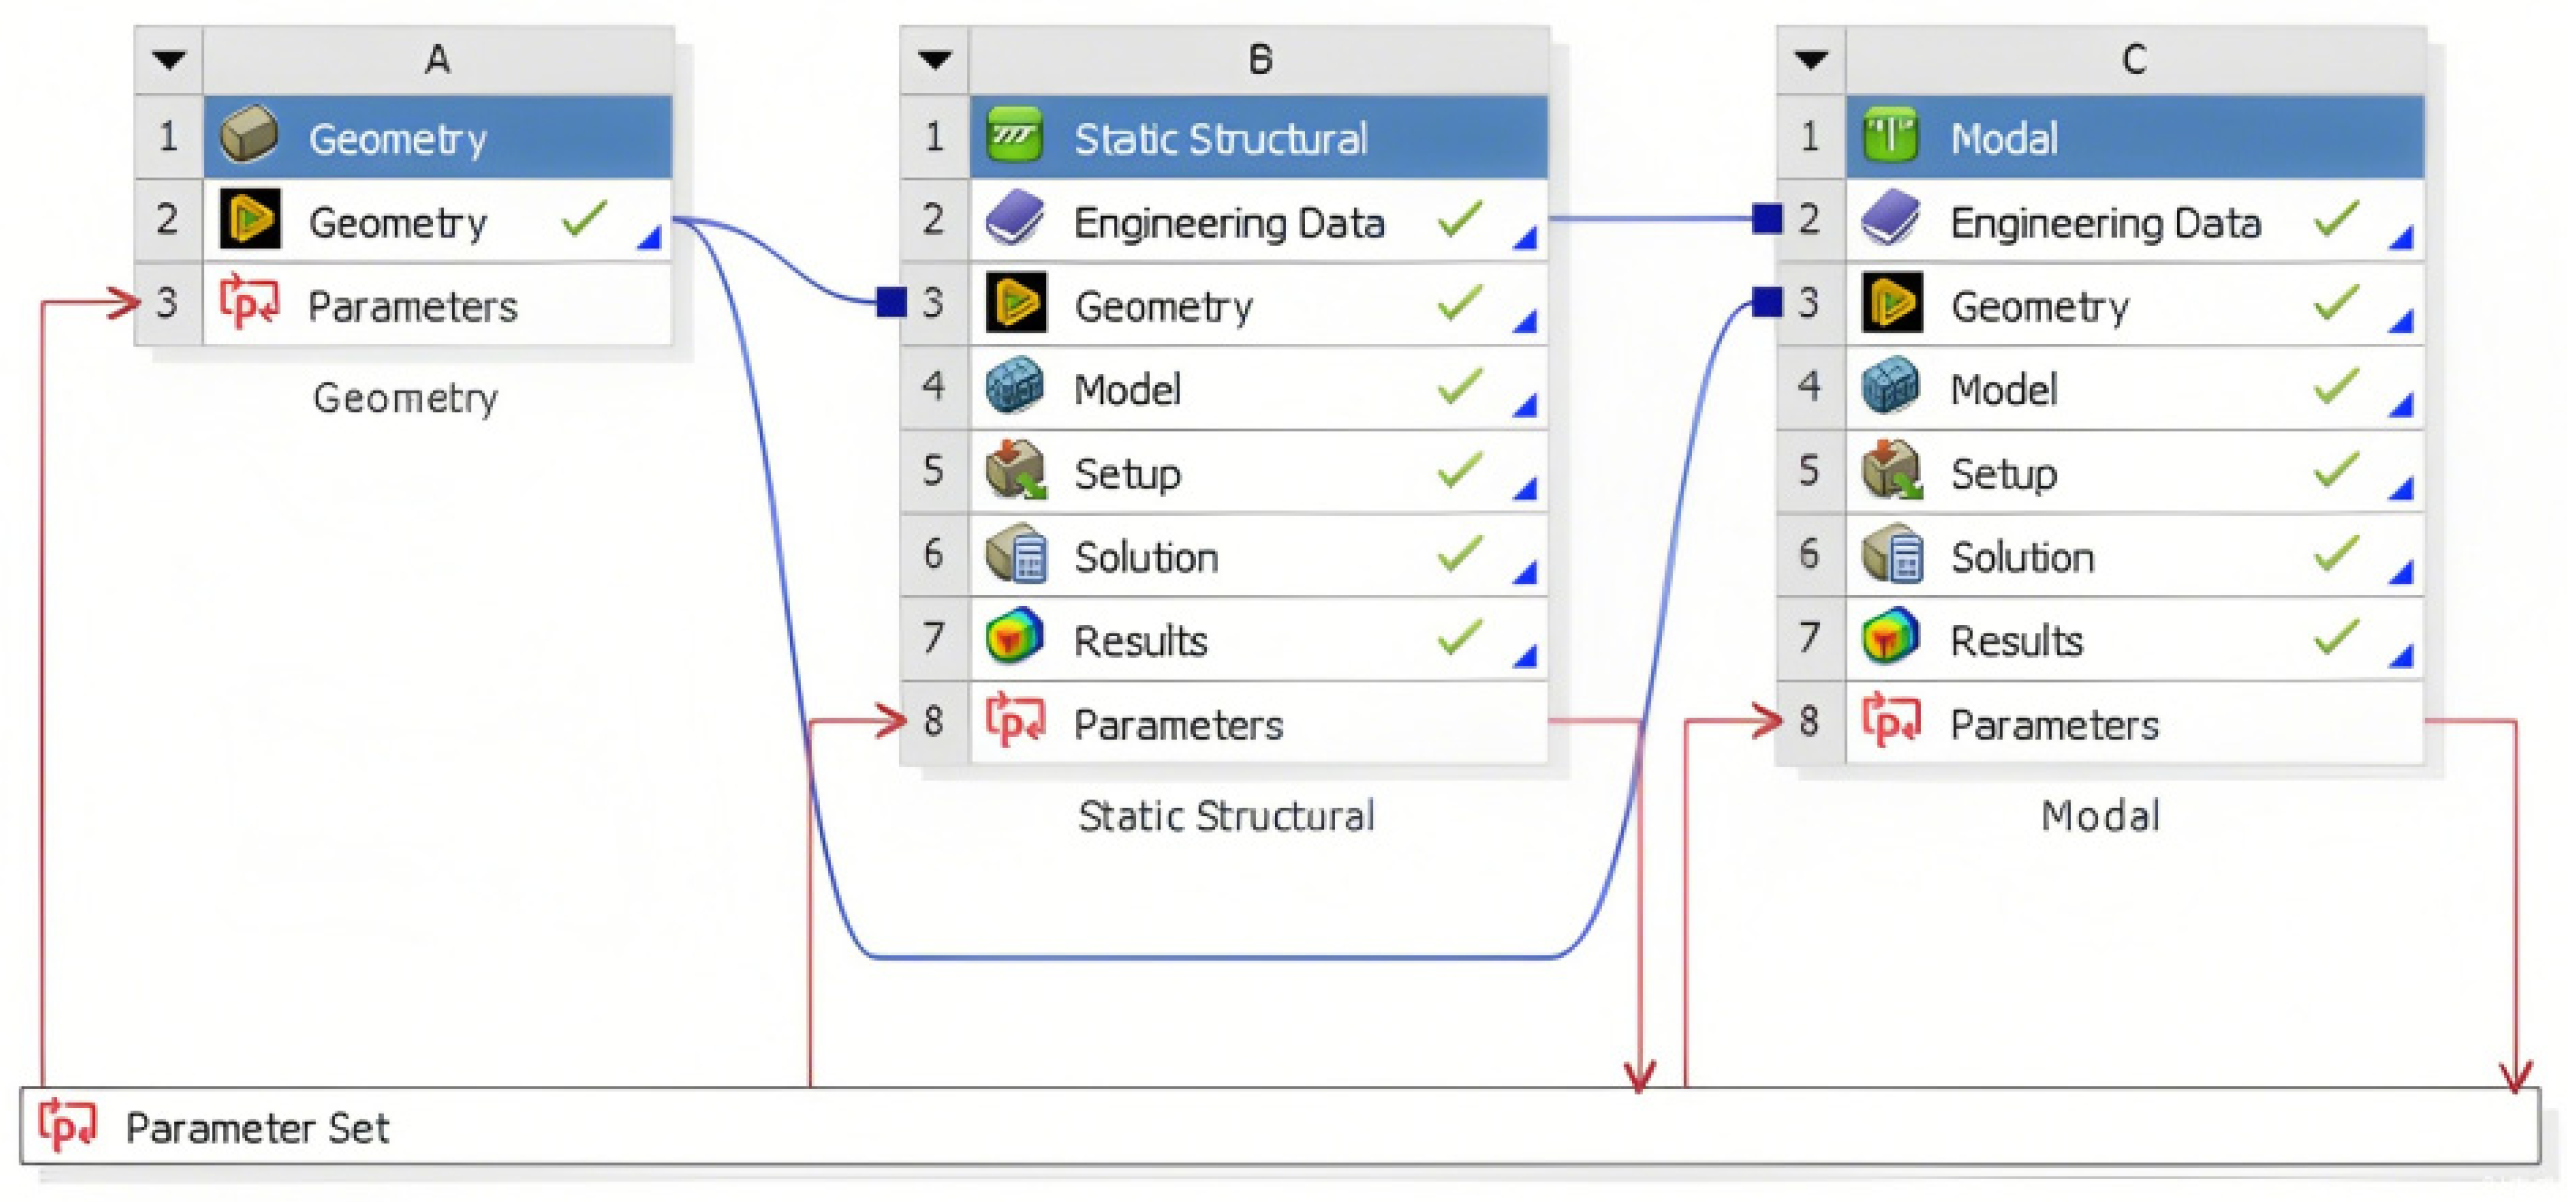
The approach of using the finite element method to conduct static and dynamic analyses constitutes an early step in structural design. The process of three-dimensional solid modeling involves constructing a parametric model structure in Workbench, as illustrated in Figure 12.
Considering that the deformation in the output shaft EF region is primarily influenced by the two rib structures, changes in the housing thickness and other parameters have a relatively minor effect on the deformation in this region. As shown in Figure 13.

4.2.1. Selection of Design Variables

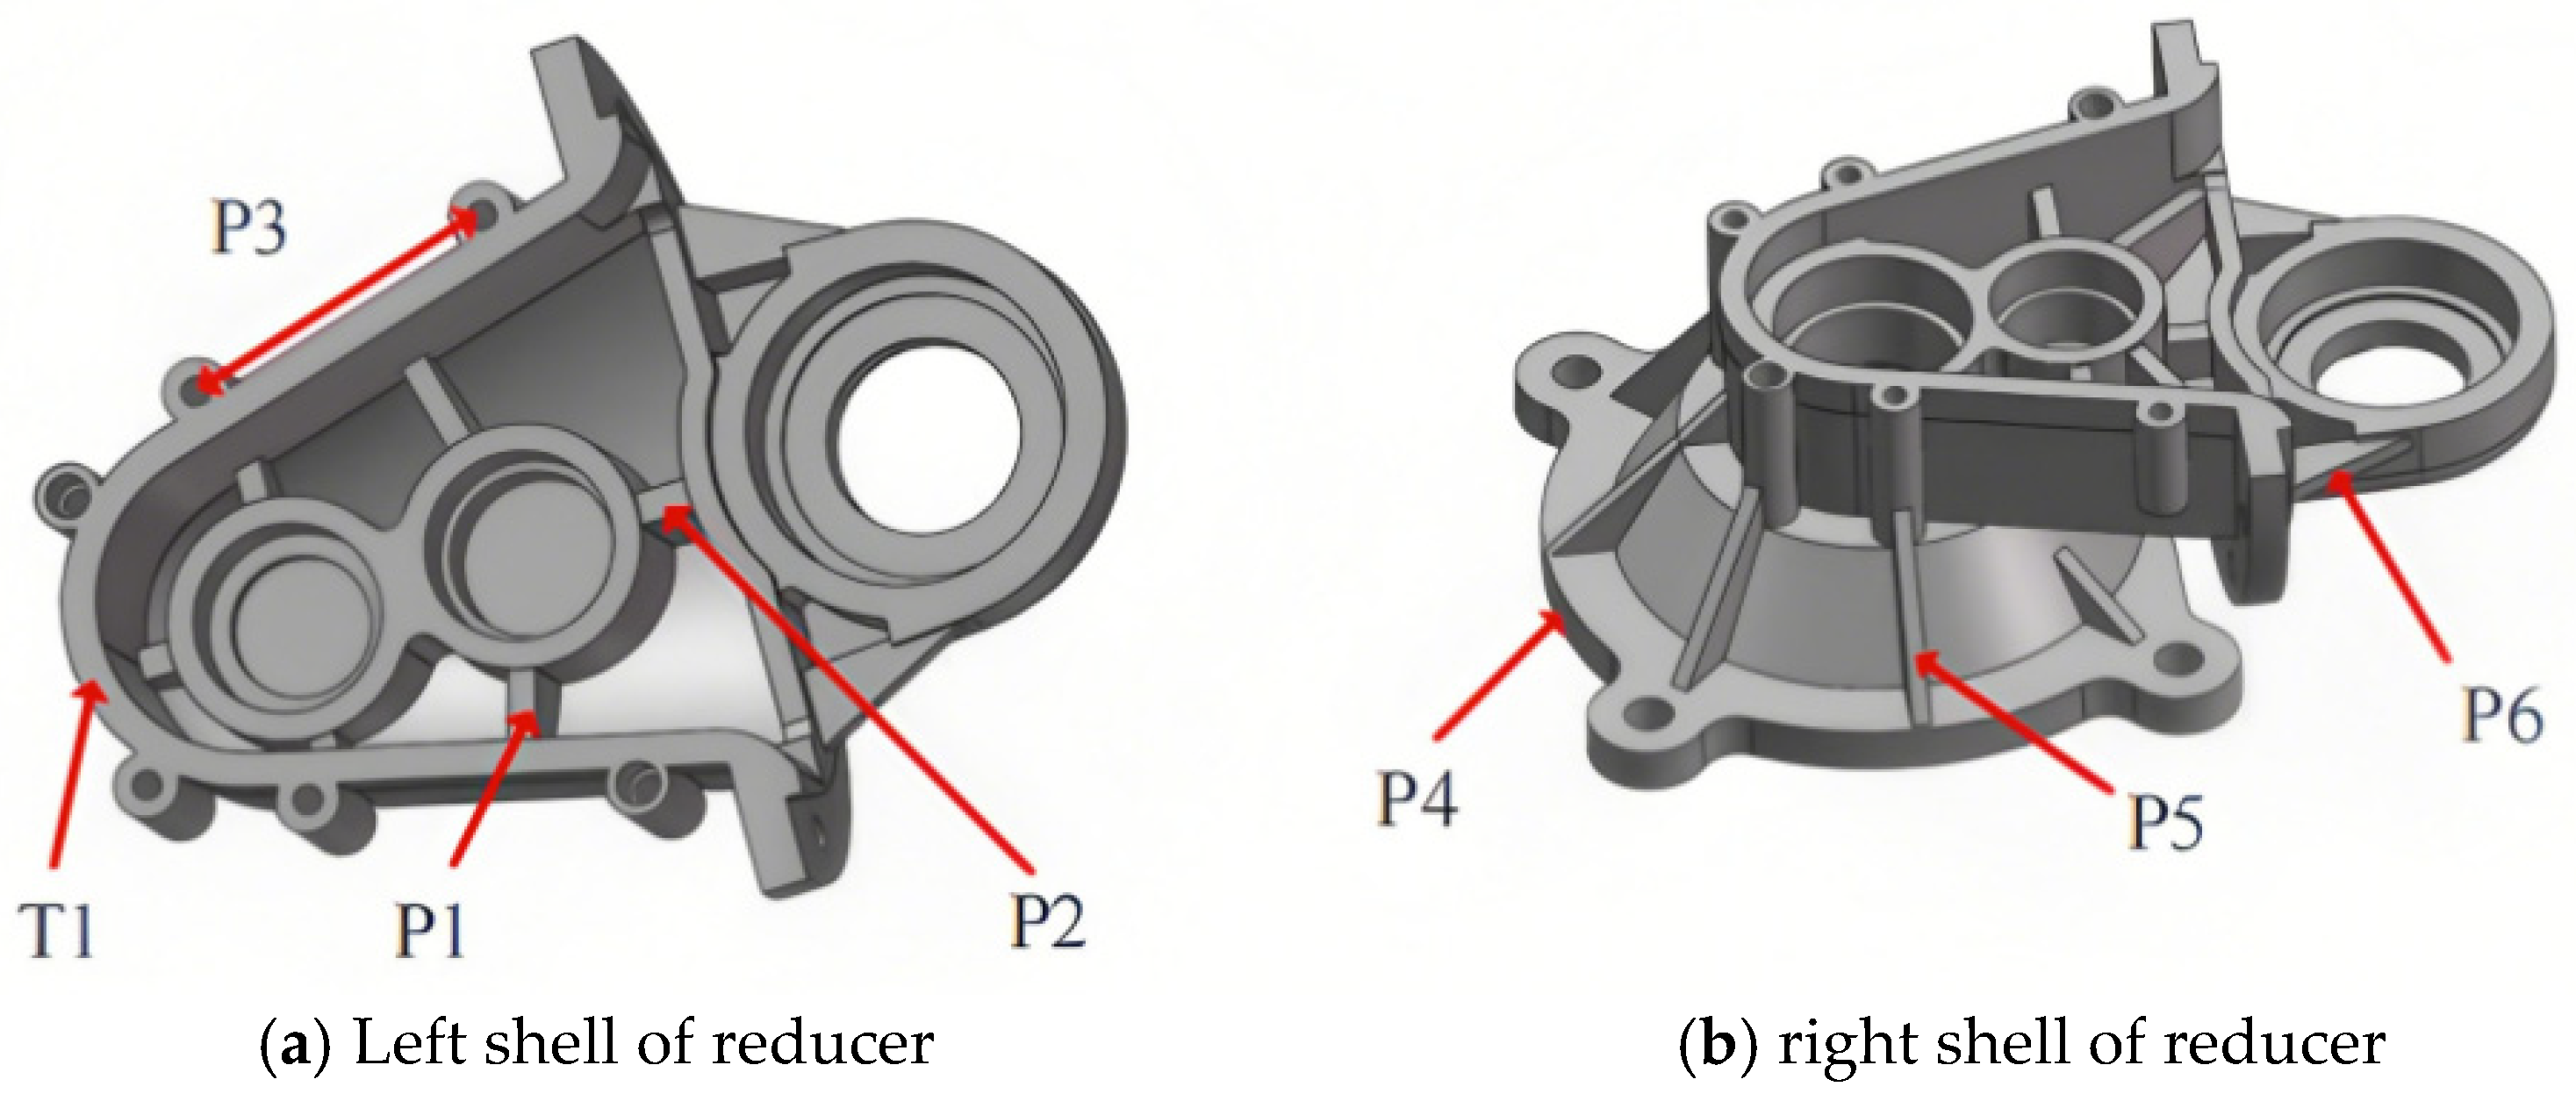
By optimizing the structural design, the layout positions of the ribs near the support seat are determined. In the actual structural design process, there are trade-offs among certain functional requirements of the housing. In order to achieve optimal comprehensive performance of the housing, it is necessary to perform structural optimization to identify the key dimensions. Based on this, this paper proposes a new structural form, in which the structural thickness is taken as the main design parameter and is studied in depth. As shown in Figure 14. The meaning and scope of shell design variables are shown in Table 6.

4.2.2. Experimental Design

Based on the theory of probability and mathematical statistics, experimental design methods can substitute a small number of samples for a large number by reasonably arranging the number of sampling points, thereby allowing limited sampling data to more fully reflect the characteristics of the sample design space. In the field of experimental design, design variables are usually considered as influencing factors, and the state values of each factor are regarded as “levels,” enabling the identification of optimal combinations of variables to meet performance requirements. Common experimental design methods include full factorial design, orthogonal experimental design, and Latin hypercube design.
(1)
Full Factorial Experimental Design
Full factorial experimental design involves analyzing all combinations of variable factors and their respective levels one by one. This method provides comprehensive data support for research and allows an in-depth analysis of the interactions among factors. It is generally suitable for situations with a moderate number of factors and levels. However, as the number of variable factors increases, the required number of tests rises correspondingly, which may result in excessive resource investment and longer testing times. The total number of tests, N, can be calculated using the following formula:
N = X K
(2)
Orthogonal Experimental Design
This project intends to employ the orthogonal experimental design method. In the case of a large number of experiments, this approach utilizes mathematical statistics and the principle of orthogonality to select a set of representative combinations, thereby achieving a uniform and balanced distribution as well as comparable results across experiments.
(3)
Latin Hypercube Experimental Design
The concept of the Latin hypercube sampling (LHS) design was first introduced by M. D. McKay and his colleagues. According to the distribution function and the range of design variables, this method uses an equiprobable stratified sampling technique to generate random samples for each variable. Compared to a full factorial experimental design, this method is more economical in terms of the number of required samples, thereby reducing the time needed for experiments. When compared with the orthogonal experimental design [24], the Latin hypercube sampling design can generate more combinations for the same number of variable samples and can more efficiently represent the characteristics of the entire design space. The shift from orthogonal design to Latin Hypercube Sampling (LHS) in optimization studies is typically driven by trade-offs between space-filling efficiency, computational cost, and adaptability to complex constraints. HS was chosen for its scalability, constraint adaptability, and superior space-filling properties in high-dimensional, non-linear problems. While orthogonal designs excel in controlled, low-dimensional settings, LHS’s flexibility and efficiency make it the default for modern optimization—especially when combined with hybrid strategies. The sampling principles of the three experimental design schemes are illustrated in Figure 15.
In this study, the Latin hypercube experimental design method was adopted to select seven variables, including shell thickness. Thirty-six distinct parameter combinations were carefully chosen, from which the samples with the best performance were obtained. The choice of 36 sample points for Latin Hypercube Sampling (LHS) in building a response surface model (RSM) likely stems from a balance between computational efficiency and statistical robustness. It can avoid overlapping sample points as much as possible in multidimensional space by uniformly selecting samples in each dimension. LHS is commonly used in parameter sensitivity analysis to evaluate the sensitivity of model outputs to parameter changes by generating different parameter combinations through sampling. Detailed results can be found in Table 7.
According to the sampling combinations, the model was updated and solved to obtain output responses in six aspects, including mass. The results are shown in Table 8.

4.2.3. Screening of Design Variables

(1)
Analysis of the Pareto Contribution of Design Variables to Output Responses
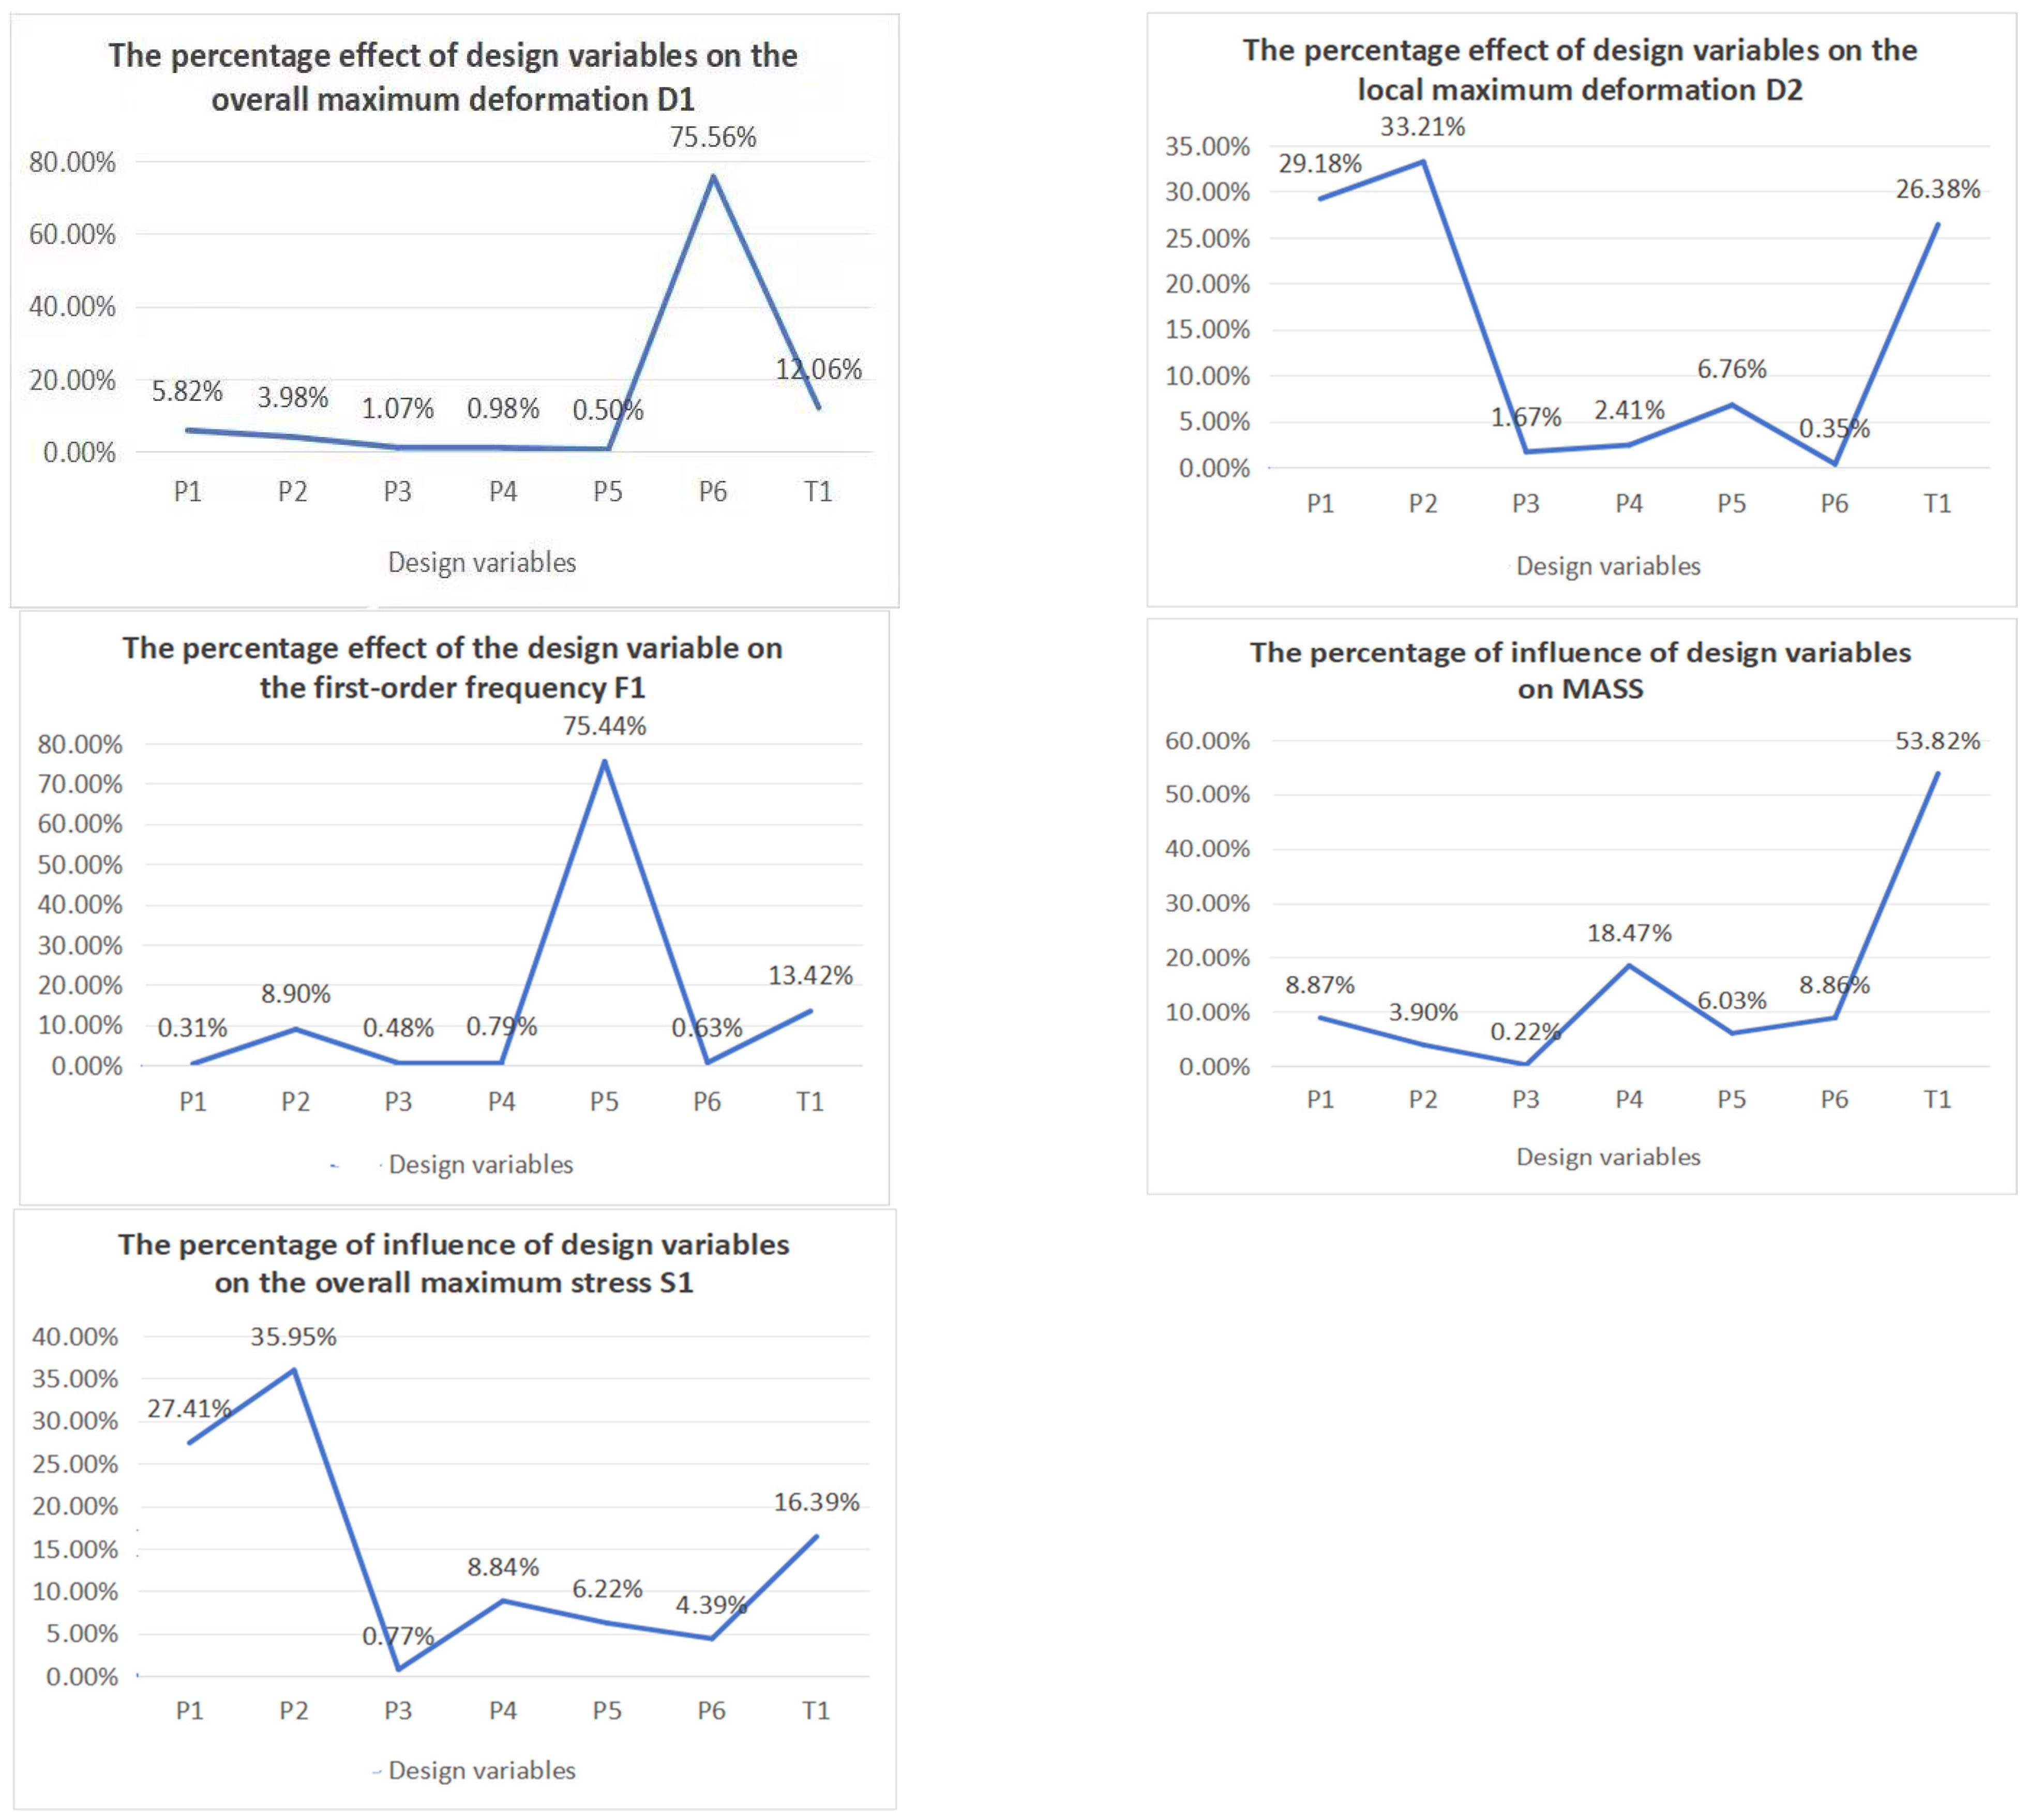
In Isight software (Isight 5.6.1), the application of Pareto curves can be used to observe the proportional influence of each design parameter on the selected output responses. This approach enables the identification of key design variables. In this process, parameters with negative effects are displayed in red, while those with positive effects are shown in blue. Detailed results are presented in Figure 16.
Based on the analysis results shown in Figure 16, it is evident that the widths of the two ribs on the output shaft have a significant influence on the overall deformation of the housing, with a Pareto contribution value as high as 75.56%. This indicates that increasing the width of the left and right ribs of the housing can effectively enhance its overall stiffness. Further examination of Figure 16 reveals that the width of the bearing seat shaft stiffener (P2), the width of the ribs on both sides of the bearing seat (P1), and the wall thickness of the housing (T1) are important factors affecting local deformation of the housing. The Pareto contribution values of P2 and P1 are 33.21% and 29.18%, respectively, both exhibiting a negative trend. This suggests that adjusting these parameters can improve the local stiffness of the housing. Figure 16 also shows that the flange rib width (P5) has a positive effect on the first-order natural frequency of the housing, with a Pareto contribution value of 75.44%, indicating that increasing the flange rib width can significantly enhance the first-order natural frequency. In addition, Figure 16 demonstrates that the wall thickness of the housing (T1) has a considerable impact on the mass, with a Pareto contribution value of 53.82%. This shows that increasing the housing wall thickness can effectively increase the weight of the housing. Finally, Figure 16 indicates that the width of the bearing seat shaft stiffener (P2), the rib width on both sides of the bearing seat (P1), and the wall thickness of the housing (T1) have significant negative effects on the maximum stress of the entire housing, with Pareto contribution values of 35.95%, 27.41%, and 16.39%, respectively. This suggests that appropriately increasing these variables can improve the overall strength of the housing.
The optimized reducer housing achieves better lubrication of the reducer assembly by reasonably arranging internal stiffeners, enabling the gear oil stirred by the high-speed rotation of the differential gears to adequately lubricate the assembly. Specifically, under both high-speed and low-speed conditions, the simulation analysis shows that the output shaft, intermediate shaft, differential bearings, and gears of the transmission assembly are fully immersed in gear oil, meeting the requirement for sufficient lubrication of gears and bearings under complex operating conditions [3]. This reduces failures such as bearing scoring or ablation of the transmission and differential due to insufficient lubrication, thus improving the stability and reliability of the transmission assembly under complex conditions.
(2)
Analysis of Interaction Effects between Partial Design Variables on Output Responses
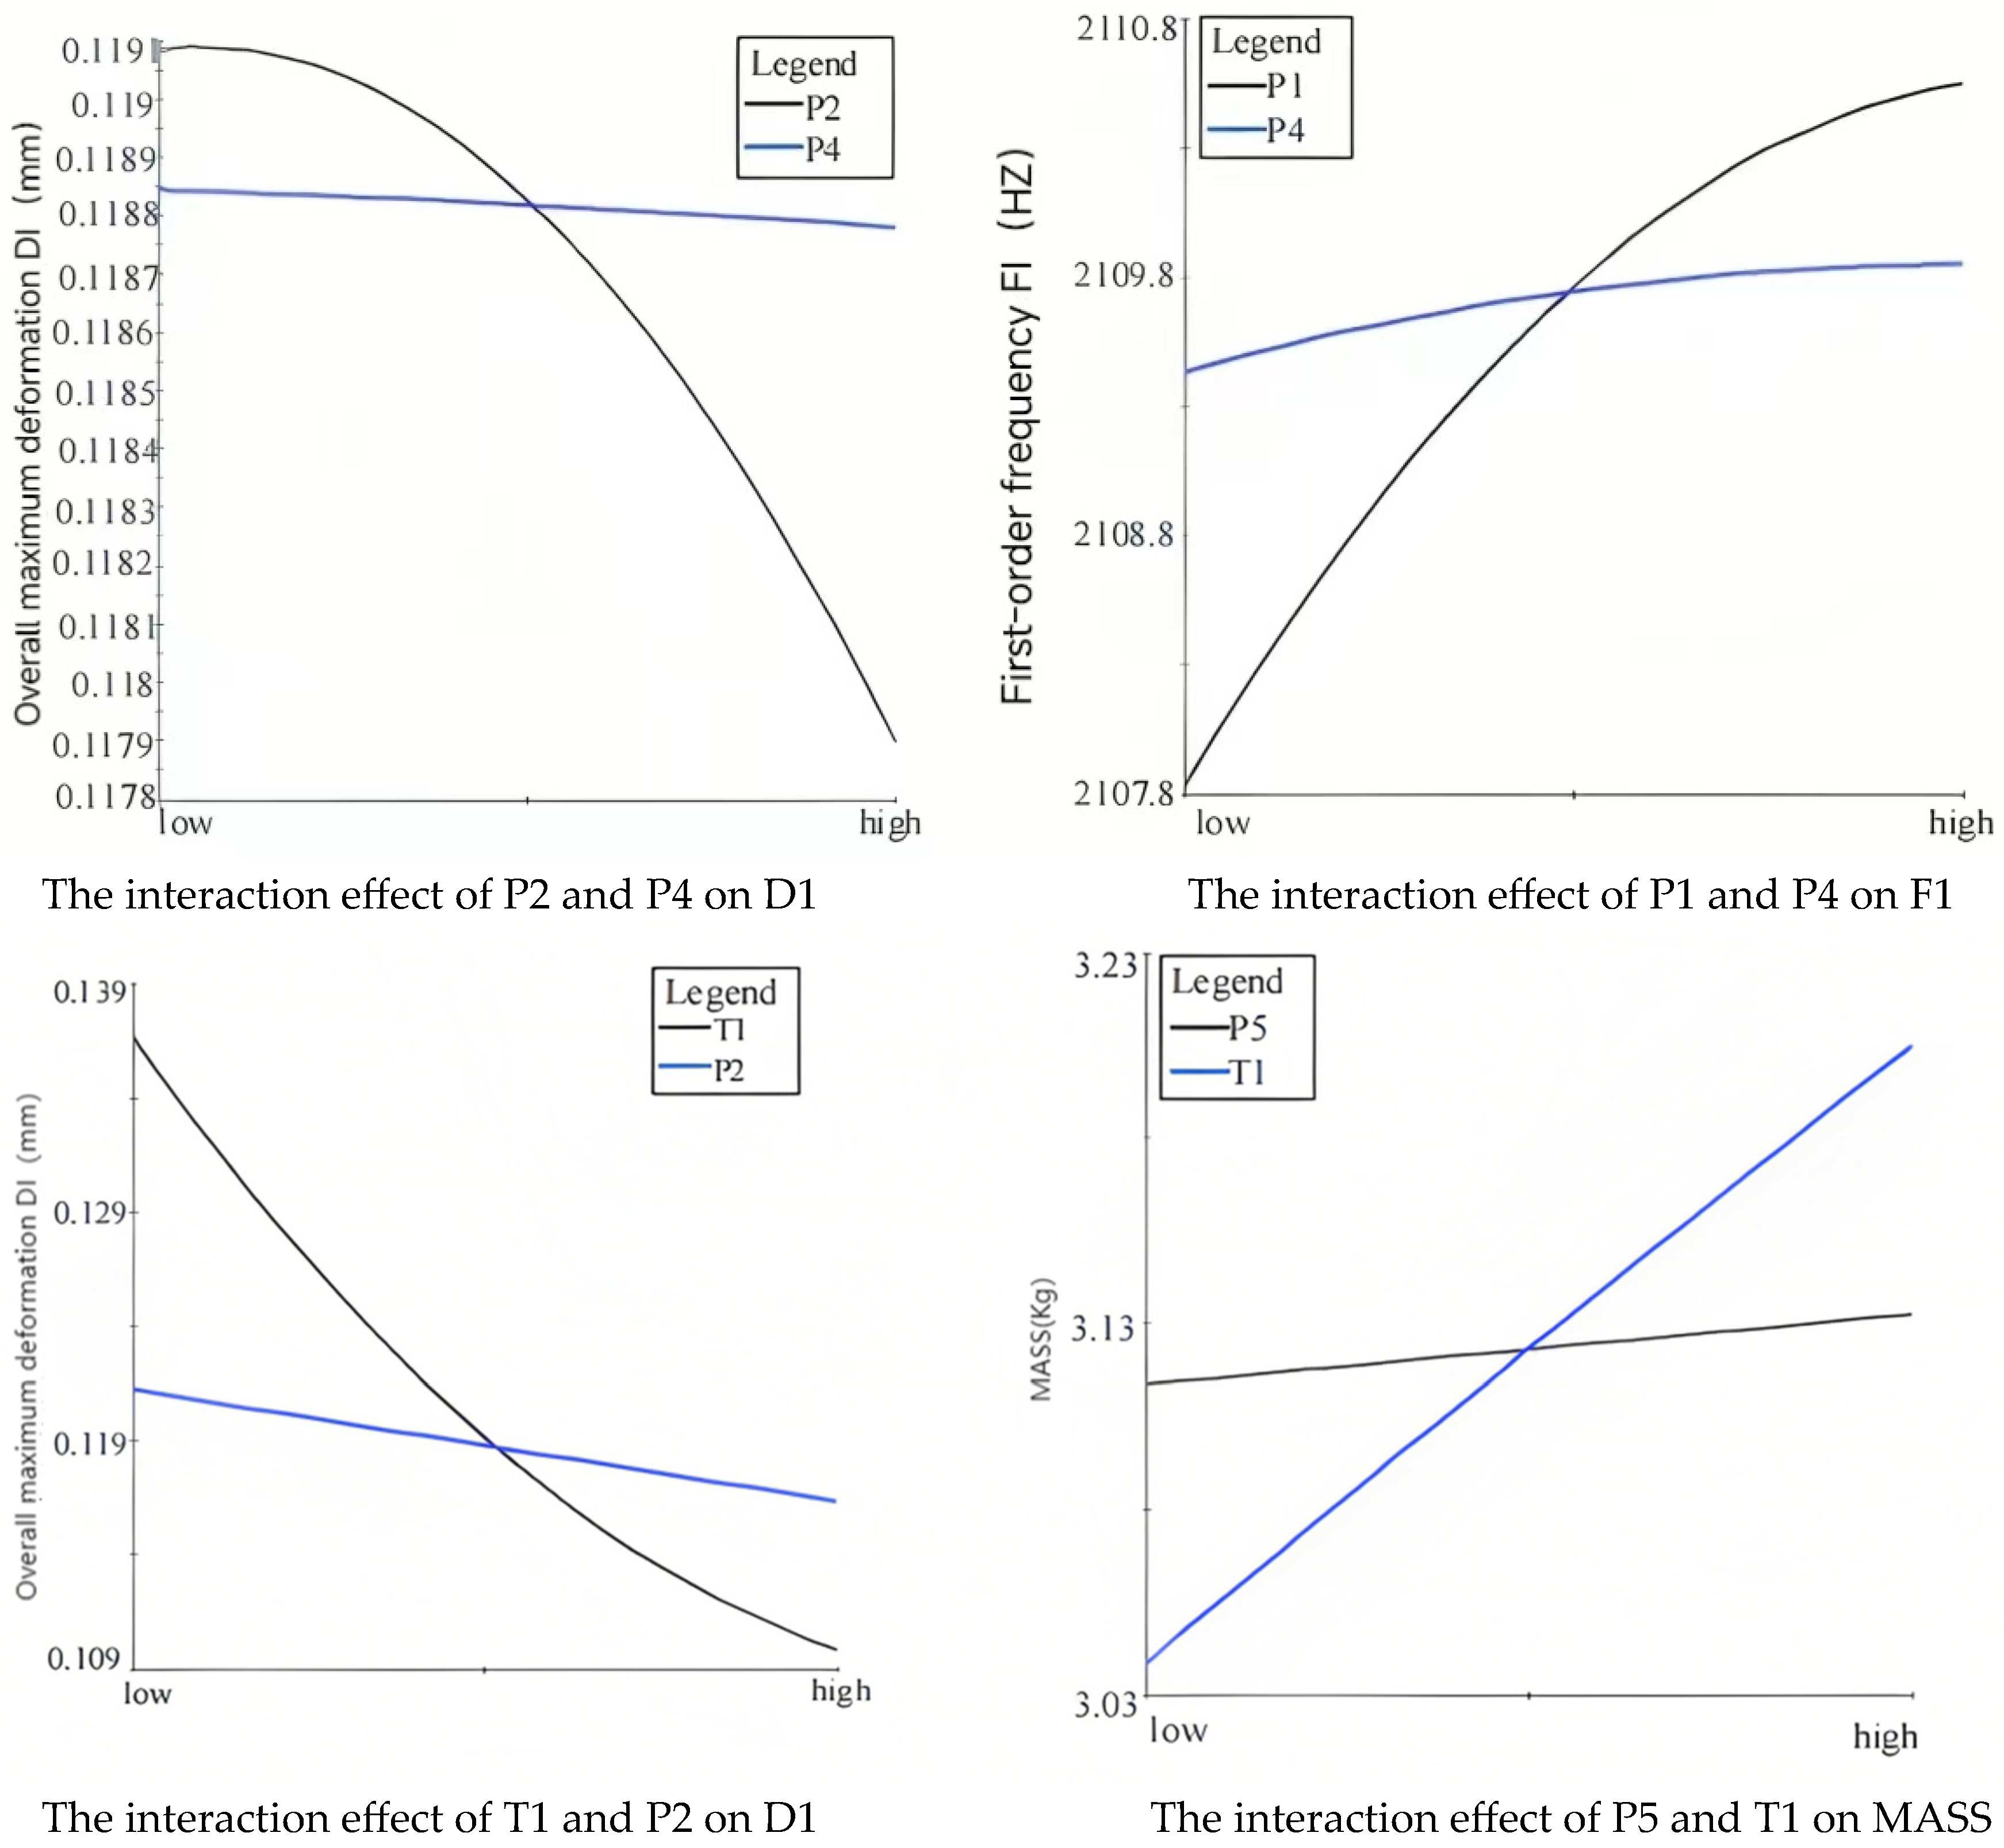
In this study, several design variables were selected for a comprehensive analysis to reveal the interactions between variables, as shown in Figure 17. The curves in the figure present a paired pattern, indicating that the output responses are a result of the interaction between multiple factors. Therefore, it is necessary to employ optimal algorithms to replace the traditional one-variable-at-a-time approach.
There are interactions among the various parameters, making housing structure optimization a complex problem that involves multi-factor interactions. The selected variables will have varying degrees of influence on specific performance aspects of the housing. Therefore, all variables should be incorporated into the subsequent optimization process.

4.2.4. Establishment of the Approximate Model of the Shell Response Surface

(1)
Surrogate Model Methods
For complex engineering and scientific problems such as structural lightweighting, which involve multiple variables and multi-objective responses, a significant amount of human and material resources is often required to build accurate models that closely match real-world conditions. In a surrogate model, the relationship between input parameters and output responses can be described as follows:
y ( x ) = y ( x ) + ε
In this study, y represents the actual value of the output response, while y represents the estimated value of the output response. The error ε is defined as the deviation between the actual and the estimated output response values, and it is generally assumed to follow a normal distribution. Here, x denotes the design variables. Currently, methods such as Kriging, Support Vector Machines (SVMs), and polynomial response surface methods are widely used in related fields. When the response relationships are complex, the response surface methodology can achieve more accurate fitting based on different regression models, thus demonstrating high practical value. However, in higher-order polynomial models, the polynomial order of the response surface is typically limited to first- or second-order due to the increased number of design variables and the multiple inflection points of the fitting curves. The mathematical expressions for first-order and second-order response surfaces are as follows:
y ~ ( x ) = a 0 + i = 1 p a i x i
y ~ ( x ) = a 0 + i = l p a i x i + i = l p a i x i 2 + l i j p p a i j x i x j
In the above equations, α0, αi, and αij are polynomial coefficients and p denotes the number of design variables.
(2)
Error Analysis of Shell Response Surface Surrogate Models
The accuracy verification methods for the constructed response surface surrogate models can be classified into two categories: global and local methods. Among these verification approaches, two criteria are commonly used to evaluate the overall accuracy: the root mean square error (RMSE) and the coefficient of determination R2, with R2 values closer to 1 indicating better model fit. Their mathematical expressions are as follows:
R M S E = i = l n ( y i y i ^ ) 2 n
R 2 = l i = 1 n ( y i y ^ i ) 2 i = 1 n ( y i y ^ i ) 2
In this context, y denotes the true response value of the i-th sample point, while yi represents the response value predicted by the surrogate model for the corresponding sample point. The variable n refers to the total number of samples. The number of samples is generally determined by adopting an R2 value approaching 1 as the standard for assessing global fitting accuracy. The coefficient of determination R2 directly reflects the overall predictive capability of a surrogate model, with its value ranging from 0 to 1. When R2 is close to 1, the constructed surrogate model exhibits a high degree of conformity with actual data. Although the root mean square error (RMSE) can be used to evaluate model accuracy based on its magnitude, it is greatly affected by the amplitude of the specific problem and is thus less intuitive than R2 [18]. For local accuracy evaluation of the surrogate model, the maximum absolute error (MAE) is adopted as the criterion; when the MAE is small, the surrogate model demonstrates high local accuracy. The detailed definitions are as follows:
M A E = max y i y i ^
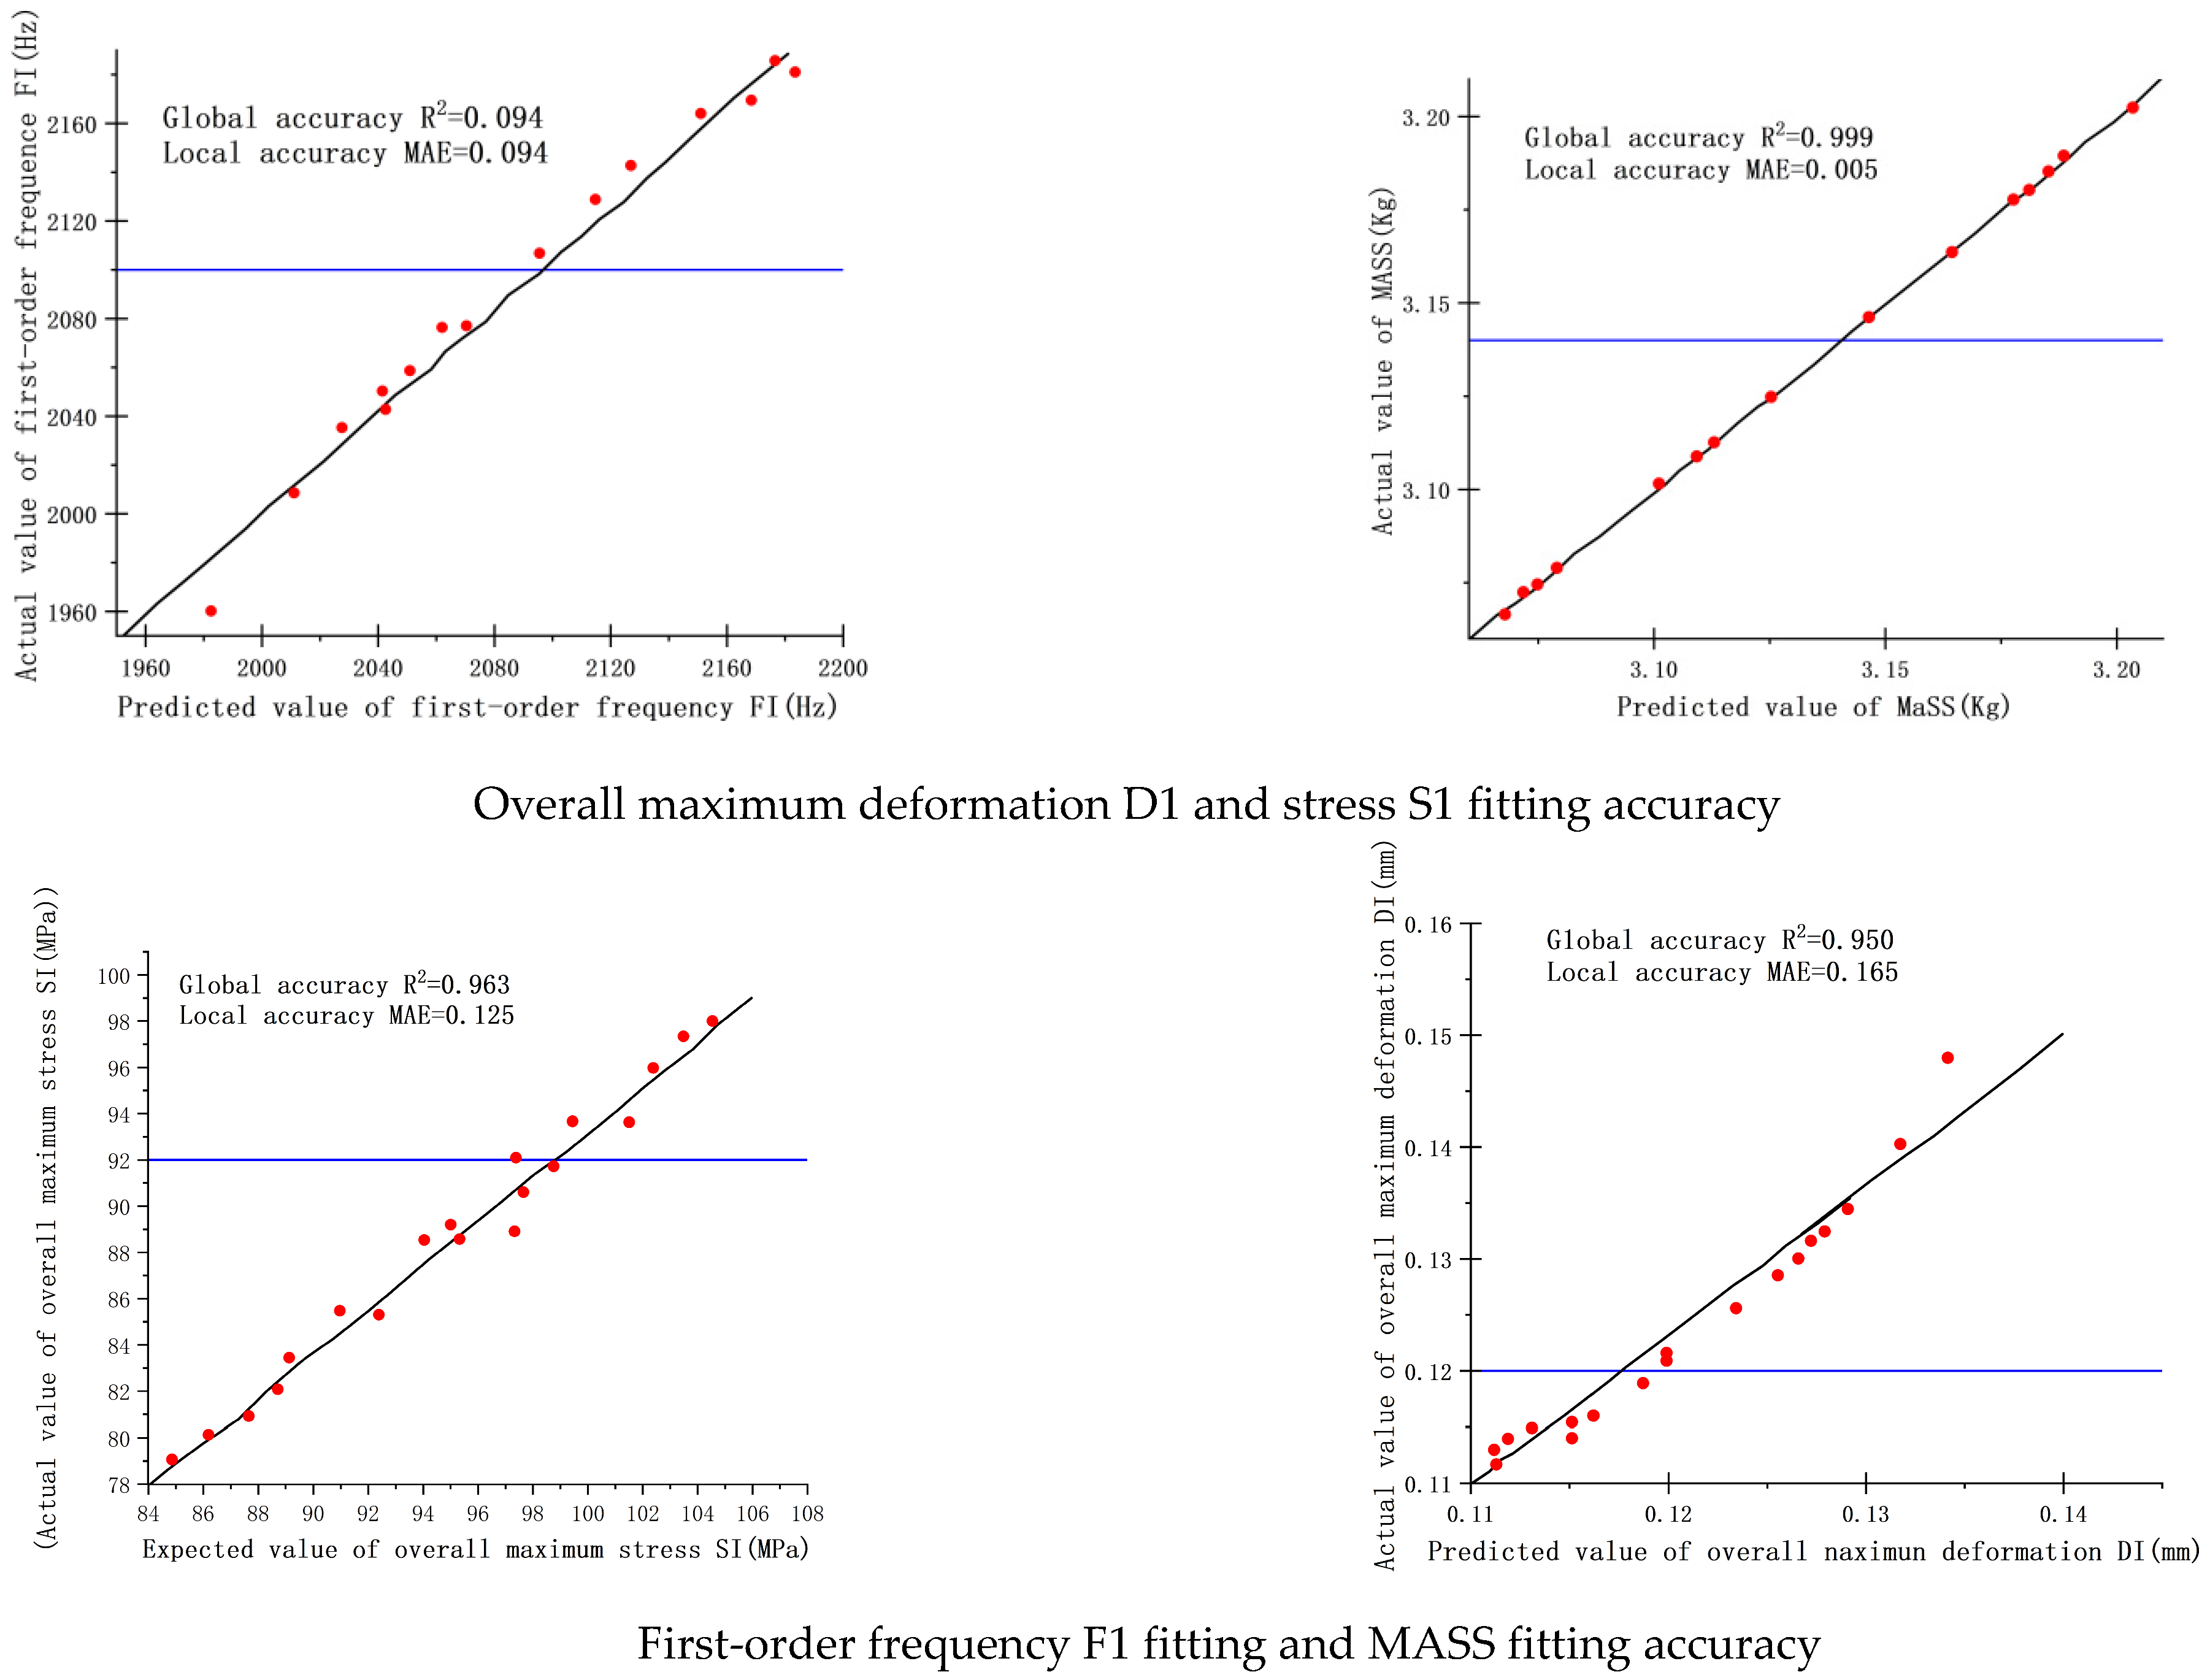
By utilizing the Isight software, this study conducted an in-depth analysis of the input and output responses of the reducer housing, thereby establishing an approximate mathematical model. Based on this model, 20 sample points were selected for the project, and the constructed surrogate model was rigorously evaluated using the coefficient of determination R2 and the maximum absolute error (MAE) as assessment criteria. The corresponding fitting results are also provided. As shown in Figure 18.
Through a detailed analysis of the previous results, it can be clearly observed that all the coordinate points reflecting the model’s accuracy lie on the 45-degree diagonal. The coefficient of determination R2 consistently exceeds 0.9, and the maximum value of the absolute error is below 0.3. This indicates that the constructed surrogate model possesses high fitting accuracy and can be applied to multi-objective optimization calculations. Furthermore, the three-dimensional response surface model intuitively demonstrates the effects of the two design parameters on the output response. A comparative analysis was also conducted between the response surface results and the maximum structural stress.

4.2.5. Multi-Objective Optimization of the Shell

(1)
Multi-Objective Optimization Methods
Multi-objective optimization involves the comprehensive consideration of multiple, often conflicting, design requirements in order to achieve an optimal balance. However, since there are generally correlations or trade-offs between these objectives, optimizing a single objective may result in the degradation of others, making it difficult to obtain a solution that is optimal for all objectives simultaneously. As a result, the outcome is typically represented by a set of non-dominated solutions, known as the Pareto optimal solutions. This problem can be mathematically formulated as follows:
M i n s . t F x = f 1 x , f 2 x , , f n x t i x 0 i = 1 , 2 p r j x = 0 j = 1 , 2 , q x L x x M x = x 1 , x 2 , x s X
As a result, the outcome is typically represented by a set of non-dominated solutions.
In this study, “F” denotes the objective function to be optimized, while “t” and “r” serve as constraint conditions. The variable “x” represents the design variable, with “x1” and “xm” indicating its minimum and maximum values, respectively. “X” refers to the sample space encompassing all design variables. The parameters “n”, “p”, “q”, and “s” correspond to the numbers of specific functions or parameters involved.
  • Objective Function Setting:
The optimization objective of this study prioritizes the stiffness of the reducer housing over its strength during operation, acknowledging the mutual influence between mass and stiffness. Accordingly, this research aims to identify Pareto-optimal solutions by minimizing both the housing weight and its overall deformation, taking into account a variety of design variables.
  • Constraint Condition Setting:
For practical engineering applications, a series of constraint conditions—each mathematically related to the design variables—must be considered. The corresponding mathematical model is formulated as follows: as mentioned previously, the maximum frequencies of internal and external excitations are 1430.30 Hz. After optimization, the first-order natural frequency of the housing is 2177.2 Hz. Under the imposed constraints, the first-order natural frequency of the housing should not be lower than 1800 Hz, and the maximum von Mises stress throughout the structure must not exceed 100 MPa. The core of handling constraints in NSGA-II is the combination of penalty functions and dominance principles, supplemented by repair strategies to enhance feasibility. In mechanical optimization, high-frequency/stress constraints participate in non-dominated sorting through normalized violation degree while parameter boundary control and local gradient correction ensure that the solution meets the practical needs of engineering.
To achieve lightweight design and reduced total deformation, this study proposes an optimization approach to address the trade-off between maximum and minimum deformations. The Isight software provides three main categories of optimization algorithms: numerical optimization algorithms, expert system optimization algorithms, and exploratory optimization algorithms. Among them, NSGA-II, NCGA, and AMGA are the principal methods under investigation.
NSGA-II, proposed by Deb, was developed to resolve two major issues found in the original Non-dominated Sorting Genetic Algorithm (NSGA): solution loss and excessive computational complexity. NSGA-II demonstrates good convergence properties.
The properties and distribution characteristics of rods have been widely applied in several fields, including structural optimization, job shop scheduling, and energy consumption analysis.
In practice, NSGA-II operates by randomly generating “N1” individuals as the initial population, followed by non-dominated sorting of these individuals. Subsequently, binary tournament selection, crossover, and mutation operations are performed to generate a successor population of size “N2”. The parent and offspring populations (“N1” and “N2”) are then merged to form a combined population “N3”. Non-dominated sorting is once again executed on “N3”, and the crowding distance for each individual is calculated. Through an elitist strategy, the most suitable individuals are selected to form a new population “N4”. This process iterates in accordance with the basic procedures of genetic algorithms, repeatedly generating new populations until the termination condition is satisfied.
(2)
Analysis of Multi-Objective Optimization Results for the Housing
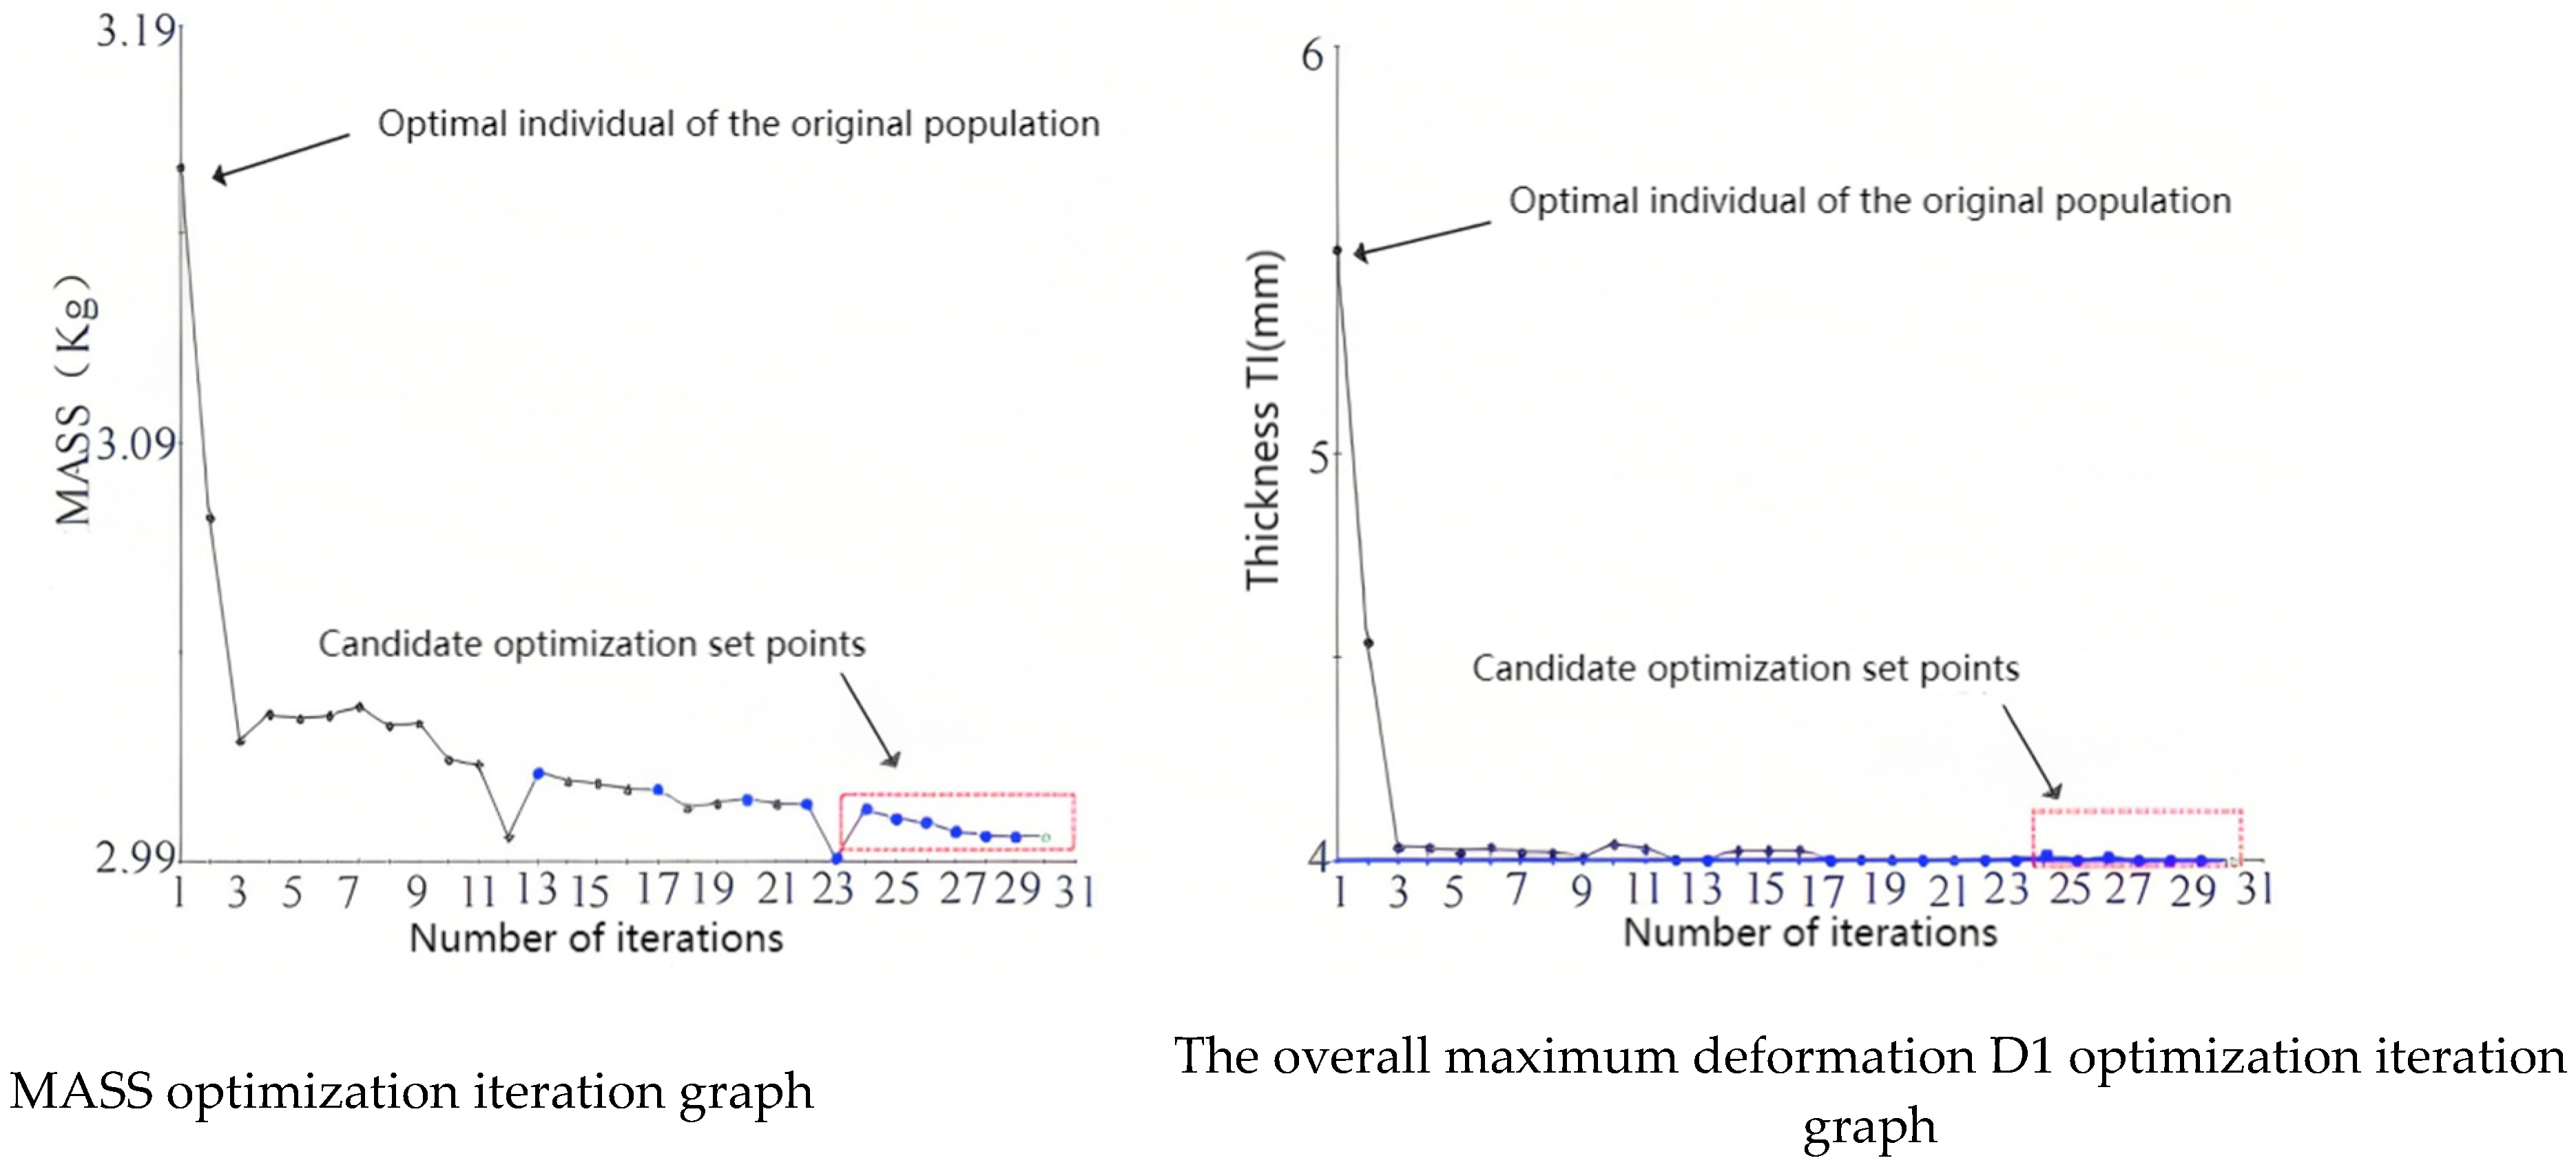
Based on these considerations, this study applies the NSGA-II method to optimize the initial population. Utilizing the NSGA-II algorithm, thirty iterations are performed to achieve the intended optimization objectives. As shown in Figure 19.
According to the analysis in Figure 12, after 13 iterations, both the system inputs and output responses exhibit a trend of gradually stabilizing. In this study, the housing mass minimization scheme obtained after 30 iterations is selected, and the calculation results are appropriately rounded in accordance with engineering practices. The specific data are shown in Table 9, while Table 9 presents the detailed values of the output responses. Table 10 presents output results of response optimization.
The approximate data of Table 9 will not affect the results, and the optimized results can meet the design requirements.

4.3. Performance Analysis of the Reducer Housing After Size Optimization

Based on the roundness data of the design variables listed in Table 9 and taking into account practical production conditions, optimization calculations were performed on the constructed structural parameters, and these parameters were further subjected to optimized design.

4.3.1. Static Analysis of the Optimized Shell Size

In accordance with the static analysis procedures described earlier, an analysis was conducted on the housing with optimized dimensions. The final results are presented in Figure 20.
After optimizing the housing structure, its weight was reduced from 3.23 kg to 2.94 kg, achieving an 8.97% reduction. The results show that as the structural parameters were improved, the maximum stress experienced by the structure increased from 90.757 MPa to 95.505 MPa and the maximum deformation rose from 0.083 mm to 0.090 mm. Nevertheless, both structural configurations meet the established usage standards. Detailed comparative data are provided in Table 11.

4.3.2. Constrained Modal Analysis After Shell Size Optimization

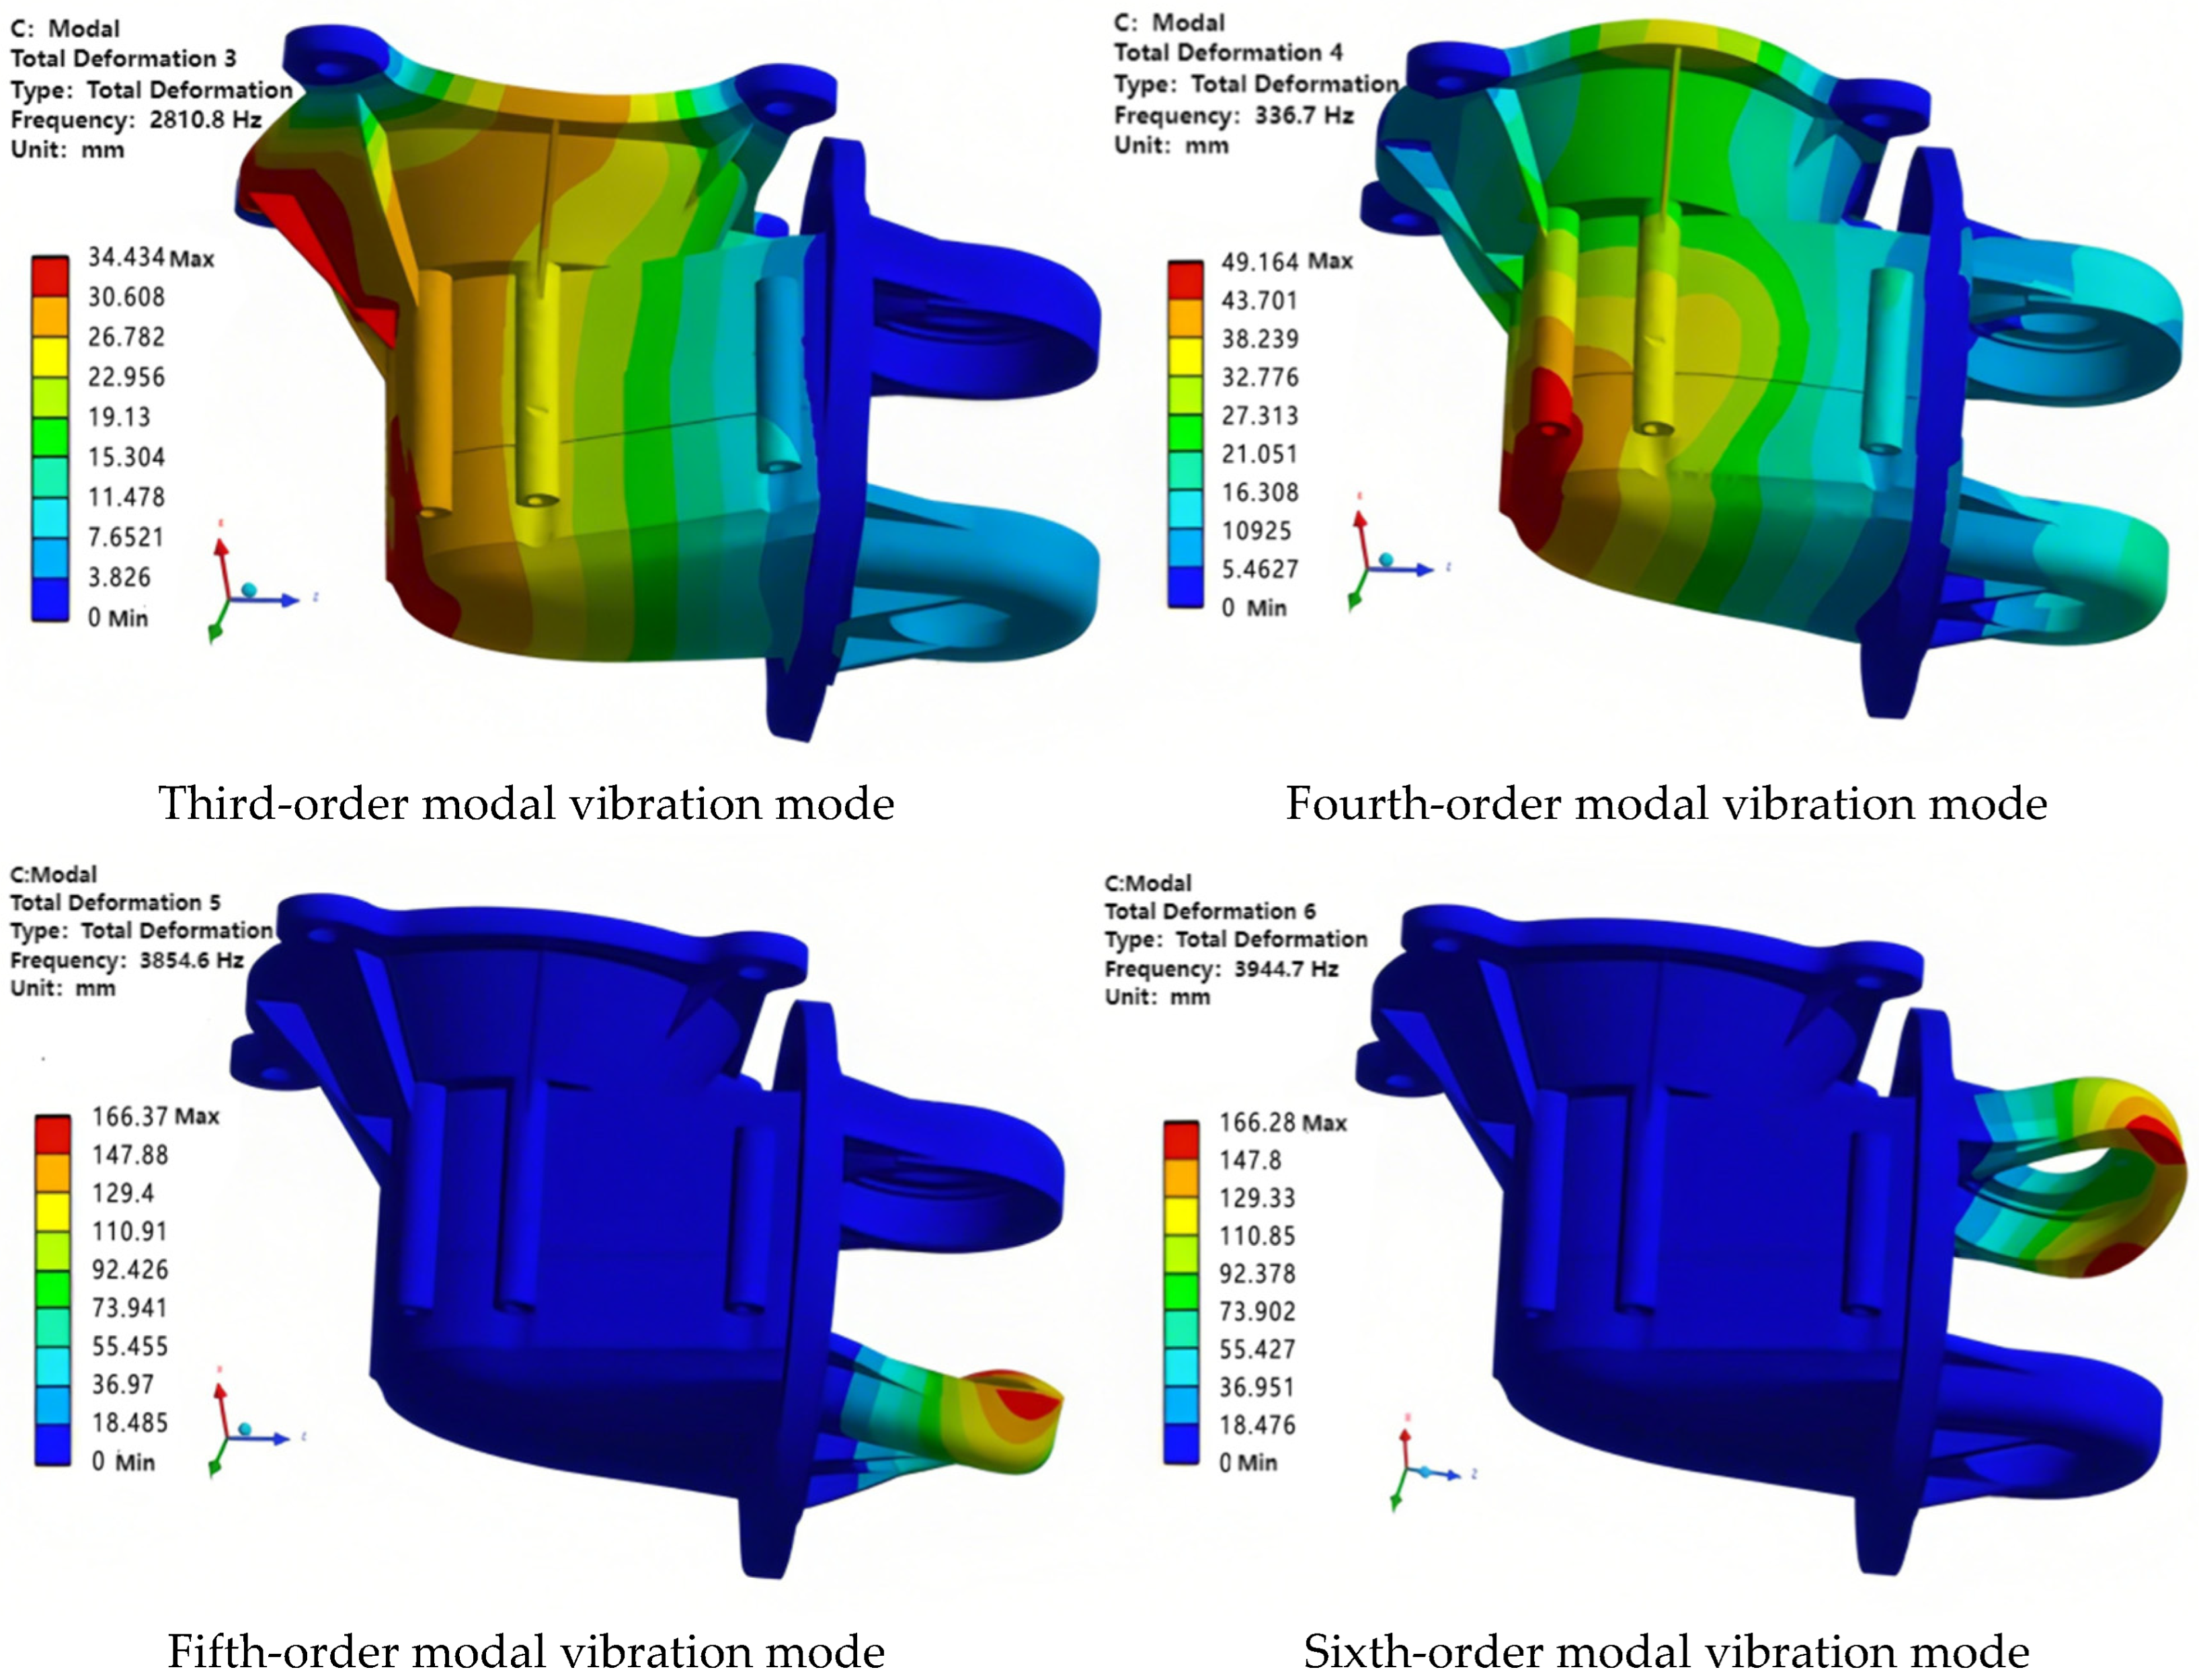
According to the previously applied constraint modal method, the first six mode shapes of the structure after optimization were obtained. The specific results are shown in Figure 21.
According to the data in Table 12, compared to the pre-optimization state, the natural frequencies of the housing after dimensional optimization have either increased or decreased. However, the first-order natural frequency still maintains a sufficient margin from the maximum frequency of both internal and external excitations, meeting the required performance standards for operation. Figure 22 is an optimization flowchart.

4.4. The Assembly Model of the Reducer After Size Optimization

Topology optimization is a mathematical method that seeks the optimal material distribution within the design domain based on load, constraints, and performance indicators. Its core is to achieve structural design that is lightweight and has high stiffness or specific functional requirements by eliminating inefficient material areas to form holes or reinforcing rib layouts.
The prediction model based on the optimized ANN structure for housing component based on RSM will be potentially used in the industrial field by a design engineer for developing a new product.
In the initial stage of housing design, details such as fillets were not defined for subsequent finite element analysis. Therefore, subtle fillet features were introduced in the reducer housing model, and it was also integrated with the internal drive mechanism, ultimately completing the model of the mini car reducer.
During assembly of the reducer, an inside-out approach was adopted: the housing was used as the fixed component, and the other parts were assembled into the housing in installation order. Once all components were constrained, the assembly was completed. The following outlines the assembly process for the 3D model of the two-stage reducer: First, a blank assembly environment was created. Then, the housing part of the reducer was imported and used as the assembly reference. Subsequently, components such as gears, gear shafts, and bearings of the two-stage reducer were imported sequentially; each part was fixed in place by applying constraints such as coaxially, coincidence, and contact. Finally, the gearbox cover was imported and assembled onto the housing using contact and coincidence constraints. As shown in Figure 23.

4.5. Summary of This Chapter

This study proposes a novel parameter optimization method for housing structures based on topology optimization technology. First, a size optimization strategy for the reducer, based on structural parameters, was established. On this basis, key parameters such as wall thickness were selected as design variables, and their value ranges were determined according to structural design codes and practical engineering experience. Through the use of Latin Hypercube Sampling in the DOE experiments, 36 sets of variable parameter combinations were selected. Subsequently, the Pareto contributions of each variable to the housing mass, first-order frequency, and maximum stress, as well as the interactions between variables, were analyzed to screen for the optimal design variables. Based on this, a response surface approximation model for the cylindrical housing was established, and its accuracy was verified. Furthermore, with the prerequisite of meeting performance indicators, the NSGA-II multi-objective optimization method based on Isight software was studied, and the optimal parameters and their corresponding outputs were obtained through iterative computation. Afterwards, the original housing was modified with the rounded dimensions, and its performance was re-evaluated via the same finite element analysis procedure. Ultimately, a lightweight housing model meeting both service requirements and reduced weight was obtained, achieving the goal of structural lightweighting. Finally, by adding features such as small chamfers to the housing, the final prototype design of the mini car reducer was completed.

5. Conclusions

This study focuses on the reducer housing of a micro car as its research object. Based on traditional housing design experience and utilizing modern finite element technology, structural topology optimization was employed to explore optimal load transfer paths and to determine a rational layout of stiffening ribs near the supports. While maintaining the basic structure of the housing, dimensional optimization was conducted to achieve a final lightweight housing model that meets design requirements. Through multiple rounds of optimization using Workbench simulation software, a reasonable structural form was ultimately determined, shortening the product design and improvement cycle and providing a reference for the subsequent development and optimization of electric drive rear axle assembly components.
This paper elaborates in detail on the working principle of the single-stage reducer for micro cars, discusses key considerations such as strength, stiffness, and wall thickness in its structural design, and, based on the layout diagram of the internal gear section provided by the enterprise, completes the primary housing model using the minimum structural envelope method. At the same time, considering the size requirements of the external motor bolt holes, the flange connected to the motor was designed as an integral part with the left housing; moreover, the finite element mesh model of the housing was established in Workbench.
Building on previous research, the innovation of this paper lies in the combination of numerical simulation and experimental methods to investigate the reducer’s structural dynamic characteristics under various working conditions. Using finite element numerical simulation technology, a three-dimensional finite element model suitable for different conditions will be established to reveal the dynamic characteristics of the structure and propose an innovative structural design scheme. The results show that, after structural optimization, the housing weight was reduced from 3.60 kg to 3.23 kg, achieving a weight reduction of 10.2%. In the original housing structure, the maximum stress increased from 87.312 MPa to 90.757 MPa, and the maximum deformation increased from 0.072 mm to 0.083 mm. Compared with the initial housing, the first ten orders of natural frequencies were improved while maintaining a sufficient margin from the internal and external excitation frequencies.
The limitations of ANSYS in the analysis of gearbox housings are essentially due to the contradiction between the complexity of the physical world and the simplification of numerical methods. Future breakthroughs need to focus on high fidelity hybrid modeling.

Author Contributions

Methodology, Y.L.; Software, J.T.; Validation, H.H.; Resources, X.G. All authors have read and agreed to the published version of the manuscript.

Funding

National Natural Science Foundation of China: 51508304. We gratefully acknowledge financial support from the New Energy Vehicle Intelligent Network Technology Shandong Province Higher Education Institutions Future Industry Engineering Research Centre Project.

Data Availability Statement

The original contributions presented in this study are included in the article. Further inquiries can be directed to the corresponding author.

Conflicts of Interest

The authors declare no conflicts of interest.

References

  1. Zhu, H.S. The lightweighting of automobile main reducer. Automot. Eng. 2010, 7, 3. [Google Scholar]
  2. Pinto, D.V.; Rosa, J.S.; Wander, P.R. Thermal and electrical performance analysis of a lightweight micro CHP system for recreational vehicles. Appl. Therm. Eng. 2024, 257, 124173. [Google Scholar] [CrossRef]
  3. Tian, G.; Lu, W.; Zhang, X.; Zhan, M.; Dulebenets, M.A.; Aleksandrov, A.; Fathollahi-Fard, A.M.; Ivanov, M. A survey of multi-criteria decision-making techniques for green logistics and low-carbon transportation systems. Environ. Sci. Pollut. Res. 2023, 30, 57279–57301. [Google Scholar] [CrossRef] [PubMed]
  4. He, J.; Li, F.; Chen, L. Simulation Analysis of the Performance of New Energy Commercial Vehicle Chassis. Automob. New Power 2024, 7, 36–39. [Google Scholar]
  5. Wheatley, G.; Popoola, S.; Collins, J. Design, Optimization, and Analysis of the Chassis of a Racecar; SAE Technical Paper; SAE International: Warrendale, PA, USA, 2021. [Google Scholar]
  6. Chawla, T.S.; Leonhardt, E. Two Approaches to Optimize Formula SAE Chassis Design Using Finite Element Analysis. In Proceedings of the 2018 ASEE Annual Conference & Exposition, Salt Lake City, UT, USA, 23–27 July 2018. [Google Scholar]
  7. Gawande, S.H.; Muley, A.A.; Yerrawar, R.N. Optimization of torsional stiffness for heavy commercial vehicle chassis frame. Automot. Innov. 2018, 1, 352–361. [Google Scholar] [CrossRef]
  8. Pilley, S.; Morkos, B.; Alfalahi, M. Integration and Modularity Analysis for Improving Hybrid Vehicles Battery Pack Assembly; SAE Technical Paper; SAE International: Warrendale, PA, USA, 2018. [Google Scholar]
  9. Topac, M.M.; Karaca, M.; Aksoy, B.; Deryal, U.; Bilal, L. Lightweight design of a rear axle connection bracket for a heavy commercial vehicle by using topology optimisation: A case study. Mechanics 2020, 26, 64–72. [Google Scholar] [CrossRef]
  10. Tian, G.D.; Cheng, Z.; Amir, M. An enhanced social engineering optimizer for solving an energy-efficient disassembly line balancing problem based on bucket brigades and cloud theory. IEEE Trans. Ind. Inform. 2022, 19, 7148–7159. [Google Scholar]
  11. Sun, Z.; Siringoringo, D.M.; Fujino, Y. Load-carrying capacity evaluation of girder bridge using moving vehicle. J. Eng. Struct. 2021, 229, 111645. [Google Scholar] [CrossRef]
  12. Galos, J.; Sutcliffe, M. Material selection and structural optimization for lightweight truck trailer design. SAE Int. J. Commer. Veh. 2020, 12, 281–297. [Google Scholar] [CrossRef]
  13. Ding, X.; Liu, X. Modal Analysis of Automobile Wheels based on Lightweight Technology. J. Electr. Syst. 2024, 20, 353–364. [Google Scholar] [CrossRef]
  14. Bian, J. Optimum Design and Modal Analysis of Reducer Worm Drive for Belt Conveyor by Matlab and ANSYS. PLoS ONE 2019, 10, e0136706. [Google Scholar]
  15. Yang, X.; Tartakovsky, G.; Tartakovsky, A.M. Physics information aided kriging using stochastic simulation models. SIAM J. Sci. Comput. 2021, 43, A3862–A3891. [Google Scholar] [CrossRef]
  16. Zhao, P.; Xue, L. Variable selection for semiparametric varying coefficient partially linear errors-in-variables models. J. Multivar. Anal. 2010, 101, 1872–1883. [Google Scholar] [CrossRef]
  17. Li, J.; Tan, J.; Dong, J. Lightweight Design of front suspension upright of electric formula car based on topology optimization method. World Electr. Veh. J. 2020, 11, 15. [Google Scholar] [CrossRef]
  18. Yang, Q.; Youli, L. Lightweight Design and Production Practice of the Heavy Truck Drive Axle. Automob. Des. 2023, 47, 148–152. [Google Scholar]
  19. Junk, S.; Rothe, N. Lightweight design of automotive components using generative design with fiber-reinforced additive manufacturing. Procedia CIRP 2022, 109, 119–124. [Google Scholar] [CrossRef]
  20. Xu, W.; Ma, X.; Jin, Y. A Modular Mathematical Modeling Method for Smart Design and Manufacturing of Automobile Driving Axles. J. Circuits Syst. Comput. 2024, 33, 2450115. [Google Scholar] [CrossRef]
  21. Fathollahi-Fard, A.M.; Tian, G.; Ke, H.; Fu, Y. Efficient multi-objective metaheuristic algorithm for sustainable harvest planning problem. Comput. Oper. Res. 2023, 158, 106304. [Google Scholar] [CrossRef]
  22. Nwe, T.; Tantrapiwat, A.; Pimsarn, M. Multi-Objective Optimization of Lightweight Inboard Bearing Design for High-Speed Railway Axle. J. Res. Appl. Mech. Eng. 2024, 12, 1–9. [Google Scholar]
  23. Shi, D.; Ye, Y.; Gillwald, M.; Hecht, M. Designing a lightweight 1D convolutional neural network with Bayesian optimization for wheel flat detection using carbody accelerations. Int. J. Rail Transp. 2021, 9, 311–341. [Google Scholar] [CrossRef]
  24. Zhao, F. Finite-Element Analysis on Lightweight Material of Drive Axle Housin. J. Compos. Adv. Mater./Rev. Des Compos. Des Matériaux Avancés 2021, 31, 41–49. [Google Scholar]
Figure 1. The internal transmission system model and transmission schematic diagram of the reducer.
Symmetry 17 01663 g001
Figure 2. The optimized area of the initial shell in green color.
Symmetry 17 01663 g002
Figure 3. Finite element mesh model of the reducer housing.
Symmetry 17 01663 g003
Figure 4. A simplified force diagram of the input axis AB shafting.
Symmetry 17 01663 g004
Figure 5. A force diagram of the intermediate shaft CD shafting.
Symmetry 17 01663 g005
Figure 6. A force diagram of the output shaft EF shafting.
Symmetry 17 01663 g006
Figure 7. Dynamic model of the transmission system.
Symmetry 17 01663 g007
Figure 8. A shell for applying loads and constraints.
Symmetry 17 01663 g008
Figure 9. Finite element analysis results of the reducer housing.
Symmetry 17 01663 g009
Figure 10. The boundary conditions of the shell constraint mode.
Symmetry 17 01663 g010
Figure 11. Shell constraint mode frequency and vibration mode.
Symmetry 17 01663 g011aSymmetry 17 01663 g011b
Figure 12. Shell parametric model framework.
Symmetry 17 01663 g012
Figure 13. Static analysis results of the local shell.
Symmetry 17 01663 g013
Figure 14. The key dimensions of the shell.
Symmetry 17 01663 g014
Figure 15. Sampling schematic diagrams of three experimental designs.
Symmetry 17 01663 g015
Figure 16. The Pareto graph of design variables and output responses.
Symmetry 17 01663 g016
Figure 17. The influence of the interaction among various design variables on the output response.
Symmetry 17 01663 g017
Figure 18. Partial output response fitting accuracy diagram.
Symmetry 17 01663 g018
Figure 19. Some input variables.
Symmetry 17 01663 g019
Figure 20. The static analysis results of the shell after size optimization.
Symmetry 17 01663 g020
Figure 21. The constrained mode vibration pattern diagram of the shell after size optimization.
Symmetry 17 01663 g021aSymmetry 17 01663 g021b
Figure 22. Clear research logic diagram.
Symmetry 17 01663 g022
Figure 23. Assembly model of small car reducer.
Symmetry 17 01663 g023
Table 1. Parameters related to the drive motor.
Rated Power
/kW
Peak Power
/kW
Peak Torque
/Nm
Rated Speed
/r/min
Frequency
/Hz
46653000102
Table 2. ADC12 performance parameters of aluminum alloy.
Elastic Model/GPaPoison byDensity/Kg·m−3Tensile Strength/MPaYield Strength/MPa
700.332700230170
Table 3. Parameters related to helical gears.
ProjectInput Shaft Gear Z1Intermediate Shaft Gear Z2Intermediate Shaft Gear Z3Output Shaft Gear Z4
Normal modulus m1.51.51.751.75
Number of teeth
Z
18461873
Tooth profile Angle α20°20°20°20°
Helix angle β20°20°20°20°
Rotation directionLeft rotationRight rotationRight rotationLeft rotation
Table 4. The load size of the bearing housing at A–F of the reducer housing under peak torque.
ProjectFX (N)FY (N)FZ (N)
Bearing at input shaft A01075.2283.5
Bearing at input shaft B1733.83456.41363.3
Bearing at intermediate shaft C07925.4999.7
Bearing at intermediate shaft D22016486960.7
Bearing at output shaft E2656.23755.12000.9
Bearing at output shaft F03152.81606.3
Table 5. The first ten modal frequencies and vibration mode manifestations of the shell.
OrderModal Frequency/HzVibration Mode Performance
12480.6Bend locally along the Y direction
22506.6Bend locally along the Y direction
33228.5Bend locally along the Y direction
43685.7Bend locally along the Y direction
53979.3Local distortion along the X direction
64021.6Local distortion along the Y direction
74443.7Stretch locally along the Z direction
84675.7Stretch locally along the Z direction
95021.7Stretch locally along the X direction
105754.1Local distortion along the Z direction
Table 6. The meaning and scope of shell design variables.
Code NameThe Meaning of Design VariablesInitial Value/mmValue Range/mm
T1The wall thickness of the left and right shells64–7
P1The widths of the reinforcing ribs on both sides of the bearing housings of the left and right shells64–7
P2The width of the reinforcing ribs along the axis of the bearing housing of the left and right shells74–8
P3The distance between the centers of the two bolt holes on the left and right shells7265–75
P4The thickness of the flange end face129–13
P5The width of the reinforcing ribs on the flange plate of the left shell52–6
P6The widths of the reinforcing ribs on both sides of the output shafts of the left and right shells52–6
Table 7. Latin hypercube sampling results.
Serial NumberP1P2P3P4P5P6T1
14.0454.02068.06512.5383.9103.5684.693
24.1645.44773.3929.6433.1664.6535.327
34.2217.63865.90510.6084.2312.0605.116
44.2874.16173.89411.5935.6986.0005.402
54.4024.98573.79411.4922.2413.2664.106
336.7544.80474.64812.9403.6284.0904.980
346.8106.91571.23111.3125.6582.6235.342
356.8745.64873.0909.4972.8645.1364.965
366.9306.93570.52812.8594.0102.0204.829
Table 8. Output response results.
Serial NumberFirst-Order Frequency F1/HzQuality MASS/KgOverall Maximum Deformation
D1/mm
Overall Maximum Stress
S1/MPa
Local Maximum Deformation D2/mmLocal Maximum Stress
S2/mm
12053.2333.0970.125115.8150.045115.815
22145.5963.1140.116106.9430.044106.943
31969.5933.1130.13689.1920.04189.192
42202.9123.1700.110117.6010.045117.601
52028.1893.0250.128106.0420.042106.042
331959.3163.0790.13498.9760.04098.976
342023.9873.1750.128101.5950.041101.595
352187.2393.1370.11189.5960.04089.596
361957.3923.1430.13691.7440.04091.744
Table 9. Design variable optimization results and rounded values.
NumberThe Meaning of Design VariablesBefore Optimization/mmAfter Optimization/mmAfter Rounding/mm
T1The wall thickness of the left and right shells64.00084
P1The widths of the reinforcing ribs on both sides of the bearing housings of the left and right shells64.01034
P2The width of the reinforcing ribs along the axis of the bearing housing of the left and right shells77.31267.5
P3The distance between the centers of the two bolt holes on the left and right shells7274.91475
P4The thickness of the flange end face129.00049
P5The width of the reinforcing ribs on the flange plate of the left shell52.02692
P6The widths of the reinforcing ribs on both sides of the output shafts of the left and right shells55.95176
Table 10. Output results of response optimization.
First-Order Frequency F1/HzQuality MASS/KgOverall Maximum Deformation D1/mmOverall Maximum Stress S1/MPa
2205.42.990.11097.364
Table 11. Comparison results of the static performance of the shell before and after size optimization.
Maximum Stress/MPaMaximum Deformation/mm
Before size optimization90.7570.109
After size optimization95.5050.118
Table 12. Comparison of natural frequencies before and after size optimization.
OrderBefore Size Optimization/HzAfter Size Optimization/HzRate of Change
12177.22194.8Rise 0.80%
22349.12347.6Decline 0.08%
33144.62810.8Decline 10.61%
43557.73365.7Decline 5.39%
53790.03854.6Rise 1.70%
63894.43944.7Rise 1.29%
74454.84390.6Decline 1.44%
84650.94544.5Decline 2.28%
94837.54701.8Decline 0.28%
104998.14841.6Decline 3.13%
Disclaimer/Publisher’s Note: The statements, opinions and data contained in all publications are solely those of the individual author(s) and contributor(s) and not of MDPI and/or the editor(s). MDPI and/or the editor(s) disclaim responsibility for any injury to people or property resulting from any ideas, methods, instructions or products referred to in the content.