Article

Study on the Influence of Thermodynamic Effects on the Characteristics of Liquid Nitrogen Cavitating Flow around Hydrofoils

1
School of Energy and Power Engineering, Jiangsu University, Zhenjiang 212013, China
2
Shanghai Marine Equipment Research Institute (SMERI), Shanghai 200031, China
*
Author to whom correspondence should be addressed.
Symmetry 2023, 15(10), 1946; https://doi.org/10.3390/sym15101946
Submission received: 7 September 2023 / Revised: 4 October 2023 / Accepted: 17 October 2023 / Published: 20 October 2023
(This article belongs to the Special Issue Symmetry in Micro/Nanofluid and Fluid Flow)

Abstract

:
Cryogenic cavitation exhibits complexities primarily represented by the coupled interactions of thermodynamic effects, vortices, and cavities during the cavitation process. To further investigate this coupling mechanism, this study employed the DDES turbulence model and Sauer–Schnerr cavitation model to perform unsteady numerical simulations of liquid nitrogen cavitation flow around the NACA0015 Hydrofoil. Numerical validation of the model utilized a symmetrical Hord hydrofoil. The results reveal that the upstream development of the recirculation flow under inverse pressure gradients is the fundamental cause of the detachment in the primary cavitation region. At a cavitation number of 0.616, thermodynamic effects noticeably suppress the formation of cavities and alter the range of adverse pressure gradients, consequently influencing the detachment behavior in the primary cavitation region.

1. Introduction

Liquid cryogenic media exhibit unique characteristics, such as ultralow temperatures, low thermal conductivity, an extremely low liquid-to-vapor density ratio, and highly unstable critical states. Fluid machinery employed in the transportation of cryogenic media must withstand severe environmental conditions while maintaining excellent cavitation performance and operational stability. For instance, in order to achieve higher thrust and specific impulses, cryogenic liquid fuel is commonly utilized as a propellant in liquid-fueled rocket engines. The cavitation performance of turbine pumps employed for cryogenic fuel transportation directly impacts the overall propulsion performance and manufacturing costs of the engine [1,2]. In the offshore liquid cargo-ship transportation system, cavitation occurrence in liquid cargo pumps can induce structural vibrations, noise, performance degradation, increased transportation costs, and compromised transportation safety. Hence, understanding the unique properties of cavitation in cryogenic fluids and developing accurate prediction methods for such phenomena pose urgent challenges that need to be addressed.
Due to the unique properties of cryogenic media in fluid machinery and cryogenic engineering, the cavitation process induces a significant temperature decrease in the cavitation region. This temperature decrease causes a substantial reduction in the local saturated vapor pressure of the liquid, thereby impeding further cavitation development. This phenomenon, resulting from temperature variations, is commonly known as the thermodynamic effect [3]. Initially proposed to quantitatively characterize the magnitude of cavitation heat effects and predict cavitation performance in pumps, the B-factor theory was introduced. The B factor is defined by Stahl et al. [4] represents the ratio of vapor volume to liquid volume during the evaporation process. Subsequently, various methods have been proposed by researchers to estimate the B factor. However, cavitation flow involves complex coupling mechanisms among vortices and bubbles of different scales and frequencies, as well as the influence of temperature. As a result, it becomes an extremely challenging flow phenomenon, and the results obtained from theoretical analysis often deviate significantly from actual situations.
Numerical simulation technology is extensively employed in various fields, including aerospace, aviation, shipping, and energy [5,6,7,8], significantly reducing the design cycle for relevant products. Numerical simulation has also been applied to the study of cryogenic cavitation. However, due to the highly unstable nature of cryogenic cavitation, researchers often modify existing turbulence and cavitation models to accurately capture unstable flow characteristics. For instance, Rodio et al. [9] modified the heat-transfer coefficient in the two-fluid model for cryogenic cavitation. Ahuja et al. [10] adjusted the empirical coefficient in the Merkle cavitation model to simulate the cavitation flow of liquid hydrogen and liquid nitrogen. The full cavitation model was adapted by Zhang X.B. et al. [11,12] to accommodate the numerical calculations of cryogenic cavitation flow. Sun T.Z. et al. [13] corrected the evaporation and condensation coefficients in the Zwart model, resulting in numerical results that were more consistent with Hord’s experiment results. The classical model was modified by Zhang et al. [14,15], who adjusted the empirical coefficients of the Zwart model and incorporated the heat source term. Li W.G. et al. [16] proposed a new cavitation model that considers thermodynamic effects and is applicable for numerical calculations of various cavitation mechanisms. Moreover, due to the complexity of cavitation mechanisms, the evolution of bubbles is closely related to multiscale vortex motion. Therefore, the development of more accurate turbulence models for cavitation numerical calculations is crucial. The partially averaged Navier–Stokes (PANS) model, with the ability to transition from Reynolds-averaged turbulence models to direct numerical simulation, holds certain advantages [17,18]. Some scholars use the DDES turbulence model to capture flow details, which balances economy and accuracy [19,20,21]. Despite the advantages of numerical simulation, the availability of experimental data for verifying the accuracy of cryogenic cavitation simulations is limited. This is mainly due to the significant influence of equipment and technology on cryogenic cavitation experiments. Notably, Hord conducted a series of cryogenic cavitation experiments from 1972 to 1974 with the support of NASA, and the results have been widely used to validate numerical calculations [22,23,24,25]. Kazuki et al. [26] performed cryogenic cavitation experiments in a water tunnel and verified the inhibitory effect of thermal effects on cavitation development. It was confirmed by Cervone et al. [27,28] that the size of cavitation bubbles can be influenced by water temperature through induced wheel and hydrofoil experiments. Chen et al. [29,30] conducted experimental research on the characteristics of cryogenic nitrogen cavitation flow in contraction–expansion tubes.
This study focuses on investigating the cavitation flow around Hydrofoils with liquid nitrogen under cryogenic conditions. First, the DDES turbulence model and Sauer–Schnerr cavitation model are employed to numerically simulate the Hord test’s symmetrical hydrofoil, aiming to identify more accurate numerical methods. Building upon this, unsteady numerical simulations are conducted to analyze the coupled motion correlations between thermodynamic effects, cavitation, and vortices in the cavitation flow around the NACA0015 hydrofoil with liquid nitrogen.

2. Numerical Calculation Methods and Verification

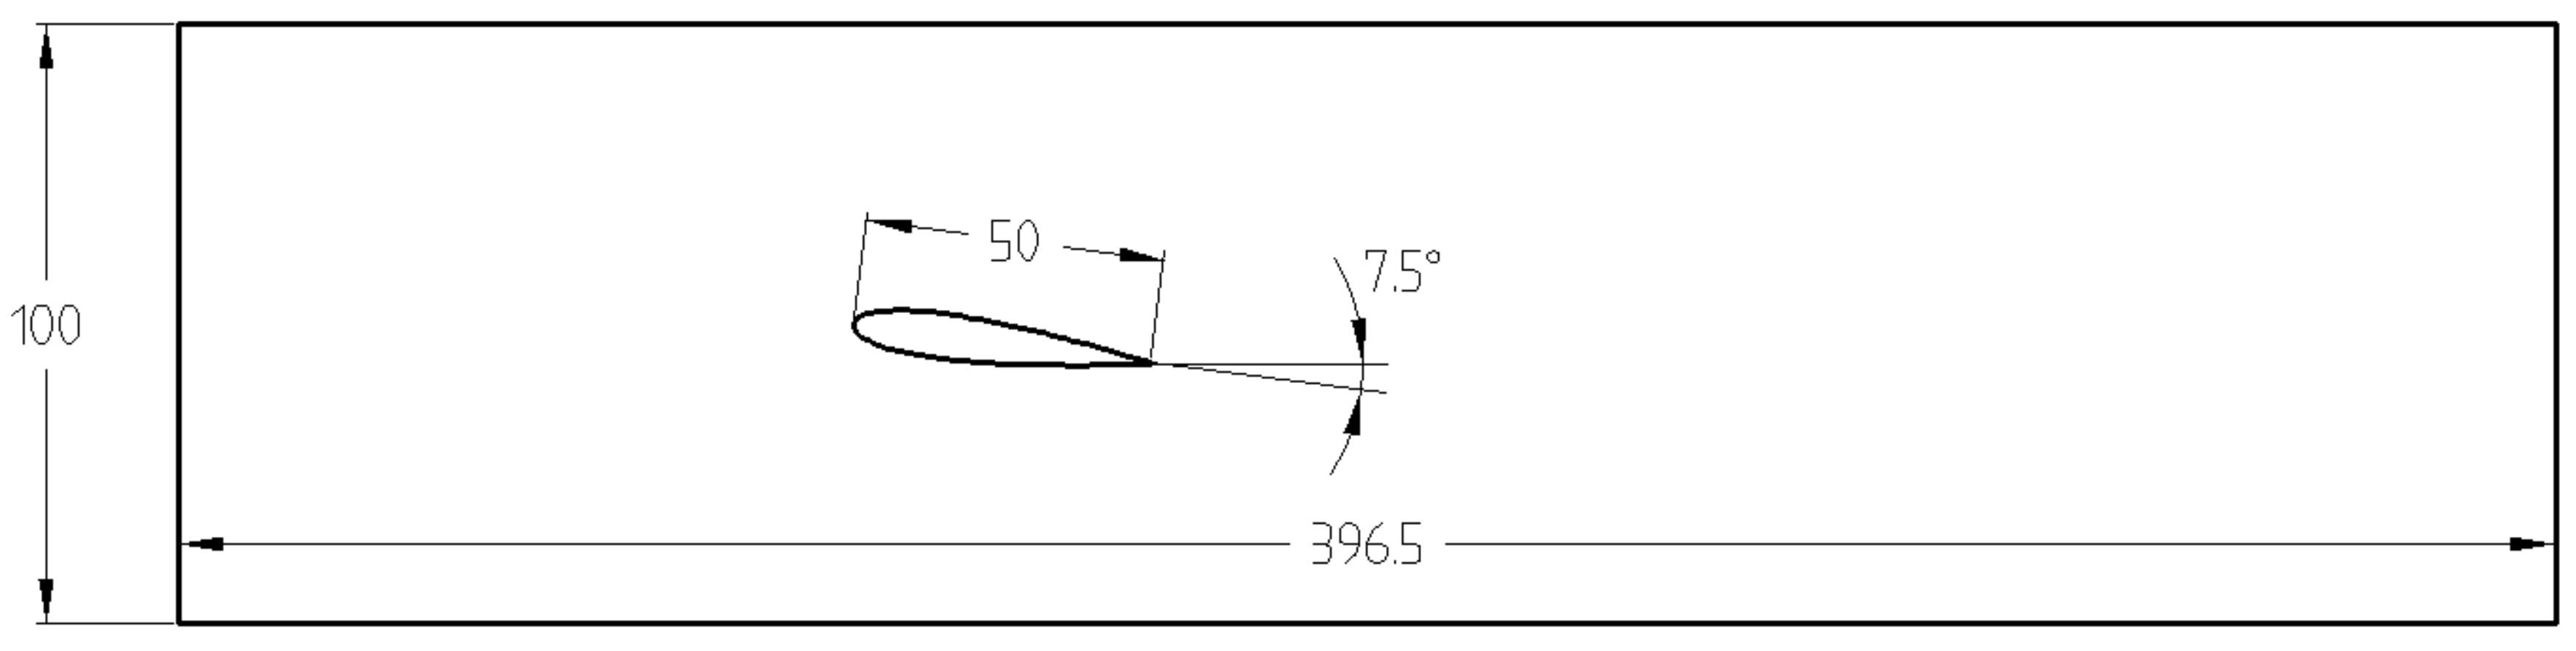
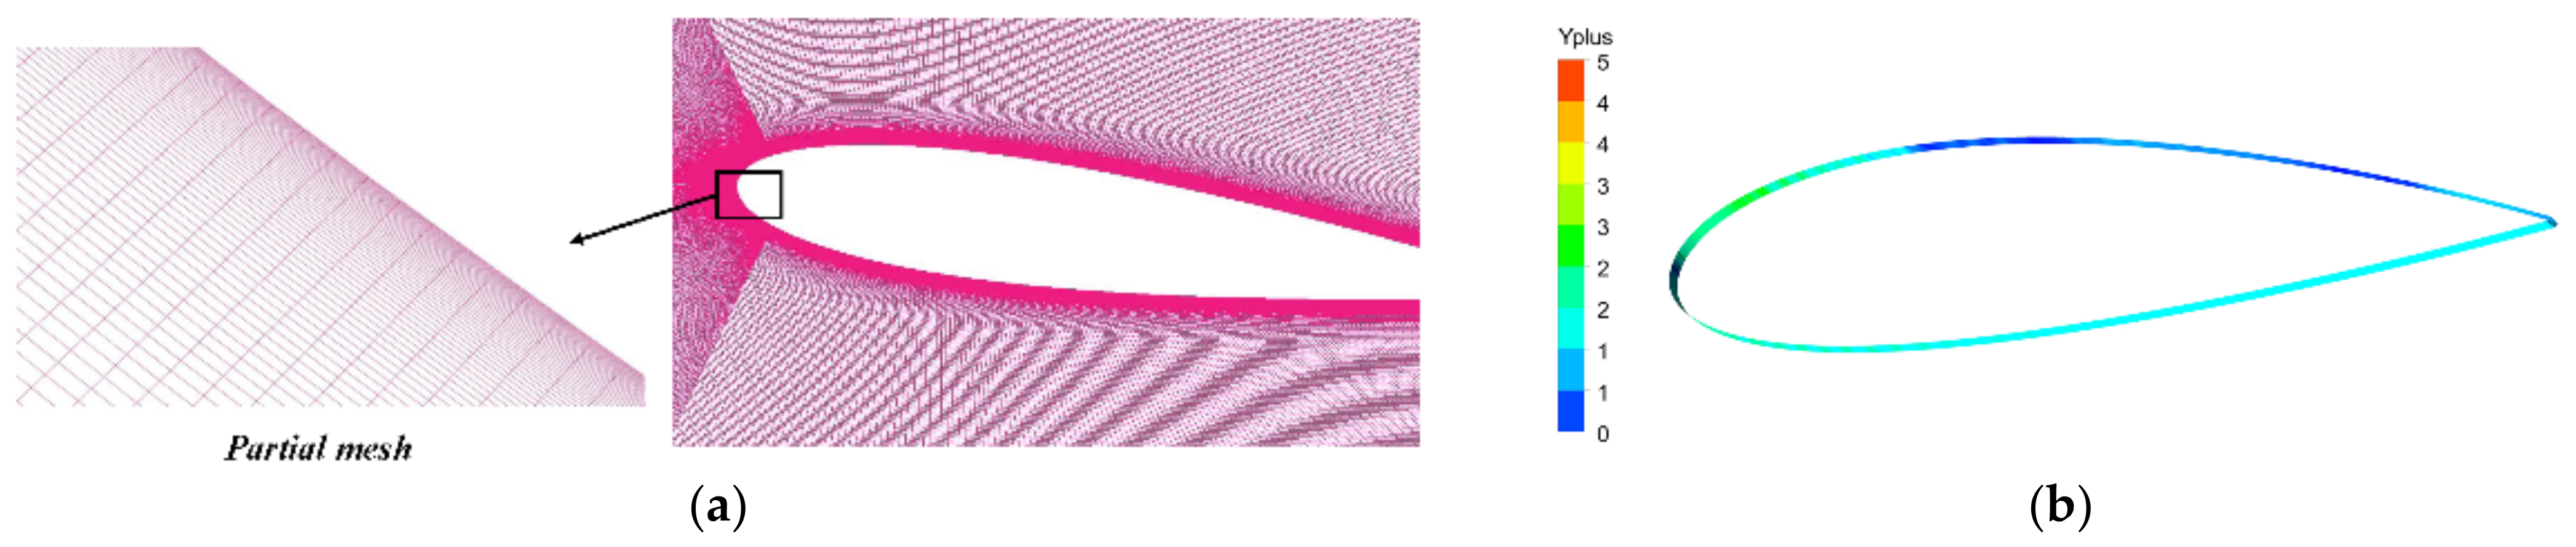
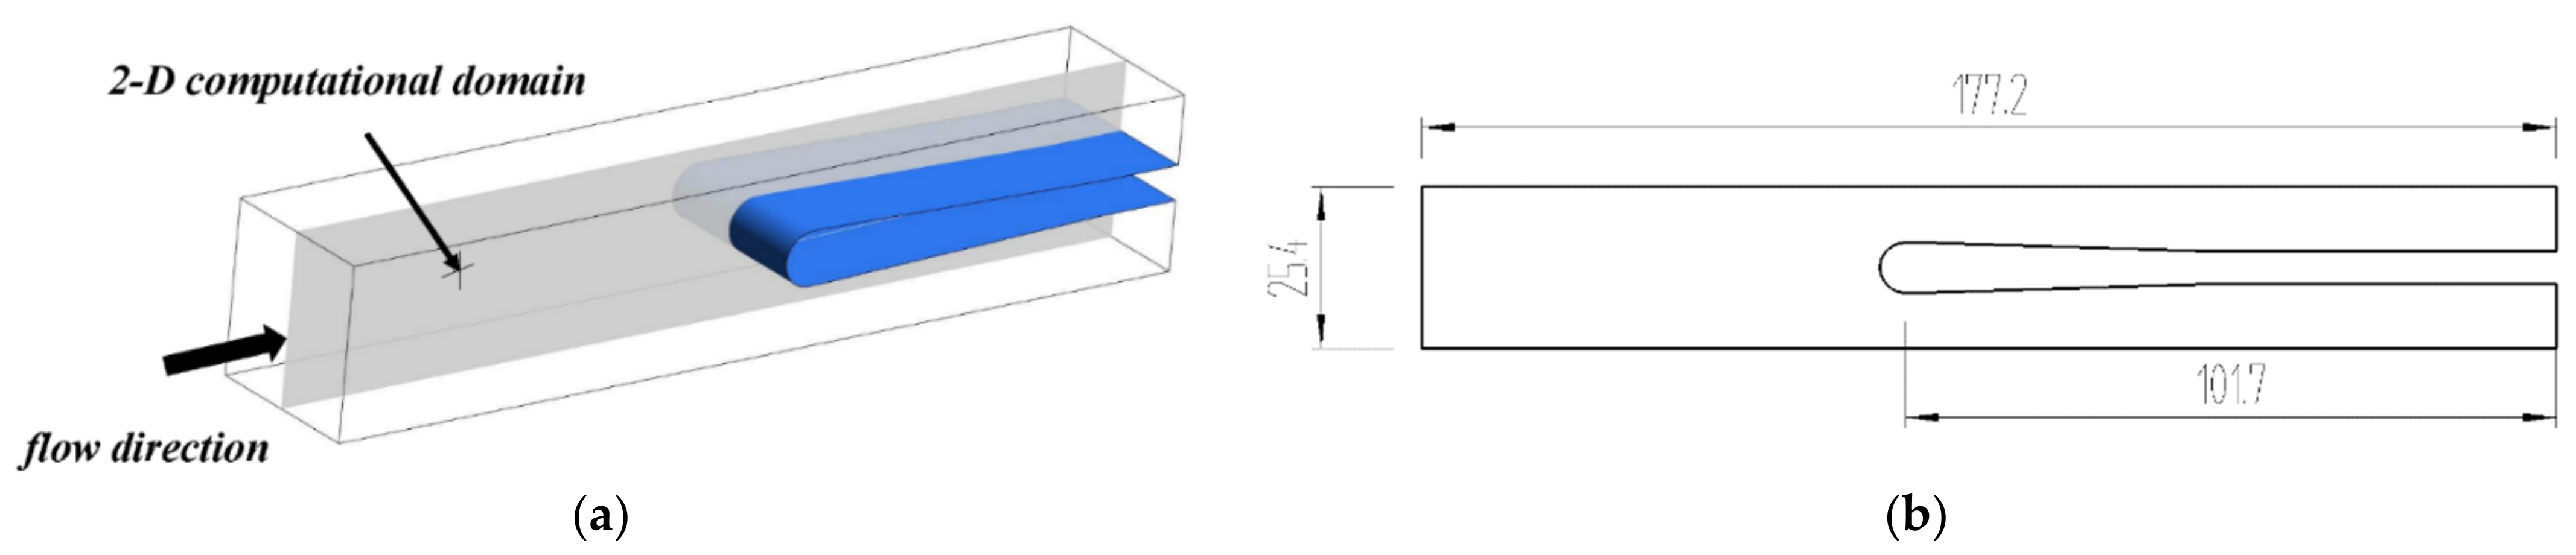
2.1. Computational Domain and Grid Division

The computational model is centered around the NACA0015 hydrofoil, featuring a chord length (c) of 50 mm and an angle of attack (α) of 7.5°, as depicted in Figure 1. The computational domain is discretized using quadrilateral grids. To accurately simulate the cavitation flow near the hydrofoil boundary, the wall region encompassing the entire hydrofoil is suitably refined to maintain that y+ ≤ 5. The key dimensionless parameters considered in the calculations encompass the incoming cavitation number (σ), lift coefficient (Cl), and drag coefficient (Cd):
σ = ( P i n P v ) / 0.5 ρ l u i n 2
C l = F y / 0.5 ρ l u i n 2 c
C d = F x / 0.5 ρ l u i n 2 c
where Pin is inlet pressure; Pv is saturation vapor pressure corresponding to inlet temperature; uin is inlet velocity; ρl is liquid density corresponding to inlet temperature; Fx and Fy are drag and lift on the hydrofoil, respectively; c is chord length.
In order to assess the grid independence of the computational domain, the stability of the lift coefficient of the hydrofoil with respect to the increasing number of grids was examined. To achieve this, five different grid division schemes were devised, and the corresponding number of grids for each scheme is presented in Table 1. To strike a balance between computational cost and accuracy, 477,732 grids were selected for the calculation. The grid distribution across the computational domain is illustrated in Figure 2.

2.2. The Control Equations

The numerical calculations for this study involve solving the control equations, which include the continuity equation, momentum equation, and energy equation. The Sauer–Schnerr cavitation model was adopted [31]:
S ˙ e = 3 α v 1 α v R B ρ v ρ l ρ m 2 3 P v T P ρ l 1 / 2 , P < P v T
S ˙ c = 3 α v 1 α v R B ρ v ρ l ρ m 2 3 P P v T ρ l 1 / 2 , P P v T
RB (bubble radius) can be expressed by the following formula:
R B = α v 1 α v 3 4 π 1 n 1 / 3
where αv is vapor-volume fraction; ρl, ρv, and ρm are liquid density, vapor density, and mixture density; RB is bubble radius; n is bubble-number density in the liquid.
To address the modeled stress loss issue in the Detached Eddy Simulation (DES), the Delayed Detached Eddy Simulation (DDES) method is employed. DDES introduces a de-lay function to reconstruct the DES length scale, considering the grid scale and vortex viscosity field [32,33]. This approach enables a more accurate capture of flow structures in the primary cavitation region, making DDES the preferred turbulence model for this study. The DDES turbulent transport equation based on the SST k-ω model is [34]:
( ρ k ) t + ( ρ k u i ) x i = x μ + μ t σ k 3 k x j + P k ρ k 3 / 2 / l D D E S
( ρ ω ) t + ( ρ ω u i ) x i = x j μ + μ t σ ω 3 ω x j + α 3 ω k P k β 3 ρ ω 2 + 2 ( 1 F 1 ) ρ 1 ω σ ω 2 k x j ω x j
μ t = ρ a 1 k max ( a 1 ω , S F 2 )
where the mixed functions F1 and F2 of the SST k-ω model can be represented as:
F 1 = tanh ( ξ 4 )
ξ = min max k β * ω d ω , 500 μ ρ d ω 2 ω , 4 ρ k D ω + σ ω 2 d ω 2
D ω + = max 2 ρ 1 σ ω 2 1 ω k x j ω x j , 10 10
F 2 = tanh η 2
η = max 2 k 1 / 2 β * ω d ω , 500 μ ρ d ω 2 ω
where dω is the distance from the calculation point to the wall surface; Pk is the turbulence-generation term caused by viscous forces, defined the same as the DES model; α1 = 5/9, β1 = 0.075, k1 = 1.176, σω1 = 2, α2 = 0.44, β2 = 0.0828, σk2 = 1, σω2 = 1/0.856, and a1 = 0.31, β* = 0.09.
l D D E S = l R A N S f d max 0 , l R A N S l L E S
l R A N S = k 1 / 2 β * ω
l L E S = C D E S Δ
C D E S = F 1 C D E S 1 + 1 F 1 C D E S 2
Δ = max Δ x , Δ y , Δ z
f d = 1 tanh C d 1 r d C d 2
r d = v t + v 1 2 S 2 + Ω 2 k 2 d ω 2
where fd is the delay function; rd is the delay factor; S is the value of the strain-rate tensor; Ω is the value of the curl tensor; Δ is the maximum side length of the unit; Constant k = 0.41, CDES1 = 0.78, CDES2 = 0.61, Cd1 = 8, and Cd2 = 3.

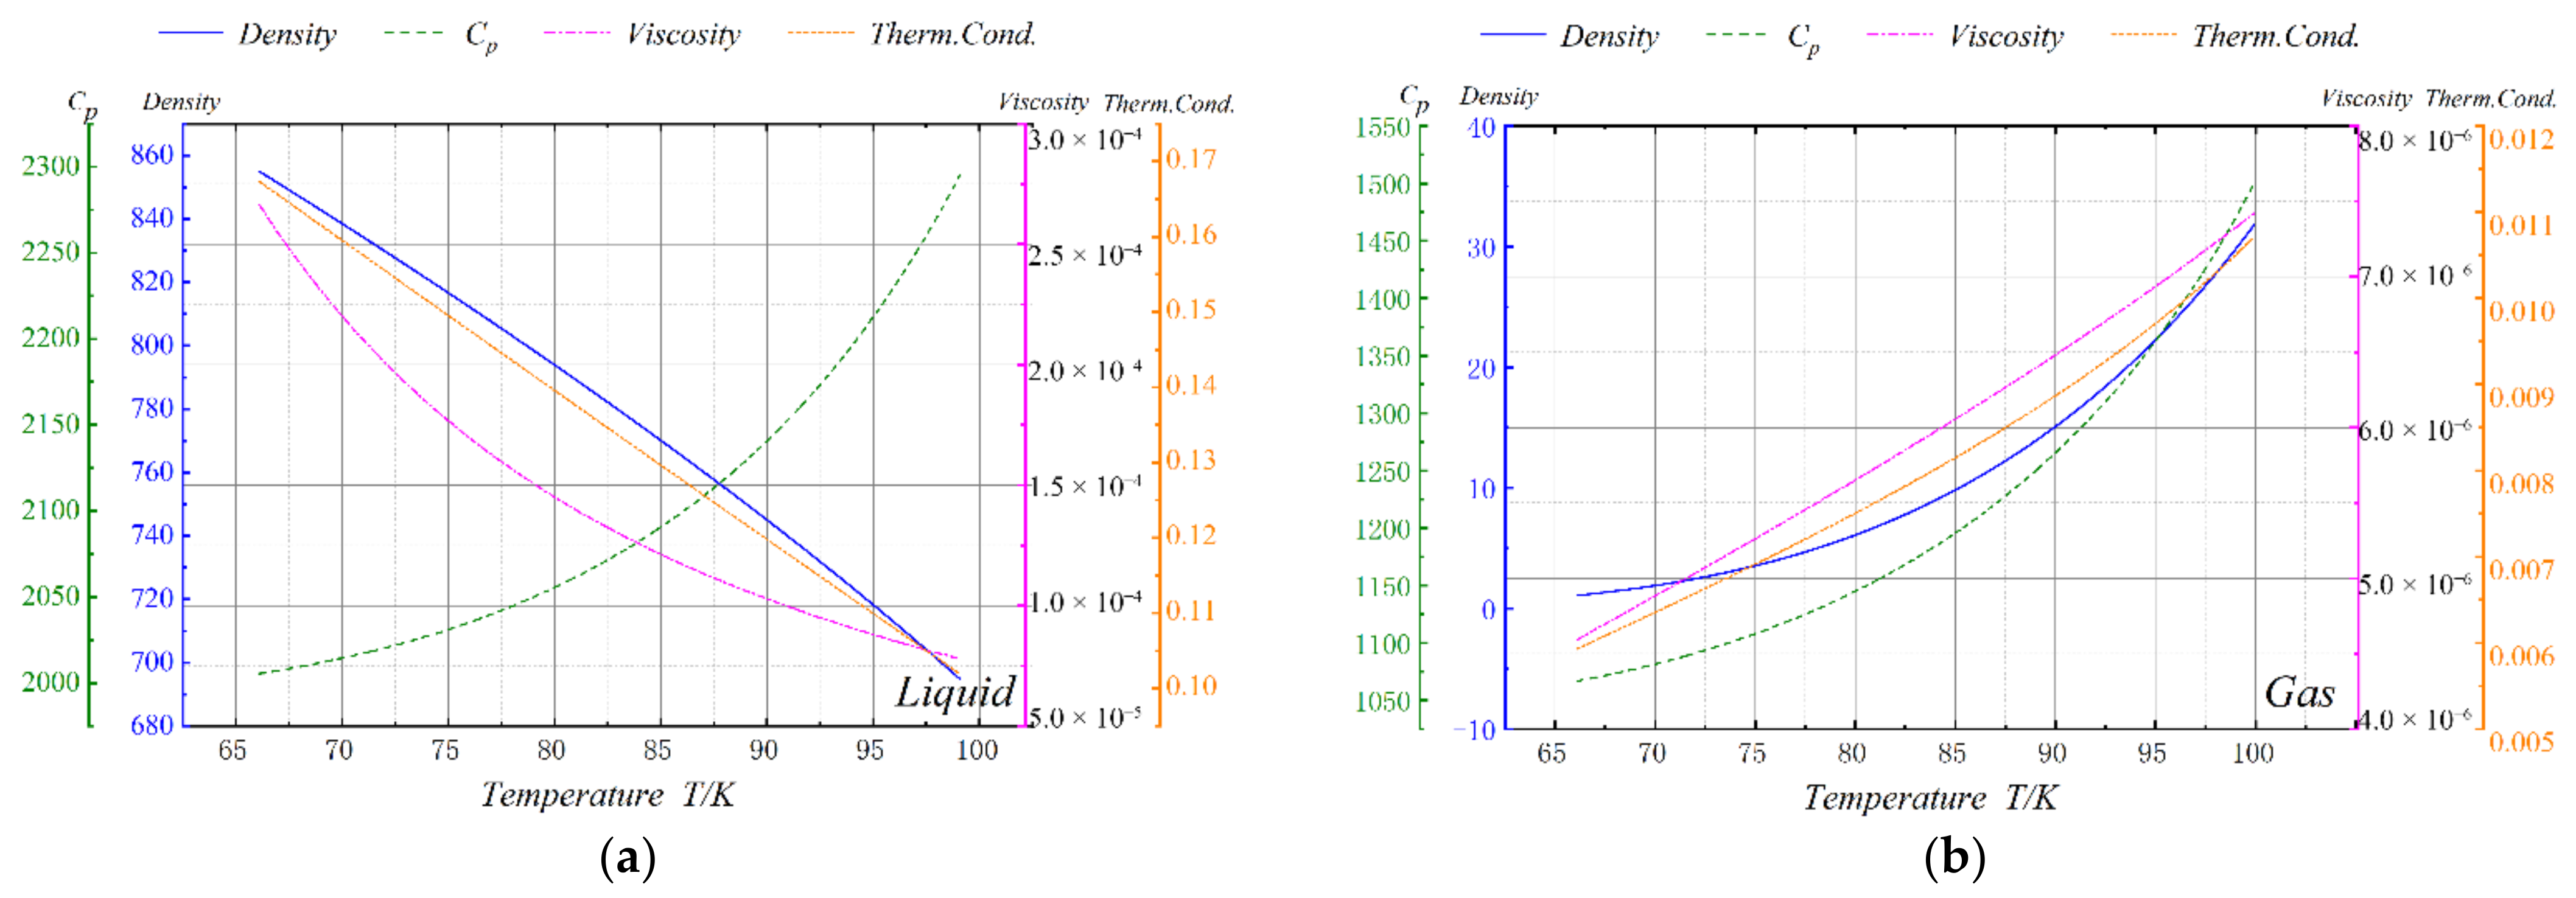
2.3. Boundary Conditions and Material Property Settings

All numerical computations were performed using Fluent. The boundary conditions were set as velocity inlet and pressure outlet, and the walls were treated as adiabatic surfaces. To enhance the convergence of the numerical computations, the SST k-ω turbulence model in conjunction with a pseudo-transient algorithm was initially employed for steady-state calculations. The results from the steady-state calculations were then used as the initial values for the unsteady cavitation flow numerical computations. A corresponding time step of 1 × 10⁻⁵ s was set. During the calculations, the variations of density, specific heat at constant pressure, dynamic viscosity, and heat-transfer coefficient with temperature were taken into account. For the numerical computation of cavitation flow in liquid nitrogen, the bubble-number density in the Sauer–Schnerr cavitation model was adjusted to 108 [35], and the variations in the parameter properties with temperature were implemented through a user-defined function (UDF). The curves illustrating the variations of the gas–liquid properties with temperature are shown in Figure 3.

2.4. Verification of the Numerical Calculation

In 1973, Hord conducted a series of wake-flow experiments sponsored by NASA, where temperature and pressure distributions on the surface of a symmetrical hydrofoil were measured for different inlet velocities and temperatures. In this section, the validation model was kept consistent with the hydrofoil used in the Hord experiments. The experimental data used are presented in Table 2. To save computational resources, a two-dimensional hydrofoil symmetrical grid was employed for the calculations. The inlet width of the hydrofoil was 25.4 mm, and the total channel length was 177.2 mm, as shown in Figure 4. The wall-surface range of the model, boundary conditions used in the calculations, cavitation model, turbulence model, and all material properties of liquid nitrogen were kept consistent with those used in the computation of the NACA0015 hydrofoil. During the computation process, the outlet pressure was continuously adjusted to match the inlet pressure values measured in the Hord experiments. The mean results of the numerical calculations at different time steps were compared with the experimental values.
Figure 5 and Figure 6 present the results of the numerical simulations for the 293A and 296B operating conditions using the modified bubble-number density. The maximum relative errors for pressure drop in the 293A condition do not exceed 11.4%, and for temperature drop, they do not exceed 0.43%. For the 296B condition, the maximum relative errors for pressure drop do not exceed 12.4%, and, for temperature drop, they do not exceed 0.22%. The validation results demonstrate that this numerical calculation method accurately captures the details of cryogenic cavitation flow in liquid nitrogen.

3. Results Analysis and Discussion

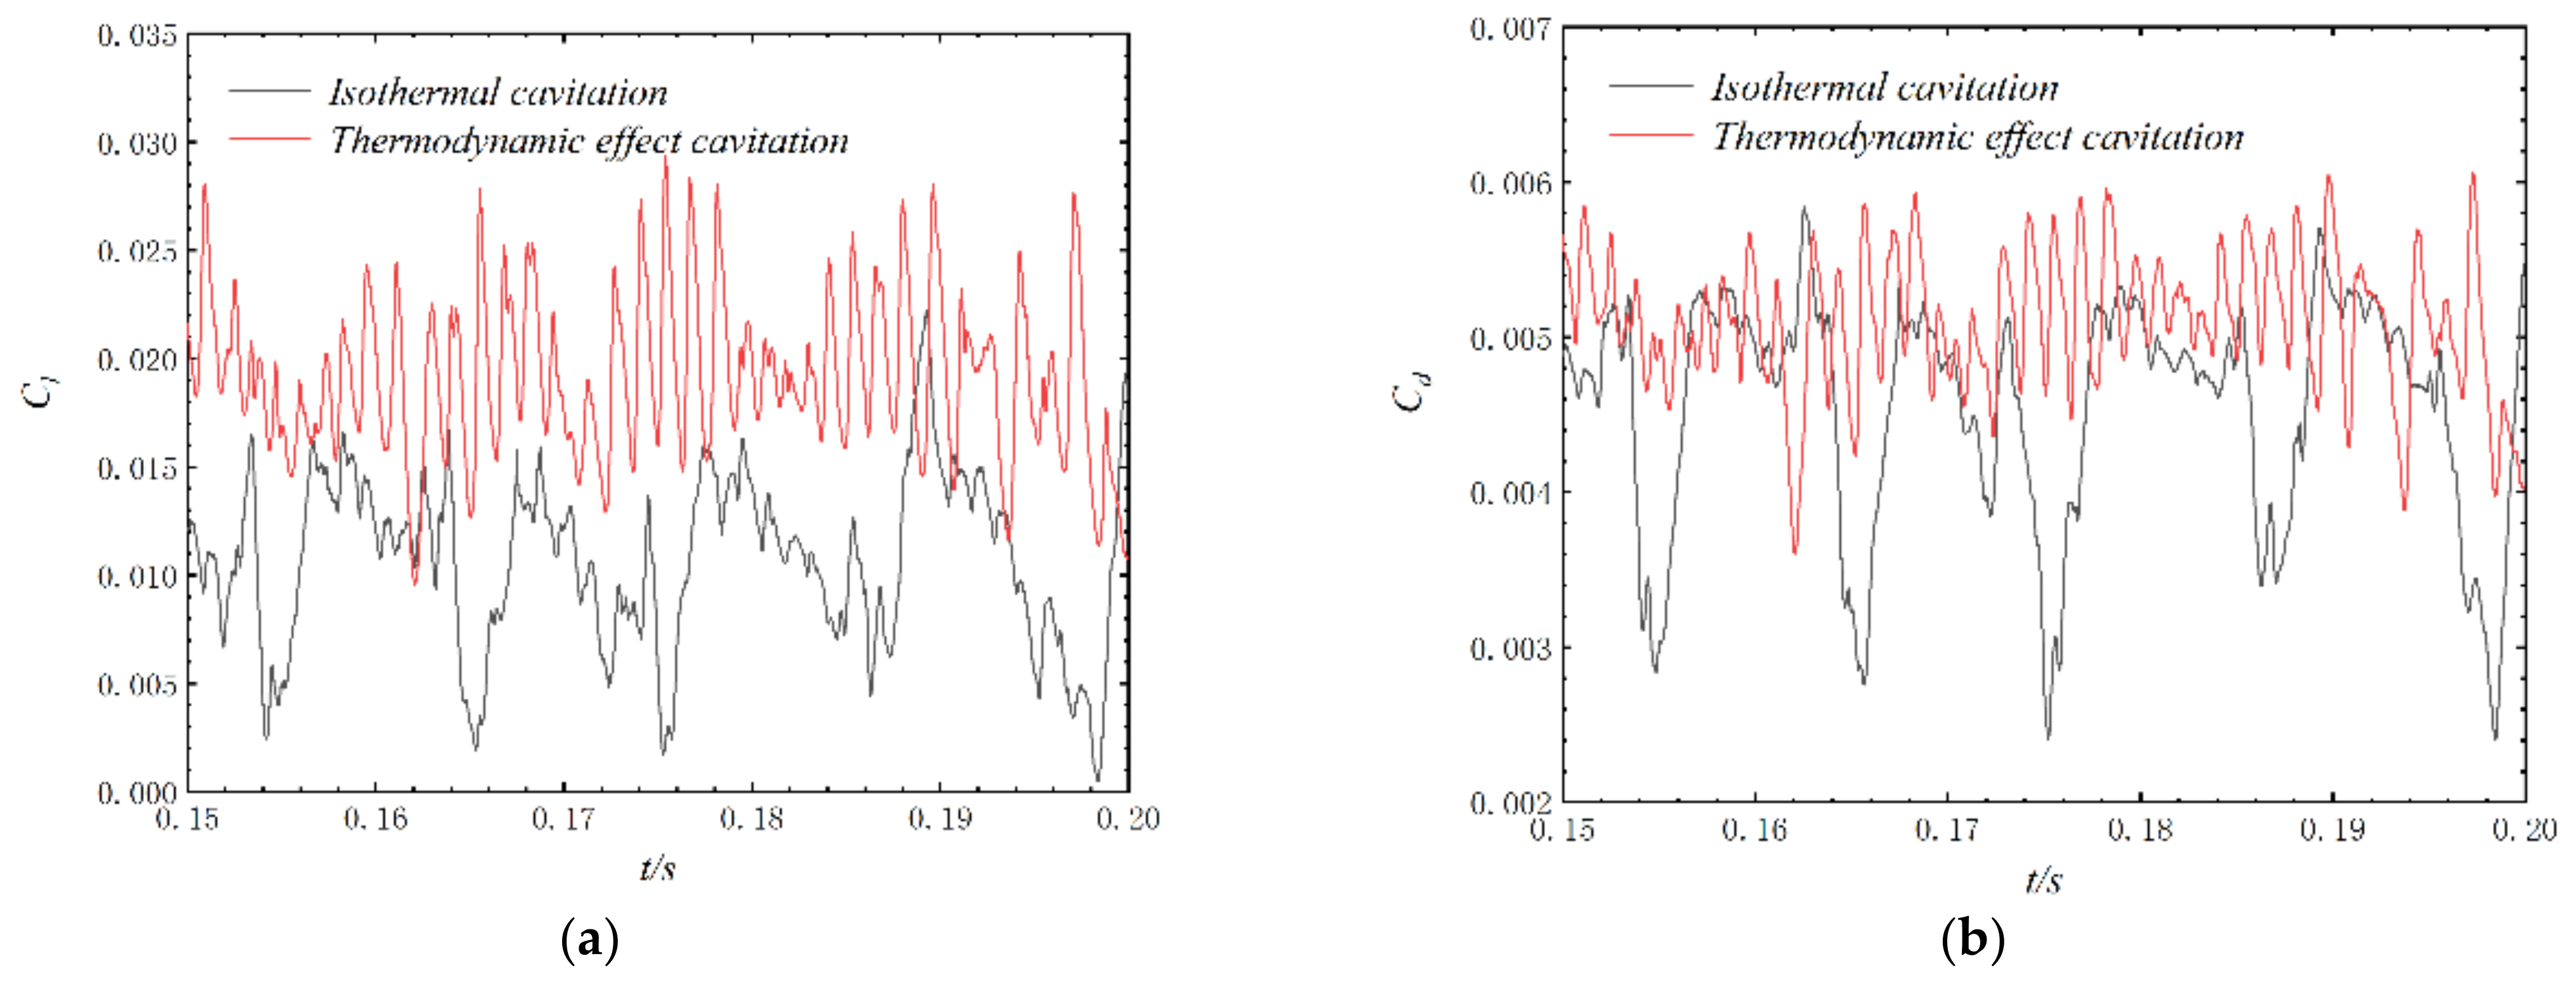
3.1. Lift and Drag Characteristics

Figure 7 displays the temporal evolution of the lift and drag coefficients of the hydrofoil for two scenarios: isothermal and thermodynamic effects. The calculation parameters encompass an inlet velocity (uin) of 23 m/s, inlet temperature (Tin) of 77 K, fluid density (ρl) corresponding to the inlet temperature of 807.392 kg/m3, and the saturated vapor pressure of liquid nitrogen (Pv) corresponding to the inlet temperature of 106606.4 Pa. The cavitation number of the inflow was calculated by Equation (1): σ = 0.616.
Observing the figure, it becomes evident that the lift and drag coefficients of the hydrofoil exhibit distinct periodic characteristics, irrespective of whether thermodynamic effects are taken into account. Upon considering the thermodynamic effects, both the lift coefficient (Cl) and the drag coefficient (Cd) exhibit increased amplitudes. The fluctuation amplitudes of both coefficients are notably higher in the isothermal cavitation case. However, after considering the thermodynamic effects, the periodic variation of the two coefficients becomes more complicated. In the subsequent sections, a detailed analysis will be provided to elucidate the underlying factors contributing to the complex periodic variations in the thermodynamic effects of cavitation.

3.2. Analysis of Thermodynamic Effects on Cavitation-Bubble Growth and Vortex-Shedding Characteristics

3.2.1. Isothermal Cavitation

To identify and extract the trailing-edge vortex structure of a hydrofoil, this study employs the widely used vortex-identification method based on the Q criterion, which has been commonly applied in recent years [36]. From the time-domain plot of the drag coefficient, it is evident that the cavitation flow around the NACA0015 hydrofoil exhibits significant periodic characteristics. The initial time is designated as t0, and subsequent times increase in Δt/12 increments. As depicted in Figure 8, at time t0, there is an inverse pressure gradient at the trailing edge of the hydrofoil that results in fluid backflow. As the inverse pressure gradient propagates upstream, it induces small-scale vortices. By t0 + 2Δt/12, the inverse pressure gradient reaches the leading edge of the hydrofoil, causing the cavitation region to detach as a whole. As depicted in Figure 9, during this detachment process, small-scale vortices combine into larger scale vortices, which subsequently shed from the trailing edge due to the influence of cavitation-bubble clusters. Starting from t0 + 6Δt/12, new attached cavities began to appear on the hydrofoil surface, and these cavities continued to grow until the upstream inverse pressure gradient urged them to separate again.

3.2.2. Thermodynamic Effect Cavitation

As depicted in Figure 10, when accounting for the thermodynamic effect, the cavitation effect noticeably diminishes under the same inflow cavitation number. The thermodynamic effect assumes a significant inhibitory role in cryogenic cavitation. Owing to the weakened cavitation effect, the cavitation region displays a distinctive “mist-like” structure that differs from isothermal cavitation. With the incorporation of the thermodynamic effect, the extent of the inverse pressure gradient is limited to the middle section of the hydrofoil, resulting in the detachment of the cavitation region commencing from the middle. In a similar vein, vorticity originates from the middle part of the hydrofoil. Initially, due to the disturbance of the inverse pressure gradient, a small-scale eddy current appeared. Subsequently, as the vortices progress downstream, they amalgamate and consolidate into large-scale vortices due to the interaction with cavitation bubbles, eventually shedding at the trailing edge (Figure 11).

3.3. Influence of Thermodynamic Effects on the Pressure Field and Velocity Field

3.3.1. Isothermal Cavitation

From Figure 12, it is evident that, at time t0, the entire suction surface of the hydrofoil is enveloped by the cavitation region, with the upper part of the surface completely submerged within the low-pressure region. At t0 + 2Δt/12, the low-pressure region begins to rupture, causing the cavities on the upper part of the suction surface to fragment. Following the fragmentation, small cavitation clusters move downstream with the main flow, continuously coalescing. By t0 + 6Δt/12, the small cavitation clusters amalgamate to form a large cavitation cluster that eventually sheds at the hydrofoil’s trailing edge. Subsequently, the low-pressure region reappears on the suction surface, initiating a new cycle of evolution until the primary cavitation region once again engulfs the entire surface.
Based on the existing research [37,38], the evolution of hydrofoil cavitation is closely linked to the phenomenon of re-entrant jet, and the progression of re-entrant jet is highly influenced by the range of inverse pressure gradients. In the subsequent analysis, the evolution of re-entrant jet within cavitation flow will be assessed in conjunction with velocity vectors. As depicted in Figure 13, the velocity-vector field at the hydrofoil’s trailing edge at t0 is presented. The incoming flow from the distant field bifurcates into the main flows along the suction surface and pressure surface upon traversing the hydrofoil’s leading edge. These two main flows converge at the hydrofoil’s trailing edge, forming a localized zone of high pressure and low velocity. This convergence region serves as the catalyst for the re-entrant jet. Following the occurrence of the re-entrant jet, it is propelled by the inverse pressure gradient, entering the lower-pressure cavity from the high-pressure convergence region and progressing upstream.
Figure 14 illustrates the distribution of velocity vectors along the suction surface of the hydrofoil at t0 + 3Δt/12. At this specific moment, the re-entrant jet originating from the high-pressure region at the hydrofoil’s trailing edge propagates towards the leading edge, triggering the overall detachment of the primary cavitation region. From the figure, it can be observed that, as the re-entrant jet infiltrates the primary cavitation region and progresses upstream, it interacts with the mainstream flow on the suction surface, resulting in the formation of a shear layer characterized by substantial velocity gradients. This shear layer, in turn, contributes to the formation of small-scale and large-scale vortex structures. These vortices serve as the primary mechanism driving the fragmentation of the primary cavitation region.

3.3.2. Thermodynamic Effect Cavitation

From Figure 15, this statement highlights the impact of thermodynamic effects on the hydrofoil’s evolution cycle. As illustrated in the figure, the front 1/3 of the hydrofoil’s suction surface consistently experiences coverage by a low-pressure region. Beyond this low-pressure region at the leading edge, large-scale fragmented areas of low pressure emerge, which are intricately tied to the evolution of vortices.
Figure 16 presents the distribution of velocity vectors on the suction surface of the hydrofoil at time t0, considering the thermodynamic effects. Upon examination of the figure, it becomes apparent that when the thermodynamic effects are taken into account, the adverse pressure gradient can only develop up to a specific point in the middle section of the hydrofoil, whereas, in isothermal cavitation, it extends all the way to the leading edge. As the adverse pressure gradient serves as the driving force for the re-entrant jet, its inability to develop up to the leading edge under thermodynamic effects prevents the overall detachment of the main cavitation region. Instead, it can only progress up to the middle section of the hydrofoil, leading to partial detachment of the main cavitation region.
When the thermodynamic effects are considered, the upstream development of the re-entrant jet exhibits distinct characteristics compared to isothermal cavitation. Under the influence of thermodynamic effects, at the same free stream cavitation number, the intensity of cavitation is significantly suppressed, resulting in increased liquid-phase content within the main cavitation region. Moreover, the re-entrant jet encounters higher resistance during its upstream development. In the figure, it can be observed that the interaction between the re-entrant jet and the mainstream flow on the suction surface, leading to the formation of large-scale vortices, takes place when considering thermodynamic effects. These large-scale vortices then interact with the upstream mainstream flow on the suction surface, consequently giving rise to the formation of localized re-entrant jets.

4. Conclusions and Prospects

This paper first validates the accuracy of the numerical computation framework through the Hord experimental results. Based on this, numerical simulations are performed to investigate the influence of thermodynamic effects on the unsteady cavitation flow around a two-dimensional NACA0015 hydrofoil in liquid nitrogen under the same inflow cavitation number.
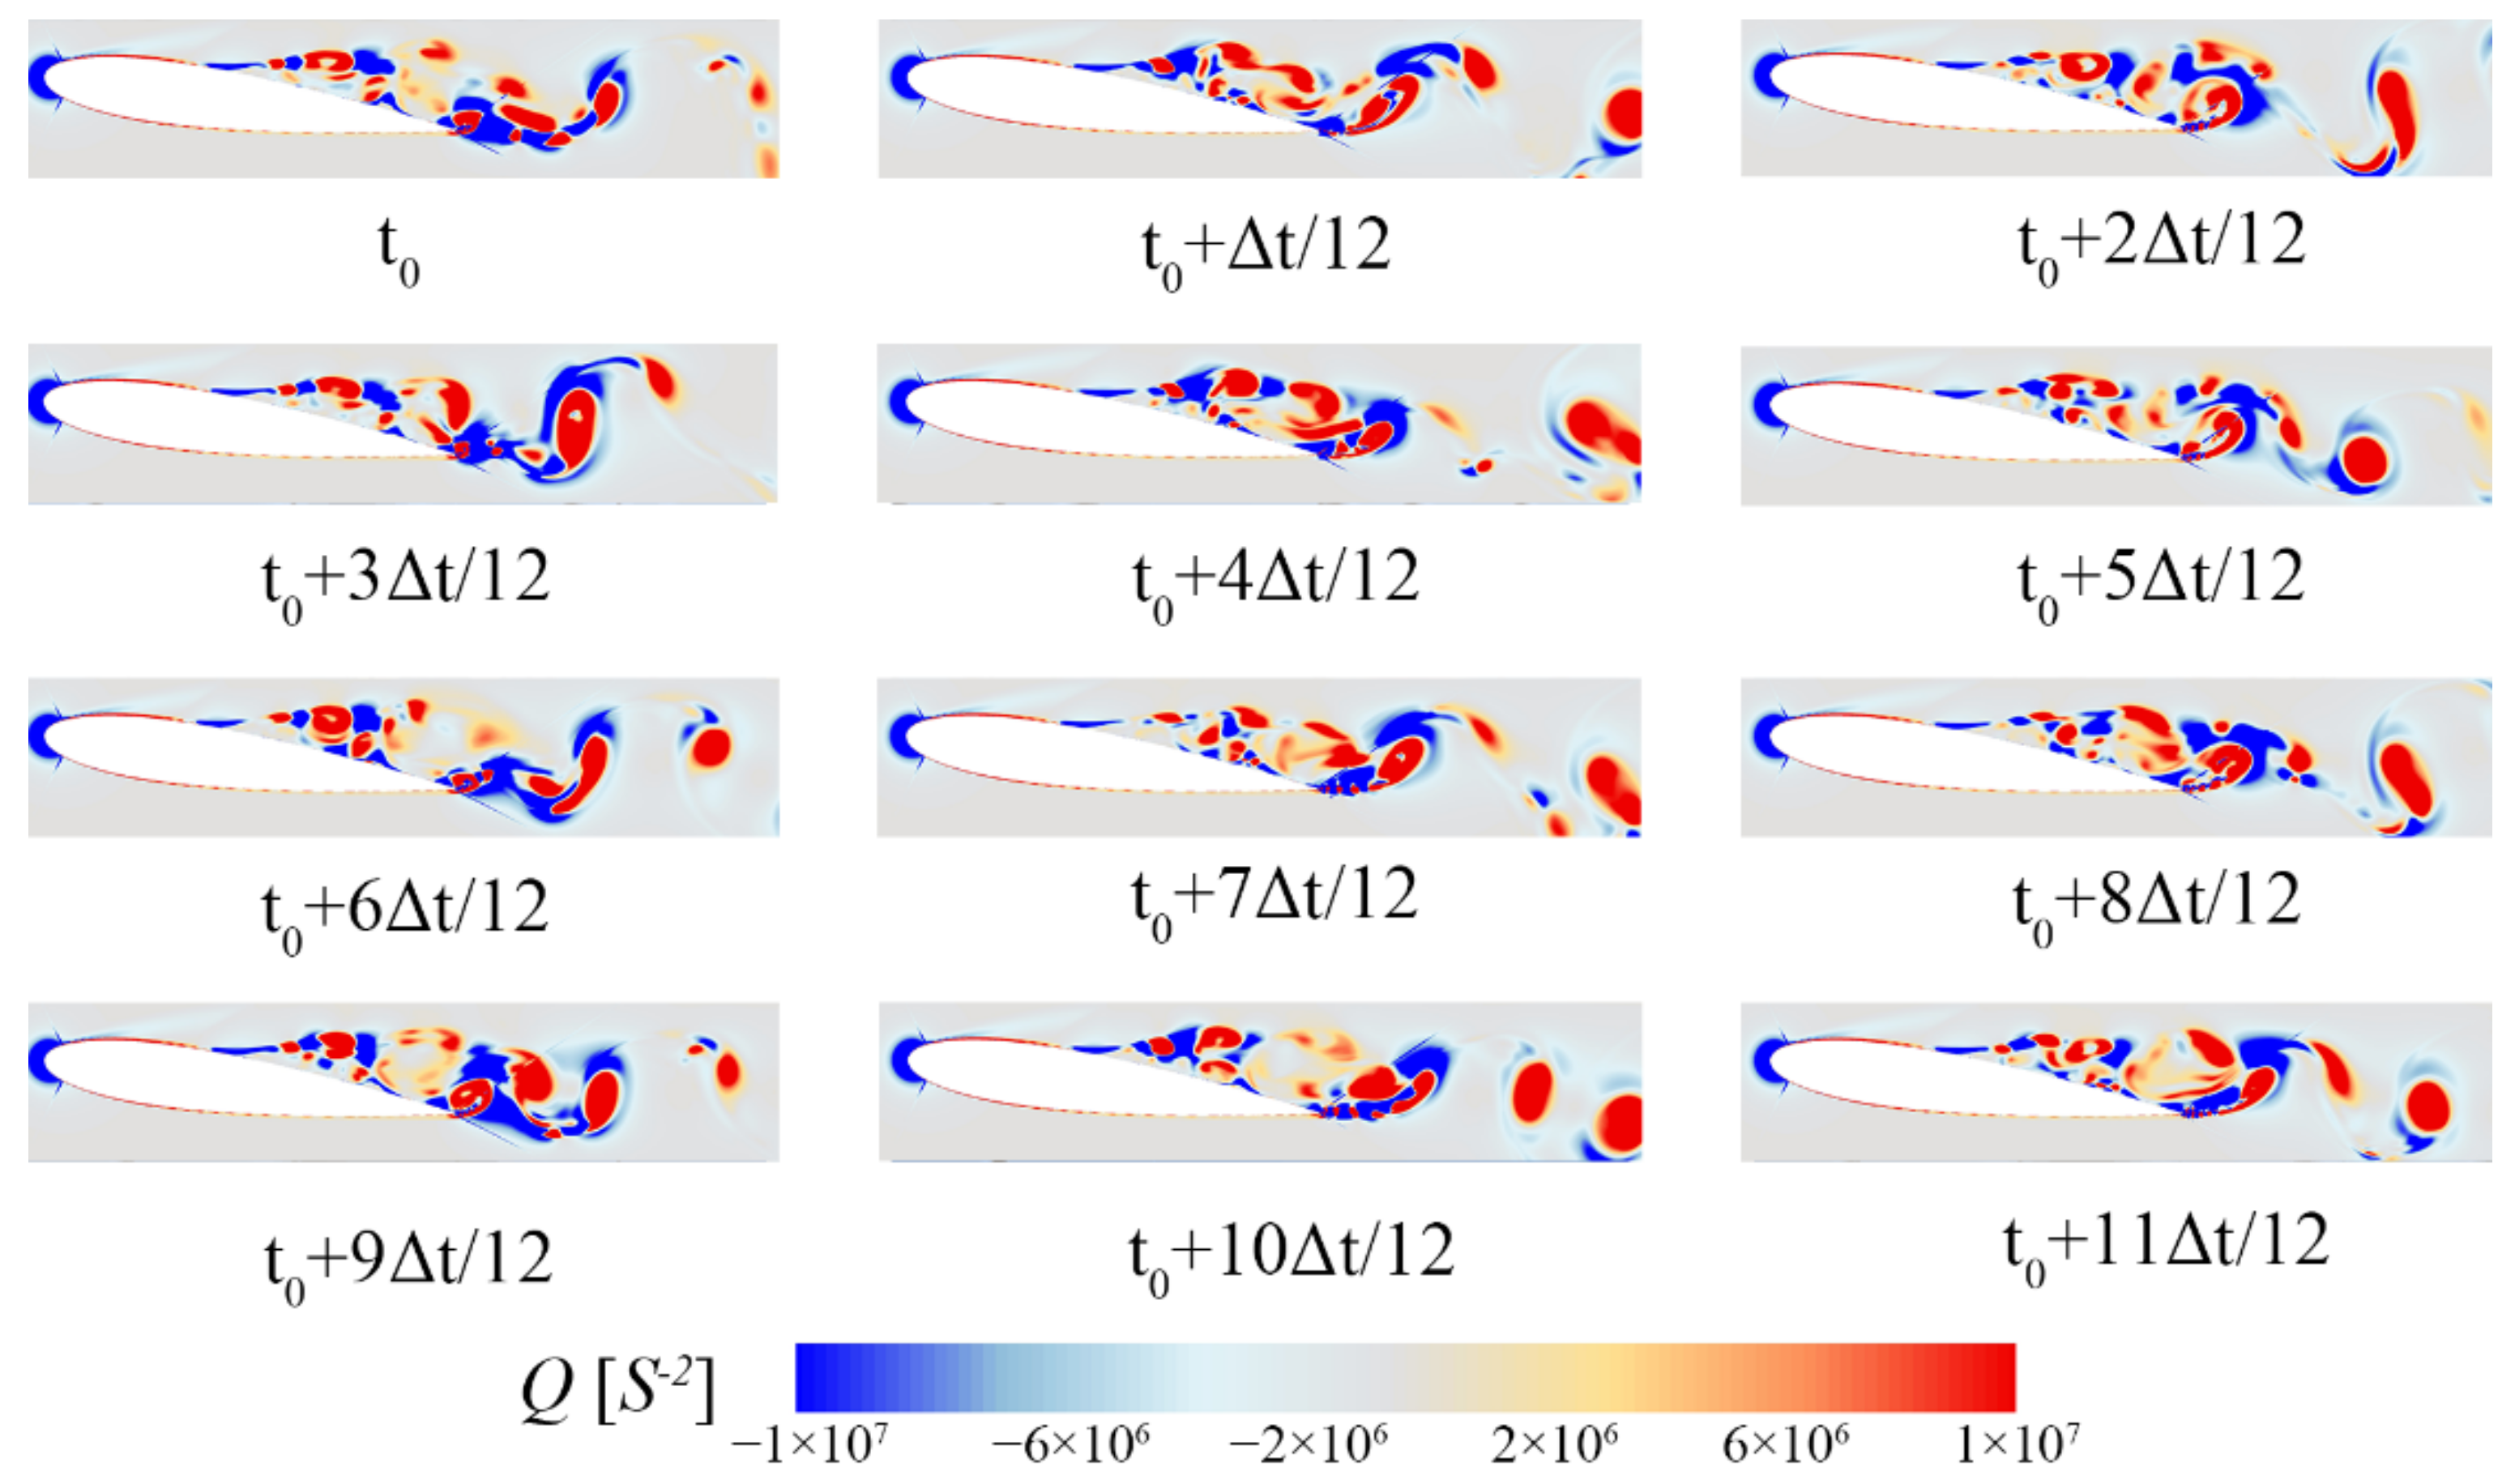
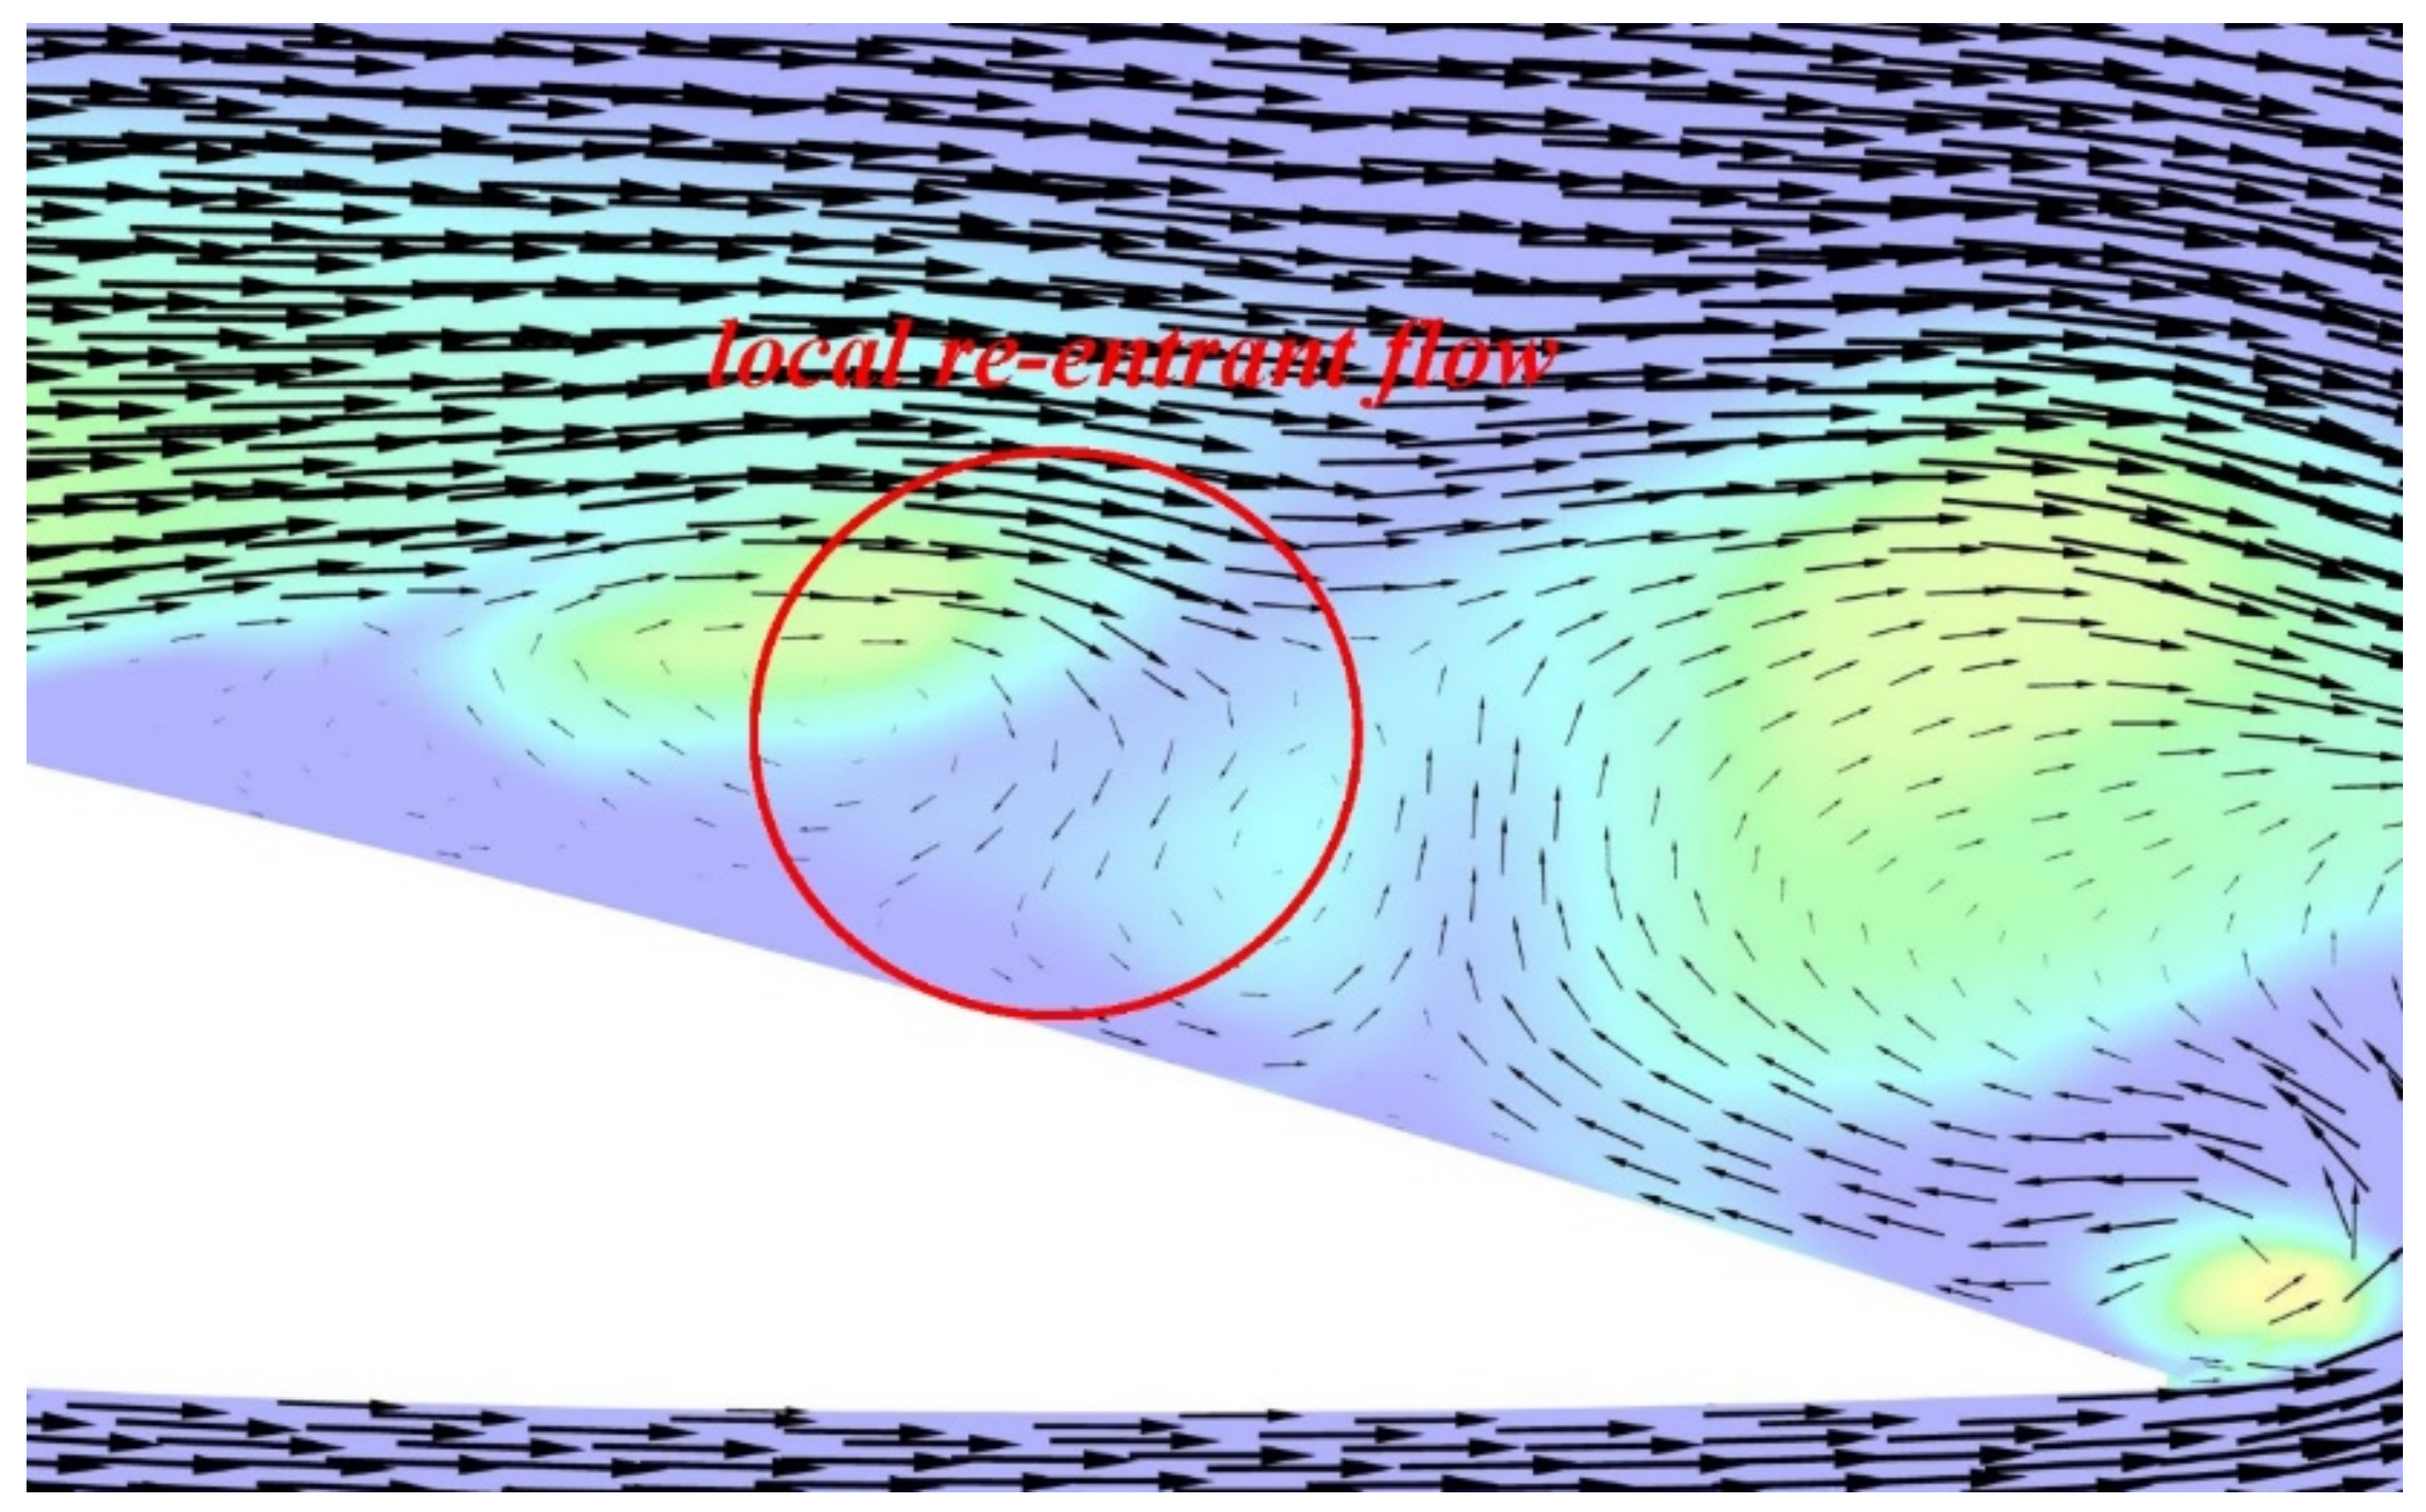
  • The validated numerical model was then employed to simulate the cavitation flow around the NACA0015 hydrofoil in liquid nitrogen without considering the thermodynamic effects. It was observed that the small-scale vortices induced by the upstream development of the re-entrant jet were the primary cause of fragmentation within the main cavitation region. The shedding motion of the bubbles contributed to the integration of these vortices;
  • Subsequently, the validated numerical model was utilized to simulate the cavitation flow around the NACA0015 hydrofoil in liquid nitrogen, this time taking into account the thermodynamic effects. It was observed that the cavitation effect was significantly diminished, resulting in a “mist-like” structure of the cavitation region. The incomplete development of the re-entrant jet upstream was identified as the fundamental reason for the inability of the cavitation cloud to detach as a whole;
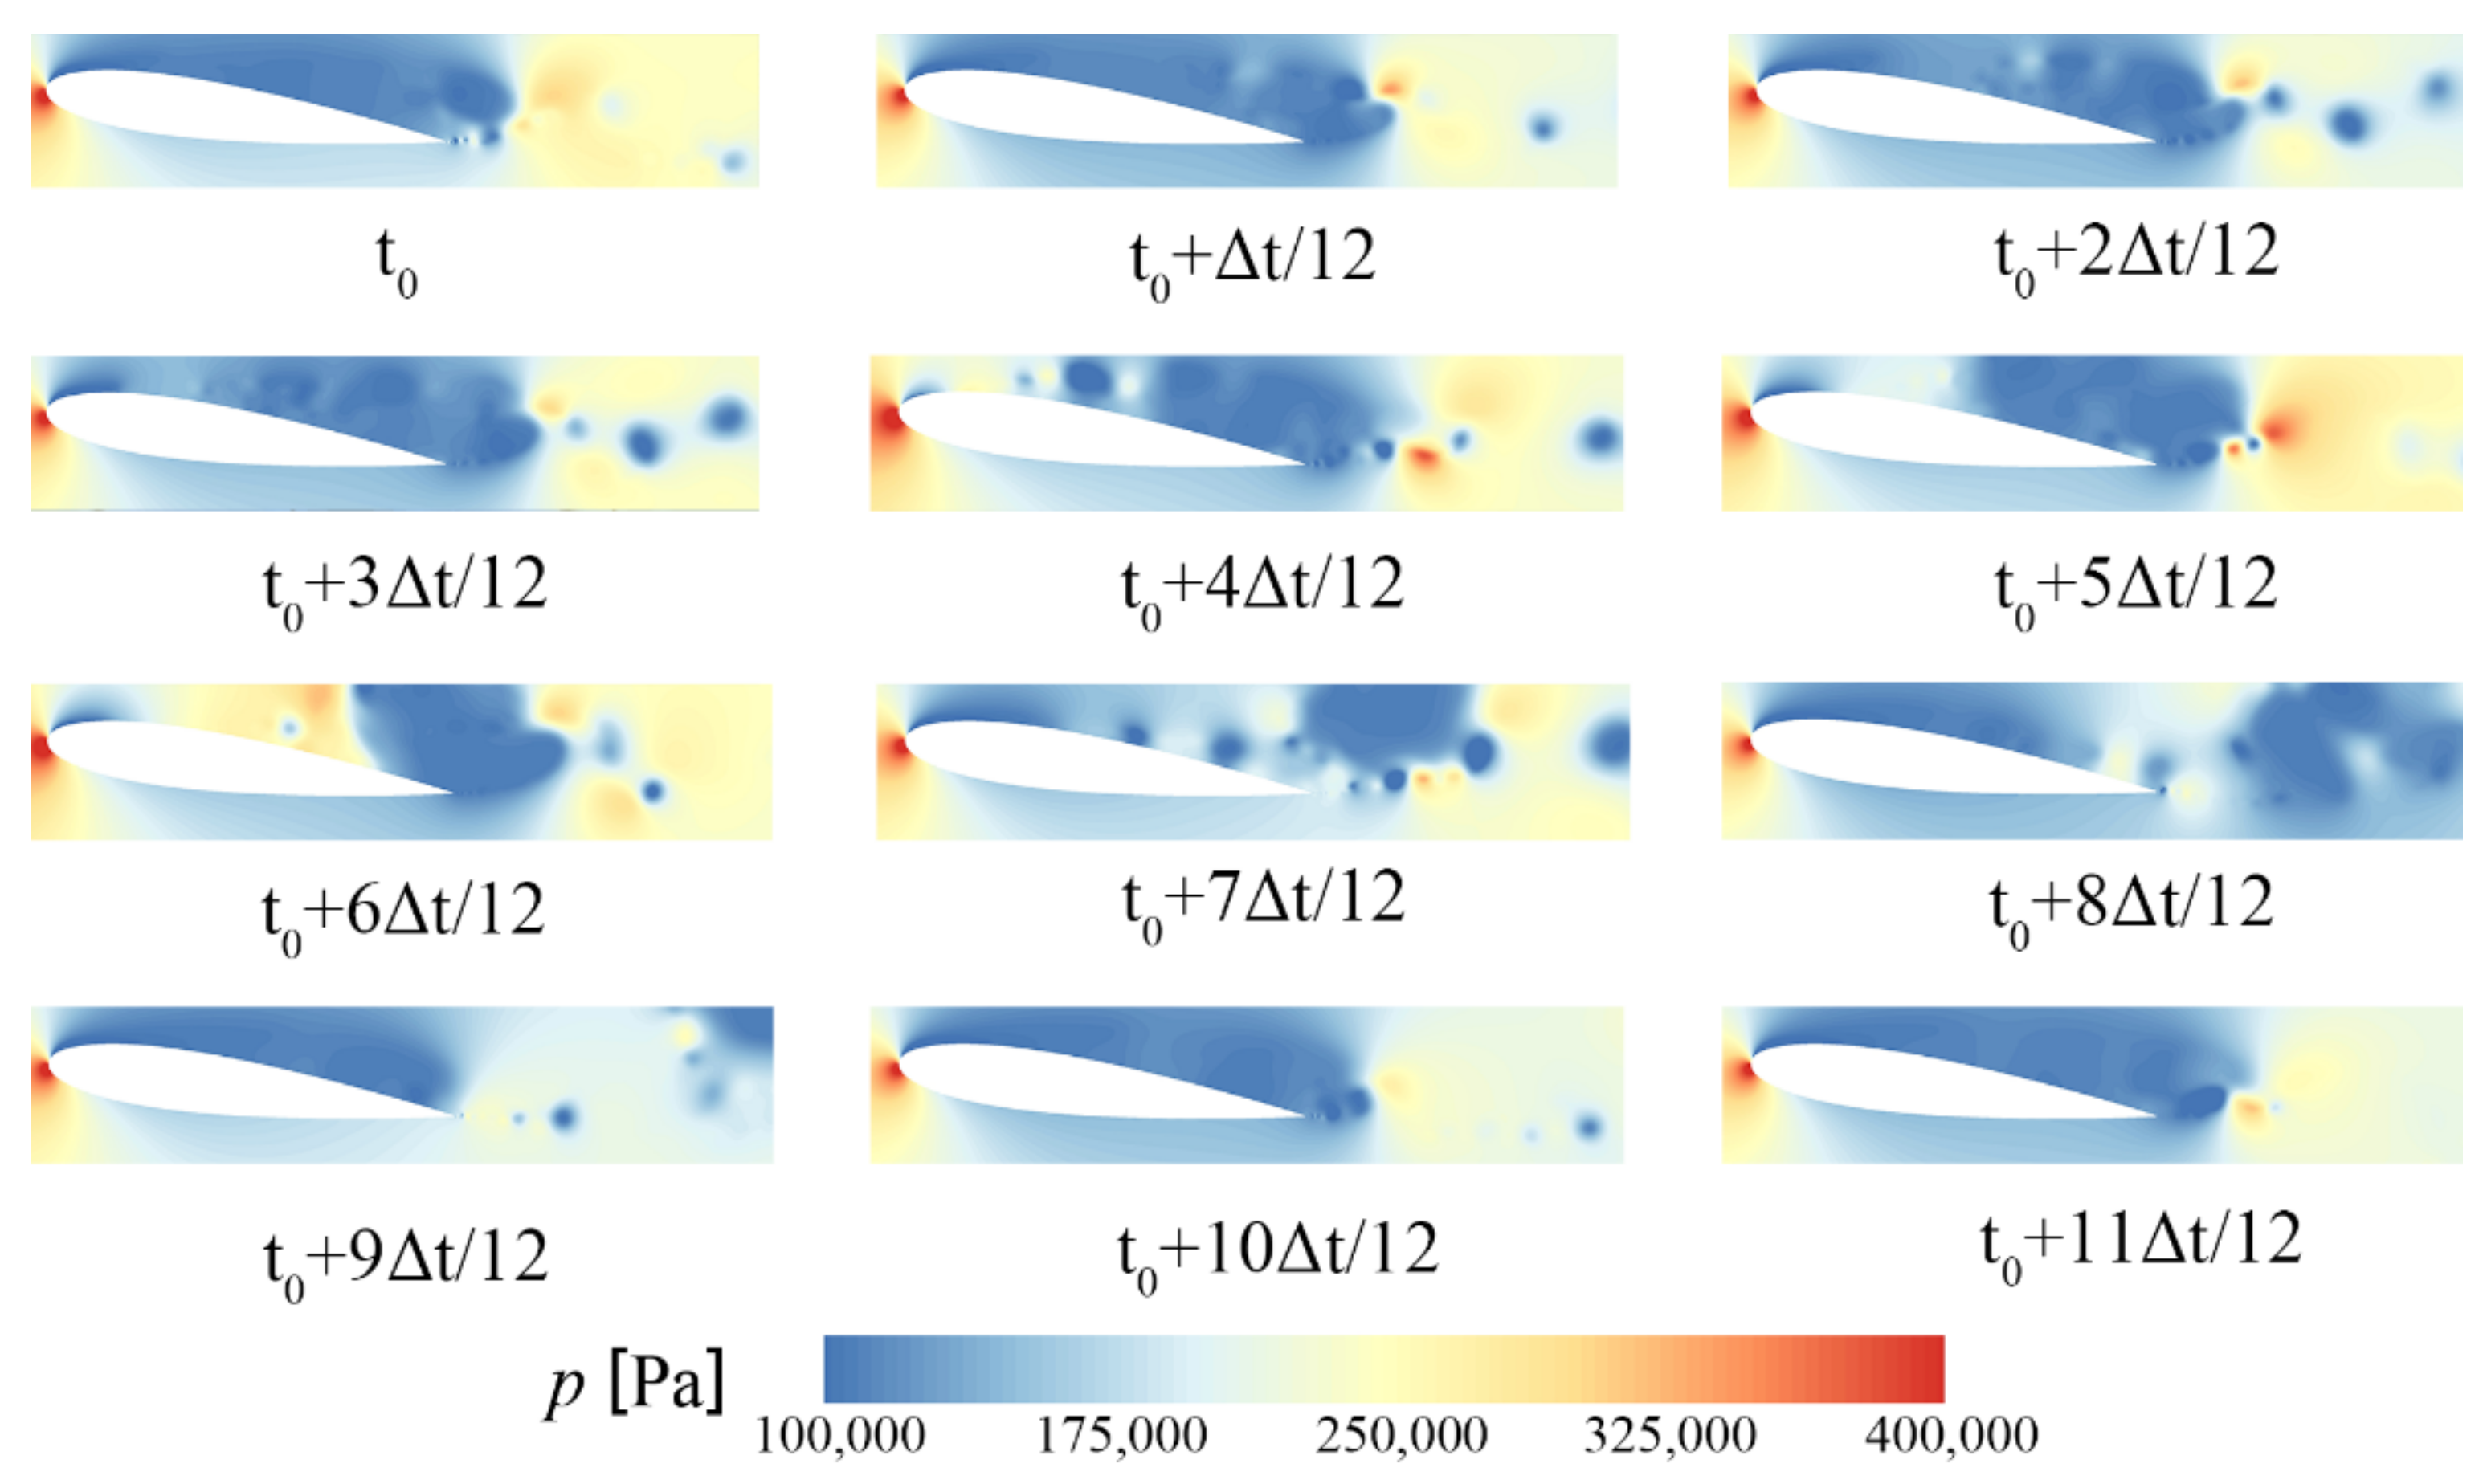
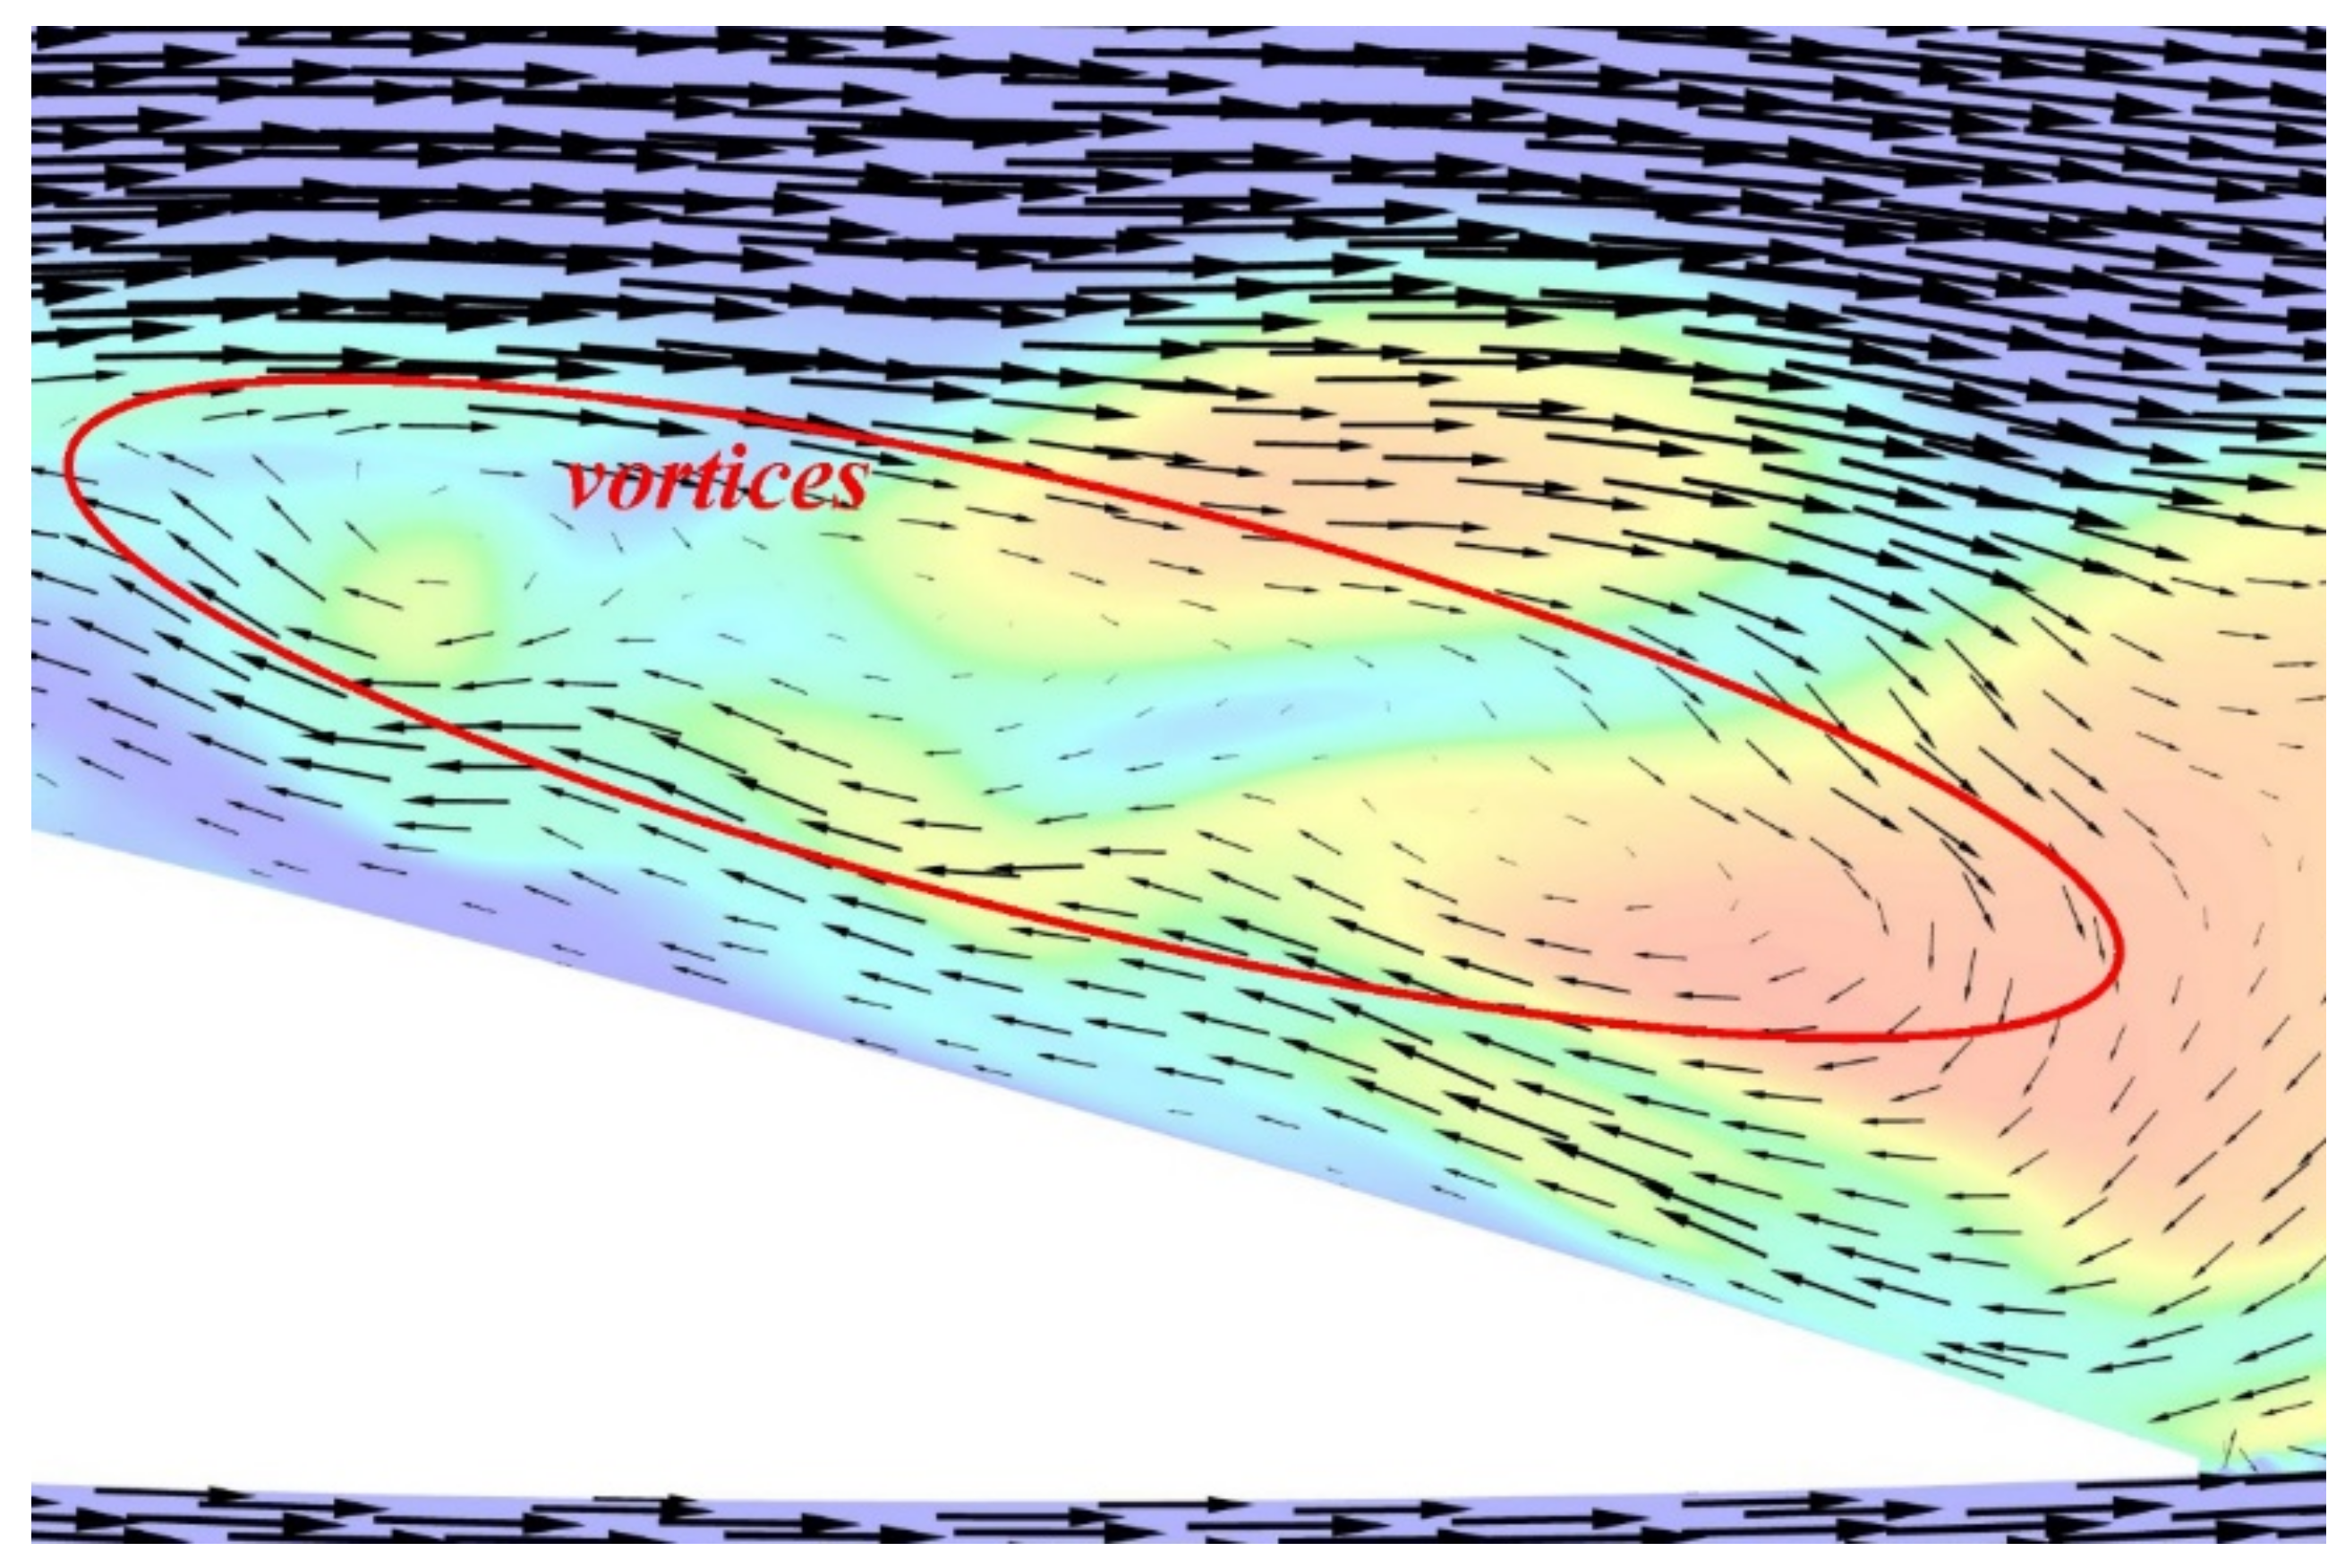
  • Irrespective of whether thermodynamic effects were considered or not, the re-entrant jet originated from the high-pressure, low-velocity region formed by the interaction of mainstream flows at the hydrofoil’s trailing edge. When thermodynamic effects were incorporated, the upstream development of the re-entrant jet faced greater obstacles, leading to the formation of larger-scale vortices compared to isothermal cavitation.
Due to the extreme difficulty in constructing a cavitation test rig under cryogenic conditions, this study did not perform numerical computation verification for the same physical model, which has certain limitations. In the future, it would be worthwhile to attempt cryogenic cavitation experiments around a NACA0015 hydrofoil in liquid nitrogen, followed by investigating more accurate three-dimensional LES numerical computation methods for cryogenic cavitation flow.

Author Contributions

Methodology, Y.F. (Yuzhuang Fu); investigation, B.G.; validation, D.N.; resources, W.Z.; data curation, Y.F. (Yanxia Fu). All authors have read and agreed to the published version of the manuscript.

Funding

The authors gratefully acknowledge the financial support of the National Natural Science Foundation of China (52376024, 51706086, 51706087), a Project Funded by the Six Talent Peaks Project in Jiangsu Province (KTHY-060), a Project Funded by the Fundamental Science Research Project of Jiangsu Higher Education Institutions (22KJB570002), a Project funded by China Postdoctoral Science Foundation (2022 M722144), a Project Funded by the Industrial Science and Technology of Taizhou (22gyb43), a Project Funded by the Priority Academic Program Development of Jiangsu Higher Education Institutions (PAPD).

Data Availability Statement

Not applicable.

Conflicts of Interest

The authors declare no conflict of interest.

Abbreviations

Acronyms
CFDComputational Fluid Dynamics
DDESDelayed Detached Eddy Simulation
DESDetached Eddy Simulation
PANSPartially Averaged Navier–Stokes model
Symbols
cChord length
αAngle of attack
σIncoming cavitation number
ClLift coefficient
CdDrag coefficient
PvSaturation vapor pressure

References

  1. Xiang, L.; Tan, Y.; Chen, H.; Xu, K. Experimental investigation of cavitation instabilities in inducer with different tip clearances. Chin. J. Aeronaut. 2021, 34, 168–177. [Google Scholar] [CrossRef]
  2. Li, D.; Ren, Z.; Li, Y.; Gong, R.; Wang, H. Thermodynamic effects on the cavitation flow of a liquid oxygen turbopump. Cryogenics 2021, 116, 103302. [Google Scholar] [CrossRef]
  3. Wang, C.; Xiang, L.; Tan, Y.; Chen, H.; Xu, K. Experimental investigation of thermal effect on cavitation characteristics in a liquid rocket engine turbopump inducer. Chin. J. Aeronaut. 2021, 34, 48–57. [Google Scholar] [CrossRef]
  4. Stahl, H.A.; Stephanoff, A.J. Thermodynamic aspects of cavitation in centrifugal pumps. ASME J. Basic Eng. 1956, 78, 1691–1693. [Google Scholar] [CrossRef]
  5. Kou, G.; Li, X.; Wang, Y.; Lin, M.; Zeng, Y.; Yang, X.; Yang, Y.; Gan, Z. CFD Simulation of Airflow Dynamics During Cough Based on CT-Scanned Respiratory Airway Geometries. Symmetry 2018, 10, 595. [Google Scholar] [CrossRef]
  6. Manzoor, R.; Ghaffar, A.; Baleanu, D.; Nisar, K.S. Numerical Analysis of Fluid Forces for Flow Past a Square Rod with Detached Dual Control Rods at Various Gap Spacing. Symmetry 2020, 12, 159. [Google Scholar] [CrossRef]
  7. Li, J.; Quan, Z.; Zhang, Y.; Cao, L.; Li, C. Computational Fluid Dynamics Based Kriging Prediction on Flutter Derivatives of Flat Steel Box Girders. Symmetry 2022, 14, 1304. [Google Scholar] [CrossRef]
  8. Fedorova, E.; Pupysheva, E.; Morgunov, V. Modelling of Red-Mud Particle-Solid Distribution in the Feeder Cup of a Thickener Using the Combined CFD-DPM Approach. Symmetry 2022, 14, 2314. [Google Scholar] [CrossRef]
  9. Rodio, M.G.; Giorgi, M.G.; Ficarella, A. Influence of convective heat transfer modeling on the estimation of thermal effects in cryogenic cavitating flows. Int. J. Heat. Mass. Transf. 2012, 55, 6538–6554. [Google Scholar] [CrossRef]
  10. Ahuja, V.; Hosangadi, A.; Arunajatesan, S. Simulations of cavitating flows using hybrid unstructured meshes. J. Fluids Eng. 2001, 123, 331–340. [Google Scholar] [CrossRef]
  11. Zhang, X.B.; Qiu, L.M.; Gao, Y.; Zhang, X.J. Computational fluid dynamic study on cavitation in liquid nitrogen. Cryogenics 2008, 48, 432–438. [Google Scholar] [CrossRef]
  12. Zhang, X.B.; Qiu, L.M.; Qi, H.; Zhang, X.J.; Gan, Z.H. Modeling liquid hydrogen cavitating flow with the full cavitation model. Int. J. Hydrogen Energy 2008, 33, 7197–7206. [Google Scholar] [CrossRef]
  13. Sun, T.Z.; Wei, Y.J.; Wang, C.; Zhao, C.G. Three-dimensional numerical simulation of cryogenic cavitating flows of liquid nitrogen around hydrofoil. J. Ship Mech. 2014, 18, 1434–1443. [Google Scholar]
  14. Zhang, S.F.; Li, X.J.; Zhu, Z.C. Numerical simulation of cryogenic cavitating flow by an extended transport-based cavitation model with thermal effects. Cryogenics 2018, 92, 98–104. [Google Scholar] [CrossRef]
  15. Li, X.; Shen, T.; Li, P.; Guo, X.; Zhu, Z. Extended compressible thermal cavitation model for the numerical simulation of cryogenic cavitating flow. Int. J. Hydrogen Energy 2020, 45, 10104–10118. [Google Scholar] [CrossRef]
  16. Li, W.G.; Yu, Z.B.; Kadam, S. An improved cavitation model with thermodynamic effect and multiple cavitation regimes. Int. J. Heat Mass Transf. 2023, 205, 123854. [Google Scholar] [CrossRef]
  17. Girimaji, S.S.; Jeong, E.; Srinivasan, R. Partially averaged Navier-Stokes method for turbulence: Fixed point analysis and comparison with unsteady partially averaged Navier-Stokes. J. Appl. Mech. 2006, 73, 422–429. [Google Scholar] [CrossRef]
  18. Ji, B.; Luo, X.; Wu, Y.; Peng, X.; Duan, Y. Numerical analysis of unsteady cavitating turbulent flow and shedding horse-shoe vortex structure around a twisted hydrofoil. Int. J. Multiph. Flow. 2013, 51, 33–43. [Google Scholar] [CrossRef]
  19. Zhang, N.; Liu, X.K.; Gao, B.; Xia, B. DDES analysis of the unsteady wake flow and its evolution of a centrifugal pump. Renew. Energy 2019, 141, 570–582. [Google Scholar] [CrossRef]
  20. Zhang, N.; Jiang, J.X.; Gao, B.; Liu, X.K. DDES analysis of unsteady flow evolution and pressure pulsation at off-design condition of a centrifugal pump. Renew. Energy 2020, 153, 193–204. [Google Scholar] [CrossRef]
  21. Gao, B.; Zhou, Z.W.; Ni, D.; Zhang, N.; Gu, J.R. Effects of offset blade on the pressure pulsation and wake structures in a centrifugal pump. J. Drain. Irrig. Mach. Eng. 2022, 40, 766–770. [Google Scholar]
  22. Hord, J. Cavitation in Liquid Cryogens, II-Hydrofoil; NASA Contractor Reports, CR-2156, USA; NASA: Washington, DC, USA, 1973. [Google Scholar]
  23. Hord, J.; Anderson, L.M.; Hall, W.J. Cavitation in Liquid Cryogens I-Venturi; NASA CR-2045, USA; NASA: Washington, DC, USA, 1972. [Google Scholar]
  24. Hord, J. Cavitation in Liquid Cryogens III-Ogives; NASA CR-2242, USA; NASA: Washington, DC, USA, 1973. [Google Scholar]
  25. Hord, J. Cavitation in Liquid Cryogens IV-Combined Correlations for Venturi, Hydrofoil, Ogives, and Pumps; NASA CR-2448, USA; NASA: Washington, DC, USA, 1974. [Google Scholar]
  26. Niiyama, K.; Hasegawa, S.I.; Tsuda, S.; Yoshida, Y.; Tamura, T.; Oike, M. Thermodynamic effects on cryogenic cavitating flow in an orifice. Cryogenics 2009, 116, 103302. [Google Scholar]
  27. Cervone, A.; Testa, R.; Bramanti, C.; Rapposelli, E.; d’Agostino, L. Thermal effects on cavitation instabilities in helical inducers. J. Propuls. Power 2005, 21, 893–899. [Google Scholar] [CrossRef]
  28. Cervone, A.; Bramanti, C.; Rapposelli, E.; d’Agostino, L. Thermal cavitation experiments on a NACA0015 hydrofoil. J. Fluids Eng. 2006, 128, 953–956. [Google Scholar]
  29. Chen, T.; Chen, H.; Liu, W.; Huang, B.; Wang, G. Unsteady characteristics of liquid nitrogen cavitating flows in different thermal cavitation mode. Appl. Therm. Eng. 2019, 156, 63–76. [Google Scholar] [CrossRef]
  30. Chen, T.R.; Chen, H.; Liang, W.D.; Huang, B.; Xiang, L. Experimental investigation of liquid nitrogen cavitating flows in converging-diverging nozzle with special emphasis thermal transition. Int. J. Heat Mass Transf. 2019, 132, 618–630. [Google Scholar] [CrossRef]
  31. Sauer, J.; Schnerr, G.H. Unsteady Cavitating Flow—A New Cavitation Model Based on a Modified Front Capturing Method and Bubble Dynamics. In Proceedings of the 2000 ASME Fluid Engineering Summer Conference, Boston, MA, USA, 11–15 June 2000. [Google Scholar]
  32. Spalart, P.R.; Jou, W.H.; Strelets, M.; Allmaras, S.R.; Comments on the Feasibility of LES for Winds, and on a Hybrid RANS/LES Approach. Advances in DNS/LES: Direct Numerical Simulation and Large Eddy Simulation, USA, 137–148 January 1997. Available online: https://www.tib.eu/en/search/id/BLCP:CN032430355/Comments-on-the-Feasibility-of-LES-for-Wings-and?cHash=f96f49e92e03e2d92c8740c7985dc18d (accessed on 1 September 2023).
  33. Spalart, P.R.; Deck, S.; Shur, M.L.; Squires, K.D.; Strelets, M.K.; Travin, A. A New Version of Detached-eddy Simulation, Resistant to Ambiguous Grid Densities. Theor. Com. Fluid. Dyn. 2006, 20, 181–195. [Google Scholar] [CrossRef]
  34. Wang, F.J. Computational Fluid Dynamics Analysis: Principles and Applications of CFD Software; Tsinghua University Press: Beijing, China, 2004. [Google Scholar]
  35. Zhu, J.K.; Chen, Y.; Zhao, D.F.; Zhang, X.B. Extension of the Schnerr–Sauer model for cryogenic cavitation. Eur. J. Mech. B/Fluids 2015, 52, 1–10. [Google Scholar] [CrossRef]
  36. Buren, T.V.; Whalen, E.; Amitay, M. Eddies, stream and convergence zones in turbulent flow. Phys. Fluids 2015, 30, 512–516. [Google Scholar]
  37. Franc, J.P. Partial Cavity Instabilities and Re-entrant Jet. In Proceedings of the 4th International Symposium on Cavitation, Pasadena, CA, USA, 20–23 June 2001. [Google Scholar]
  38. Wang, W.; Yi, Q.; Lin, Y.; Xu, R.; Wang, X. Impact of hydrofoil surface water injection on cavitation suppression. J. Drain. Irrig. Mach. Eng. 2016, 34, 865–870. [Google Scholar]
Figure 1. Computational domain for the NACA0015 hydrofoil.
Symmetry 15 01946 g001
Figure 2. (a) Computational domain mesh diagram of the NACA0015 hydrofoil; (b) Wall surface Yplus diagram of the NACA0015 hydrofoil.
Symmetry 15 01946 g002
Figure 3. (a) thermal physical properties of liquid nitrogen; (b) thermal physical properties of nitrogen.
Symmetry 15 01946 g003
Figure 4. (a) 3D model; (b) 2D computational domain.
Symmetry 15 01946 g004
Figure 5. Comparing simulated and experimental pressure and temperature drops. (293A operating condition).
Symmetry 15 01946 g005
Figure 6. Comparing simulated and experimental pressure and temperature drops. (296B operating condition).
Symmetry 15 01946 g006
Figure 7. (a) The variation of lift coefficients under isothermal and nonisothermal conditions; (b) The variation of drag coefficients under isothermal and nonisothermal conditions.
Symmetry 15 01946 g007
Figure 8. Instantaneous gas phase volume cloud map obtained from DDES simulation, time interval of 1 ms.
Symmetry 15 01946 g008
Figure 9. Instantaneous vorticity cloud map obtained from DDES simulation, time interval of 1 ms.
Symmetry 15 01946 g009
Figure 10. Instantaneous gas phase volume cloud map obtained from DDES simulation, with a time interval of 1 ms.
Symmetry 15 01946 g010
Figure 11. Instantaneous vorticity cloud map obtained from DDES simulation, with a time interval of 1 ms.
Symmetry 15 01946 g011
Figure 12. Instantaneous pressure distribution cloud map obtained from DDES simulation, with a time interval of 1 ms.
Symmetry 15 01946 g012
Figure 13. Velocity-vector distribution at the trailing edge of the hydrofoil at time t0.
Symmetry 15 01946 g013
Figure 14. Velocity-vector distribution at the middle section of the hydrofoil at time t0 + 3Δt/12.
Symmetry 15 01946 g014
Figure 15. Transient pressure distribution contour map obtained from DDES simulation, with a time interval of 1 ms.
Symmetry 15 01946 g015
Figure 16. Velocity-vector distribution at the middle section of the hydrofoil at time t0.
Symmetry 15 01946 g016
Table 1. Different grid schemes for the NACA0015 hydrofoil.
Grid Division SchemesGrid NumberLift Coefficient Cl
1102,9870.02298
2215,8750.02088
3387,6550.01880
4477,7320.01839
5624,8750.01828
Table 2. Boundary conditions of corresponding operating conditions under test conditions.
MediumNumberFar-Field
Temperature
Inlet Reynolds
Number
Cavitation
Number
liquid nitrogen293A77.64 K1.11 × 1071.75
liquid nitrogen296B88.54 K1.10 × 1071.61
Disclaimer/Publisher’s Note: The statements, opinions and data contained in all publications are solely those of the individual author(s) and contributor(s) and not of MDPI and/or the editor(s). MDPI and/or the editor(s) disclaim responsibility for any injury to people or property resulting from any ideas, methods, instructions or products referred to in the content.

