
Multiple Pathways for Dissociative Adsorption of SiCl4 on the Si(100)-c(4×2) Surface


Abstract
1. Introduction
2. Computational Details
3. Results and Discussion
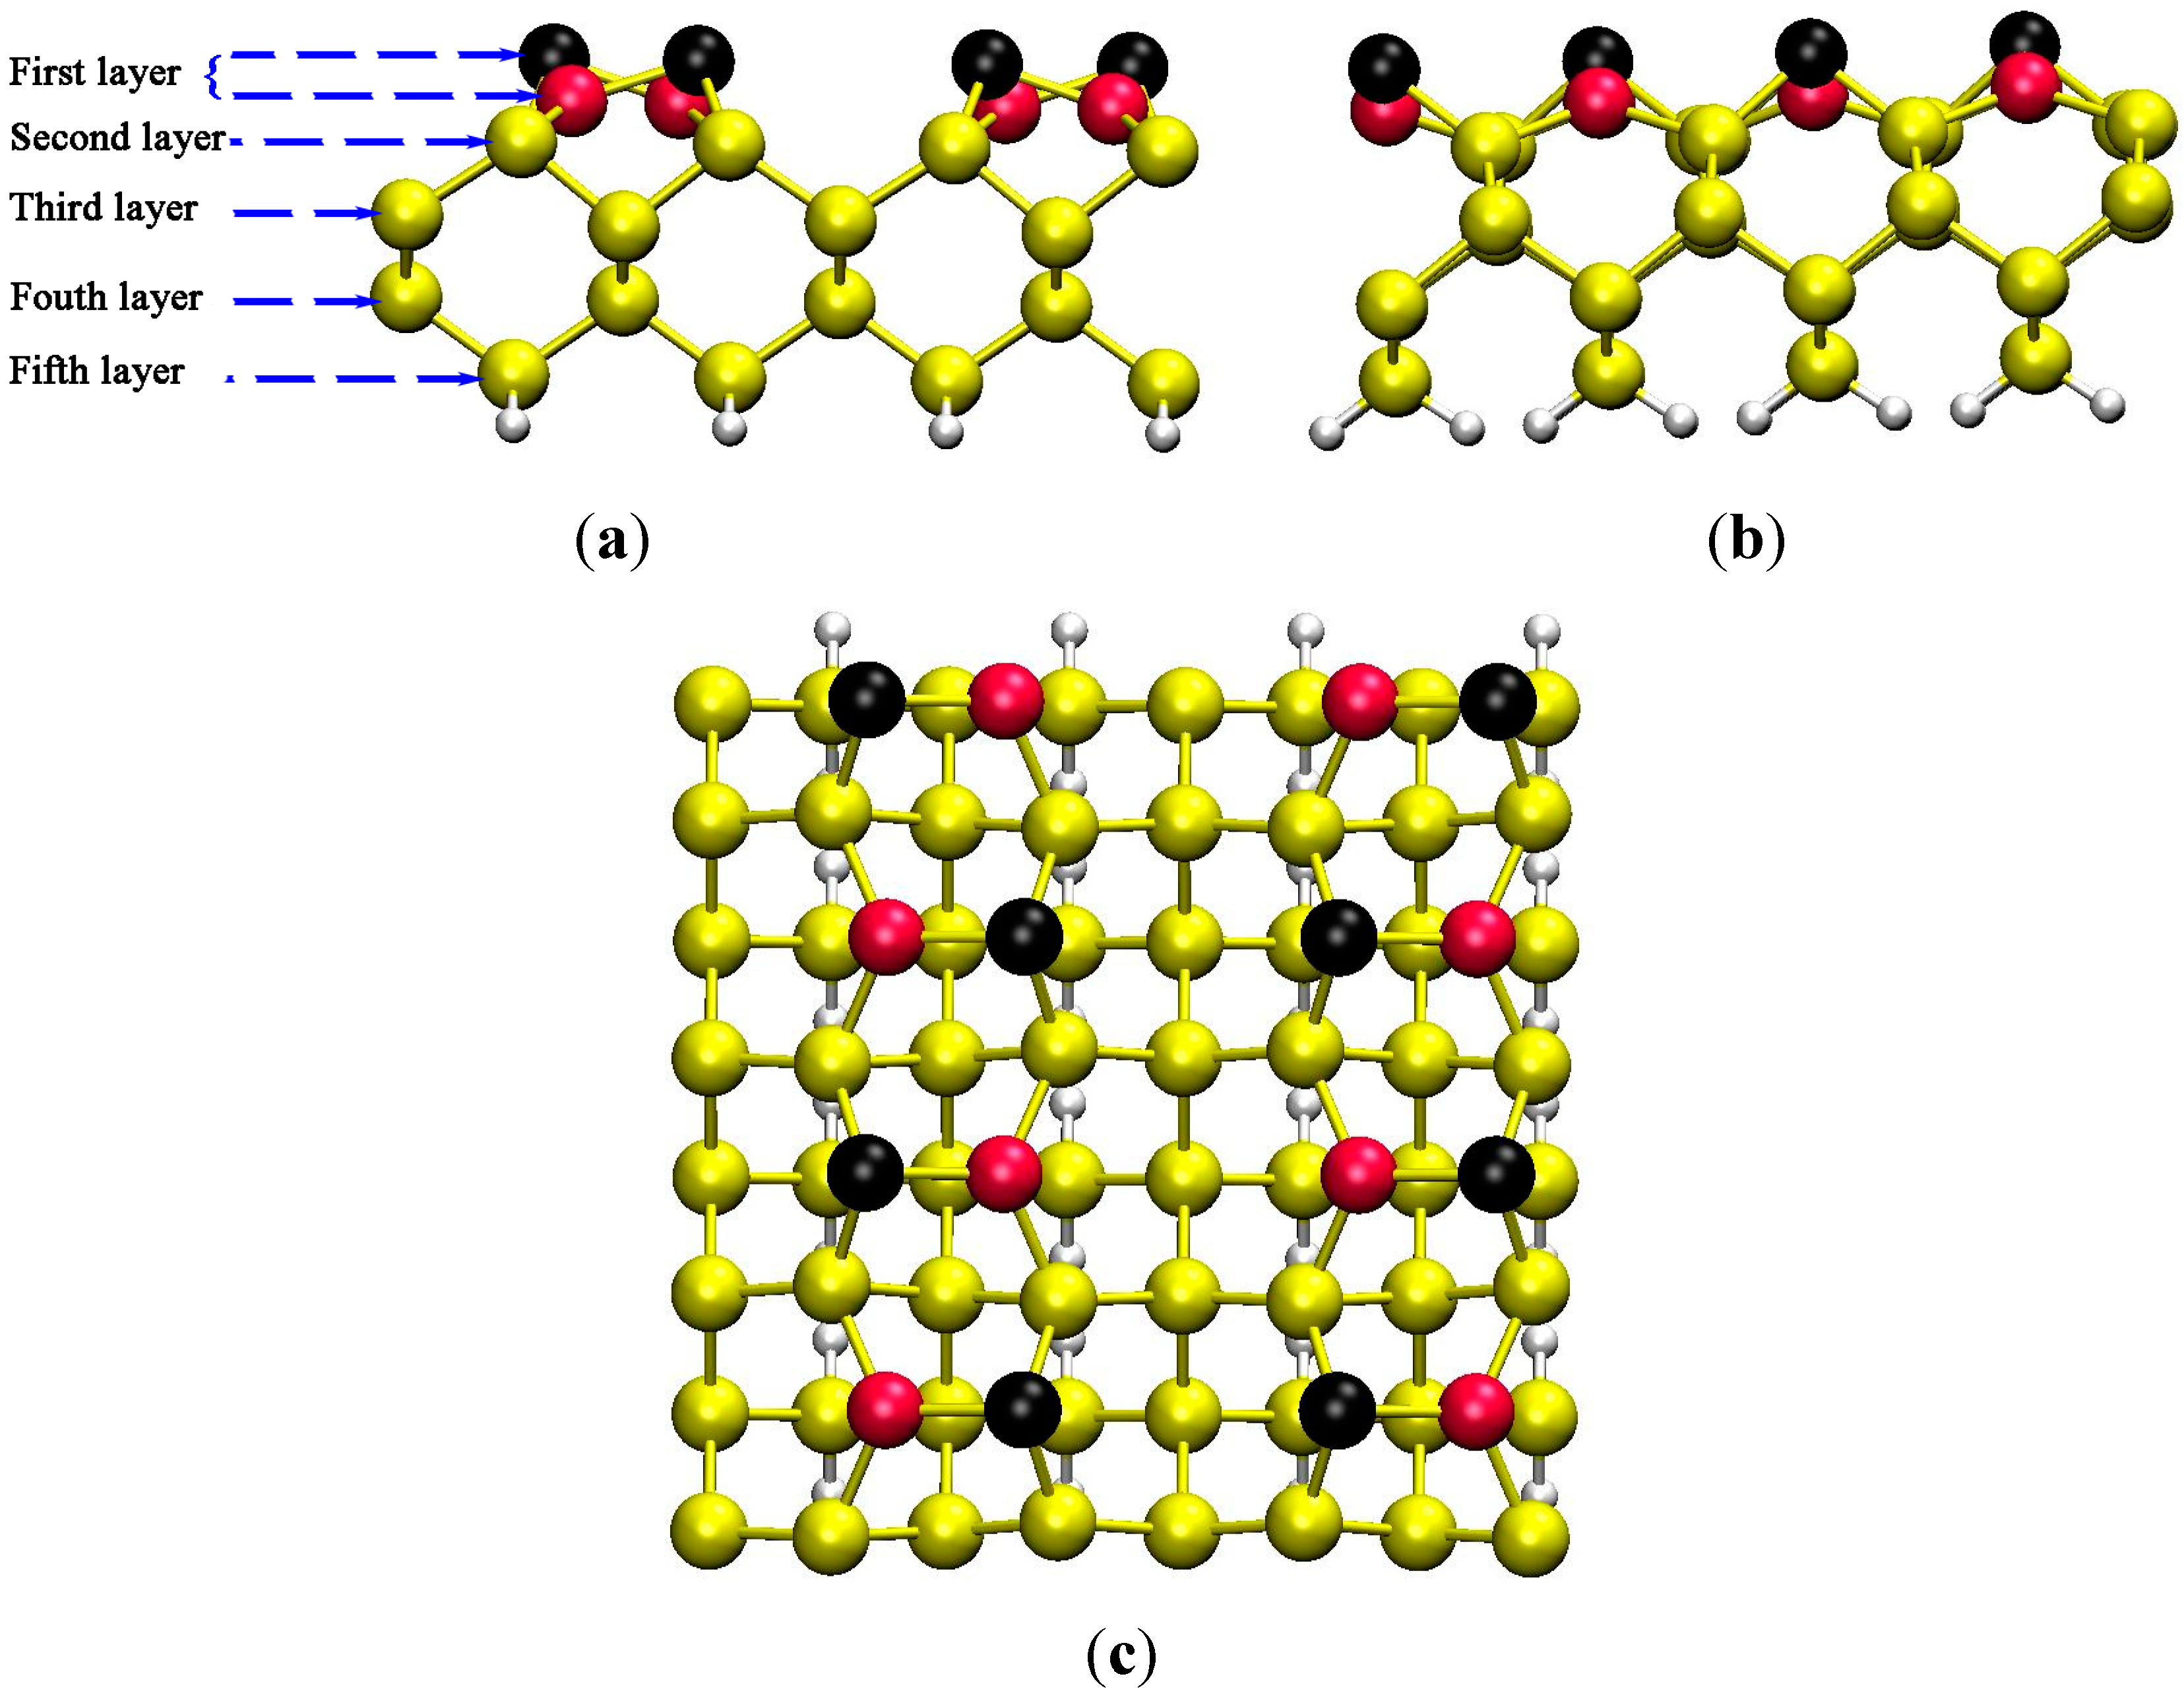
3.1. Predicting of Si(100)-c(4×2) Adsorption
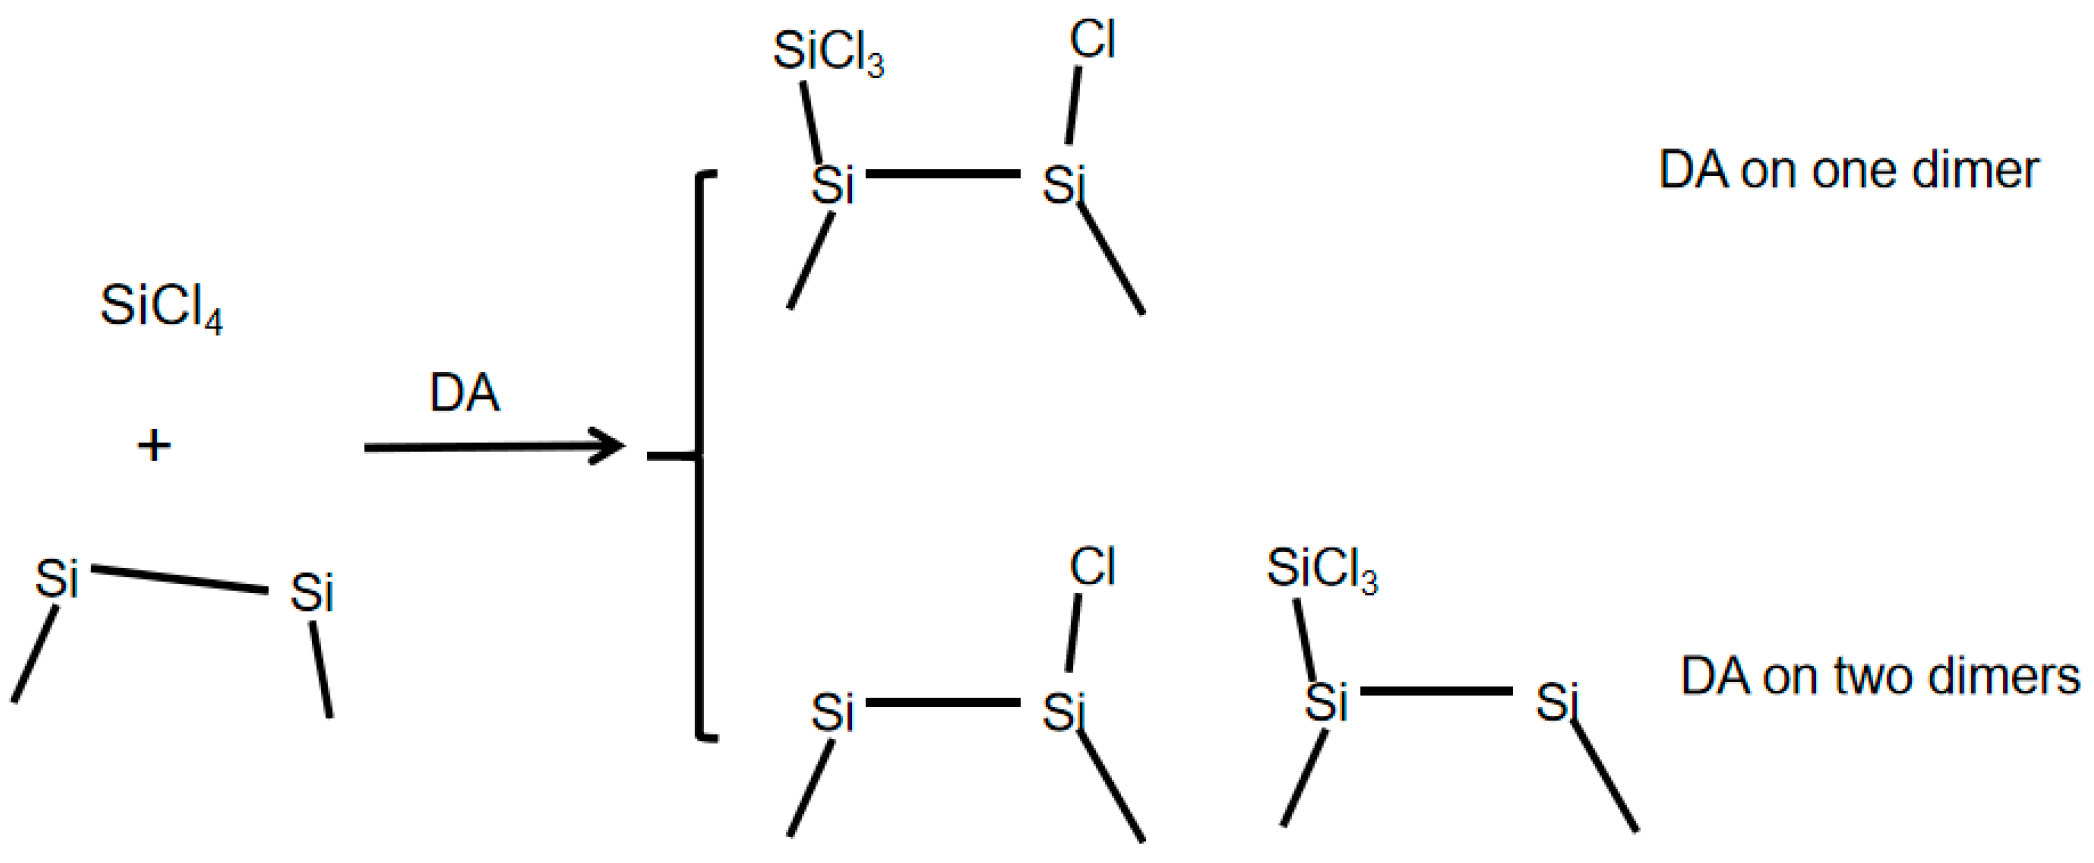
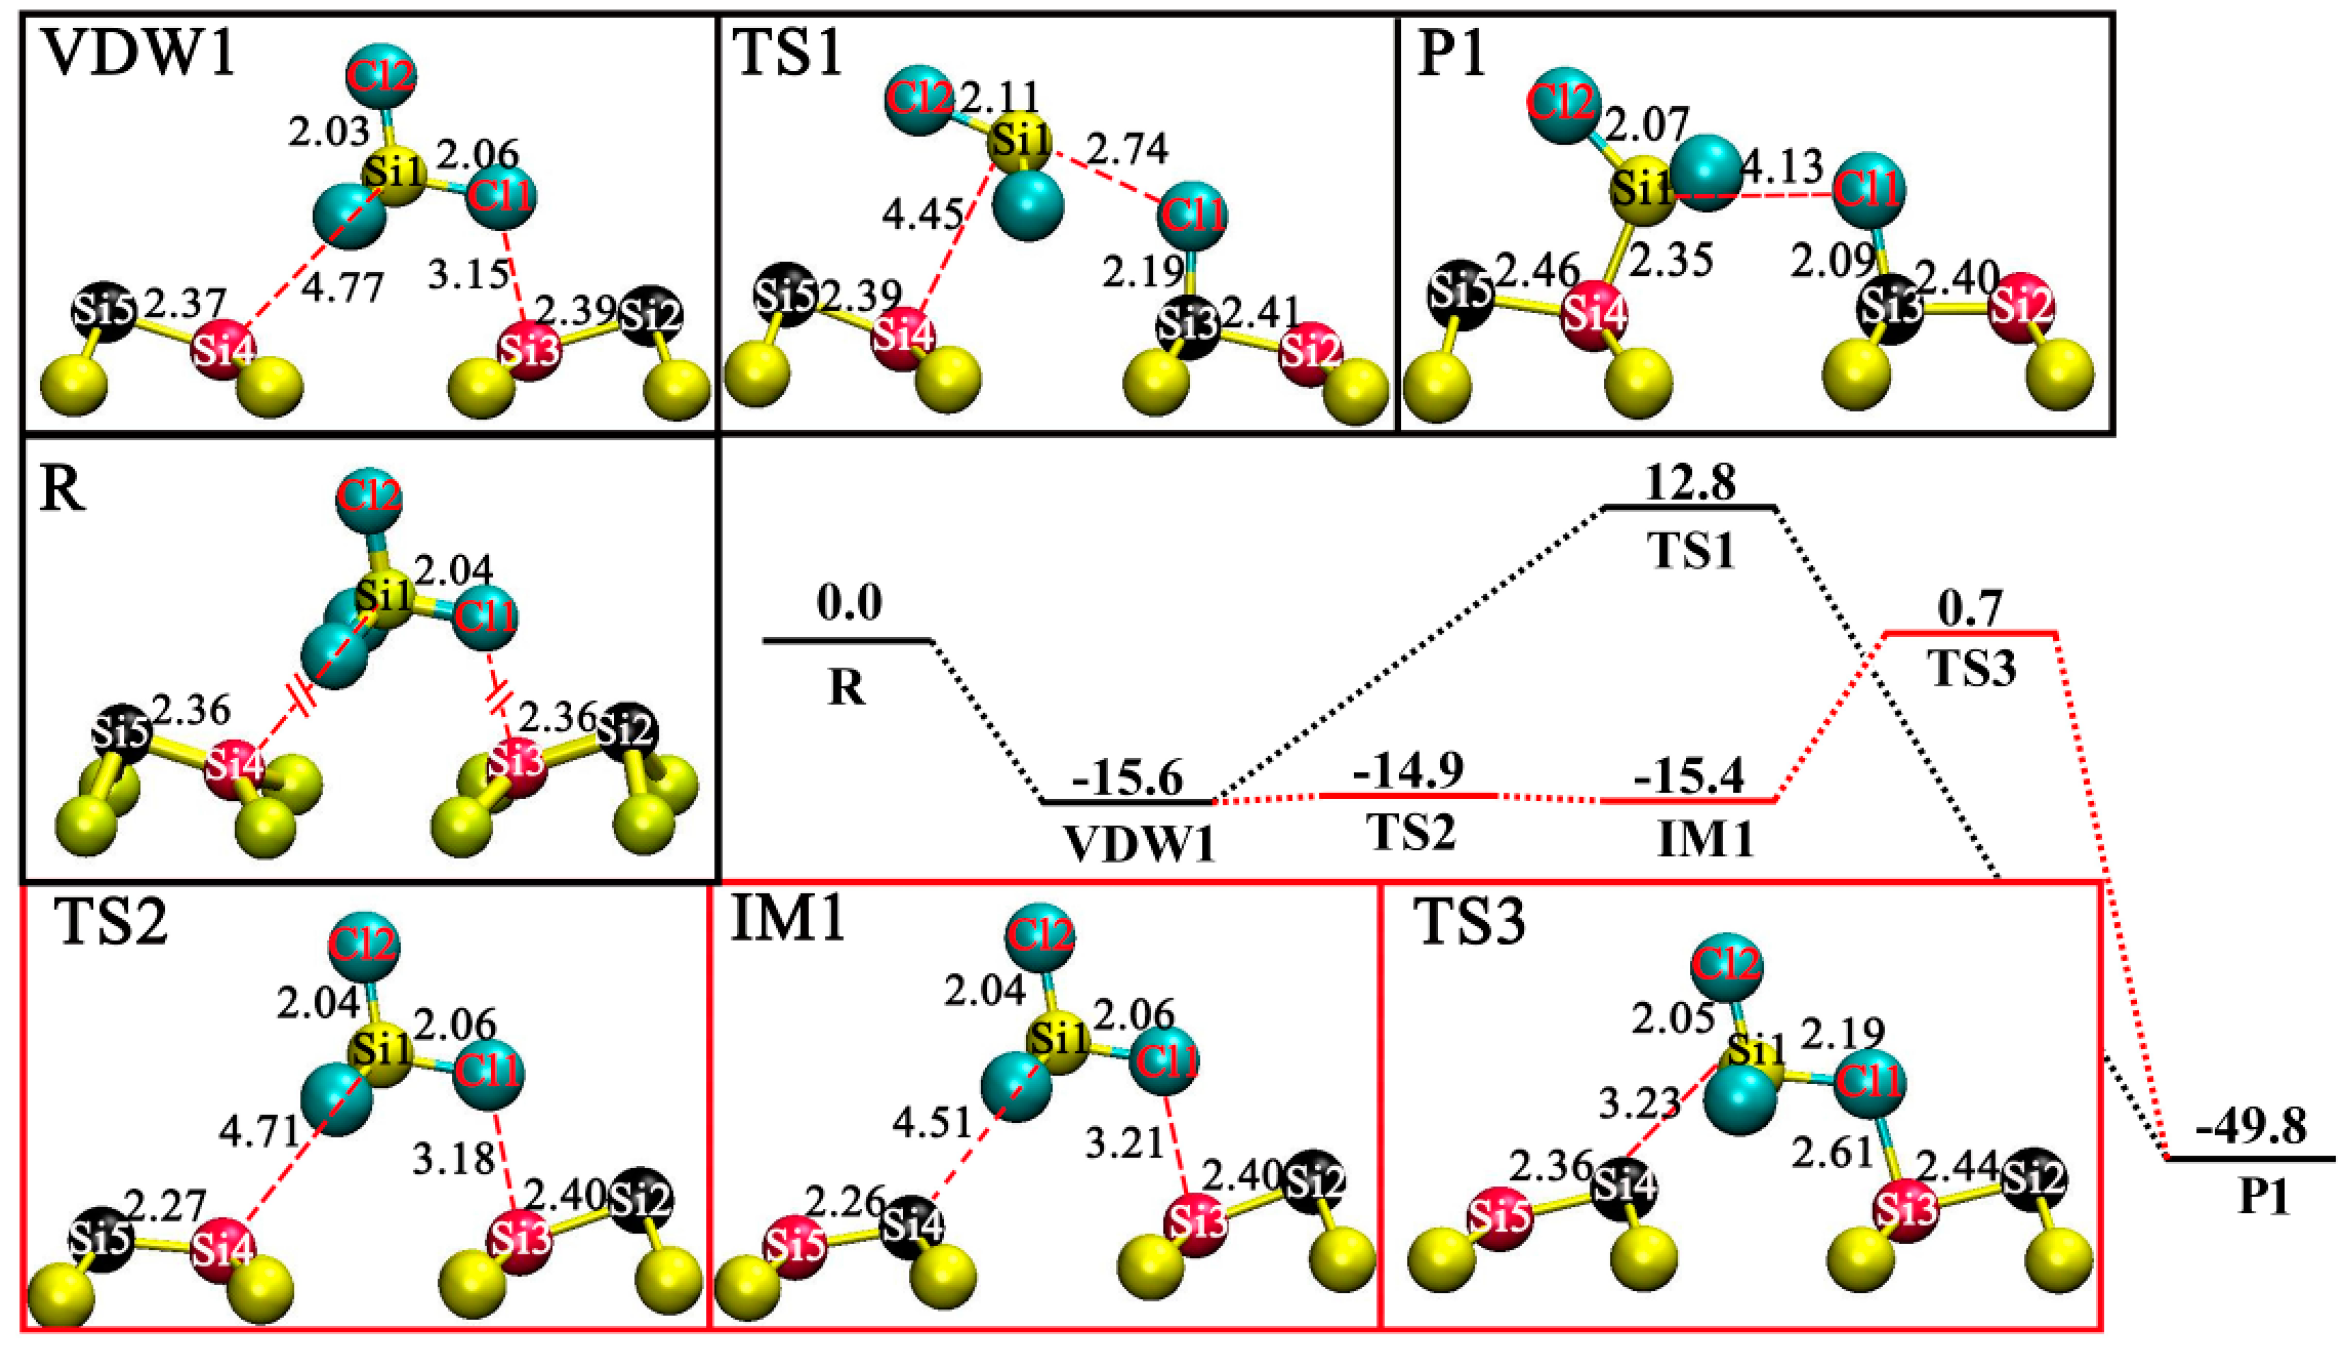
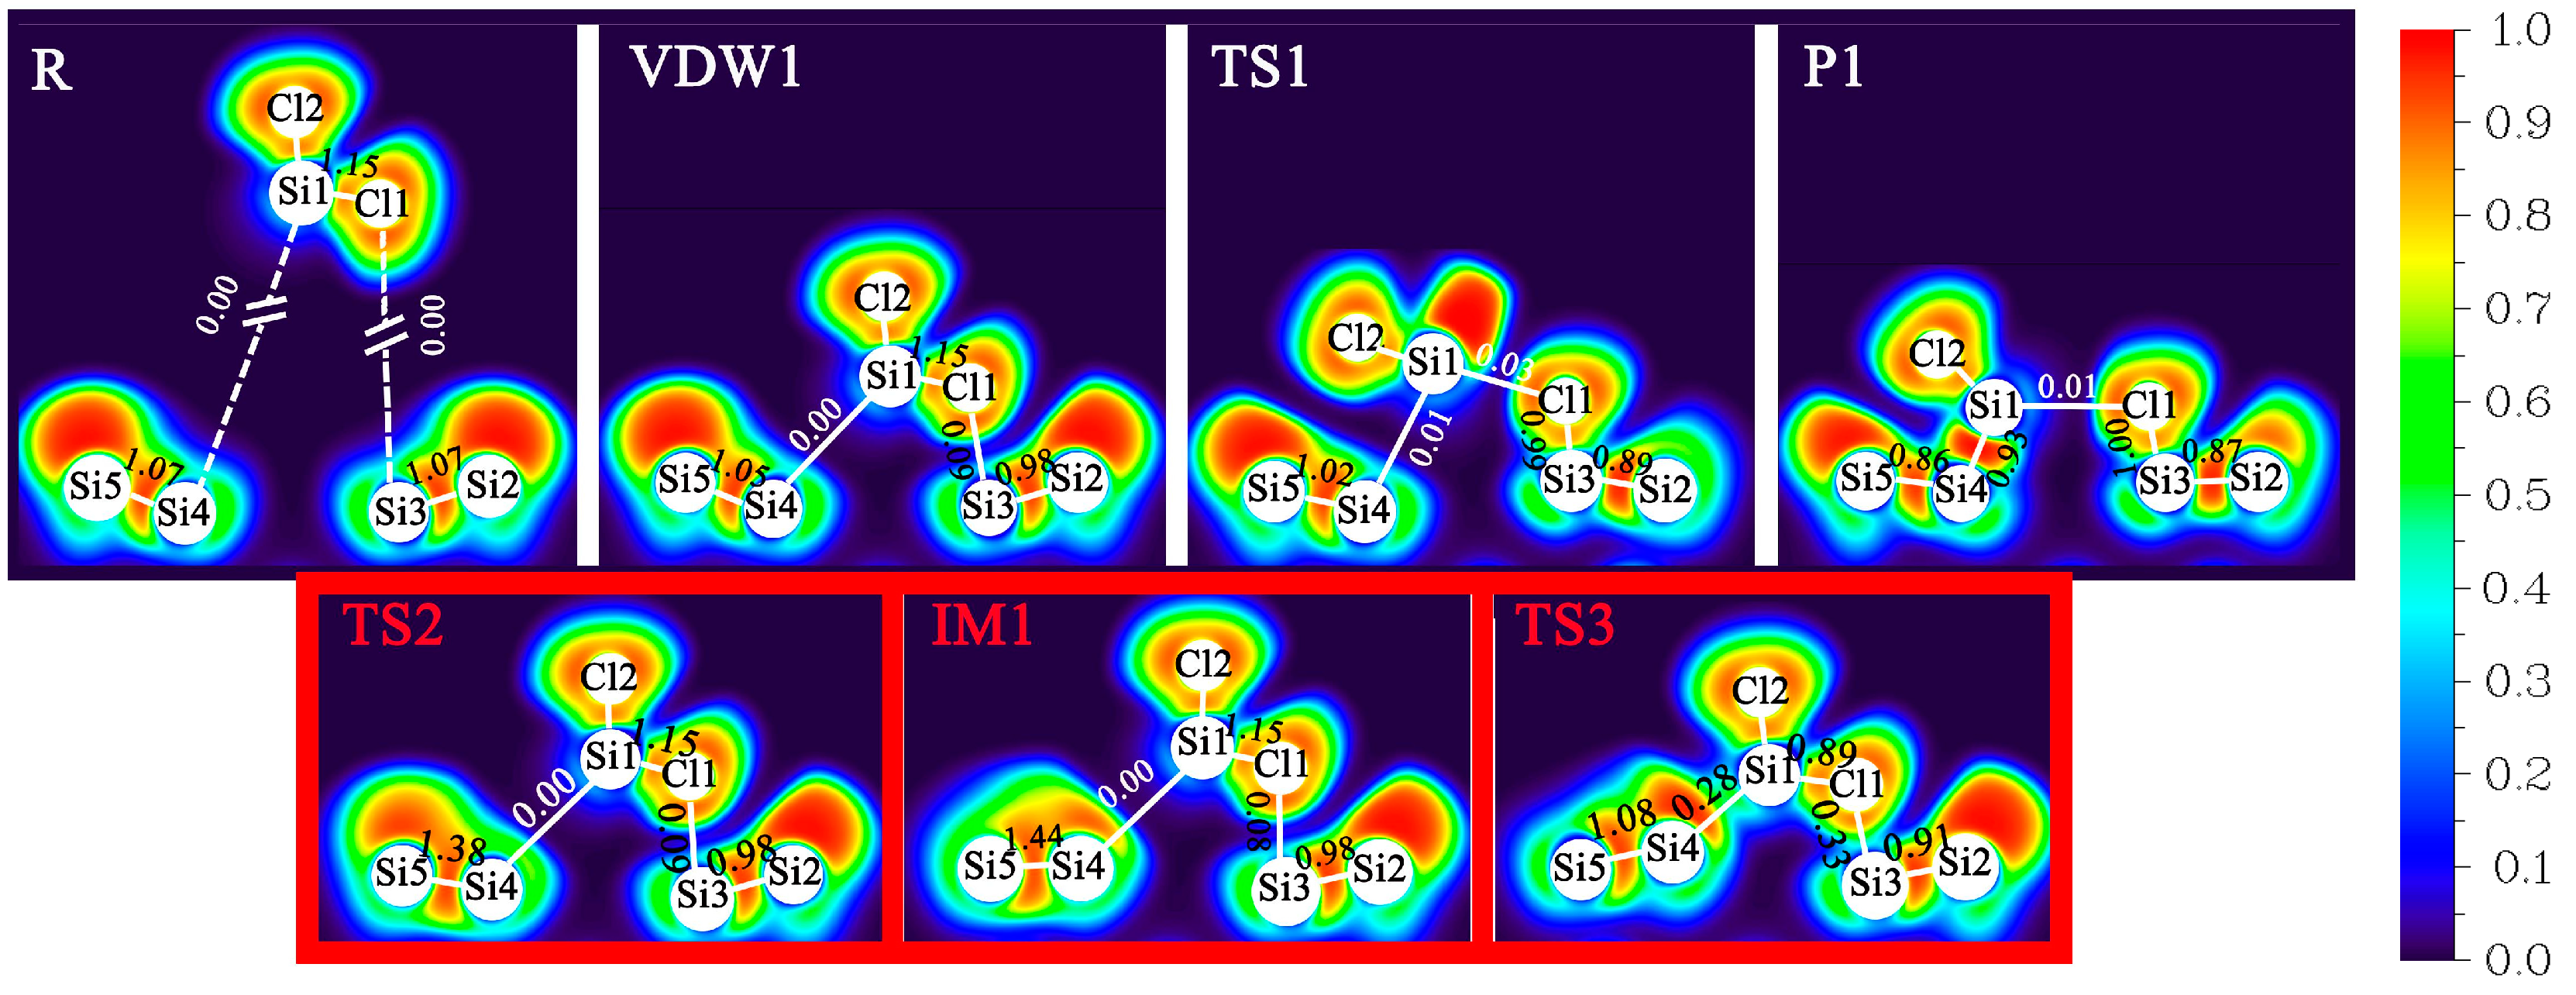
3.2. DA at IR Sites
3.3. DA at ID Sites
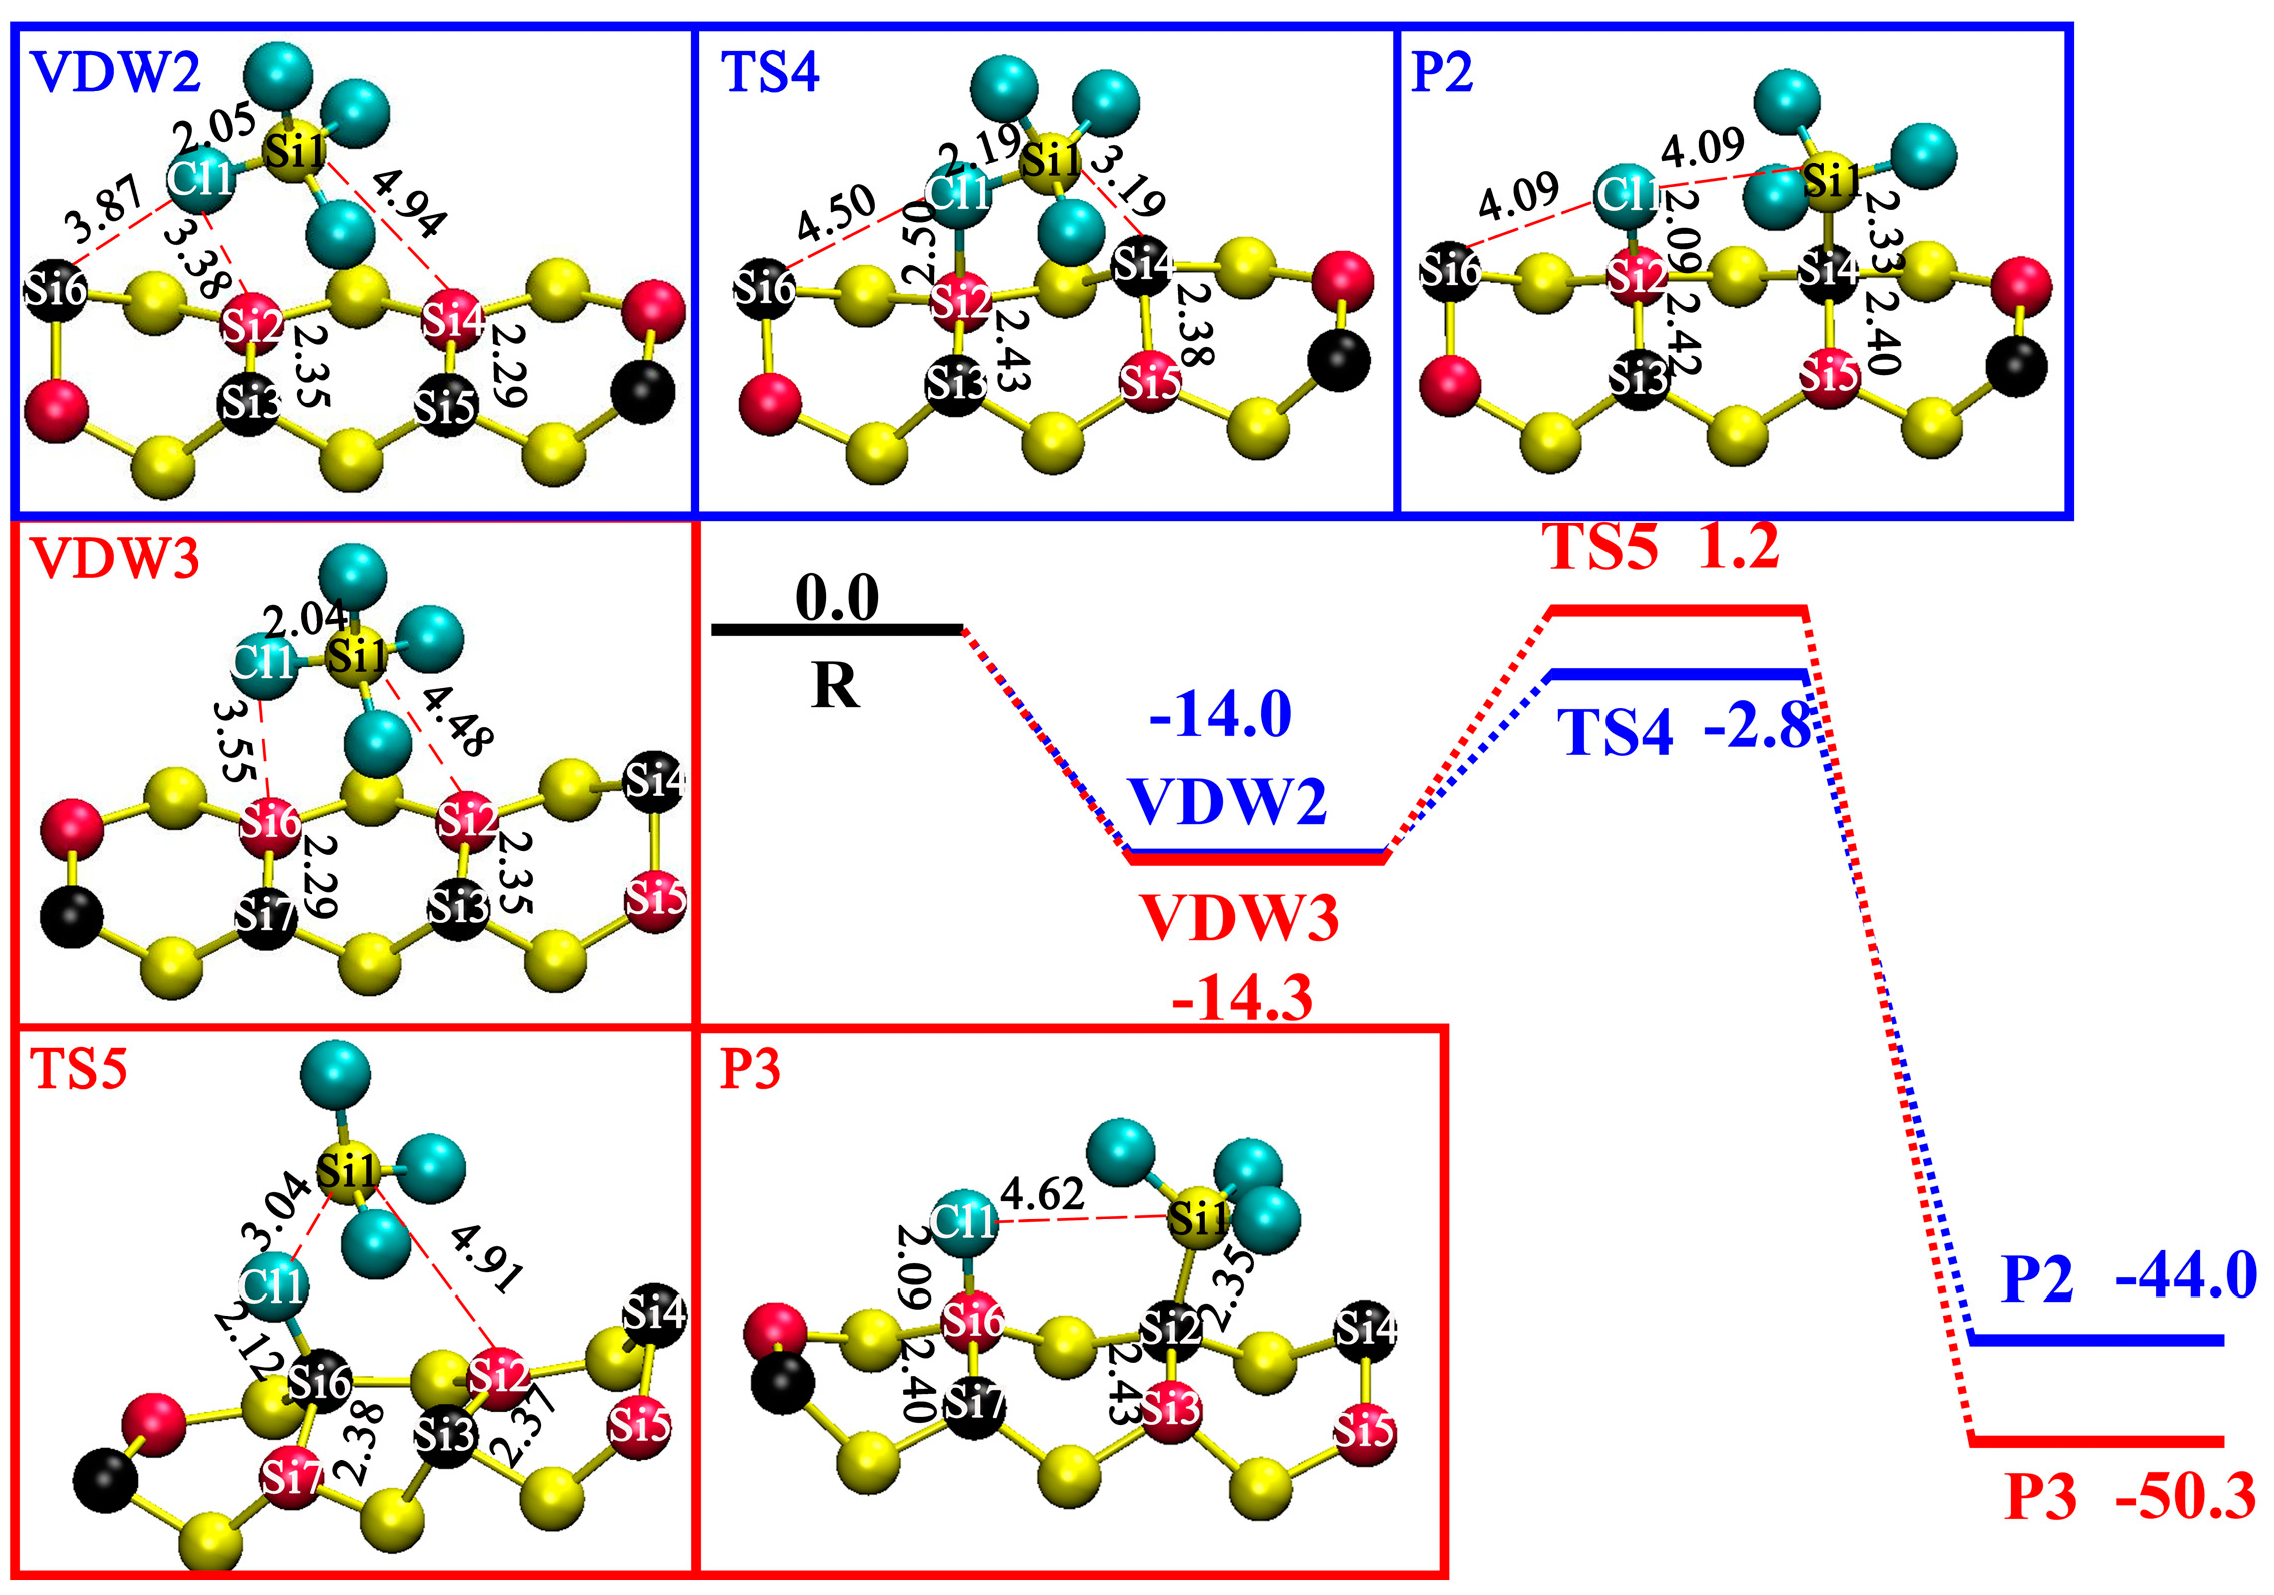
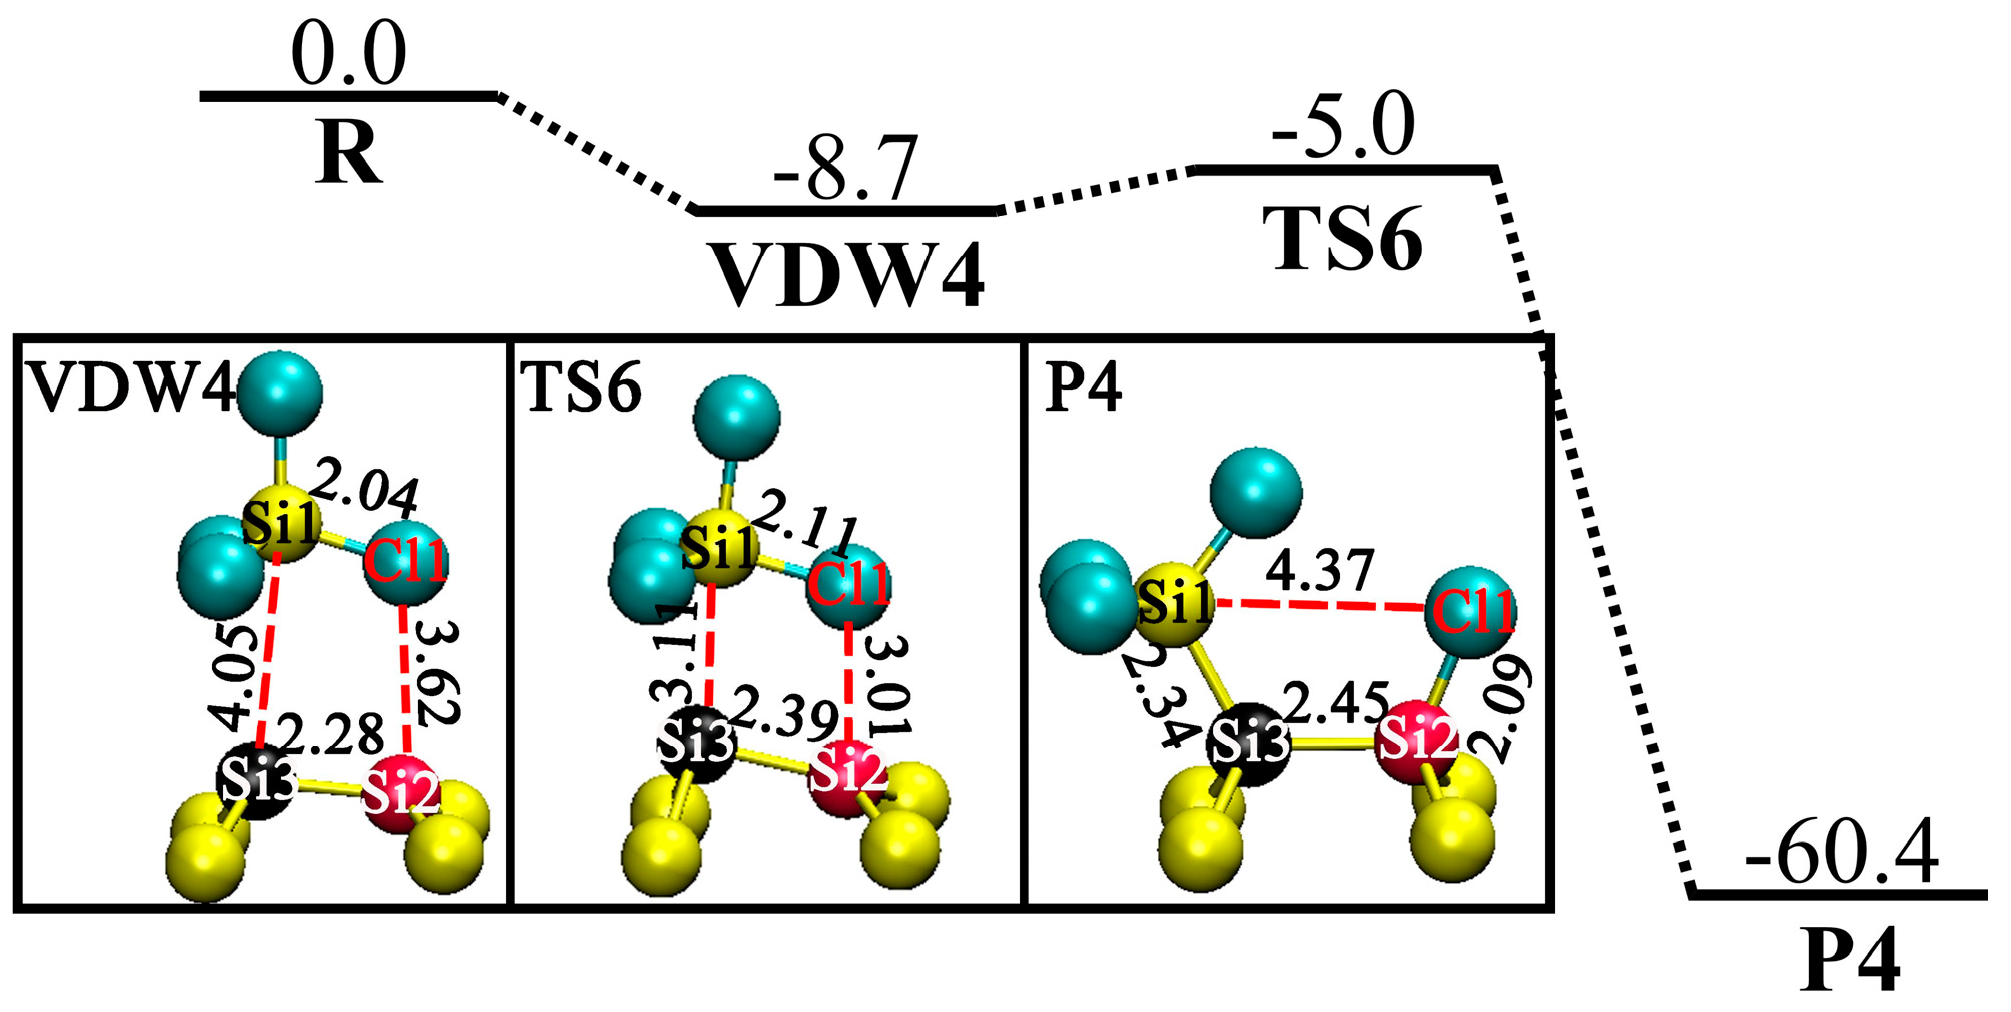
3.4. DA at OD Sites
4. Conclusions
Supplementary Materials
Author Contributions
Funding
Data Availability Statement
Conflicts of Interest
References
- Parida, B.; Iniyan, S.; Goic, R. A Review of Solar Photovoltaic Technologies. Renew. Sust. Energy Rev. 2011, 15, 1625–1636. [Google Scholar] [CrossRef]
- Yadav, S.; Chattopadhyay, K.; Singh, C.V. Solar Grade Silicon Production: A Review of Kinetic, Thermodynamic and Fluid Dynamics Based Continuum Scale Modeling. Renew. Sust. Energy Rev. 2017, 78, 1288–1314. [Google Scholar] [CrossRef]
- Andrews, R.N.; Clarson, S.J. Pathways to Solar Grade Silicon. Silicon 2015, 7, 303–305. [Google Scholar] [CrossRef]
- Zhang, J.; Zhu, Q.; Li, J. Theoretical Investigations for Kinetics of the Chemical Reactions: H + SiClx (X = 1, 2, 3). J. Phys. Chem. A 2022, 126, 1689–1700. [Google Scholar] [CrossRef]
- Pandey, A.K.; Tyagi, V.V.; Selvaraj, J.A.L.; Rahim, N.A.; Tyagi, S.K. Recent Advances in Solar Photovoltaic Systems for Emerging Trends and Advanced Applications. Renew. Sust. Energy Rev. 2016, 53, 859–884. [Google Scholar] [CrossRef]
- Ramstad, A.; Brocks, G.; Kelly, P.J. Theoretical Study of the Si(100) Surface Reconstruction. Phys. Rev. B 1995, 51, 14504–14523. [Google Scholar] [CrossRef]
- Wolkow, R.A. Direct Observation of an Increase in Buckled Dimers on Si(001) at Low Temperature. Phys. Rev. Lett. 1992, 68, 2636–2639. [Google Scholar] [CrossRef]
- Guo, C.-S.; Hermann, K.; Zhao, Y. Dynamics and Energetics of Reconstruction at the Si(100) Surface. J. Phys. Chem. C 2014, 118, 25614–25619. [Google Scholar] [CrossRef]
- Manzano, C.; Soe, W.H.; Kawai, H.; Saeys, M.; Joachim, C. Origin of the Apparent (2×1) Topography of the Si(100)-c(4×2) Surface Observed in Low-Temperature STM Images. Phys. Rev. B 2011, 83, 201302. [Google Scholar] [CrossRef]
- Dürr, M.; Höfer, U. Dissociative Adsorption of Molecular Hydrogen on Silicon Surfaces. Surf. Sci. Rep. 2006, 61, 465–526. [Google Scholar] [CrossRef]
- Lyubinetsky, I.; Dohnálek, Z.; Choyke, W.J.; Yates, J.T. Cl2 Dissociation on Si(100)-(2×1) a Statistical Study by Scanning Tunneling Microscopy. Phys. Rev. B 1998, 58, 7950–7957. [Google Scholar] [CrossRef]
- Owen, J.H.G. Competing Interactions in Molecular Adsorption: NH3 on Si(001). J. Phys. Condens. Matter 2009, 21, 443001. [Google Scholar] [CrossRef]
- Wang, C.G.; Huang, K.; Ji, W. Dissociative Adsorption of CH3X (X = Br and Cl) on a Silicon(100) Surface Revisited by Density Functional Theory. J. Chem. Phys. 2014, 141, 174701. [Google Scholar]
- Lim, T.B.; McNab, I.R.; Polanyi, J.C.; Guo, H.; Ji, W. Multiple Pathways of Dissociative Attachment: CH3Br on Si(100)-2×1. J. Am. Chem. Soc. 2011, 133, 11534–11539. [Google Scholar] [CrossRef]
- Guo, Q.; Sterratt, D.; Williams, E.M. Negative Ion Formation from SiCl4 Adsorbed on Si(100). Surf. Sci. 1996, 352-354, 327–331. [Google Scholar] [CrossRef]
- Gao, Q.; Dohnalek, Z.; Cheng, C.C.; Choyke, W.J.; Yates, J.T. The Adsorption and Surface Reaction of SiCl4 on Si(100)-(2×1). Surf. Sci. 1994, 302, 1–9. [Google Scholar] [CrossRef]
- Tossell, J.A. Theoretical Studies on the Adsorption of SiCl4 on the Si(100) 2×1 Surface. Surf. Sci. 1999, 431, 186–192. [Google Scholar] [CrossRef]
- Hall, M.A.; Mui, C.; Musgrave, C.B. DFT Study of the Adsorption of Chlorosilanes on the Si(100)-2×1 Surface. J. Phys. Chem. B 2001, 105, 12068–12075. [Google Scholar] [CrossRef]
- Chan, S.P.; Liu, Z.F.; Lau, W.M.; Tse, J.S. SiCl4 Desorption in Chlorine Etching of Si(100)—A First Principles Study. Surf. Sci. 1999, 432, 125–138. [Google Scholar] [CrossRef]
- Yadav, S.; Singh, C.V. Molecular Adsorption and Surface Formation Reactions of HCl, H2 and Chlorosilanes on Si(100)-c(4×2) with Applications for High Purity Silicon Production. Appl. Surf. Sci. 2019, 475, 124–134. [Google Scholar] [CrossRef]
- Henkelman, G.; Uberuaga, B.P.; Jónsson, H. A Climbing Image Nudged Elastic Band Method for Finding Saddle Points and Minimum Energy Paths. J. Chem. Phys. 2000, 113, 9901–9904. [Google Scholar] [CrossRef]
- Hwang, G.S. A Channel for Dimer Flipping on the Si(001) Surface. Surf. Sci. 2000, 465, L789–L793. [Google Scholar] [CrossRef]
- Hata, K.; Sainoo, Y.; Shigekawa, H. Atomically Resolved Local Variation of the Barrier Height of the Flip-Flop Motion of Single Buckled Dimers of Si(100). Phys. Rev. Lett. 2001, 86, 3084–3087. [Google Scholar] [CrossRef]
- Sweetman, A.; Jarvis, S.; Danza, R.; Bamidele, J.; Gangopadhyay, S.; Shaw, G.A.; Kantorovich, L.; Moriarty, P. Toggling Bistable Atoms Via Mechanical Switching of Bond Angle. Phys. Rev. Lett. 2011, 106, 136101. [Google Scholar] [CrossRef]
- Buehler Emily, J.; Boland John, J. Dimer Preparation That Mimics the Transition State for the Adsorption of H2 on the Si(100)-2×1 Surface. Science 2000, 290, 506–509. [Google Scholar] [CrossRef]
- Yu, S.-Y.; Kim, Y.-S.; Kim, H.; Koo, J.-Y. Influence of Flipping Si Dimers on the Dissociation Pathways of Water Molecules on Si(001). J. Phys. Chem. C 2011, 115, 24800–24803. [Google Scholar] [CrossRef]
- Harikumar, K.R.; Lim, T.; McNab, I.R.; Polanyi, J.C.; Zotti, L.; Ayissi, S.; Hofer, W.A. Dipole-Directed Assembly of Lines of 1,5-Dichloropentane on Silicon Substrates by Displacement of Surface Charge. Nat. Nanotechnol. 2008, 3, 222–228. [Google Scholar] [CrossRef]
- Zhang, J.; Dolg, M. Abcluster: The Artificial Bee Colony Algorithm for Cluster Global Optimization. Phys. Chem. Chem. Phys. 2015, 17, 24173–24181. [Google Scholar] [CrossRef]
- Zhang, J.; Dolg, M. Global Optimization of Clusters of Rigid Molecules Using the Artificial Bee Colony Algorithm. Phys. Chem. Chem. Phys. 2016, 18, 3003–3010. [Google Scholar] [CrossRef]
- Perdew, J.P.; Burke, K.; Ernzerhof, M. Generalized Gradient Approximation Made Simple. Phys. Rev. Lett. 1996, 77, 3865–3868. [Google Scholar] [CrossRef]
- Grimme, S. Semiempirical Gga-Type Density Functional Constructed with a Long-Range Dispersion Correction. J. Comput. Chem. 2006, 27, 1787–1799. [Google Scholar] [CrossRef] [PubMed]
- Kühne, T.D.; Iannuzzi, M.; Del Ben, M.; Rybkin, V.V.; Seewald, P.; Stein, F.; Laino, T.; Khaliullin, R.Z.; Schütt, O.; Schiffmann, F.; et al. CP2K: An Electronic Structure and Molecular Dynamics Software Package—Quickstep: Efficient and Accurate Electronic Structure Calculations. J. Chem. Phys. 2020, 152, 194103. [Google Scholar] [CrossRef] [PubMed]
- Lippert, B.G.; Parrinello, J.H.; Michele, A. Hybrid Gaussian and Plane Wave Density Functional Scheme. Mol. Phys. 1997, 92, 477–488. [Google Scholar] [CrossRef]
- VandeVondele, J.; Hutter, J. Gaussian Basis Sets for Accurate Calculations on Molecular Systems in Gas and Condensed Phases. J. Chem. Phys. 2007, 127, 114105. [Google Scholar] [CrossRef] [PubMed]
- Goedecker, S.; Teter, M.; Hutter, J. Separable Dual-Space Gaussian Pseudopotentials. Phys. Rev. B 1996, 54, 1703–1710. [Google Scholar] [CrossRef]
- VandeVondele, J.; Hutter, J. An Efficient Orbital Transformation Method for Electronic Structure Calculations. J. Chem. Phys. 2003, 118, 4365–4369. [Google Scholar] [CrossRef]
- Fletcher, R.; Reeves, C.M. Function Minimization by Conjugate Gradients. Comput. J. 1964, 7, 149–154. [Google Scholar] [CrossRef]
- Lu, T.; Liu, Z.; Chen, Q. Comment on “18 and 12—Member Carbon Rings (Cyclo[N]Carbons)—A Density Functional Study”. Mater. Sci. Eng. B 2021, 273, 115425. [Google Scholar] [CrossRef]
- He, G.; Ma, J.; He, H. Role of Carbonaceous Aerosols in Catalyzing Sulfate Formation. ACS Catal. 2018, 8, 3825–3832. [Google Scholar] [CrossRef]
- Neese, F.; Wennmohs, F.; Becker, U.; Riplinger, C. The Orca Quantum Chemistry Program Package. J. Chem. Phys. 2020, 152, 224108. [Google Scholar] [CrossRef]
- Neese, F.; Wennmohs, F.; Hansen, A.; Becker, U. Efficient, Approximate and Parallel Hartree–Fock and Hybrid DFT Calculations. A ‘Chain-of-Spheres’ Algorithm for the Hartree–Fock Exchange. Chem. Phys. 2009, 356, 98–109. [Google Scholar] [CrossRef]
- Neese, F. An Improvement of the Resolution of the Identity Approximation for the Formation of the Coulomb Matrix. J. Comput. Chem. 2003, 24, 1740–1747. [Google Scholar] [CrossRef]
- Becke, A.D.; Edgecombe, K.E. A Simple Measure of Electron Localization in Atomic and Molecular Systems. J. Chem. Phys. 1990, 92, 5397–5403. [Google Scholar] [CrossRef]
- Mayer, I. Charge, Bond Order and Valence in the Ab Initio SCF Theory. Chem. Phys. Lett. 1983, 97, 270–274. [Google Scholar] [CrossRef]
- Lu, T.; Chen, Q. Independent Gradient Model Based on Hirshfeld Partition: A New Method for Visual Study of Interactions in Chemical Systems. J. Comput. Chem. 2022, 43, 539–555. [Google Scholar] [CrossRef]
- Lu, T.; Chen, Q. Interaction Region Indicator: A Simple Real Space Function Clearly Revealing Both Chemical Bonds and Weak Interactions. Chem. Methods 2021, 1, 231–239. [Google Scholar] [CrossRef]
- Lu, T.; Chen, F. Multiwfn: A Multifunctional Wavefunction Analyzer. J. Comput. Chem. 2012, 33, 580–592. [Google Scholar] [CrossRef] [PubMed]
- Bussi, G.; Donadio, D.; Parrinello, M. Canonical Sampling through Velocity Rescaling. J. Chem. Phys. 2007, 126, 014101. [Google Scholar] [CrossRef] [PubMed]
- Pino-Rios, R.; Inostroza, D.; Cárdenas-Jirón, G.; Tiznado, W. Orbital-Weighted Dual Descriptor for the Study of Local Reactivity of Systems with (Quasi-) Degenerate States. J. Phys. Chem. A 2019, 123, 10556–10562. [Google Scholar] [CrossRef]
- Clark, T.; Hennemann, M.; Murray, J.S.; Politzer, P. Halogen Bonding: The σ-Hole. J. Mol. Model. 2007, 13, 291–296. [Google Scholar] [CrossRef]


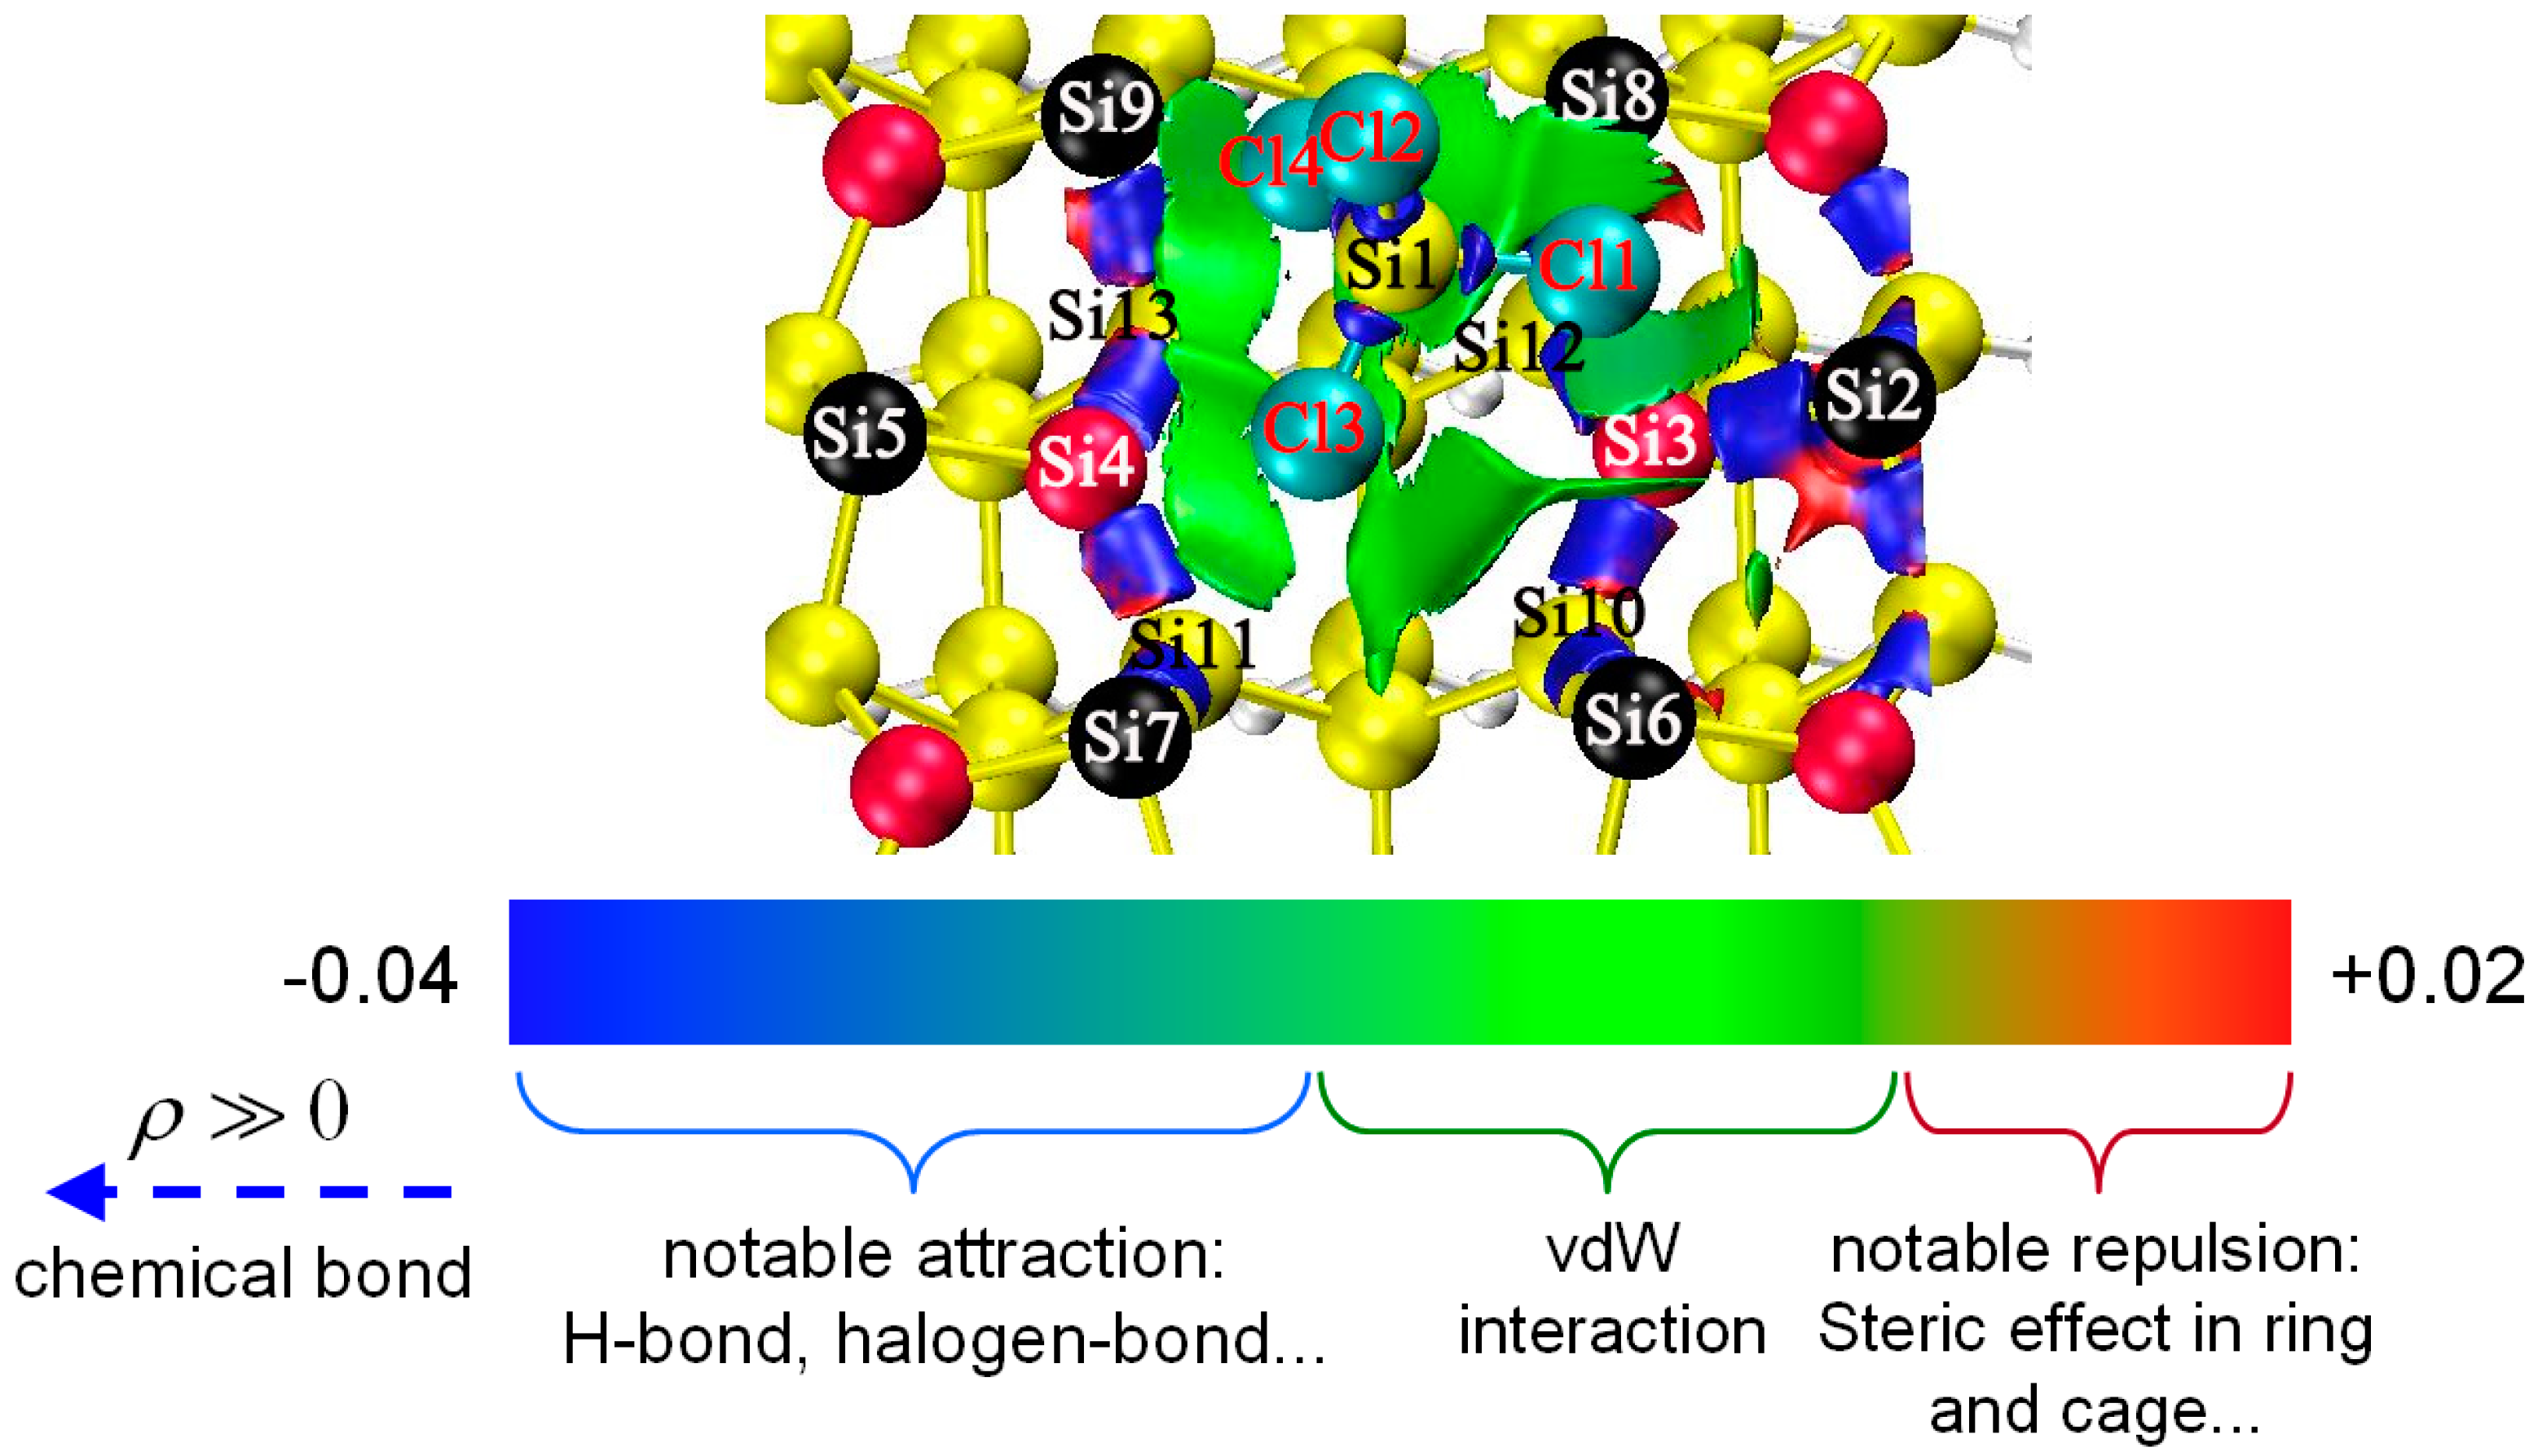
| Pairs | Percentage |
|---|---|
| Cl1-Si3 | 13.1% |
| Cl3-Si7 | 8.1% |
| Cl4-Si9 | 8.1% |
| Cl1-Si2 | 6.7% |
| Cl3-Si11 | 5.9% |
| Cl4-Si13 | 5.9% |
| Cl3-Si4 | 3.9% |
| Cl4-Si4 | 3.9% |
| Cl1-Si3 | 13.1% |
Disclaimer/Publisher’s Note: The statements, opinions and data contained in all publications are solely those of the individual author(s) and contributor(s) and not of MDPI and/or the editor(s). MDPI and/or the editor(s) disclaim responsibility for any injury to people or property resulting from any ideas, methods, instructions or products referred to in the content. |
© 2023 by the authors. Licensee MDPI, Basel, Switzerland. This article is an open access article distributed under the terms and conditions of the Creative Commons Attribution (CC BY) license (https://creativecommons.org/licenses/by/4.0/).
Share and Cite
Zhang, J.; Zhu, Q.; Li, J. Multiple Pathways for Dissociative Adsorption of SiCl4 on the Si(100)-c(4×2) Surface. Symmetry 2023, 15, 213. https://doi.org/10.3390/sym15010213
Zhang J, Zhu Q, Li J. Multiple Pathways for Dissociative Adsorption of SiCl4 on the Si(100)-c(4×2) Surface. Symmetry. 2023; 15(1):213. https://doi.org/10.3390/sym15010213
Chicago/Turabian StyleZhang, Jianxun, Quan Zhu, and Jun Li. 2023. "Multiple Pathways for Dissociative Adsorption of SiCl4 on the Si(100)-c(4×2) Surface" Symmetry 15, no. 1: 213. https://doi.org/10.3390/sym15010213
APA StyleZhang, J., Zhu, Q., & Li, J. (2023). Multiple Pathways for Dissociative Adsorption of SiCl4 on the Si(100)-c(4×2) Surface. Symmetry, 15(1), 213. https://doi.org/10.3390/sym15010213