1. Introduction
The goal of network representation learning, also known as network embedding or graph embedding, is to learn a data representation that represents the nodes in a network as a low-dimensional, dense vector form while maximizing the preservation of information in the network [
1,
2,
3]. The learned vectors are used in machine learning algorithms to accomplish downstream network analysis tasks such as link prediction, node clustering, and recommendation systems [
4,
5,
6,
7].
In recent years, with the rapid development of the Big Data era, the number of data in various fields has increased and the form of data has become more complex [
8,
9,
10]. In addition to text, audio, image, and video data, information networks represent another natural and complex data structure representing several entities and relationships. The network formed by these data exists in the modality of a graph in computers, and a wide variety of real-world data in business, science, and engineering are captured in the form of information networks [
11], for example, social networks constituted by users and user relationships in social platforms. citation networks constituted by papers and cross-citations of papers in academic websites; urban traffic networks [
5], protein interaction networks [
6], etc. These graph data have a complex structure and attribute information that can be adapted to learning tasks in multiple domains [
12,
13,
14,
15,
16], and in the network, the key aspect of mining the potential information data is network representation learning. Network representation learning learns the vector representation of each node from the original graph structure data so that the obtained representation vectors have representation and inference capabilities in low-dimensional space [
17,
18,
19,
20].
Traditional network representation learning methods are dedicated to retaining the topological structure information of the network [
1,
2,
3], while the vast majority of real networks contain rich attribute information, such as hobbies, addresses, and ages of users in social networks, authors, keywords, and research fields of articles in citation networks, and such networks are called attribute networks [
12,
15,
21]. When the network is highly sparse, the attribute information of nodes is important auxiliary information for network representation and helps to learn better network representation; if two nodes do not have a similar network structure, but have the same attributes, they should also have similar representation in the final representation space [
22,
23].
The traditional network representation learning method known as the Deepwalk [
24] algorithm is based on random wandering, where all vertices in the graph are first labeled, the starting vertex is randomly selected, the path length is specified, and then the random wandering starts and the node representation is obtained in the generated wandering sequence with the help of the Skip-Gram model. Since its way of selecting the next node in the random wandering sequence is uniformly randomly distributed, the sampling process will repeat the sampling of the central node. Node2vec [
25] puts restrictions on the neighborhood of vertices based on random wandering by adding a biased random wandering strategy to capture the structure of the context, i.e., defining a transfer probability between wandering strategies so that different neighborhoods can be explored effectively. The struc2vec [
26] approach considers that nodes with similar network space structure also have high similarity and thus perform random wandering based on hierarchical weighted graphs. LINE [
27] preserves the first-order and second-order nearest neighbors of the network by marginalized random wandering while preserving the local and global network structure of the network. SDNE [
28] uses deep learning techniques in representation learning, combining autoencoders and Laplacian feature mapping to preserve the first-order and second-order similarity of the network structure.
Given that most real networks are rich in attribute information, combining node attribute information to learn vector representations of nodes can solve the problem of sparse network structure while better preserving the information of the original network. TADW [
29] first proposed combining textual information of nodes into representation learning through matrix decomposition, reflecting a better performance than the Deepwalk [
24] algorithm. The traditional Deepwalk method based on random wandering is proved and extended, and it is proved that its essence is an equivalent matrix decomposition method, so by adding the textual feature information matrix in the decomposition process, the method has both structure and textual information for representation learning, but the problem is that the computation and storage of the two correlation matrices for structure and textual information are less efficient and not suitable for large networks. The model of AANE [
30] also integrates topological and attribute information in the network based on matrix decomposition, but the model decomposes the optimization process into multiple subproblems working in parallel, which improves the efficiency of the algorithm. ASNE [
31] separates the structure and attributes of the topological nodes perform a layer of embedding, and then weighted stitching is inputted to a deep neural network to achieve network representation learning. DeepEmLAN [
32] smoothly projects different types of attribute information into the same semantic space by a deep attention model while maintaining its topology. Deep autoencoder-based GAE and variational autoencoder-based VGAE [
33] integrate and map the topology and attribute information into the same semantic space, using the middle layer as a vector representation of the nodes. GraphSAGE [
34] extends the traditional graph convolutional neural network to generate a vector representation by aggregating information of multi-order neighbor nodes with node attribute information. GraphRNA [
35] generates random wandering sequences on node attribute information, based on which a recurrent neural network framework is designed to learn node representations. ARNL [
36] combines encoder and Skip-Gram models to jointly learn structurally and attribute representations. GCN [
37] uses first-order information based on local spectral convolution filters to aggregate neighbor attribute information. GAT [
38] adds node attribute information to neighbors to assign different weights and learn neighbor weights based on importance.
Existing methods for learning network representations combining structural and node attribute information continue to suffer from several problems:
Non-linearity: Most representation learning methods are shallow, but the structure and attribute information in the network are highly non-linear, and it is difficult to capture the highly non-linear topology and node attribute information in the network.
Interactivity: Topological structure and attribute information learning are complementary to network representation, and both should be ensured to learn interactively when performing learning, and the consistency and interactivity of structure and attribute information cannot be learned well.
Multimodality: structure and node attribute information are two different kinds of information; one should know how to efficiently fuse the two kinds of information and learn important information in structure and attributes adaptively in downstream tasks.
To address the above issues, this paper proposes a dual autoencoders’ attribute network representation learning method that can fuse local and global structure information and node attribute information in network representation learning to obtain a better node representation. Specifically, the multi-hop attention mechanism is used to capture the higher-order neighborhood information of the nodes [
39], and the attribute autoencoder part is designed with a low-pass Laplace filter to process the attribute matrix because the low-frequency signals are smoother and the signal values of neighboring nodes are more correlated and have stronger similarity, while the high-frequency graph signals have much more drastic changes and the differences between the signal values of neighboring nodes are more significant. Therefore, a low-pass Laplace filter is designed to process the attribute information.
The main contributions of this paper can be summarized as follows:
In this paper, we propose the dual autoencoders network representation learning (DANRL) method, which uses the neighbor weight analysis strategy of a multi-hop attention mechanism to assign different weights to nodes based on node neighbor attribute information, capture node high-order neighborhood information, and obtain node structure embedding representation.
A low-pass Laplace smoothing filter is designed to process the attribute matrix, remove the high-frequency signals, make the nodes close to each other in the neighborhood closer, iteratively obtain the attribute information of important neighbor nodes, realize the complementarity and mutual constraint of two kinds of information, and obtain the attribute embedding representation after adaptive decoding.
The adaptive learning strategy is proposed to design common parameter sharing and the importance of adaptive learning structure and properties by optimizing the joint reconstruction loss of two autoencoders.
We experiment on four real-world datasets and compare them with eight network representation learning methods, and the experimental results show the advantages and rationality of DANRL for the node-clustering task.
3. Attribute Network Representation with Dual Autoencoders
3.1. Related Concepts
In order to better describe the proposed model and its specific algorithm, this paper first gives a description of relevant concepts in the problem and the main symbolic representation involved in the algorithm model, and the main symbols are shown in
Table 1.
In the real world, networks can be represented as graph structures, such as social networks, citation networks, etc. In real networks, nodes usually have a series of attribute information, which forms vectors related to nodes. For example, in social networks, a node represents a user, and the user’s relevant attribute information may include gender, age, address, friends, etc. Therefore, in the research on network representation learning, an network with rich attribute information in nodes is called an attribute network. An attribute network can be interpreted in a symbolic way as follows: given a network , where is the set of nodes in the network, the number of nodes is n; is the set of neighboring edges between nodes in the network; is the set of node attributes; and the number is m. The proximity of attributes between each node pair is determined by the similarity between the attribute vector of the node and the attribute vector of the node .
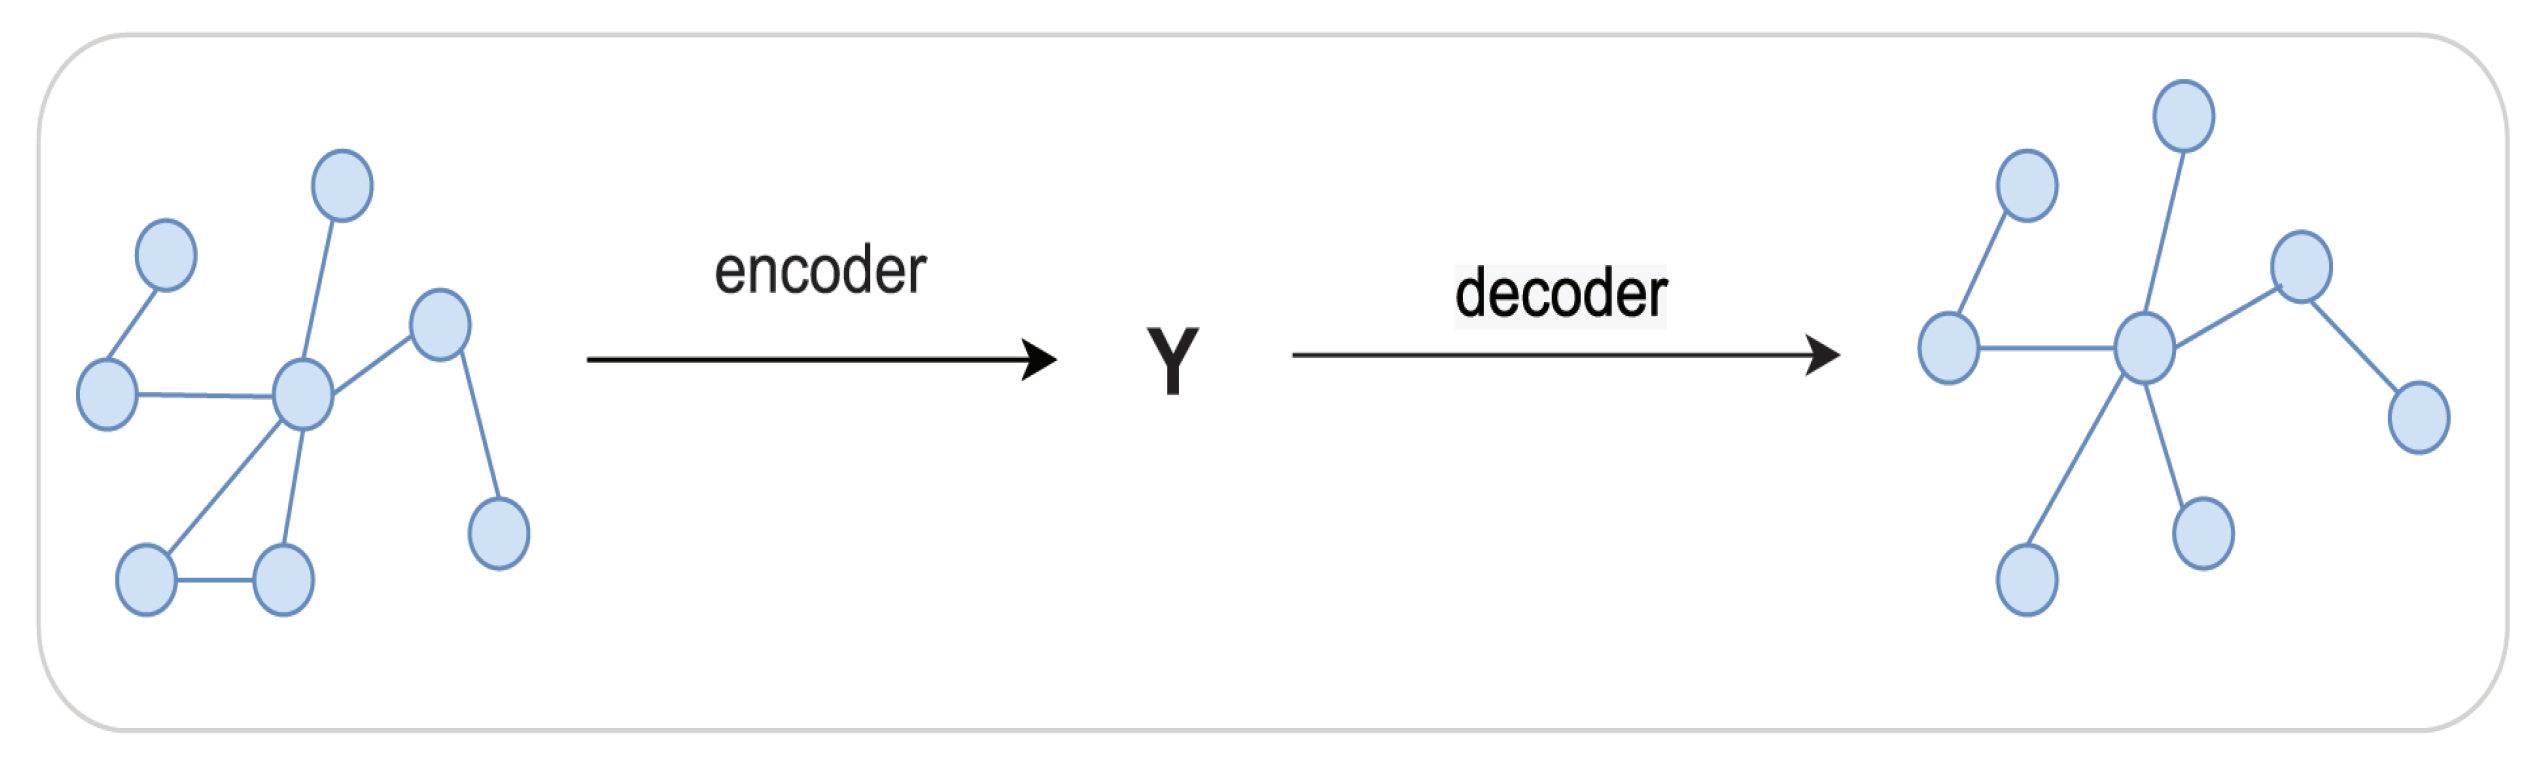
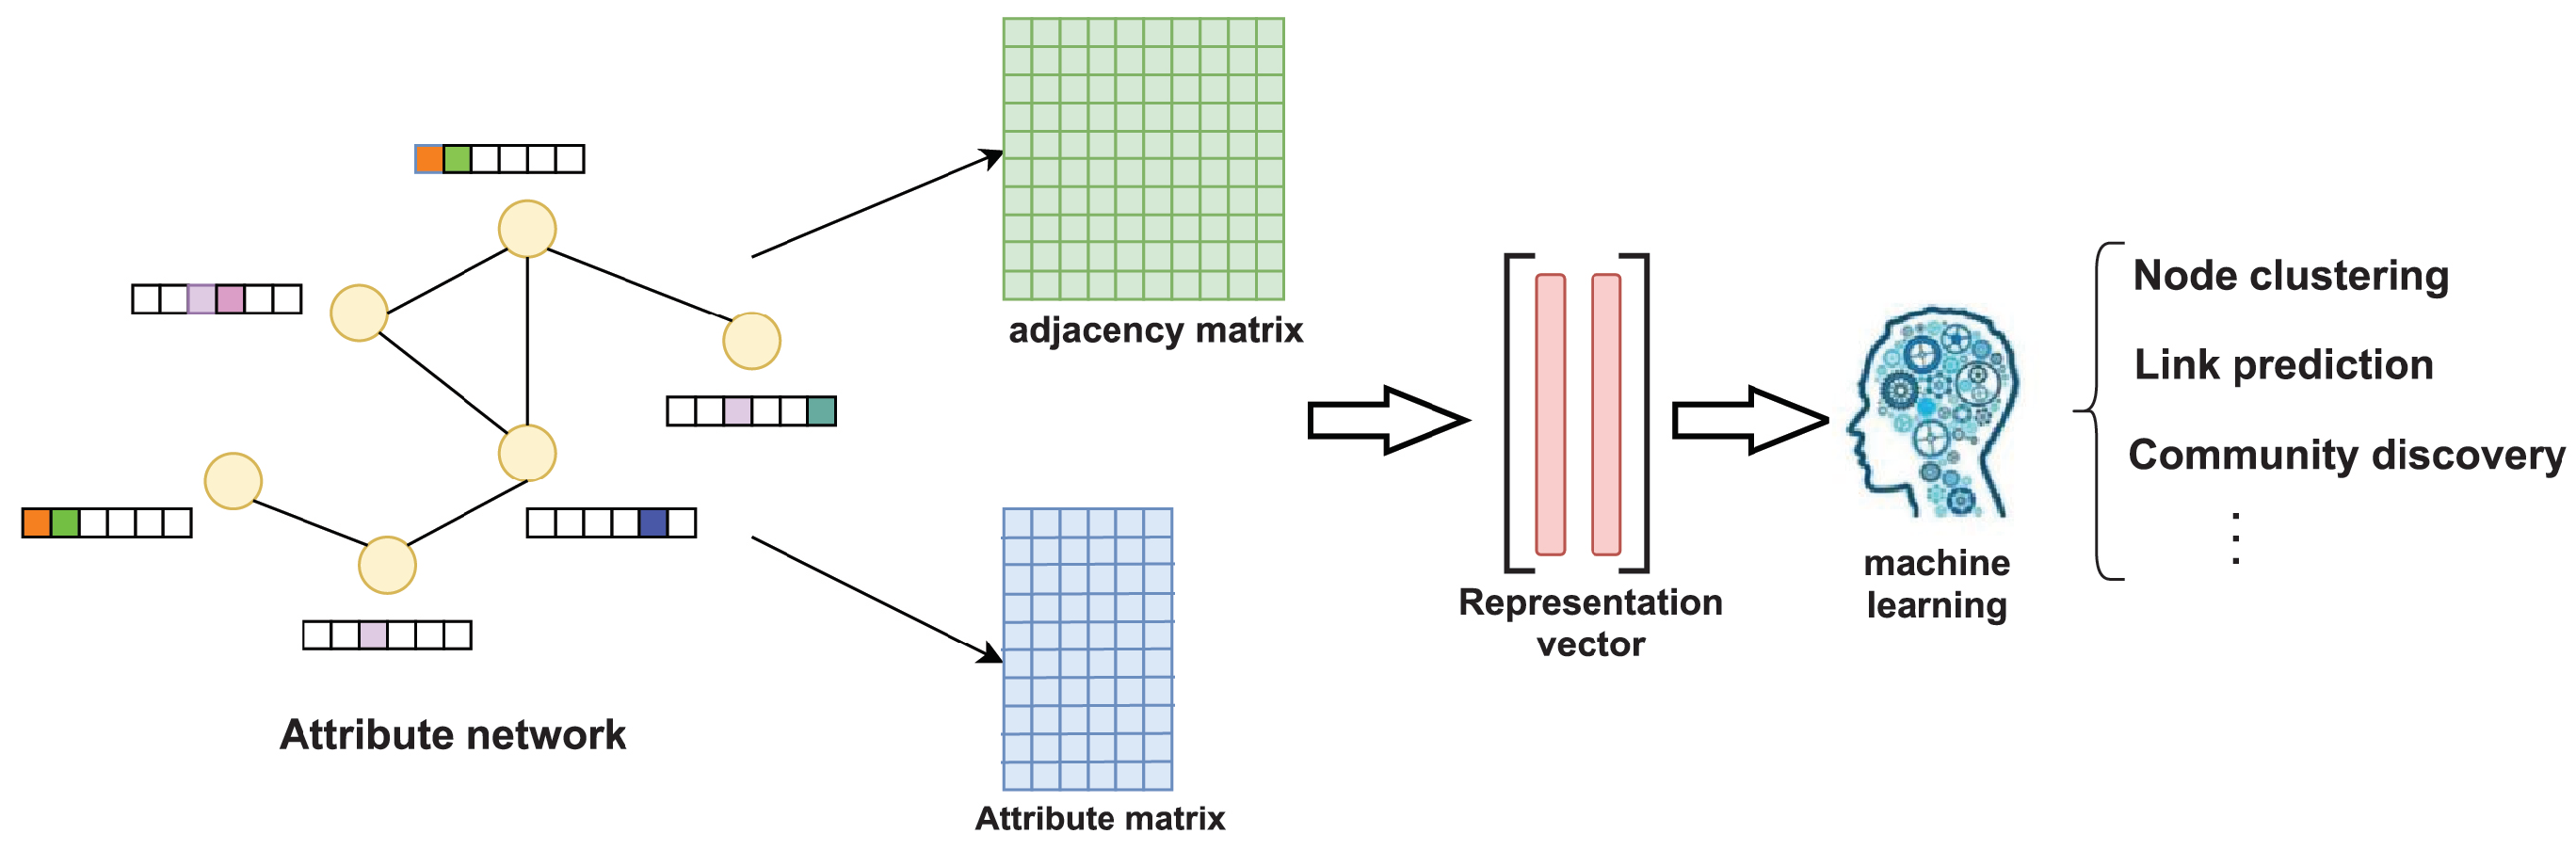
The purpose of attribute network representation learning is to use the network structure and node attribute information to learn a mapping function on a given attribute network and map the nodes in the network to a low-dimensional vector space so that the nodes with similar structures and attributes are close to each other in the low-dimensional space, and then use machine learning methods to solve the downstream tasks in network analysis, such as node clustering and link prediction. The attribute network represents the learning process, as shown in
Figure 2. The adjacency matrix and attribute matrix of the attribute network are combined to learn the final representation vector of nodes. The low-dimensional representation vector is applied in the machine learning algorithm to solve the downstream tasks of network analysis, such as node clustering and link prediction. To use a symbolic expression to explain attribute network representation learning, for a given attribute network, learn the mapping function
and
, where the mapping is associated with the structure and attribute information of each node, where
d is the dimension of the final representation vector of nodes.
The first-order proximity in a network is the local pairwise proximity between two vertices. For two vertices and , if there is a directly connected edge between the two vertices, there is first-order proximity between the vertices and , and the weight of the edge is the first-order proximity of the two vertices; otherwise, there is no first-order proximity between the two vertices.
In the real network, the direct connection between the two vertices observed only accounts for a small proportion. Even though the two vertices are very similar in nature, they are not directly connected, then the first-order proximity is zero, these vertices will be lost in the similarity measurement. Therefore, single first-order proximity is not enough to preserve the network structure. High-order proximity is used to describe the similarity of neighborhood network structure between vertices, which complements the first-order proximity and retains the global structure of the network. If denotes the first-order proximity between vertex and all other vertices, then the higher-order proximity of vertices and is determined by the similarity of and .
3.2. Representation Learning Method for Dual Autoencoders
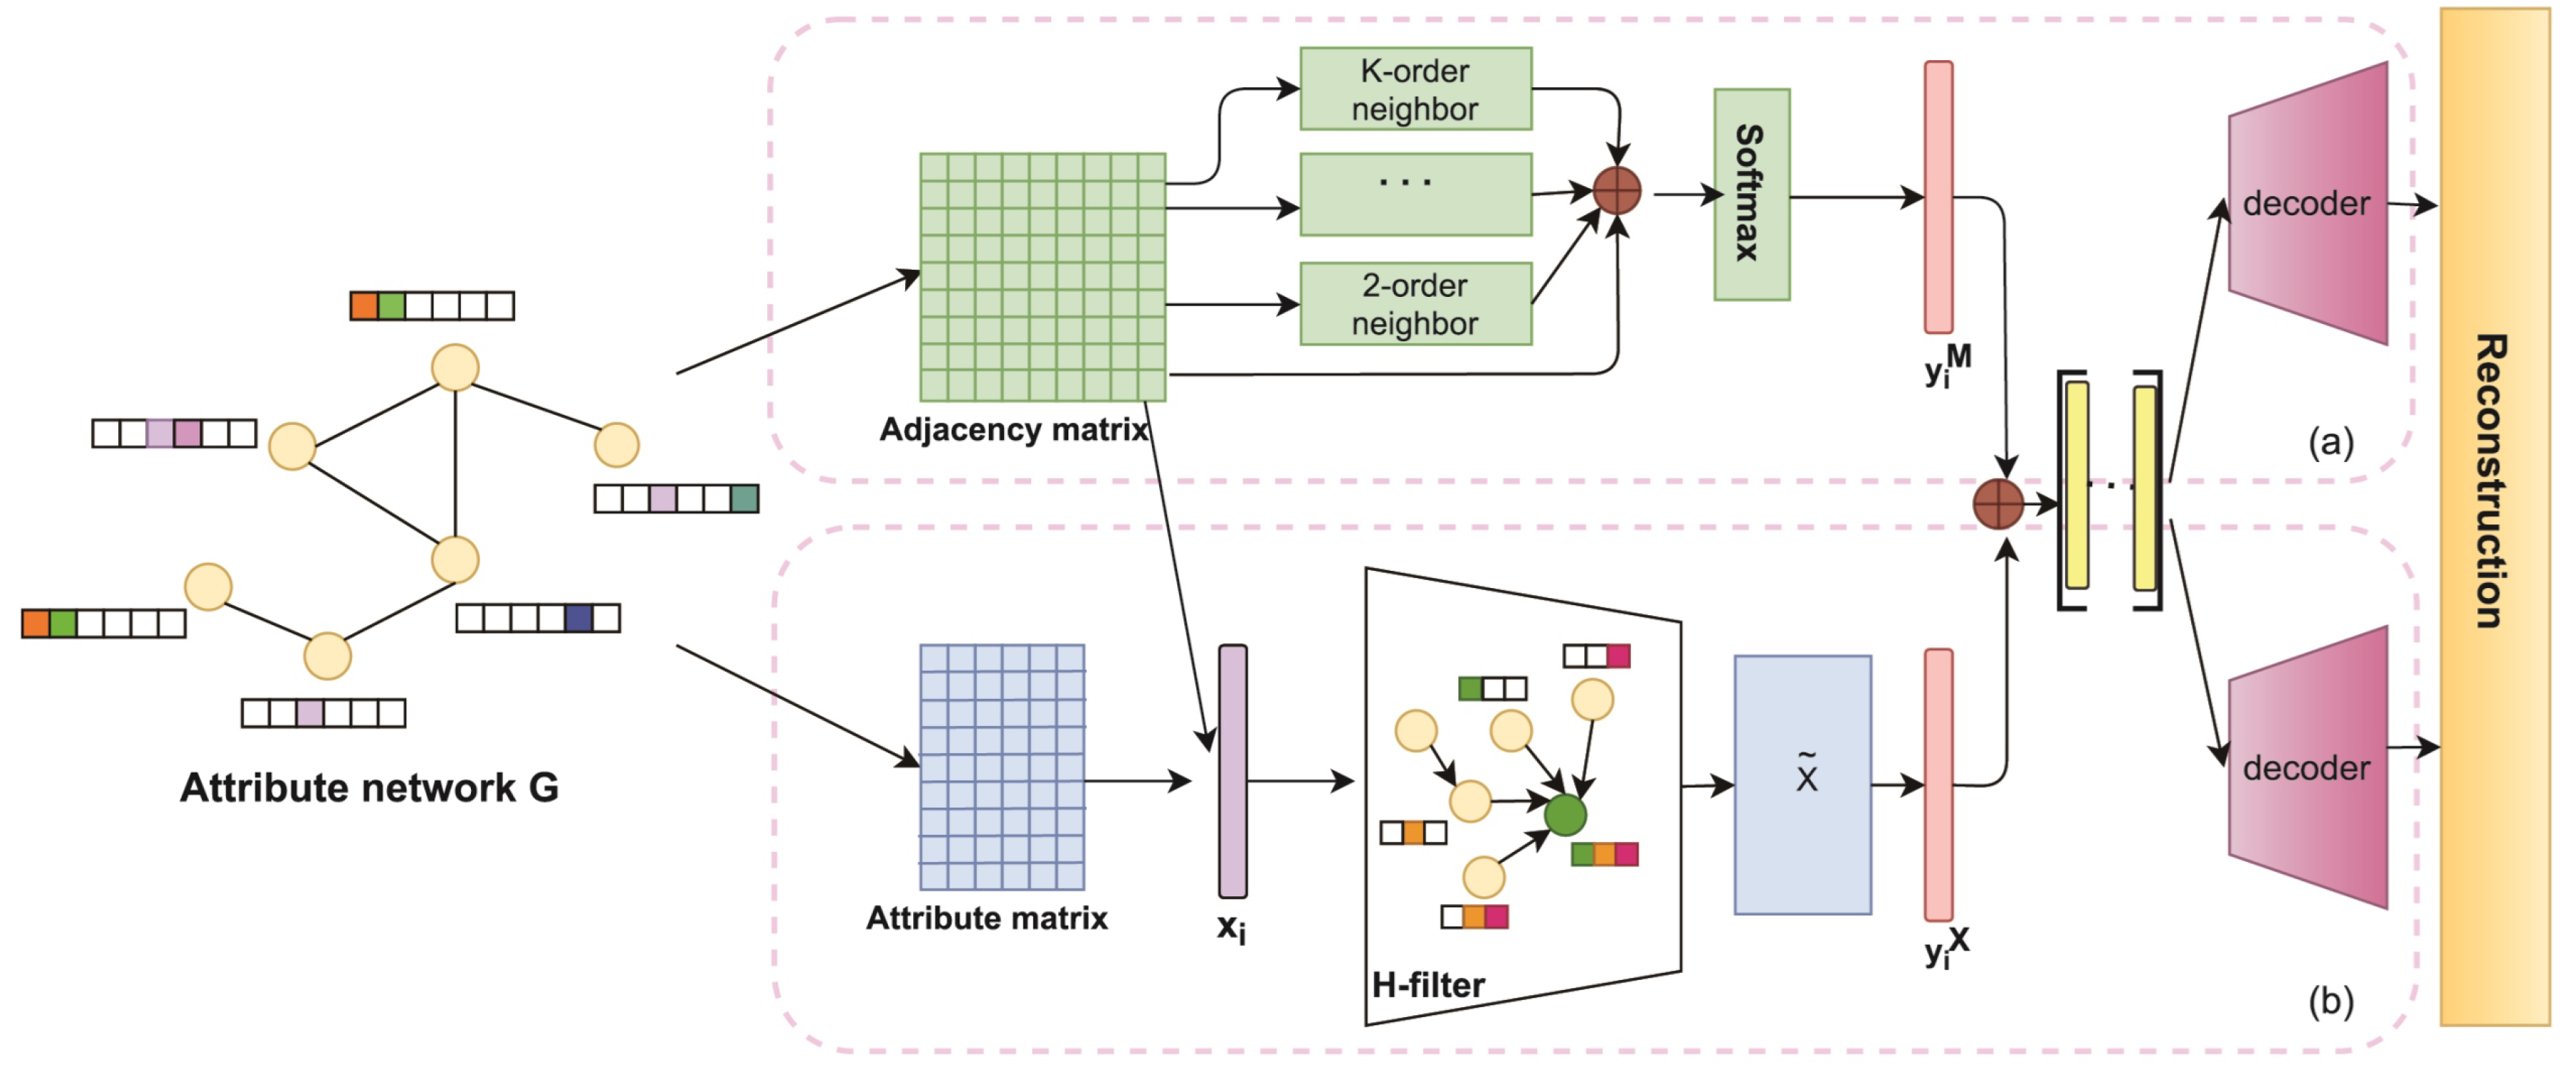
The method proposed in this paper is based on dual autoencoders for attribute network representation learning (DANRL), which deeply excavates the internal relationship between structure and node attributes and uses a dual-channel autoencoder to learn the network structure and attribute information (the autoencoder of structure and the autoencoder of attribute). One channel autoencoder uses the adjacency matrix of the network to calculate the edge weight between nodes, adopts the multi-hop attention mechanism to capture the high-order neighbor information of nodes, and learns the local and global structure of the network, and obtains the structure representation vector. The other channel autoencoder uses the node attribute matrix and adjacency matrix to design a low-pass Laplace filter. Based on the network structure, the attribute information of neighboring nodes in the neighborhood of the target node is iteratively aggregated to obtain the attribute representation vector. The dual autoencoders fully learn the network structure and attribute information and then, through adaptive fusion, input the decoder to reconstruct and obtain the reconstruction matrix. This method constructs a training set by selecting highly similar or dissimilar node pairs and monitors the joint loss function training encoder of the structural autoencoder and attribute autoencoder. Its overall framework is shown in
Figure 3.
3.2.1. Data Processing
The network structure is complex; some nodes do not have first-order proximity, but they have similar network structures, and the attribute information of nodes involves many types of data. Moreover, there are some nodes with missing and incomplete attribute information, etc. Therefore, this paper first preprocesses the node structure and attribute information.
For attribute networks, the adjacency matrix records the first-order proximity of the nodes in the network, while the first-order proximity can only reflect the local structure of the network, and some nodes may have similar neighborhood structures but do not have directly connected edges. For example, in social-network communities where people have common neighbors, they are not necessarily connected. In other words, the feature information obtained by first-order proximity alone is not enough. In this paper, the column vector of the adjacency matrix is used to encode the structural information of the nodes as the local structure of the network, and the second-order neighbor information of the network is encoded using a multi-hop attention-weighted summation.
Node attribute information usually involves many data types, and these data do not have size and order differences, and there is no direct connection between each attribute, so this paper encodes the attribute information uniquely and then splices the encoded representation of each attribute into the attribute vector representation of the node. For example, for any node
, its attribute representation vector is
,
represents the attribute encoded vector corresponding to the node
, and ⊕ represents the splicing. Then:
For the problem of missing or incomplete attribute information, traditional methods include using statistics to fill in the missing data with the mean or plural or adding a random perturbation mechanism to add perturbations to the input samples with the probability to randomly set the missing attribute information of some nodes to zero as the input vector. These methods are simple and intuitive, but they do not consider the structural information of the nodes, and there are biases in network information fusion. Therefore, in this paper, we combine the first-order proximity of the node structure and the node attribute matrix and fill the nodes with missing attribute information according to the first-order neighbor nodes of the target nodes.
3.2.2. Structural Autoencoder
To capture the highly nonlinear structural information, an unsupervised network representation learning module designed by the structural autoencoder is based on the reconstruction of the adjacency matrix task. Since it is necessary to capture both local and global highly nonlinear structural information of the network, this paper uses a graph attention mechanism to learn the importance weights between nodes and their neighbors to achieve the aggregation of weighted message-passing mechanisms.
An unsupervised network representation learning module designed by a structural autoencoder based on the task of reconstructing the adjacency matrix. Since it is necessary to capture both local and global highly nonlinear structural information of the network, this paper uses a multi-hop attention mechanism to learn the importance of weights among its neighbors to achieve the aggregation of weighted message-passing mechanisms. The geometric distances of nodes in the peripheral Euclidean space of the embedding space are also calculated, and the geometric distances are sorted to add the information of nodes that are geometrically close to each other to the aggregation operation.
First, the importance of learning neighboring nodes using the graph attention layer:
where
is the attention layer,
and
are the parameters to be learned, ⊕ denotes vector splicing, and
denotes the importance of the features of node
to node
. To make the importance weight coefficients easily comparable across nodes, we normalize
with the softmax function:
In addition to capturing information about the proximity nodes of the target node, to also capture information about nodes that are not directly connected to an edge, we diffuse the graph using multi-hop attention, a process that computes the attention scores of multi-hop neighbors based on the matrix
:
where
is the attention weight decay factor and
describes the path length from one node to another and increases the acceptance domain of nodes, i.e., nodes that are geometrically close to each other in the peripheral Euclidean space. We define a differential twist function for node distance and node proximity “distance” in the peripheral Euclidean space as follows:
where
represents the distance measure of proximity in non-Euclidean space, and
represents the distance of nodes in peripheral Euclidean space.
represents the “trade-off” between the two distances, and the smaller
means the “trade-off” between non-Euclidean and Euclidean is small, which better preserves the node proximity information and geometrically similar node information.
Finally, the neighboring features in the acceptance domain of the nodes are weighted and summed:
after adaptive decoding, the structural embedding representation is obtained.
3.2.3. Attribute Autoencoder
The attribute autoencoder is a network representation learning module that captures highly nonlinear attribute information of nodes. In the attribute learning process, the encoder performs feature mapping of the original node attributes of the network and uses a Laplace smoothing filter to mitigate the high-frequency noise in the node attributes and obtains the embedded representation of the node attributes. The structure representation and attribute representation are adaptively fused to achieve interactive learning and consistency between them, and the reconstruction of the node attribute matrix is completed.
To measure the smoothness of the attribute vector
in the graph, firstly, calculate the Rayleigh entropy of the graph Laplacian matrix
and the attribute vector
:
and
It follows that neighboring nodes should have similar values, and the more similar they are, the smoother they are. The result of Rayleigh entropy is the eigenvalue . The solution to in corresponds to the eigenvector of .
The conventional Laplace smoothing filter is defined as:
The filtered attribute vector
is:
where
is the eigenvector of
and
is the coefficient of the eigenvector. The attribute vector matrix after t-layer Laplacian filtering is as follows:
.
In the actual network analysis task, a symmetric normalized graph Laplace matrix is used, where
and
are the degree matrix and the Laplace matrix concerning the matrix
.
Thus, the Laplace matrix is:
For the choice of k values, let the maximum eigenvalues be , . In the evaluation task and result analysis section, we show the effect of different k values on the experimental results.
In this paper, the similarity of attribute information between each pair of nodes in the attribute matrix after smoothing and filtering is calculated by cosine similarity, and then the similarity information between the nodes is stored as follows:
To analyze the distribution of common attributes between different nodes, we first determine whether there are directly connected edges between node pairs based on the adjacency matrix obtained from the original network, and then we multiply the corresponding attribute encoding vectors in the attribute matrix to determine the common attributes between two nodes. This part of the encoder, like the structural encoder, consists of multilayer nonlinear functions.
3.3. Model Optimization
In this paper, the optimization objective function of the model is defined as the joint optimization of the reconstruction error of the structural autoencoder and the attribute autoencoder, and the optimization loss function is as follows:
Based on the above interpretation of the model components, a description of the DANRL algorithm is obtained as shown in Algorithm 1.
| Algorithm 1: The algorithm of DANRL. |
| Input: Attribute network , adjacency matrix , attribute matrix , filter layers t; |
| Output: Node representation matrix ; |
| 1. Calculate neighbor node importance weight from (6); |
| 2. Normalized from (7); |
| 3. for n = 2, 3,..., n |
| 4. Calculate Euclidean distance and twist from (9); |
| 5. end for; |
| 6. Obtain node structure embedded representation ; |
| 7. Obtain Laplacian from (16); |
| 8. ; |
| 9. Get filter matrix from (17); |
| 10. Get the smoothed attribute matrix from (14); |
| 11. Calculate node attribute similarity matrix from (18); |
| 12. Obtain node attribute embedded representation ; |
| 13. for epoch = 1, 2,..., custom do |
| 14. Update encoder parameters; |
| 15. Calculate the joint optimization loss function; |
| 16. end for; |
4. Experiments and Results Analysis
In this paper, extensive experiments were conducted to verify the superiority of DANRL by experimenting on four real network datasets and comparing them with traditional network representation learning methods and methods that incorporate node attribute information.
Experimental environment: Intel(R)Core(TM)i7-7700 CPU @ 3.6 GHz 3.6GH, GeForce GTX 1060Ti; Python 3.7.3, PyTorch 1.3.1.
4.1. Experimental Dataset
We performed statistics on the four datasets involved in this paper, and the results are shown in
Table 2. The datasets are described in detail as follows.
Citation networks: Citeseer, Pubmed, and Cora all belong to citation networks. In citation networks, network nodes represent papers, and connected edges represent citation relationships between papers. Node labels are the research topics of papers, i.e., classification results, and node attributes represent the attribute features of each paper, such as keywords, year of publication, and research keywords. The Citeseer dataset classifies papers into six categories: Agents, AI, DB, IR, ML, and HCI; The Pubmed dataset comes from 19,717 papers on diabetes in the Pubmed database, and this dataset classifies papers into three categories; the Cora dataset consists of papers related to machine learning, and in this dataset, papers are classified into seven categories.
The Wiki dataset is a network of nodes as web pages, the links between different nodes are hyperlinks in the web pages, and the textual information on the web pages is processed similarly to the textual information in other datasets to extract attributes.
4.2. Comparison Algorithm and Parameter Setting
In this paper, the DANRL algorithm is compared with eight representative network representation learning methods, including three traditional algorithms (Deepwalk, Node2vec, LINE) and five algorithms that combine attribute information (TADW, DANE, AANE, GAE, VGAE). 10% of the dataset is taken as the test set, 10% as the validation set, and the remaining 80% as the training set, and the training samples are adaptively reselected every time the threshold is updated. The comparison algorithm is divided into two groups:
(1) Traditional structure-based network representation learning methods. These algorithms only consider the structural information of the network and do not combine network attribute information for node representation learning. Deepwalk and Node2vec algorithms, use random wandering to generate sequences of nodes and then input the sequences to the skip-gram model to learn the potential node representation vectors. LINE is a representation learning method that uses first-order similarity and second-order similarity to preserve the local and global structure information of the representation learning method.
(2) Attribute network representation learning methods. The difference between these methods and the traditional structure-based representation learning methods is that the attribute information of the nodes is also considered, and the similarity between the structure of the original network and the attribute information is maintained when learning the vector representation. Examples include the TADW method, which was the first to combine external information (textual information), the DANE method, which focuses on nonlinear information about structure and attributes, and the VGAE method, which uses the combined attribute similarity of a variational autoencoder to reconstruct the network structure.
In this paper, the node representation vectors learned by the two major classes of methods described above are used for the node clustering task, thus evaluating the effectiveness of the methods. In the algorithm that requires random wandering, the number of wandering nodes is set to 80, the step size to 10, and the window size to 10. The regularization term coefficient of TADW is 0.1, and the embedding dimension of all algorithms is set to 256. The parameters of the DANRL algorithm for different data sets are set in
Table 3.
4.3. Evaluation Tasks and Analysis of Results
In this paper, we measure the DANRL algorithm performance through a common downstream task of network analysis, the node clustering task. Node clustering is an unsupervised method in which nodes are grouped into clusters, and we calculate the accuracy of node clustering by comparing the obtained label results with the true labels, and normalized mutual information (NMI) is used to measure the similarity of the clustering results, which takes values in the range of [0, 1], with larger accuracy and NMI values indicating better clustering results. The node-clustering task is used to evaluate the effect of the results of node embedding on subsequent, e.g., network analysis tasks such as community detection, to obtain a comparison between the labeled results and the true labels to calculate the accuracy of node clustering. Specifically:
where
is the label after clustering,
is the true label of the data,
n is the total number of data, and
is the comparison indicator function.
The standardized mutual information (NMI) is used to measure the similarity of clustering results, and is one of the important indicators for community detection. Its value is in teh range of [0, 1], and a larger value indicates that the clustering results are more similar, as defined below:
where
X denotes the true label of the data,
Y denotes the label after the clustering algorithm,
denotes the similarity between the computed result and the actual label;
denotes the joint probability distribution between
X and
Y, and
,
denote the edge distribution.
The node clustering task accuracy and NMI experimental results are shown in
Table 4, where the bolded values are the results of the algorithm DANRL in this paper, the underlined ones are the optimal results, and “−” indicates no experimental results. Because the NMI results of node2vec and LINE algorithms for clustering tasks on the Wiki dataset are poor, they are not presented, and the NMI results of the AANE algorithm on the Pubmed and Wiki datasets are unstable, so they are not compared. For the Cora dataset, the precision of the DANRL algorithm is 0.775, which is 7.3% better than the 0.702 of the suboptimal DANE algorithm. For the Wiki dataset, the precision and NMI of the optimal results are 0.473 and 0.499, respectively, which are slightly higher than the 0.468 and 0.497 of the DANRL algorithm, but the DANRL algorithm is close to the optimal results. For the Citeseer dataset, the DANRL accuracy and NMI are 0.705 and 0.458, which are significantly higher than the suboptimal results of 0.479 and 0.422 in other algorithms, with an improvement of nearly 23% and 3%. This proves that the algorithm in this paper has better performance on the clustering task.
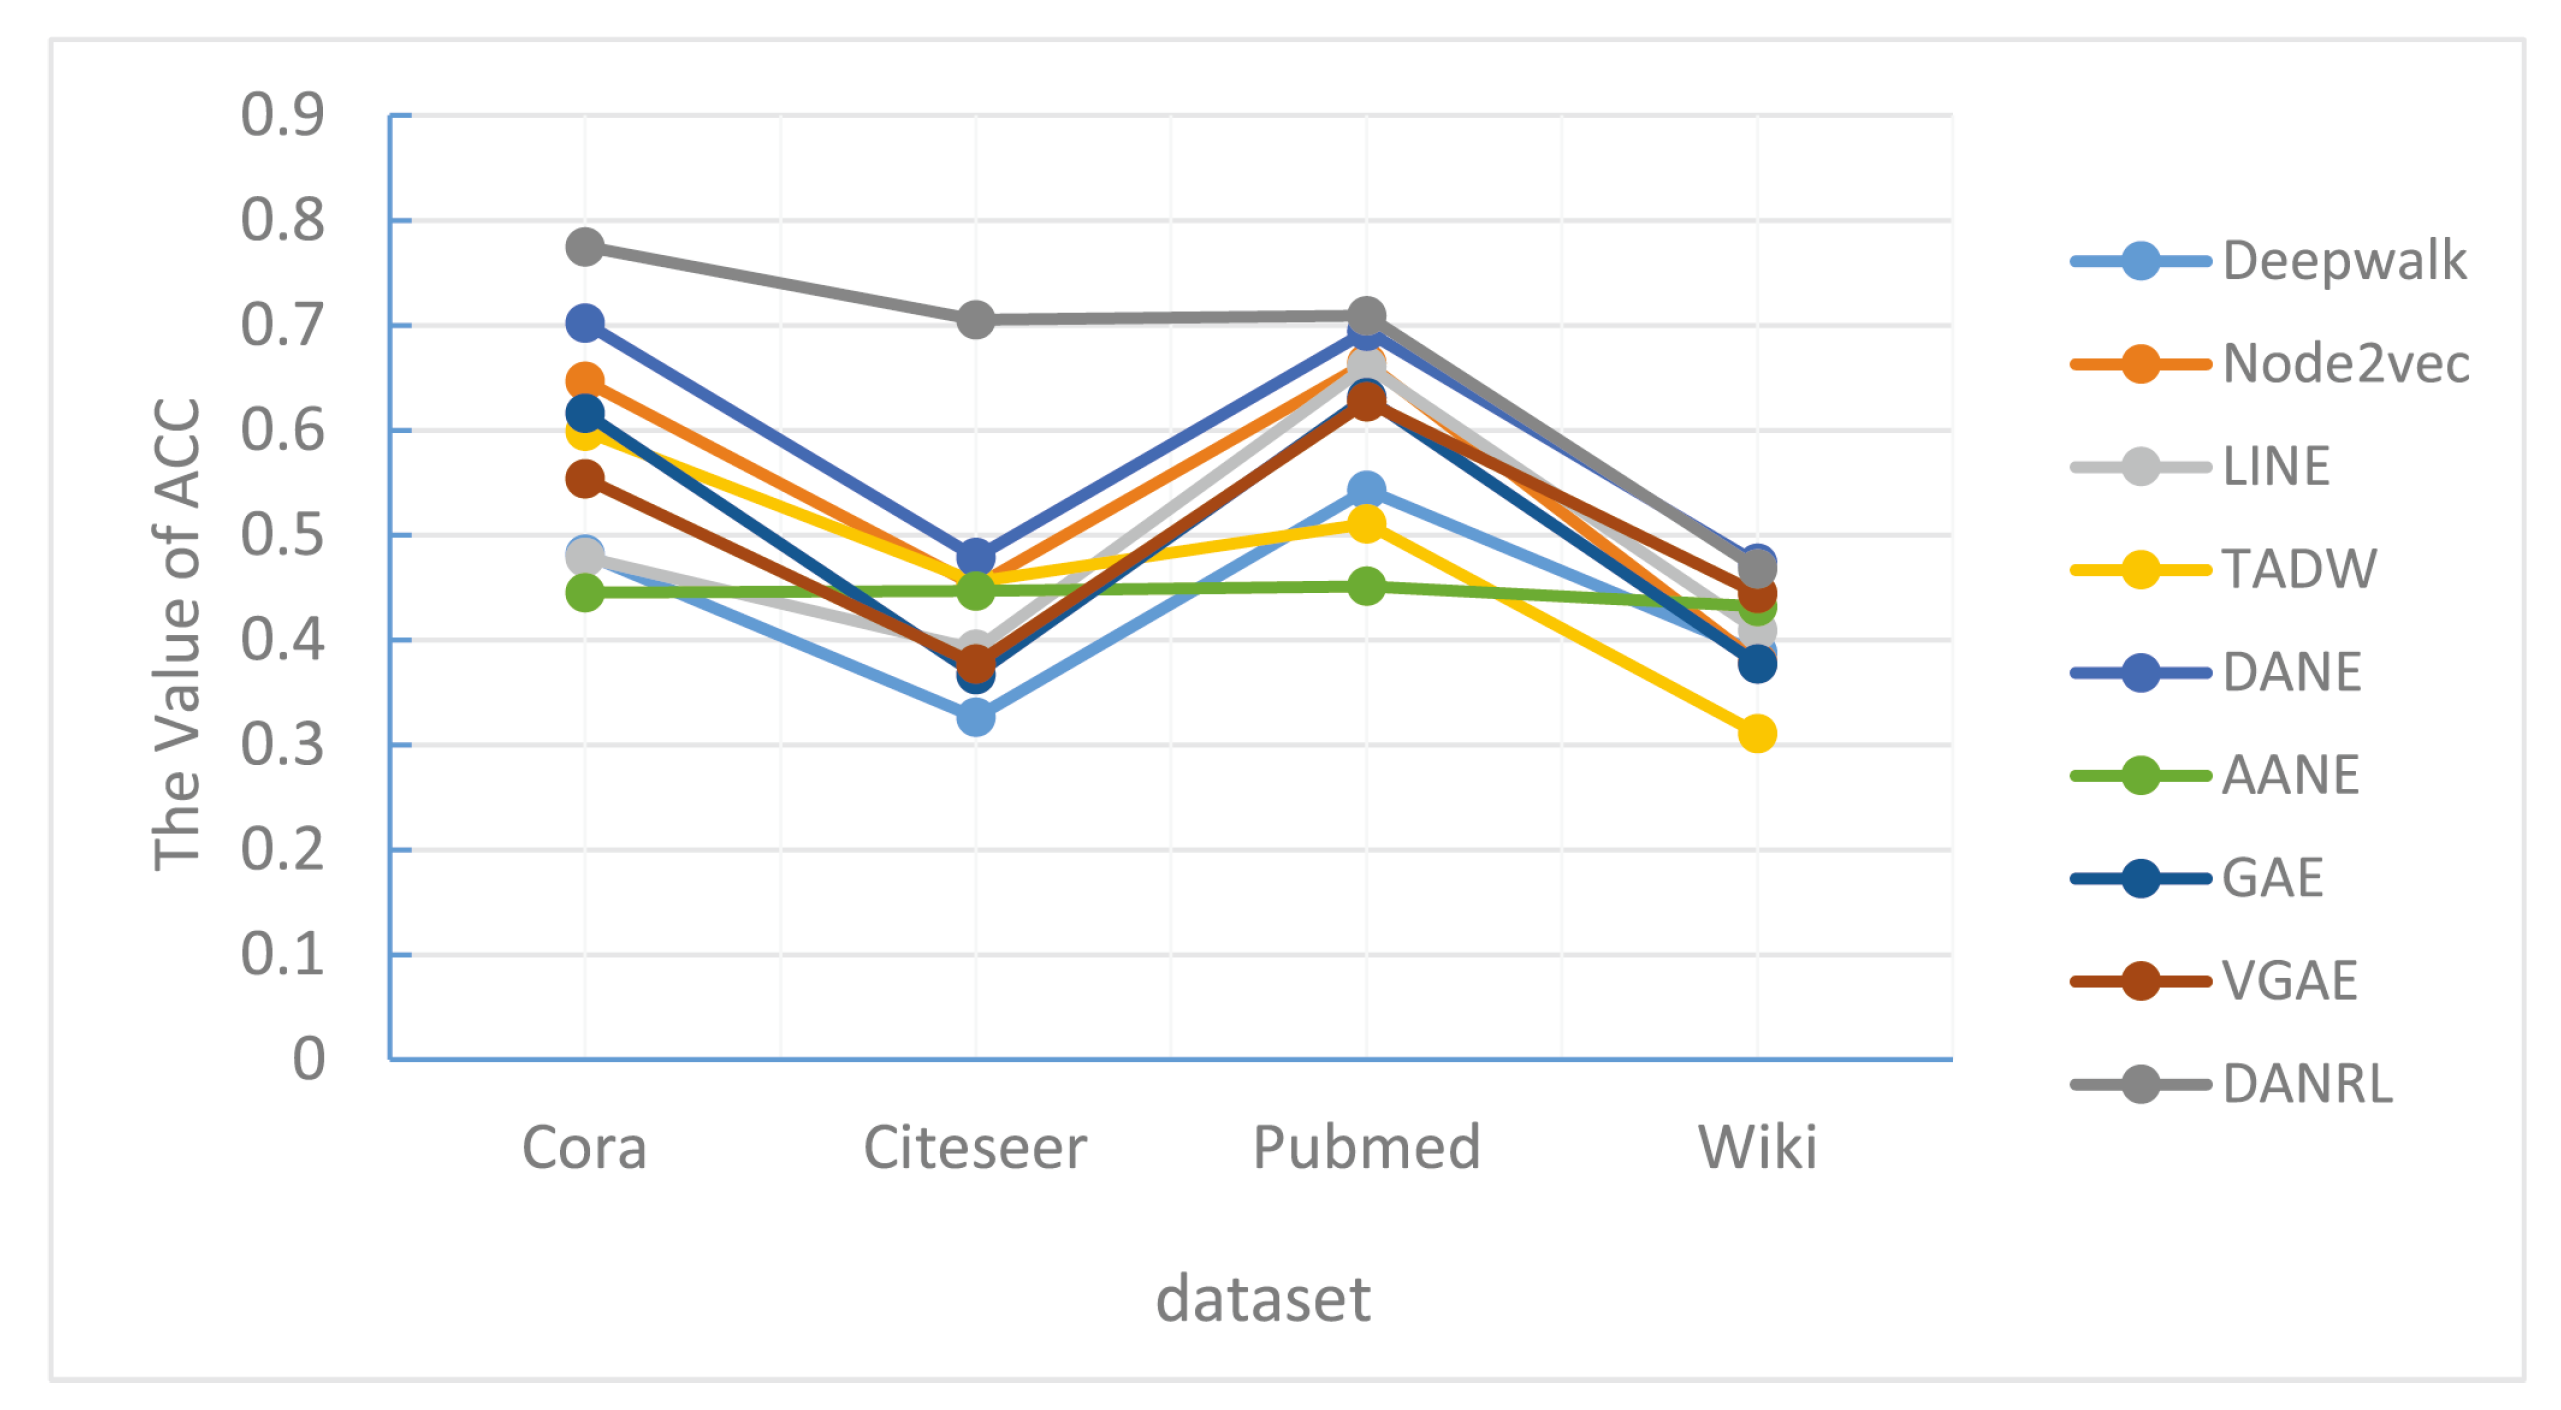
Figure 4 is a visualized line graph of the accuracy results of the DANRL algorithm and other algorithms for the node clustering task on different datasets. The vertical axis represents the clustering accuracy (ACC), the horizontal axis represents the different four datasets, and the dark gray dash indicates the algorithm in this paper. It can be found that on the Citeseer dataset, the clustering accuracy of the DANRL method is much higher compared to the other algorithms. The accuracy results are highest on the Cora dataset and not so high on the Wiki dataset, but compared to other representation learning algorithms, the results of this paper’s method are highest on this dataset, indicating that network attribute information is of different importance for different network structures, and that is not the case that the more attributes are combined the better.
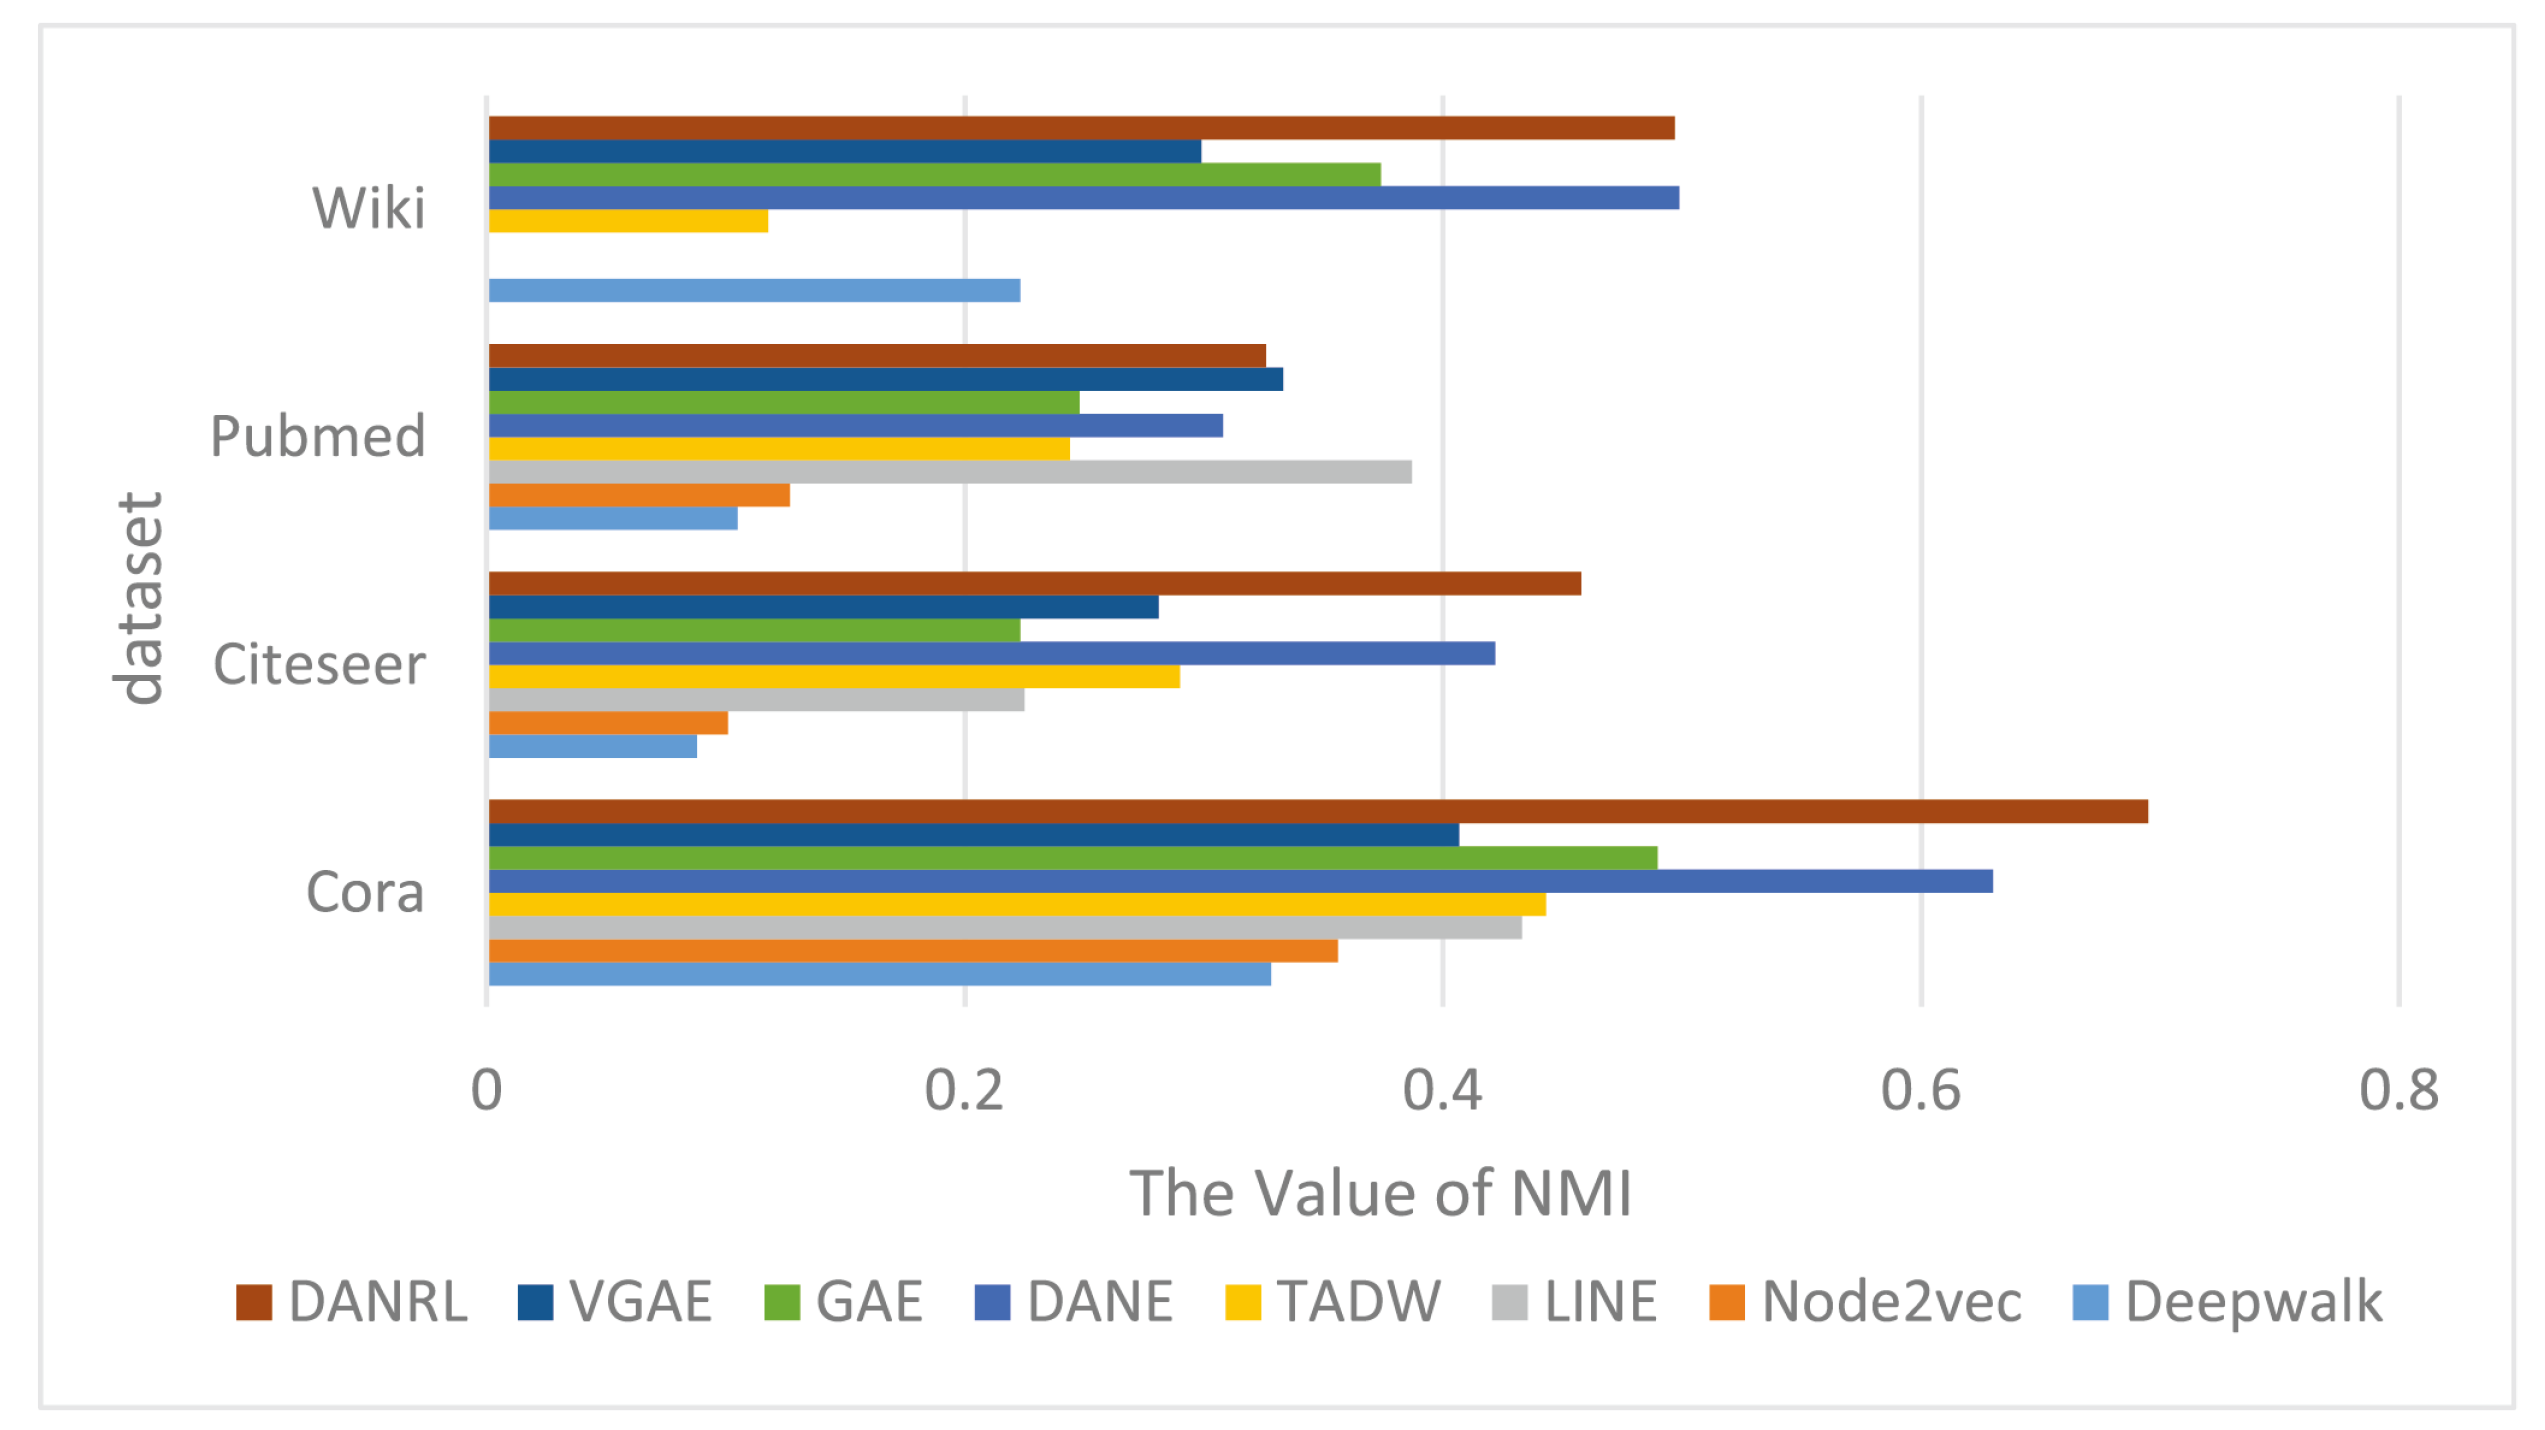
Figure 5 shows the visualization results of the node-clustering NMI evaluation metrics on all network data, where the dark red color represents the results of the DANRL algorithm proposed in this paper. The model architecture of the dual autoencoders proposed in this paper, where the structure and node attributes learn interactively and constrain each other, shows advantages in different networks, and although some of the network results are not optimal, they are close to the best results.
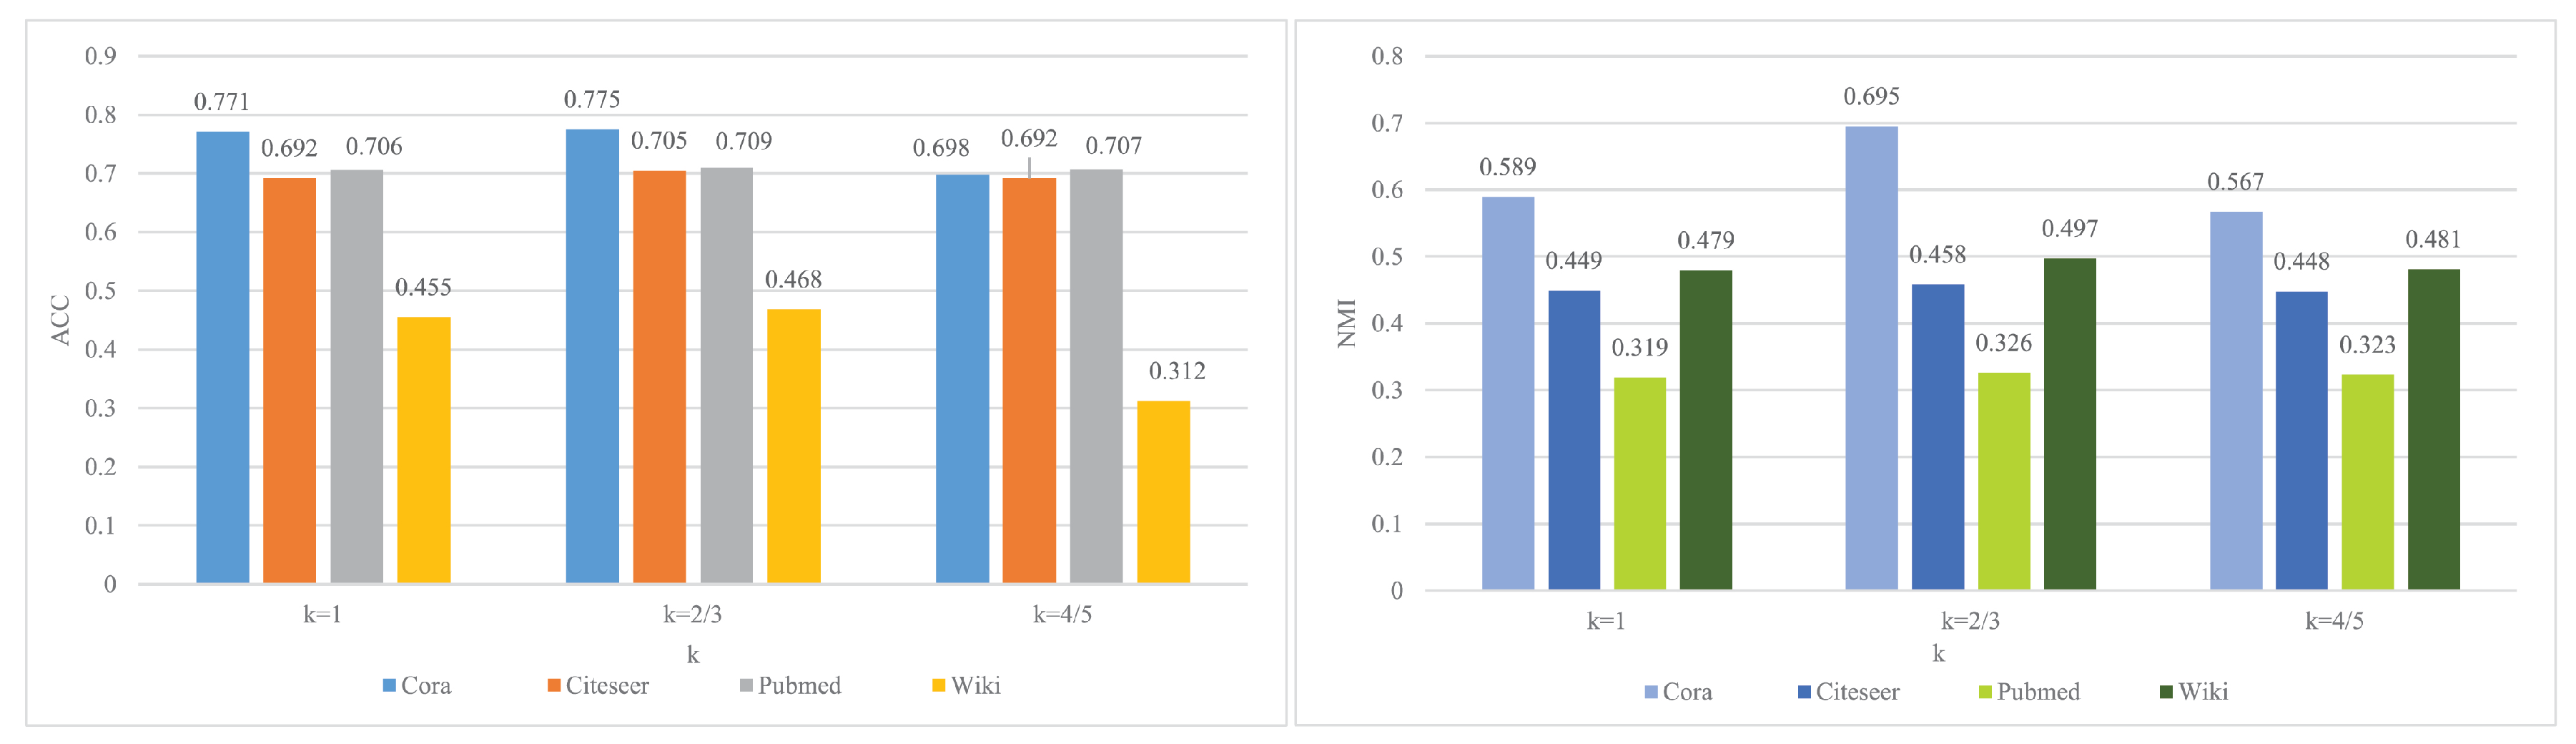
Figure 6 shows the experimental results for different
k values. The left graph clusters ACC metrics and the right graph shows clustering NMI metrics. In the left panel, the vertical axis indicates the clustering accuracy, and the horizontal axis indicates different
k values. The ACC metrics of Cora and Citeseer networks are optimal when
, and the difference between the results on Pubmed and Wiki networks and
is not very obvious, but from
to
and
, ACC is optimal at the place closest to the inverse of the maximum eigenvalue of each network (i.e.,
). In the right panel, the vertical axis is the clustered NMI values, the horizontal axis is the different k values, and the four colors are the four data sets. At
, most of the histograms are the highest, and only the light green and dark blue results do not differ much at different
k values, proving that the low-pass filter designed in this paper is an improvement over the traditional convolution operation.
Table 5 shows the average running time of the DANRL algorithm compared with other algorithms, where the bolded values are the results of the algorithm DANRL proposed in this paper. Deepwalk is chosen for the traditional representation learning method, and three methods are chosen for combining attribute information: TADW, GAE, and VGAE. The average running time of the DANRL algorithm for one epoch on the Cora dataset is 0.4602 s, compared to the running time of the TADW algorithm of 0.8546 s, the running time of the GAE algorithm of 0.5554 s, and the VGAE algorithm’s running time of 0.5063 s, which is much shorter. For the relatively large dataset Pubmed, the running time of the DANRL algorithm is 17.4906 s, which is shorter than the running time of all four of the other methods. While the Wiki dataset is small and has a lot of attribute information, Deepwalk does not consider the node attributes, so the running time is the shortest at 1.4997 s. In summary, the results show that the efficiency of the methods in this paper is better.
4.4. Model Variants
To verify the effectiveness of the method proposed in this paper, the variant model was set up with the same parameter settings as shown in
Table 3, and the experimental results are shown in
Table 6, where the bolded values are the results of the method proposed in this paper. For the Citeseer dataset, the accuracy of the dual autoencoders is 0.705, and the accuracies of the variant models are 0.699 and 0.692, and the model in this paper is improved by nearly 1 percentage point. For the Cora and Pubmed datasets, the accuracy of only the structure encoder (i.e., M) is 0.666 and 0.506, respectively, and the results are much worse than the accuracy of the dual encoders, 0.775 and 0.709, but the accuracy of only the attribute encoder (i.e., X) is 0.753 and 0.673, and the results are better than those of the other variant model, indicating that the network structure and attribute information for different datasets have different levels of importance. Compared with the first two model variants, the accuracies are 0.775, 0.705, and 0.709 on the three data sets, which are all improved and prove the superiority of the model in this paper.
Figure 7 is a histogram of the clustering accuracy (ACC) of the variant model versus the model in this paper. The vertical axis is the accuracy value and the horizontal axis is the dataset. The blue color is the result of this paper’s model, the light purple color is variant 1, i.e., only the structural encoder, and the gray color is variant 2, i.e., only the attribute encoder. From the bar height, we know that the results for the Citeseer dataset do not differ much, and on the Pubmed and Cora datasets, the model of this paper reflects a clear advantage. The reason is that the Citeseer dataset has a relatively small number of nodes, but a large number of attributes and edges, and the hidden geometric structure and attribute information appear for this problem.


