Article

MCPANet: Multiscale Cross-Position Attention Network for Retinal Vessel Image Segmentation

College of Computer Science and Engineering, Northwest Normal University, Lanzhou 730070, China
*
Authors to whom correspondence should be addressed.
These authors contributed equally to this work.
Symmetry 2022, 14(7), 1357; https://doi.org/10.3390/sym14071357
Submission received: 24 May 2022 / Revised: 21 June 2022 / Accepted: 24 June 2022 / Published: 1 July 2022
(This article belongs to the Special Issue Image Processing and Symmetry: Topics and Applications)

Abstract

:
Accurate medical imaging segmentation of the retinal fundus vasculature is essential to assist physicians in diagnosis and treatment. In recent years, convolutional neural networks (CNN) are widely used to classify retinal blood vessel pixels for retinal blood vessel segmentation tasks. However, the convolutional block receptive field is limited, simple multiple superpositions tend to cause information loss, and there are limitations in feature extraction as well as vessel segmentation. To address these problems, this paper proposes a new retinal vessel segmentation network based on U-Net, which is called multi-scale cross-position attention network (MCPANet). MCPANet uses multiple scales of input to compensate for image detail information and applies to skip connections between encoding blocks and decoding blocks to ensure information transfer while effectively reducing noise. We propose a cross-position attention module to link the positional relationships between pixels and obtain global contextual information, which enables the model to segment not only the fine capillaries but also clear vessel edges. At the same time, multiple scale pooling operations are used to expand the receptive field and enhance feature extraction. It further reduces pixel classification errors and eases the segmentation difficulty caused by the asymmetry of fundus blood vessel distribution. We trained and validated our proposed model on three publicly available datasets, DRIVE, CHASE, and STARE, which obtained segmentation accuracy of 97.05%, 97.58%, and 97.68%, and Dice of 83.15%, 81.48%, and 85.05%, respectively. The results demonstrate that the proposed method in this paper achieves better results in terms of performance and segmentation results when compared with existing methods.

1. Introduction

The eye is an extremely important component of the human organism. However, in recent years, the incidence of various ocular diseases such as cataracts, glaucoma, and diabetic retinopathy has been increasing every year. Not only do retinal vascular features indicate the development of ocular diseases, but they are also used by physicians as indicators for the diagnosis of cardiovascular disease, because some diseases in the human body cause minor changes in the retinal vasculature. Take diabetes for example, which often causes thickening of the walls of small retinal vessels and increased permeability, making them more susceptible to deformation and leakage [1]. Diabetic retinopathy, as one of the complications of diabetes mellitus, will cause blindness in severe cases. Therefore, segmentation of retinal vessels for diagnosis by physicians would be able to give warning of the occurrence or progression of a large number of diseases. However, manual segmentation of blood vessels from fundus images is a very complex and time-consuming task [2]. The distribution of blood vessels in the fundus is often not symmetrical, and the small blood vessels are densely distributed. This usually requires doctors to have high proficiency to ensure the accuracy of segmentation.
Automated vessel segmentation has been studied for many years now. With a wave of machine learning, many researchers have applied this technique to retinal vessel segmentation. Machine learning methods are usually classified as supervised and unsupervised methods. In retinal fundus segmentation, unsupervised methods refer to retinal vessel images, which do not require manual annotation. Similar to using high-pass filtering for vessel enhancement [3], Gabor wavelet filters to segment vessels [4], focusing on the pre-processing of retinal images with luminance correction [5], and using spatial correlation and probability calculations and processing images using Gaussian smoothing [6]. Some researchers have applied the EM maximum likelihood estimation algorithm [7] and the GMM expectation-maximization algorithm [3] to the retinal vessel and background pixel classification as well. All of these methods have contributed to retinal vessel segmentation, but there are still problems of not high enough accuracy and speed. In recent years, researchers have applied deep learning to an increasing number of fields. The emergence of deep convolutional neural networks [8] has pushed retinal vessel segmentation to another high point. Compared with traditional machine learning methods, deep convolutional neural networks are highly capable of extracting effective features of data [9]. Following the proposal of U-Net [10], many methods based on U-Net improvements proliferated. To alleviate the problem of gradient disappearance, DENSENet [11] enhances feature transfer and has a smaller number of parameters. U-Net++ [12] uses multiple layers of skip connections to grab features at different levels on the structure of the encoder-decoder. Multiple networks are combined to be more adapted to small datasets of retinal vessels [13]. All of these approaches have demonstrated to varying degrees the effectiveness of convolutional blocks for feature extraction and for segmenting blood vessels from retinal images. However, each convolutional kernel in a convolutional neural network (CNN) has a limited receptive field and can only process local information but cannot focus on global contextual information. There has been a lot of work tending to use feature pyramids [14] and void convolution to increase the receptive field and obtain features at different scales. Deeplabv3 [15] uses void convolution with different expansion rates and pyramid pooling operations to aggregate multi-scale contextual information. PSPNet [14] proposed pyramid pooling for better extraction of global contextual information. Attention mechanisms have made efforts in focusing on important features of images. Res-UNet [16] added a weighted attention mechanism to the U-Net model to better discriminate between vascular and background pixel features. The connection between two distant pixels on an image is also important for more accurate segmentation in medical image segmentation tasks. There are some works to capture long-distance dependencies by repeatedly stacking convolutional layers, but this approach is too inefficient and also leads to deepening the number of network layers. Non-local blocks [17] are proposed to capture such long-range dependencies, and their operation does not only target local regions. The weighting of all location features is considered when calculating the features at a location, and it is also able to accept inputs of arbitrary size. The fully connected network [18], although targeting global information, brings a large number of parameters and can only have fixed size inputs and outputs. Therefore, the structure of non-local blocks not only solves this problem but also allows easy insertion into the network structure. However, the effectiveness of non-local blocks is also accompanied by an increase in computational effort, and this is where improvements need to be made.
To better capture the contextual information and improve the accuracy of retinal vessel segmentation, we propose a new retinal vessel segmentation framework called Multiscale Cross Position Attention Network(MCPANet). We propose cross position attention to capture long-distance pixel dependencies. In addition, to reduce the computational effort, only the correlation of a pixel with its peer and the same column position pixel is computed at a time. By superimposing the position attention twice, we can get the global features associated with the pixel and thus obtain the global contextual information. In addition, four different scales of pooling operations are introduced at the end of downsampling to expand the receptive field. Since the fundus vessels have many fine endings, a very important reason affecting the segmentation accuracy lies in the fact that these fine and asymmetric vessel pixels are not properly classified. Therefore, to capture this detailed information, we use multiple scales of image input, aiming to provide more comprehensive information. Our main work has the following three aspects:
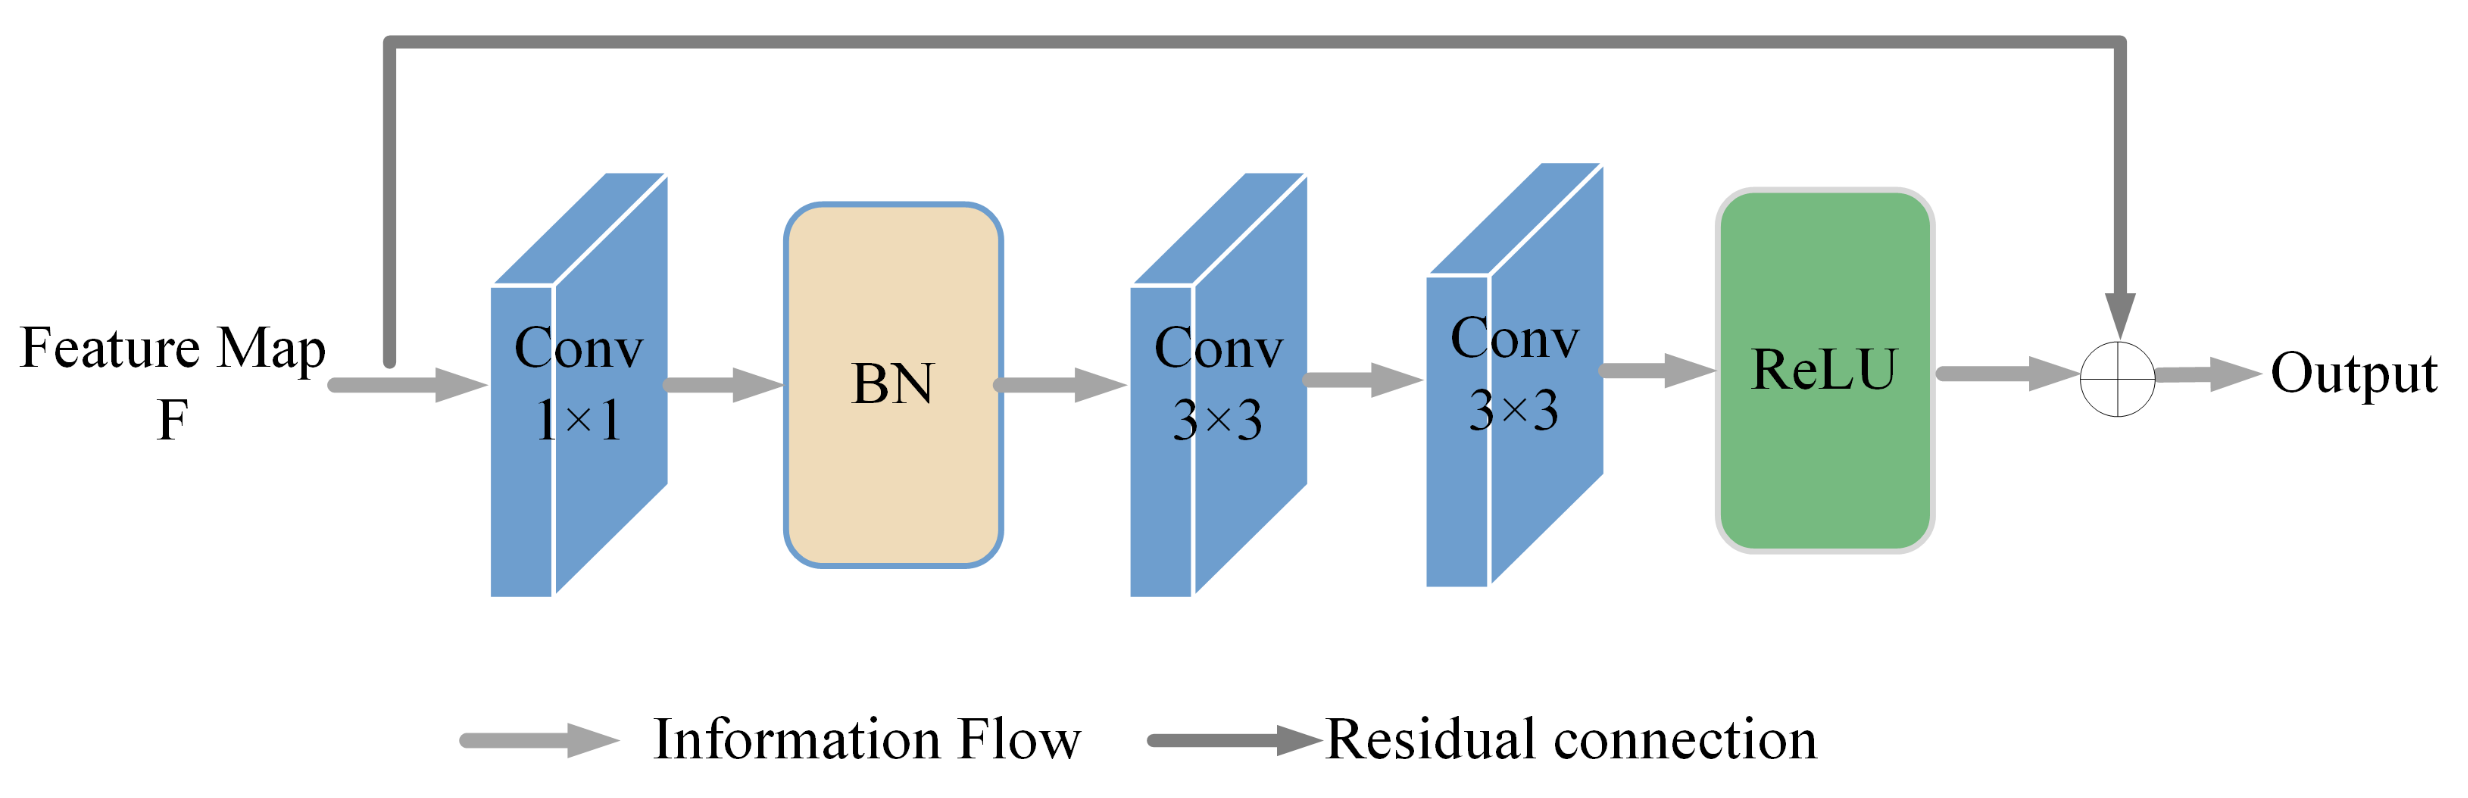
  • A new multi-scale cross-position attention mechanism for the retinal vessel segmentation framework is proposed, and the residual connection is used in the network to improve the feature extraction ability of the network structure and reduce the noise in the segmentation. The use of pooling operations at different scales to expand the receptive field results in a significant reduction in the loss of information about tiny vessel features.
  • A cross-position attention module is proposed to obtain the contextual information of pixels and build a relational model with the contextual information associated with them on local detail features, which not only operates on the whole image but also focuses on finer details present in local blocks. It also reduces the computation and memory usage in non-local blocks, and our model has only a small number of parameters.
  • Trained and validated on three publicly available retinal datasets, DRIVE, CHASE, and STARE, our model performs well in terms of performance and segmentation results.
The rest of this paper is organized as follows. We first describe our network architecture in Section 2. Then, the dataset and evaluation metrics are presented in Section 3. The validation experiments are given in Section 4 and the experimental results are analyzed. Section 5 is the discussion part, and it finally concludes in Section 6.

2. Methods

In this section, details of the multi-scale cross-position attention network MCPANet for retinal fundus vessel segmentation are given. The network structure is first shown, and then the residual coding block and decoding block structures are introduced. Next, we introduce the cross-position attention module, which can better obtain contextual information and reduce the amount of computation and memory usage. To further improve the segmentation results, we introduce the Dice loss function to supervise the final segmentation output.

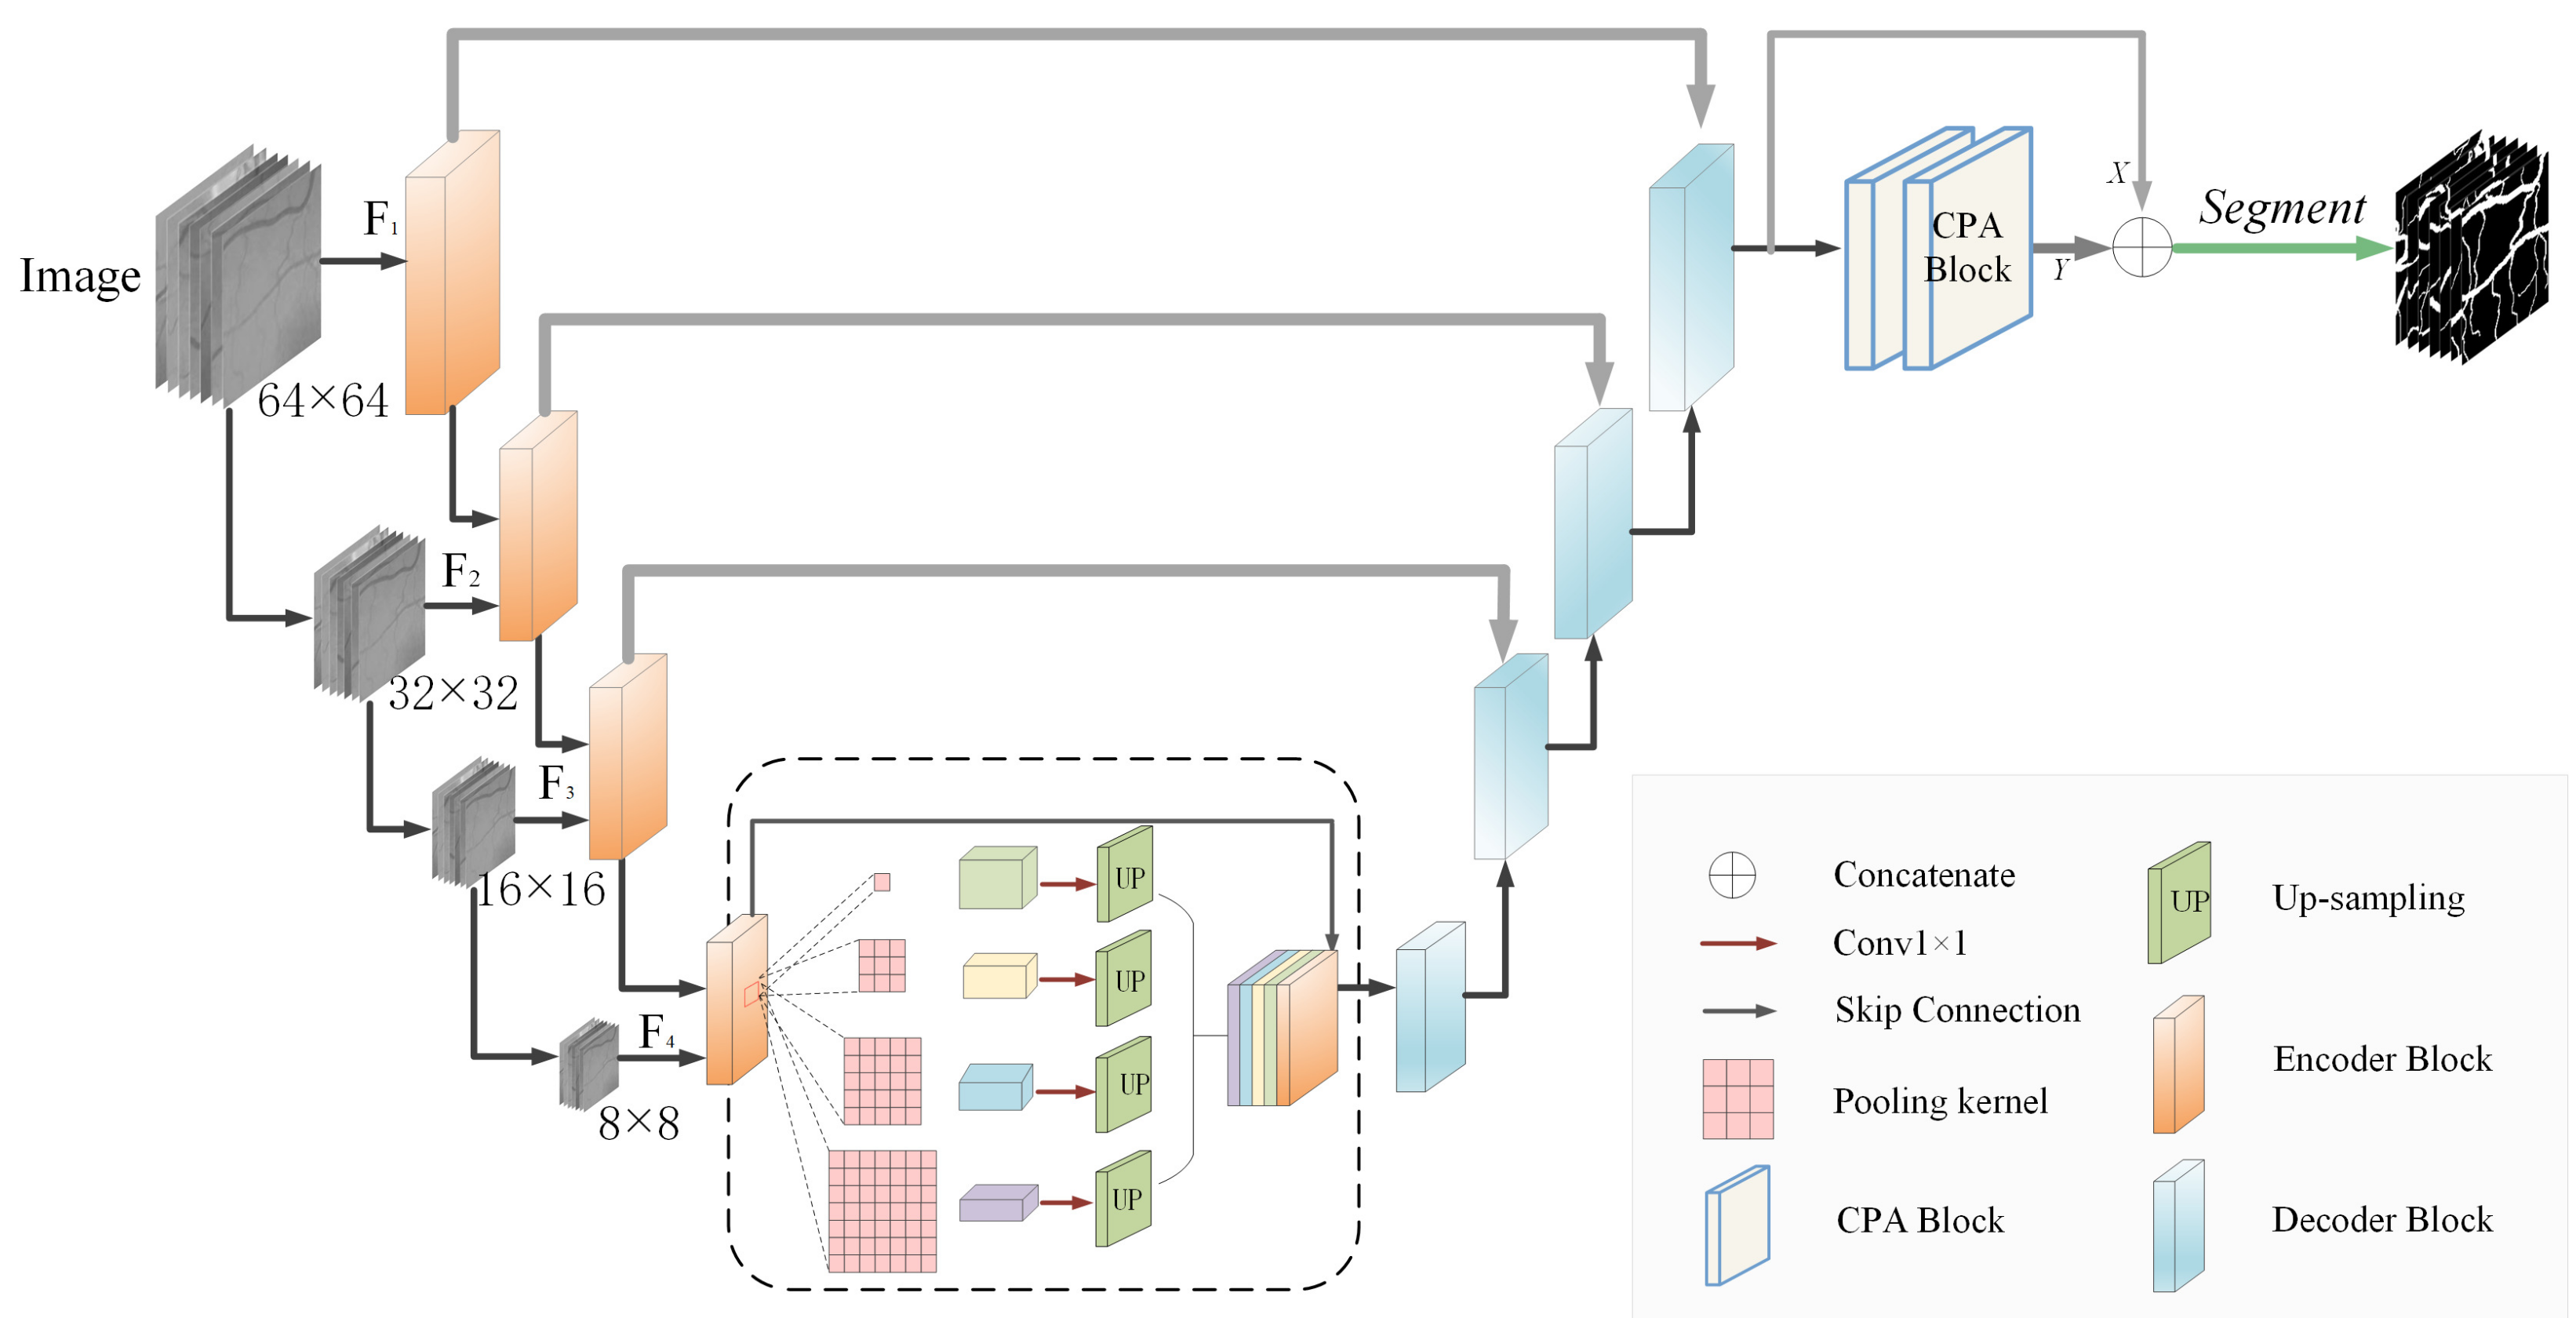
2.1. Network Architecture

The work in this paper is based on the classical U-Net network structure [10], which is an end-to-end network consisting of an encoder and decoder. The encoder is considered a feature extractor that sequentially acquires high-dimensional features across multiple scales. In addition, the decoder uses these encoded features to recover segmentation targets [9]. The overall network structure of MCPANet consists of two parts. The first part is a U-Net-based network with four layers of encoder-decoder branches, which process slices of the original retinal vascular images to better extract detailed information about the endings of the fundus vessels. We used feature map inputs at different scales, with each layer having image input sizes of 64 × 64, 32 × 32, 16 × 16, and 8 × 8 pixels, which allows the network to learn image features at multiple scale representations. Skip connections are established between each encoder and decoder block for the better extraction of image features. Due to the high amount of fundus detail information, we include residual connections in the encoder part to prevent information loss. Four different scales of pooling operations are used at the bottom of the network to increase the receptive field and encode the contextual information, followed by a 1 × 1 convolutional dimensionality reduction. To match the size of the original feature map, we perform an upsampling to fuse the feature map and connect it with the original feature map to feed the decoder block. The second part is the cross-position attention module (CPA), which performs further contextual information extraction on the output results of the network. By placing two CPA modules serially, we can obtain global position information. The feature map Y output by the CPA module is connected with the previous feature map X and then the segmentation result is output by the segmentation layer. The final result is supervised by the DiceLoss function. The network structure of the MCPANet is shown in Figure 1.

2.2. Encoder and Decoder Structure

In the encoding stage, we use the same encoder block for each encoder. When the convolution operation is performed on the feature map, the output obtained is smaller compared to the original feature map, and it causes the loss of retinal fundus vessel pixel information. Therefore, we propose a coding block based on the residual connection to compensate for the retinal fundus vessel pixel information. The specific procedure is as follows: for the input image, a 1 × 1 convolution is first performed, and then a batch normalization operation is performed to ensure the nonlinear representability of the model. Then, the features are extracted using two consecutive 3 × 3 convolutions. Finally, the ReLU function is used as the activation function. The residual connection allows the information of the original feature map to be passed in before going through a series of operations and outputting the feature map. This enables the extraction of retinal fundus vessel features in a more efficient manner. In Figure 2 is a detailed implementation of the encoder block.
For the decoder block, we use the universal decoding structure, that is, a simple convolutional layer. The upsampling layer uses transposed convolution and the activation function uses the ReLU function.

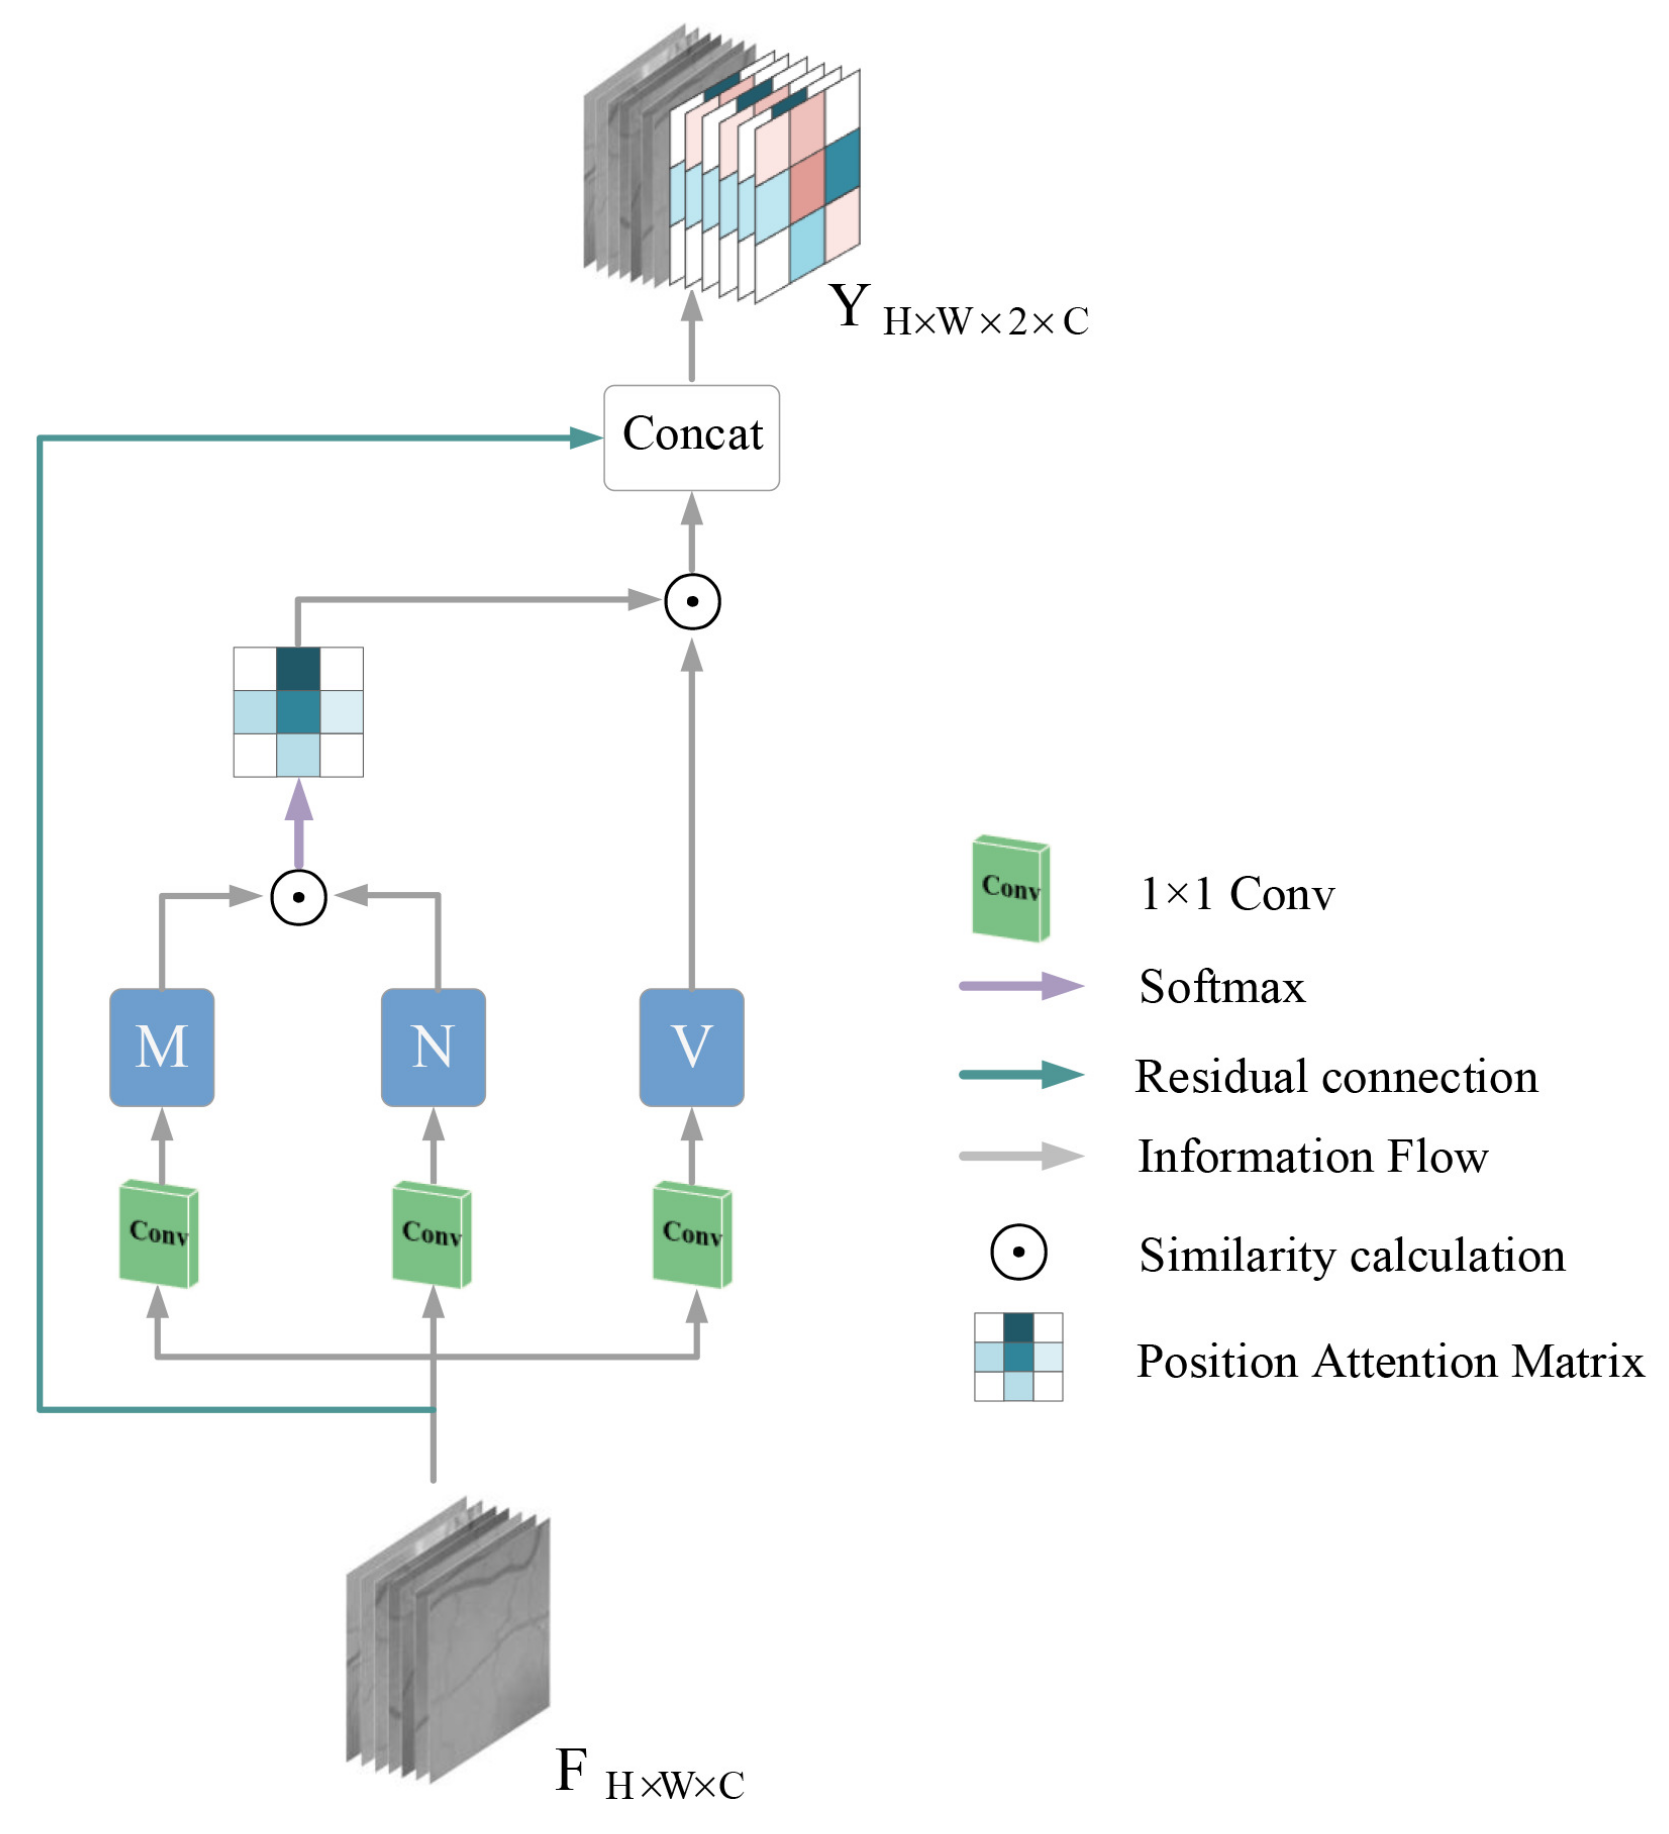
2.3. Cross-Positional Attention Module

In this section, we describe the details of the cross-position attention module(CPA). For the feature map obtained in the backbone network, although the deep CNN is able to eliminate the background regions unrelated to the vessel pixels, the less obvious capillary information is often easily lost. Therefore, in order to model the relationship of contextual information associated with local detail features, we introduce the cross-position attention module to achieve a better segmentation effect. Unlike the previous work, we extend nonlocal operations to the retinal fundus vessel segmentation task. We obtain global semantic information descriptions by establishing connections between long-range features of fundus vessels pixels. The advantage of using the attention module to model long-range dependencies leads to improved feature representation for retinal fundus vessel segmentation.
We take the output feature map F R H × W × C of the backbone network as the input of the CPA module. Where, H, W are the height and width of the feature map and C represents the number of channels. First, for a given feature map F, it passes through a 1 × 1 convolutional layer to obtain feature maps M, N, V, respectively, M , N , V R C × W × H .
For the obtained feature maps M, N, there is a vector Q x for any pixel position x in M. To calculate the correlation between pixels in the full image and position x, for simplicity, we first find the feature vectors in the feature map N that are in the same row and column as position x, and save them in the set D x R ( H + W 1 ) × C . The feature vector Q x of the pixel position x and the transpose of the vector in the obtained set D x are subjected to a dot multiplication operation, that is, the correlation between the features is obtained. A softmax layer is further applied on the multiplied result to generate an attention map S z R ( H + W 1 ) × ( W × H ) . The calculation process is shown in Equation (1).
S z = s o f t max Q x D i , x T
The attention map S z is then multiplied with the set Ψ x R ( H + W 1 ) × C of feature vectors in the feature map V obtained at the beginning which are also in the same row as position x to obtain the new feature map. The resulting feature map is then added to the input original feature map F to generate the final output feature map Y. See Equation (2). A more intuitive representation is available in Figure 3.
Y = i = 0 H + W 1 S z · Ψ i . x + F
By using this feature correlation calculation twice, we can obtain global contextual information about each pixel location. Finally, the final retinal fundus vessel segmentation results are obtained by passing through the segmentation layer.

2.4. Loss Function

Although the segmentation results of retinal vessels are generated after MCPANet, there are still some regions of segmentation inaccuracy and segmentation errors between the segmented retinal vessels and the given groundtruth. Therefore, we use a loss function to enhance the results before outputting the segmentation results. Although many papers have used the classical binary cross-entropy loss function in the choice of the loss function, the Dice loss [19] function is more applicable here for the retinal vessel segmentation task in this paper. The Dice Coefficient is an ensemble similarity measure function taking values in the range [0, 1], which we use to calculate the difference between the predicted retinal vessel segmentation results (denoted as P) and the groundtruth (denoted as G). DiceCoefficient formula is defined in Equation (3).
D i c e C o e f f i c i e n t = 2 × P G P + G
where P G denotes the intersection of the predicted retinal vessel segmentation result and the groundtruth, and P and G denote their pixel counts, respectively. In addition, the Dice loss function is denoted as D i c e = 1 D i c e C o e f f i c i e n t , defined as in Equation (4). In the specific implementation, we introduce a constant w to prevent the denominator from being zero.
D i c e L o s s = 1 2 × P G + w P + G + w

3. Dataset and Evaluation Metrics

3.1. Experimental Environment and Parameters
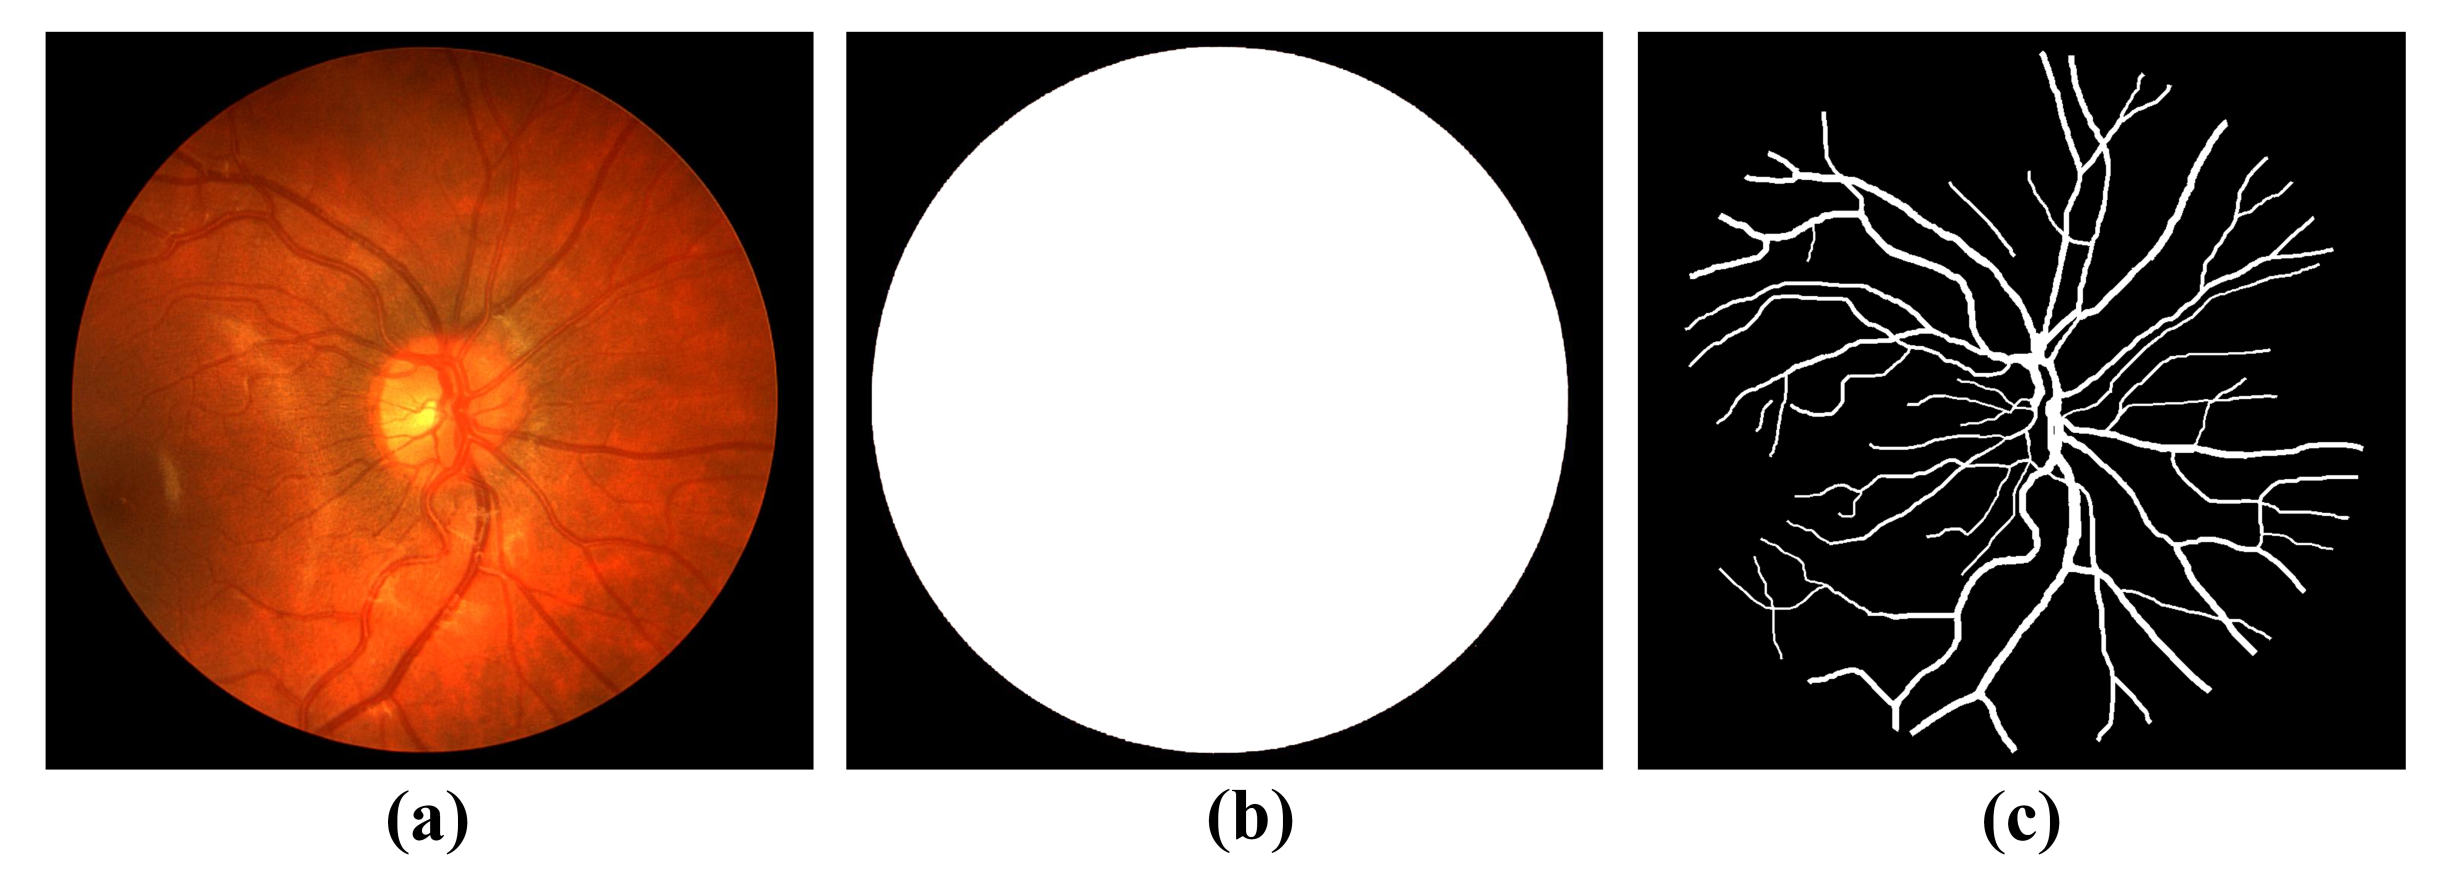
We use the Pytorch framework for deep learning to implement the methods in this paper. The training is implemented on a QuadroRTX 6000 server with a GPU memory size of 24 G and Ubuntu64 operating system. An initial learning rate of 0.001 is used for the training. The Adam optimizer is used for training with the following parameters: exponential decay rate β 1 is set to 0.9, β 2 is set to 0.999, and epsilon = 1 × 10⁻⁸. We used the model with the best validation performance in our tests, and the Dice loss function was used for the loss function. For the DRIVE and CHASE datasets, we set the number of iterations of the model to 100, the training batch size to 128, and the threshold to 0.47. Since there are only 20 images in the STARE dataset, we used the leave-one-out method for training to make the training effect as good as possible. The training batch size is set to 512, the number of iterations of the model to 100, and the threshold value is set to 0.50.

3.2. Datasets

We validate our method on three publicly available datasets (DRIVE, CHASE, and STARE) used to segment retinal vessels.
The DRIVE dataset [20] consists of 40 color images of retinal fundus vessels, the corresponding groundtruth images, and the corresponding mask images. The size of each image is 565 × 584, and the first twenty fundus images are set as the test set. The last twenty images are set as the training set.
STARE dataset [21] consists of 20 color images of retinal fundus vessels, the corresponding groundtruth images, and the corresponding mask images. The size of each image was 700 × 605 pixels. Testing was performed using the leave-one-out method, where one image at a time was used for testing, and the remaining 19 samples were used for training.
CHASE dataset [22] consists of 28 retinal fundus vessel color images, the corresponding groundtruth images, and the corresponding mask images. The image size was 999 × 960. Image sources were collected from the left and right eye datasets of 14 students. Twenty images were used as the training set and the remaining eight images were used as the test set. Figure 4 Sample images are shown in the CHASE dataset. From left to right are the original retinal fundus vessel medical images, the masked images, and the groundtruth, which is manually segmented by experts.
Due to the characteristics of the retinal fundus vessel images and their acquisition, direct segmentation using the original image leads to poor results and unclear vessel contours. Therefore, it is necessary to perform pre-processing to enhance the vessel information before segmentation. In this paper, the pre-processing method proposed by Jiang et al. [23], data normalization, adaptive histogram equalization (CLAHE) processing, and gamma correction method were used. Due to the higher vessel clarity of the isolated G-channel, it is experimentally verified that the RGB three channels are fused at 29.9%, 58.7%, and 11.4%, respectively, and then with grayscale processing to obtain images with more distinct blood vessels.
Normalization was used to improve the convergence speed of the model, and then CLAHE processing was used to enhance the vessel-background contrast of the dataset. Finally, gamma correction was used to improve the quality of retinal fundus vessel images. The four image processing strategies are shown in Figure 5a–e.

3.3. Experimental Evaluation Metrics

To quantitatively evaluate the accuracy of retinal vessel segmentation by the method in this paper, we use a confusion matrix to analyze the performance of the evaluation metrics such as Dice, Accuracy, Sensitivity, and Specificity. Dice indicates the proportional relationship between Sensitivity and Accuracy. Accuracy indicates the ratio of the sum of correctly segmented vessel pixels and background pixels to the total pixels of the whole image. The sensitivity indicates the ratio of correctly segmented vascular pixels to the total number of real vessel pixels. Specificity indicates the ratio of correctly segmented background pixels to the total number of real background pixels. Precision indicates the ratio of correctly segmented vessel pixels to the sum of all segmented vessel pixels. The corresponding equations for each evaluation metric are expressed in Equations (5)–(9). Where true positive ( T P ) is the number of correctly segmented vessel pixels, true negative ( T N ) is the number of correctly segmented background pixels, false positive ( F P ) is the number of background pixels incorrectly segmented as vessel pixels, and false negative ( F N ) is the number of vessel pixels incorrectly segmented as background pixels.
D i c e = 2 × T P 2 × T P + F N + F P
A c c u r a c y = T P + T N T P + F N + F P + T N
S e n s i t i v i t y = T P T P + F N
S p e c i f i c i t y = T N T N + F P
P r e c i s i o n = T P T P + F P

4. Experimental Results and Analysis

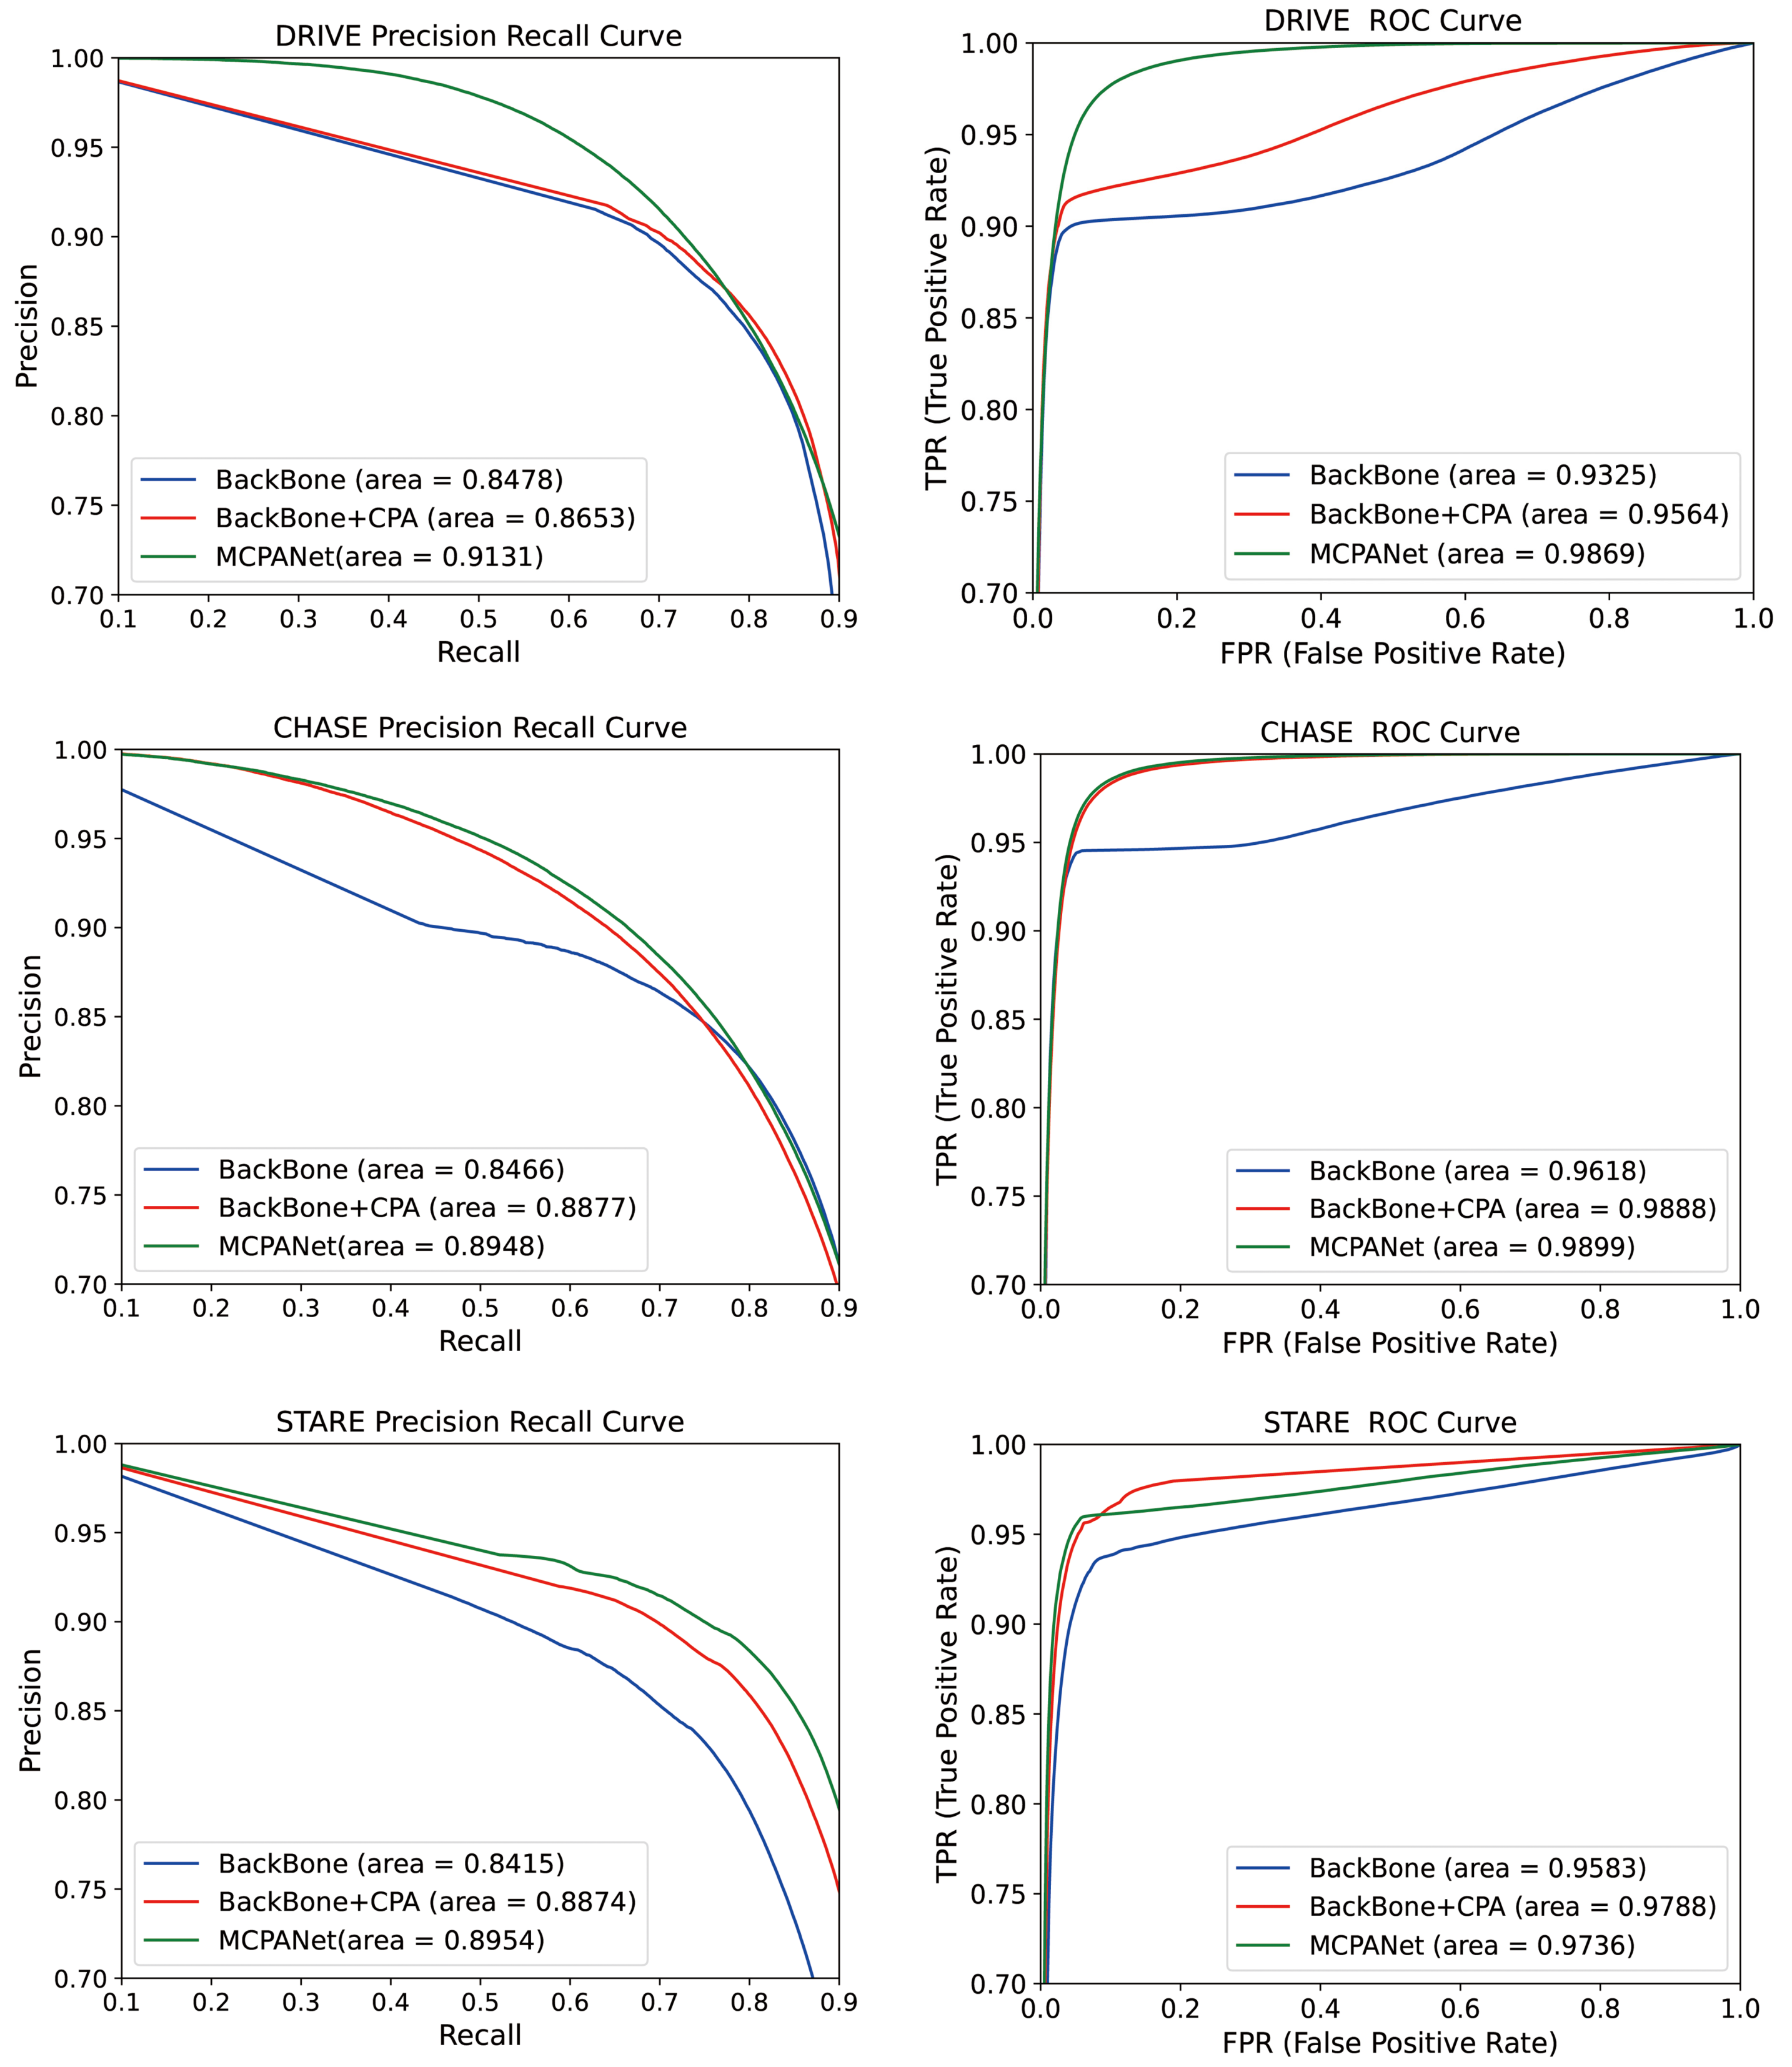
4.1. Comparison of the Results before and after Model Improvement

To verify the effectiveness of each module of the proposed model, in this section, we will perform module-by-module validation on DRIVE, CHASE, and STARE datasets in the form of ablation experiments. First, the baseline network is based on a modification of U-Net by adding residual connectivity and multi-scale pooling modules, denoted as the BackBone. On this foundation, we add the CPA module, denoted as BackBone + CPA, and finally, we replace the single input of the image with the multiscale input, which is the model MCPANet in this paper. Table 1 and Table 2 show the experimental results of the three models on the DRIVE and CHASE datasets. To make the highest value of each metric more eye-catching, we bolded it. In terms of BackBone’s performance, Dice and Sensitivity reached 0.8130 and 0.8281, 0.8122 and 0.8155 on the DRIVE and CHASE datasets, respectively. The addition of the cross-position attention module helps to obtain contextual information, which makes the sensitivity slightly lower on the DRIVE dataset, but the more important indicator Dice is improved by 1.5%. On the CHASE dataset, the Dice and Sensitivity reached 0.8123 and 0.8328, respectively, with essentially the same Dice but a 1.73% increase in Sensitivity. This proves that the CPA module is effective for more accurate segmentation of vascular pixels. Finally, after adding multi-scale input to the model, the Dice and Sensitivity of MCPANet on the DRIVE dataset reach 0.8315 and 0.8356, respectively, with a further increase of 0.35% in Dice and 1.9% in Sensitivity. The Dice and Sensitivity on the CHASE dataset reached 0.8148 and 0.8416, respectively, with a further increase in Sensitivity based on the increase in Dice. This suggests that multiple images of vessel sections at different scales enable the model to learn different characteristics as well as fine vessel features.
To verify the effect of the choice of loss function on whether the model can achieve adequate segmentation, we did a set of ablation experiments, using the cross-entropy loss function and the Dice loss function in the MCPANet model, respectively. The results we obtained on the DRIVE and CHASE datasets are shown in Table 3 and Table 4. It can be observed that on the DRIVE dataset, the Dice and Sensitivity obtained using the Dice loss function with essentially the same accuracy is improved over that using the cross-entropy loss function. On the CHASE dataset, the Dice and Sensitivity obtained using the Dice loss function are 0.8148 and 0.8416, respectively, with an increase in Dice and 1.2% in Sensitivity compared to the cross-entropy loss function. It is confirmed that suitable loss functions are needed for different segmentation tasks to further improve the accuracy of the model.
For the STARE dataset, we used the leave-one-out method in both training and testing. Table 5 shows the test results of MCPANet on 20 images, and we average the results of 20 folds on five metrics as the test results of MCPANet on the STARE dataset.
We trained and validated the models: BackBone and BackBone + CPA on the STARE dataset using the leave-one-out method. The experimental results are shown in Table 6, with the highest values of each metric in bold. Comparing the performance of BackBone, the Dice and Accuracy improve by 1.15% and 0.67%, respectively, after adding the CPA module. MCPANet improves the Dice and Accuracy rate by 1.34% and 1.38%, respectively, on this basis. The combined performance shows that the method in this paper can improve in all indexes and is very effective for more accurate segmentation of vessel pixels.
Next, more intuitive visualization of the effectiveness of our modules is presented, from which the segmentation effect of the retinal fundus vessel details can be observed. Figure 6 shows the segmentation results on the three datasets. It can be observed that for different models and different datasets, it is easier to segment the thicker veins in the center of the retina or the slightly thinner arteries, because these vessels are more clearly visible on the whole fundus image. The accurate segmentation of the surrounding fine vessels is a more important evaluation point to determine the effectiveness of a model segmentation. Therefore, we focused on the segmentation of capillaries in the visualization comparison. Columns (a)–(e) in the figure show the original retinal vessel images, which are the groundtruth of manual segmentation by professionals, the segmentation results of BackBone, and the segmentation results of BackBone + CPA, and the segmentation results of MCPANet, respectively. From top to bottom, the medical image segmentation results on CHASE, STARE, and DRIVE datasets are shown in order. To highlight the segmentation effect, we have enlarged some regions in the retinal image, the groundtruth image, and the segmentation result map of each model, and marked the focused observation regions with green boxes.
As can be observed in Figure 6, the BackBone network can segment the backbone of the blood vessels, but the segmentation results are bad for the detailed parts. There is a lot of noise, and the pixels that do not belong to the blood vessels are also labeled as blood vessel pixels. After adding the CPA module to the network, this phenomenon is greatly improved. On the CHASE dataset, we can see that the noise is greatly reduced and the boundaries of the segmented vessel pixels are clearer in the part marked by red boxes. Because the CPA acquires the global information and takes into account the connection between the pixel relationships, the number of misclassified pixels is reduced and the information of vessel pixels is learned better. Compared with the results of MCPANet segmentation, the noise is further reduced in all three datasets. The finer capillaries can be segmented, and the extraction of edge vessel pixels can be deepened. This effect can be observed by the marked area in Figure 6. This shows that our method is effective for the segmentation task of retinal fundus vessel medical images, and a good segmentation result can be achieved by improving it.

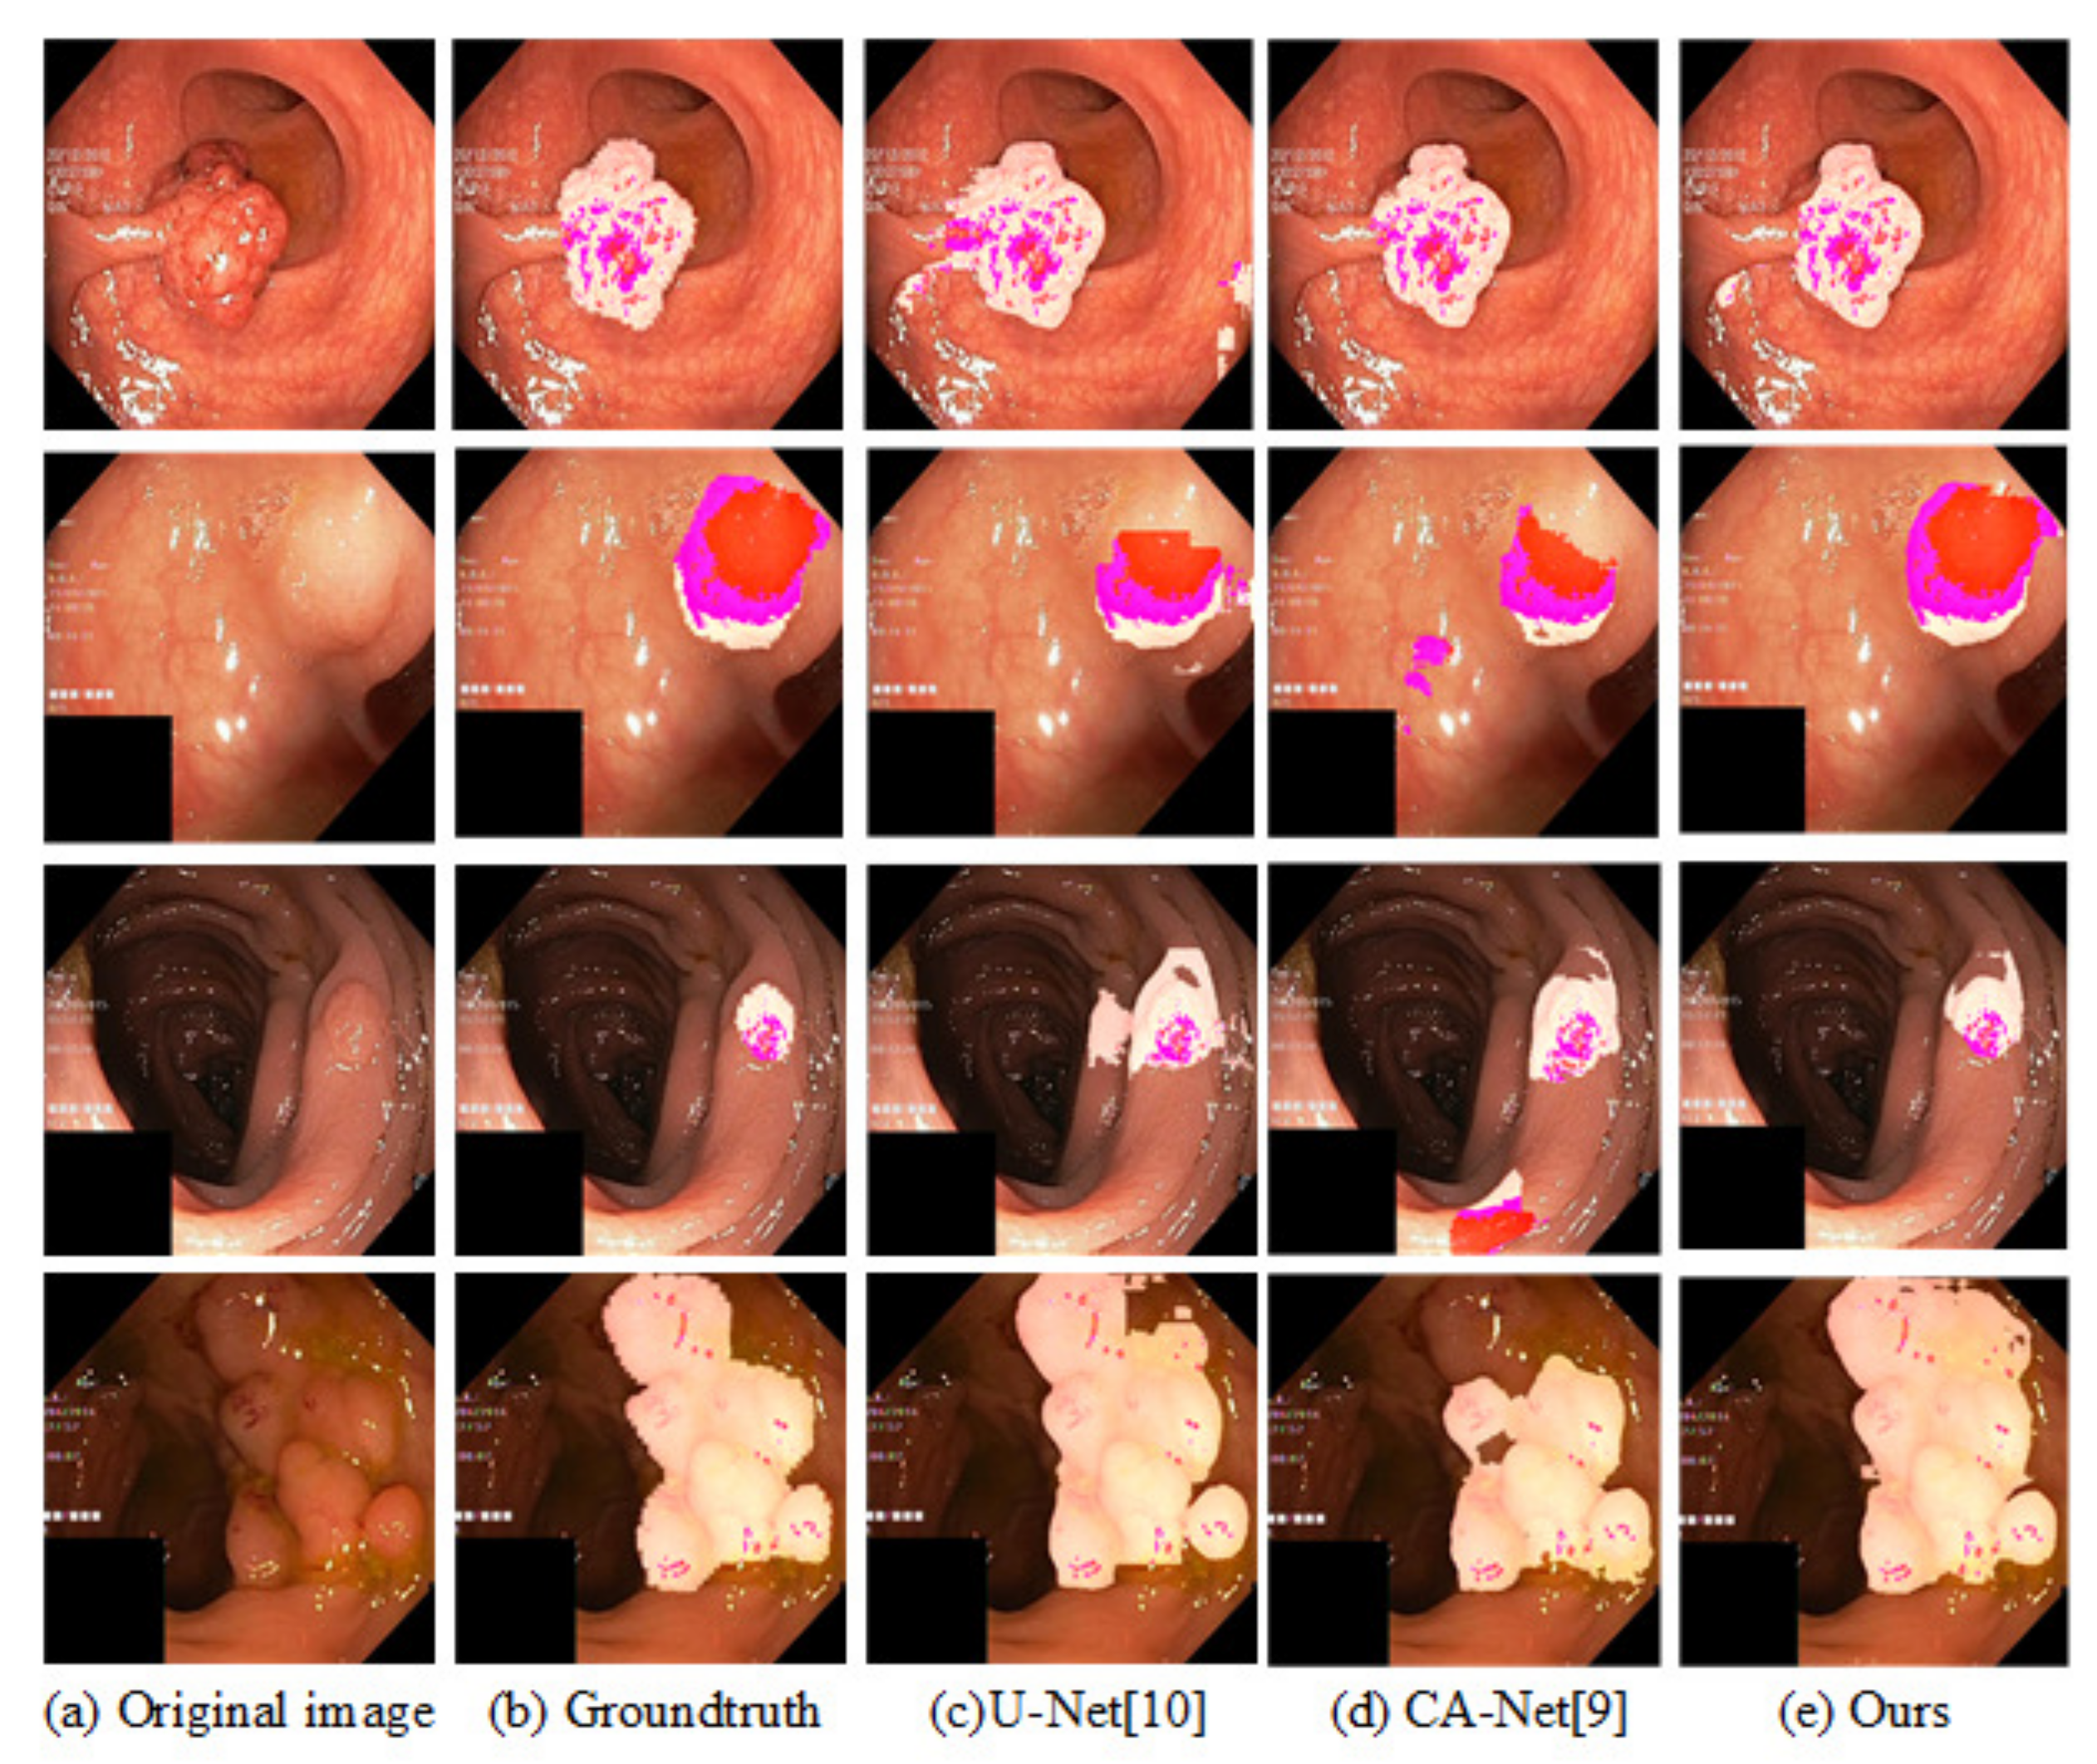
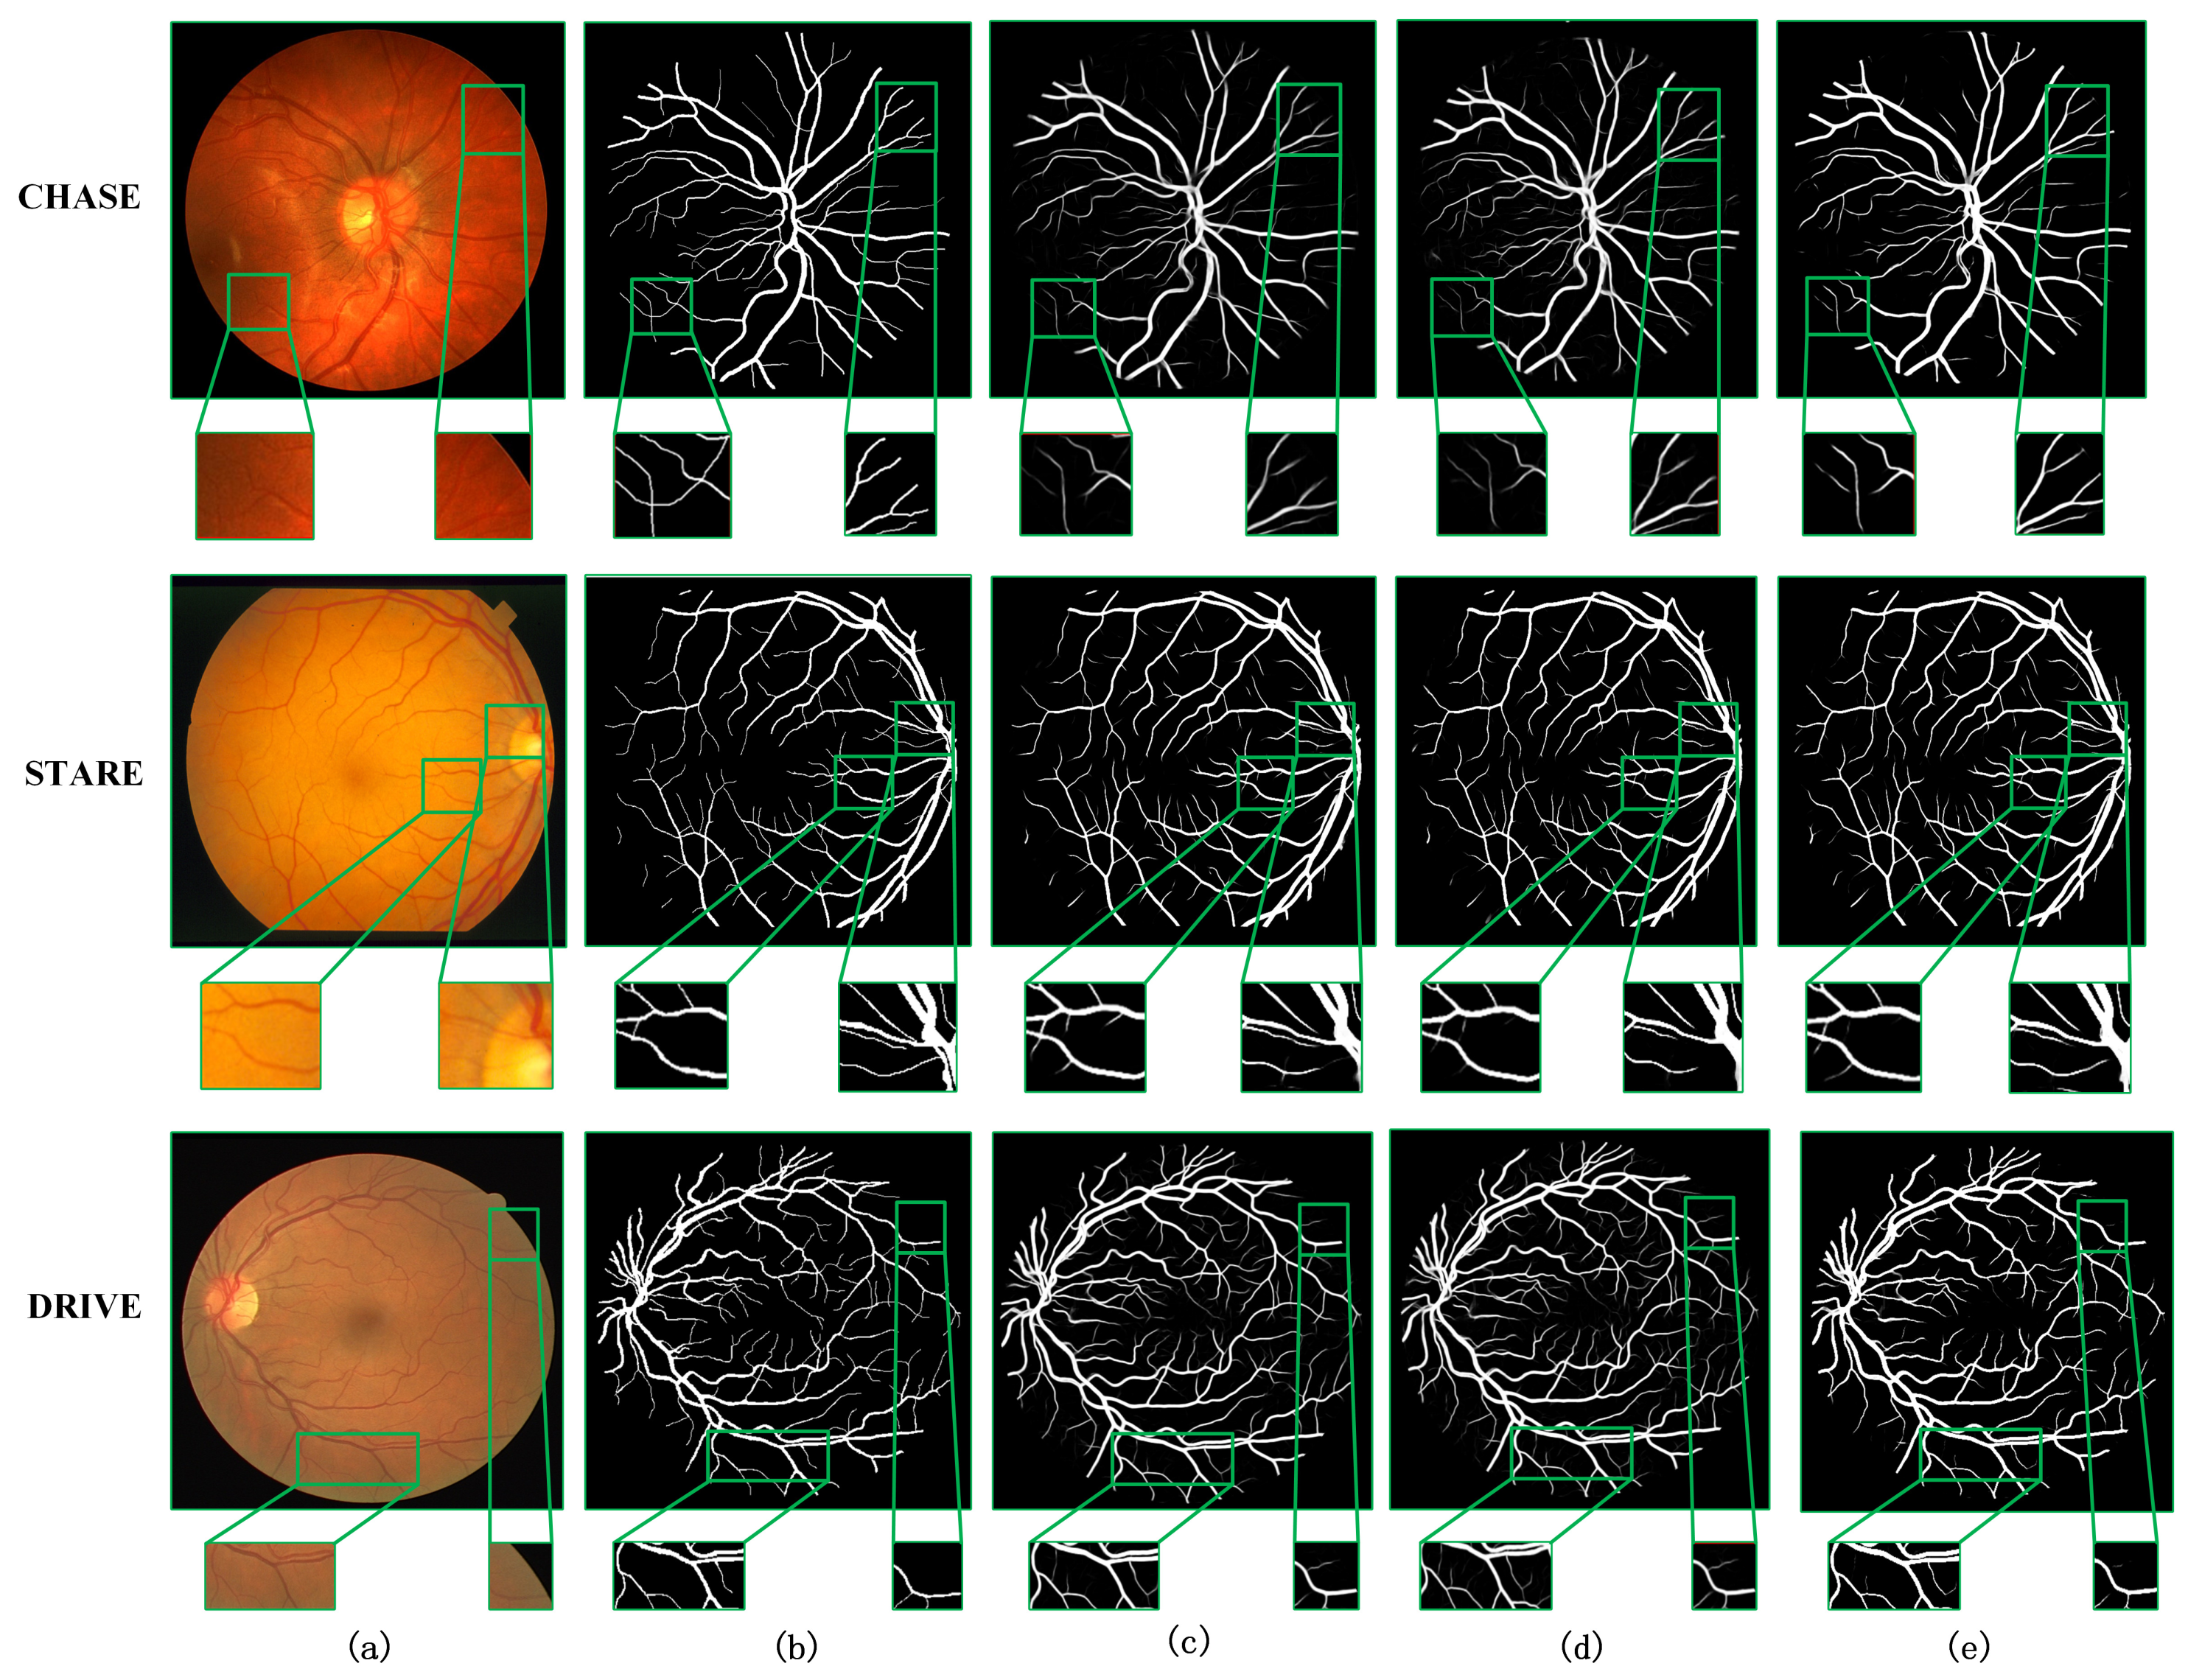
4.2. Comparison with Other Methods

Further, to validate the effectiveness of our model, it was compared with current models, which perform better on the retinal fundus vessel segmentation task on three datasets. To make the experiments more convincing, we chose the unsupervised methods of Azzopardi et al. [24] and Chen et al. [25], as well as the classical U-Net [10], R2U-Net [26], and the supervised methods of Tong et al. [27], which contain methods ranging from 2018–2021. We evaluated them according to four evaluation metrics: Dice, Accuracy, Sensitivity, and Specificity. Table 7, Table 8 and Table 9 show the comparison of the segmentation results on the DRIVE, CHASE, and STARE datasets. From Table 7, it can be observed that on the DRIVE dataset, MCPANet performs the best in terms of Accuracy and Specificity compared with the unsupervised method, and the best in terms of the three metrics of Accuracy, Sensitivity, and Dice compared to the supervised method, with an improvement of 0.14%, 0.67%, and 1.26%, respectively. As can be observed in Table 8, on the CHASE dataset, MCPANet performs best on the three metrics of Accuracy, Specificity and Dice compared to the unsupervised method, and better on Accuracy and Dice compared to the supervised method. There was an improvement of 0.06% in Accuracy and 0.32% in Dice. As can be observed in Table 9, on the STARE dataset, MCPANet performs best on all four metrics compared to the unsupervised method, with a 5.01% improvement in Sensitivity and a 0.30% improvement in Dice compared to the supervised method. The improvement of these results verifies the effectiveness of MCPANet in this paper.
We visualize our method in comparison with the current better performing CA-Net [9] and AG-UNet [30] network models for the segmentation task of retinal fundus vessels. Figure 7 and Figure 8 show the visualization results on the DRIVE and CHASE datasets, respectively. Columns (a)–(e) show the original retinal vessel images, the groundtruth manually segmented by a professional, and the segmentation results of CA-Net, AG-UNet, and MCPANet, respectively. On the DRIVE dataset, we can see that CA-Net and AG-UNet can segment all arteries and veins, but there are still some blood vessels that are not segmented. In addition, wrongly segmenting background pixels as blood vessel pixels and the noise is more obvious in the results of CA-Net segmentation. Compared with the CA-Net, MCPANet can reduce the misclassification of pixels and perform better in the segmentation of small vessels because it fully utilizes the inter-pixel position relationship and multiple scale feature maps. Since MCPANet takes into account the information of deep and shallow layers, the noise effect is reduced in the segmentation results. On the CHASE dataset, MCPANet can obtain clearer vessel segmentation results compared with CA-Net and AG-UNet. This is because the MCPANet focuses more on the long-range relationship between pixels and the relationship with the surrounding pixels when acquiring the vessel pixel information. The comparative analysis shows that MCPANet has better performance and advantages for the retinal vessel segmentation task. This conclusion can be derived from Figure 7 and Figure 8.
For retinal fundus datasets, it usually includes a certain number of diseased retinal fundus images. Therefore, from the image, we can not only see the blood vessel information, but also the lesion information of the patient in different degrees in the fundus. On the STARE dataset, we show visually that our method can also be adapted to the segmentation of lesion regions. As can be seen in Figure 9, since the grand truth corresponds only to the retinal blood vessels marked by the doctor, it does not involve the segmentation standard of the lesion area, and our model can also segment the lesion area well.

4.3. Generalization Verification of the Model

To verify the generalization of our model, in this subsection, our model is evaluated using the KvasirSEG gastrointestinal polyp image segmentation dataset. The KvasirSEG dataset consists of 1000 images. Since the dataset has no given division criteria, we randomly shuffle it, taking 500 images as the training set, 100 as the validation set, and 400 as the test set. In order to unify the input of the network, images of different sizes are normalized to a size of 300 × 300. In addition, using the same data augmentation method as the paper [23], we compare the test results of our method on the four indicators with the existing models and list the results in Table 10. Similarly, the segmentation results for intestinal polyps are visualized in Figure 10. The results show that our method not only performs well on retinal vessel segmentation tasks, but also on other medical image tasks.

4.4. Number of Model Parameters and ROC Curve Evaluation

We evaluate the spatial and time spending of the network model in terms of model parameters and single image segmentation time. The experiments are conducted in the same experimental environment. The evaluation results are detailed in Table 11, which shows that although MCPANet adds CPA module and multi-scale input based on BackBone, it does not introduce too many parameters, which makes our model not only obtain better segmentation performance but also have the advantage of a small number of parameters. For AG-UNet, the number of parameters in this method is even smaller. It can also be observed from the segmentation time that the segmentation time of our method is the smallest on both DRIVE and STARE datasets. The time spent on the CHASE dataset is one 80th of AG-UNet. While comparing with CA-Net, we have more numbers of parameters but our segmentation time is still the smallest and better on DRIVE and STARE datasets. From the table, we can conclude that MCPANet has less numbers of parameters and training time with the best segmentation result performance, which further proves the superiority of our model.
We calculated Receiver Operating Characteristic (ROC) curves and Precision Recall (PR) curves for each network model of the ablation structure, which are displayed in visualizations in Figure 11. The ROC curves express the information between the incorrect segmentation of background pixels into vessel pixels and the correct segmentation of vessel pixels. When the proportion of these two is larger, the PR curve can better reflect the pixel classification. In terms of experimental results, the ROC and PR curves of MCPANet occupy the largest area in all three datasets. This indicates that MCPANet achieves the best results in the retinal vessel segmentation task, exploiting the positional relationship between pixels and taking into account the deep and shallow feature information to obtain the best performance.

5. Discussion

This paper proposes a novel retinal vessel segmentation framework with a multi-scale cross-position attention mechanism. Compared with previous methods, we obtain better accuracy and better segmentation results. However, there are currently two issues to consider. First, the contribution of our paper is to use existing datasets and combine the current popular convolutional neural network technology to achieve a higher-precision segmentation of retinal vessels. However, changes in the diameter and thickness of blood vessels often indicate the occurrence of diseases to a certain extent, although we currently do not have a larger dataset to achieve high-precision caliber measurement. However, exploring the relationship between vascular caliber and cardiovascular disease (CVD) and systemic inflammation can be the focus of our next work, because there is still a lot of room for high-precision segmentation and measurement of a vascular caliber. Secondly, as far as the retinal fundus dataset is concerned, in the image we can not only see the blood vessel information, but also the different degrees of lesions in the fundus of the patient. Although our method can make a certain contribution in lesion segmentation, there is still some room for achieving more accuracy and meeting the clinical standards of doctors. Therefore, this is also the direction of the work that we should do in the future.

6. Conclusions

We propose the MCPANet network model to handle the retinal fundus vessel segmentation task. The model can quickly and automatically segment the blood vessels in fundus images under the premise of ensuring accuracy, and has the advantage of a small amount of parameters. MCPANet captures long-distance dependencies by linking the positional relationship between pixels to obtain contextual information more fully and improve the accuracy of segmentation. Using different scales of feature input enables the model to enhance the feature extraction ability, which is extremely important for the segmentation of capillaries. The skip connection design makes the information transfer between layers more fluent. Pooling operations at different scales further expand the receptive field and help extract global information. We validate the MCPANet model on three well-established datasets, DRIVE, CHASE, and STARE. The results show that compared with existing R2U-Net, AG-UNet and SCS-Net methods. Our method has better performance and fewer parameters, and the segmentation of retinal small blood vessels is more accurate. In addition, the impressive performance of MCPANet on KvasirSEG dataset also confirms the generalization ability of the model.

Author Contributions

Data curation, T.C., X.L., Y.Z., and J.D.; Writing—original draft, J.L.; Writing—review and editing, Y.J. All authors have read and agreed to the published version of the manuscript.

Funding

This work was supported in part by the National Natural Science Foundation of China (61962054), in part by the National Natural Science Foundation of China (61163036), in part by the 2016 Gansu Provincial Science and Technology Plan Funded by the Natural Science Foundation of China (1606RJZA047), in part by the Northwest Normal University’s Third Phase of Knowledge and Innovation Engineering Research Backbone Project (nwnu-kjcxgc-03-67), and in part by the Cultivation plan of major Scientific Research Projects of Northwest Normal University (NWNU-LKZD2021-06).

Institutional Review Board Statement

Not applicable.

Informed Consent Statement

Not applicable.

Data Availability Statement

Data availability statement. We use three publicly available retinal image datasets to evaluate the segmentation network proposed in this paper, namely, the DRIVE dataset, the CHASE DB1 dataset, and the STARE dataset. They can be downloaded from the URL: http://www.isi.uu.nl/Research/Databases/DRIVE/ (accessed on 12 December 2021), https://blogs.kingston.ac.uk/retinal/chasedb1/ (accessed on 24 December 2021) and https://cecas.clemson.edu/ahoover/stare/ (accessed on 1 January 2022).

Conflicts of Interest

The authors declare no conflict of interest.

References

  1. Oshitari, T. Diabetic retinopathy: Neurovascular disease requiring neuroprotective and regenerative therapies. Neural Regen. Res. 2022, 17, 795. [Google Scholar] [CrossRef] [PubMed]
  2. Mookiah, M.R.; Hogg, S.; MacGillivray, T.J.; Prathiba, V.; Pradeepa, R.; Mohan, V.; Anjana, R.M.; Doney, A.S.; Palmer, C.N.; Trucco, E. A review of machine learning methods for retinal blood vessel segmentation and artery/vein classification. Med. Image Anal. 2020, 68, 101905. [Google Scholar] [CrossRef] [PubMed]
  3. Roychowdhury, S.; Koozekanani, D.D.; Parhi, K.K. Blood vessel segmentation of fundus images by major vessel extraction and subimage classification. IEEE J. Biomed. Health Inform. 2014, 19, 1118–1128. [Google Scholar]
  4. Oliveira, A.; Pereira, S.; Silva, C.A. Retinal vessel segmentation based on fully convolutional neural networks. Expert Syst. Appl. 2018, 112, 229–242. [Google Scholar] [CrossRef] [Green Version]
  5. Emary, E.; Zawbaa, H.M.; Hassanien, A.E.; Parv, B. Multi-Objective retinal vessel localization using flower pollination search algorithm with pattern search. Adv. Data Anal. Classif. 2017, 11, 611–627. [Google Scholar] [CrossRef]
  6. Neto, L.C.; Ramalho, G.L.; Neto, J.F.; Veras, R.M.; Medeiros, F.N. An unsupervised coarse-to-fine algorithm for blood vessel segmentation in fundus images. Expert Syst. Appl. 2017, 78, 182–192. [Google Scholar] [CrossRef]
  7. Jainish, G.R.; Jiji, G.W.; Infant, P.A. A novel automatic retinal vessel extraction using maximum entropy based EM algorithm. Multimed. Tools Appl. 2020, 79, 22337–22353. [Google Scholar] [CrossRef]
  8. LeCun, Y.; Bottou, L.; Bengio, Y.; Haffner, P. Gradient-Based learning applied to document recognition. Proc. IEEE 1998, 86, 2278–2324. [Google Scholar] [CrossRef] [Green Version]
  9. Gu, R.; Wang, G.; Song, T.; Huang, R.; Aertsen, M.; Deprest, J.; Ourselin, S.; Vercauteren, T.; Zhang, S. CA-Net: Comprehensive attention convolutional neural networks for explainable medical image segmentation. IEEE Trans. Med. Imaging 2020, 40, 699–711. [Google Scholar] [CrossRef]
  10. Ronneberger, O.; Fischer, P.; Brox, T. U-net: Convolutional networks for biomedical image segmentation. In Proceedings of the International Conference on Medical Image Computing and Computer-Assisted Intervention, Munich, Germany, 5–9 October 2015; Springer: Cham, Switzerland, 2015; pp. 234–241. [Google Scholar]
  11. Li, X.; Chen, H.; Qi, X.; Dou, Q.; Fu, C.W.; Heng, P.A. H-DenseUNet: Hybrid densely connected UNet for liver and tumor segmentation from CT volumes. IEEE Trans. Med. Imaging 2018, 37, 2663–2674. [Google Scholar] [CrossRef] [Green Version]
  12. Zhou, Z.; Rahman Siddiquee, M.M.; Tajbakhsh, N.; Liang, J. Unet++: A nested u-net architecture for medical image segmentation. In Deep Learning in Medical Image Analysis and Multimodal Learning for Clinical Decision Support; Springer: Cham, Switzerland, 2018; pp. 3–11. [Google Scholar]
  13. Mo, J.; Zhang, L. Multi-Level deep supervised networks for retinal vessel segmentation. Int. J. Comput. Assist. Radiol. Surg. 2017, 12, 2181–2193. [Google Scholar] [CrossRef]
  14. Zhao, H.; Shi, J.; Qi, X.; Wang, X.; Jia, J. Pyramid scene parsing network. In Proceedings of the IEEE Conference on Computer Vision and Pattern Recognition, Honolulu, HI, USA, 21–26 July 2017; pp. 2881–2890. [Google Scholar]
  15. Chen, L.C.; Papandreou, G.; Schroff, F.; Adam, H. Rethinking atrous convolution for semantic image segmentation. arXiv 2017, arXiv:1706.05587. [Google Scholar]
  16. Xiao, X.; Lian, S.; Luo, Z.; Li, S. Weighted res-unet for high-quality retina vessel segmentation. In Proceedings of the 2018 9th International Conference on Information Technology in Medicine and Education (ITME), Hangzhou, China, 9–21 October 2018; pp. 327–331. [Google Scholar]
  17. Wang, X.; Girshick, R.; Gupta, A.; He, K. Non-Local neural networks. In Proceedings of the IEEE Conference on Computer Vision and Pattern Recognition, Salt Lake City, UT, USA, 18–23 June 2018; pp. 7794–7803. [Google Scholar]
  18. Long, J.; Shelhamer, E.; Darrell, T. Fully convolutional networks for semantic segmentation. In Proceedings of the IEEE Conference on Computer Vision and Pattern Recognition, Boston, MA, USA, 7–12 June 2015; pp. 3431–3440. [Google Scholar]
  19. Milletari, F.; Navab, N.; Ahmadi, S.A. V-Net: Fully convolutional neural networks for volumetric medical image segmentation. In Proceedings of the 2016 Fourth International Conference on 3D Vision (3DV), Stanford, CA, USA, 25–28 October 2016; pp. 565–571. [Google Scholar]
  20. Staal, J.; Abràmoff, M.D.; Niemeijer, M.; Viergever, M.A.; Van Ginneken, B. Ridge-Based vessel segmentation in color images of the retina. IEEE Trans. Med. Imaging 2004, 23, 501–509. [Google Scholar] [CrossRef]
  21. Owen, C.G.; Rudnicka, A.R.; Mullen, R.; Barman, S.A.; Monekosso, D.; Whincup, P.H.; Ng, J.; Paterson, C. Measuring retinal vessel tortuosity in 10-year-old children: Validation of the computer-assisted image analysis of the retina(CAIAR) program. Investig. Ophthalmol. Vis. Sci. 2009, 50, 2004–2010. [Google Scholar] [CrossRef] [Green Version]
  22. Hoover, A.D.; Kouznetsova, V.; Goldbaum, M. Locating blood vessels in retinal images by piecewise threshold probing of a matched 691filter response. IEEE Trans. Med. Imaging 2000, 19, 203–210. [Google Scholar] [CrossRef] [Green Version]
  23. Jiang, Y.; Zhang, H.; Tan, N.; Chen, L. Automatic retinal blood vessel segmentation based on fully convolutional neural networks. Symmetry 2019, 11, 1112. [Google Scholar] [CrossRef] [Green Version]
  24. Azzopardi, G.; Strisciuglio, N.; Vento, M.; Petkov, N. Trainable COSFIRE filters for vessel delineation with application to retinal images. Med. Image Anal. 2015, 19, 46–57. [Google Scholar] [CrossRef] [Green Version]
  25. Chen, G.; Chen, M.; Li, J.; Zhang, E. Retina image vessel segmentation using a hybrid CGLI level set method. Biomed. Res. Int. 2017, 2017, 1263056. [Google Scholar] [CrossRef]
  26. Alom, M.Z.; Hasan, M.; Yakopcic, C.; Taha, T.M.; Asari, V.K. Recurrent Residual Convolutional Neural Network based on U-Net (R2U-Net) for Medical Image Segmentation. arXiv 2018, arXiv:1802.06955. [Google Scholar]
  27. Tong, H.; Fang, Z.; Wei, Z.; Cai, Q.; Gao, Y. SAT-Net: A side attention network for retinal image segmentation. Appl. Intell. 2021, 51, 5146–5156. [Google Scholar] [CrossRef]
  28. Tian, C.; Fang, T.; Fan, Y.; Wu, W. Multi-Path convolutional neural network in fundus segmentation of blood vessels. Biocybern. Biomed. Eng. 2020, 40, 583–595. [Google Scholar] [CrossRef]
  29. Jin, Q.; Meng, Z.; Pham, T.D.; Chen, Q.; Wei, L.; Su, R. DUNet: A deformable network for retinal vessel segmentation. Knowl.-Based Syst. 2019, 178, 149–162. [Google Scholar] [CrossRef] [Green Version]
  30. Lv, Y.; Ma, H.; Li, J.; Liu, S. Attention guided u-net with atrous convolution for accurate retinal vessels segmentation. IEEE Access 2020, 8, 32826–32839. [Google Scholar] [CrossRef]
  31. Wang, W.; Zhong, J.; Wu, H.; Wen, Z.; Qin, J. Rvseg-Net: An efficient feature pyramid cascade network for retinal vessel segmentation. In Proceedings of the International Conference on Medical Image Computing and Computer-Assisted Intervention, Lima, Peru, 4–8 October 2020; Springer: Cham, Switzerland, 2020; pp. 796–805. [Google Scholar]
  32. Guo, C.; Szemenyei, M.; Yi, Y.; Zhou, W.; Bian, H. Residual Spatial Attention Network for Retinal Vessel Segmentation. In Proceedings of the International Conference on Neural Information Processing, Bangkok, Thailand, 18–22 November 2020; Springer: Cham, Switzerland, 2020; pp. 509–519. [Google Scholar]
  33. Yang, J.; Dong, X.; Hu, Y.; Peng, Q.; Tao, G.; Ou, Y.; Cai, H.; Yang, X. Fully automatic arteriovenous segmentation in retinal images via topology-aware generative adversarial networks. Interdiscip. Sci. Comput. Life Sci. 2020, 12, 323–334. [Google Scholar] [CrossRef]
  34. Park, K.B.; Choi, S.H.; Lee, J.Y. M-Gan: Retinal blood vessel segmentation by balancing losses through stacked deep fully convolutional networks. IEEE Access 2020, 8, 146308–146322. [Google Scholar] [CrossRef]
  35. Wu, H.; Wang, W.; Zhong, J.; Lei, B.; Wen, Z.; Qin, J. SCS-Net: A Scale and Context Sensitive Network for Retinal Vessel Segmentation. Med. Image Anal. 2021, 70, 102025. [Google Scholar] [CrossRef]
  36. Guo, C.; Szemenyei, M.; Yi, Y.; Wang, W.; Chen, B.; Fan, C. Sa-Unet: Spatial attention u-net for retinal vessel segmentation. In Proceedings of the 2020 25th International Conference on Pattern Recognition (ICPR), Milan, Italy, 10–15 January 2021; pp. 1236–1242. [Google Scholar]
  37. Arsalan, M.; Haider, A.; Lee, Y.W.; Park, K.R. Detecting retinal vasculature as a key biomarker for deep Learning-based intelligent screening and analysis of diabetic and hypertensive retinopathy. Expert Syst. Appl. 2022, 200, 117009. [Google Scholar] [CrossRef]
  38. Li, L.; Verma, M.; Nakashima, Y.; Nagahara, H.; Kawasaki, R. Iternet: Retinal image segmentation utilizing structural redundancy in vessel networks. In Proceedings of the IEEE/CVF Winter Conference on Applications of Computer Vision, Waikoloa, HI, USA, 1–5 March 2020; pp. 3656–3665. [Google Scholar]
  39. Oktay, O.; Schlemper, J.; Folgoc, L.L.; Lee, M.; Heinrich, M.; Misawa, K.; Mori, K.; McDonagh, S.; Hammerla, N.Y.; Kainz, B.; et al. Attention u-net: Learning where to look for the pancreas. arXiv 2018, arXiv:1804.03999. [Google Scholar]
  40. Gu, Z.; Cheng, J.; Fu, H.; Zhou, K.; Hao, H.; Zhao, Y.; Zhang, T.; Gao, S.; Liu, J. Ce-Net: Context encoder network for 2d medical image segmentation. IEEE Trans. Med. Imaging 2019, 38, 2281–2292. [Google Scholar] [CrossRef] [Green Version]
Figure 1. MCPANet network structure diagram.
Symmetry 14 01357 g001
Figure 2. Encoder block.
Symmetry 14 01357 g002
Figure 3. CPA module diagram.
Symmetry 14 01357 g003
Figure 4. Sample images of CHASE dataset: (a) Original retinal fundus vessel medical image; (b) Masked image; (c) Expert manual segmentation of the groundtruth.
Symmetry 14 01357 g004
Figure 5. Pre-processing results: (a) Original retinal fundus vascular medical image; (b) RGB three-channel scaled fusion image; (c) data-normalized image; (d) CLAHE processed image; and (e) Gamma corrected image.
Symmetry 14 01357 g005
Figure 6. Visualization of ablation experiments for three datasets: (a) Original image, (b) Groundtruth image, (c) BackBone, (d) BackBone + CPA, and (e) MCPANet.
Symmetry 14 01357 g006
Figure 7. Visualization results on DRIVE dataset compared with other methods. (a) Original image, (b) Groundtruth image, (c) CA-Net [9], (d) AG-UNet [30], (e) Ours.
Symmetry 14 01357 g007
Figure 8. Visualization results on CHASE dataset compared with other methods. (a) Original image, (b) groundtruth image, (c) CA-Net [9], (d) AG-UNet [30], and (e) ours.
Symmetry 14 01357 g008
Figure 9. Visualization results on STARE dataset compared with other methods. (a) Original image, (b) groundtruth image, (c) CA-Net [9], and (d) ours.
Symmetry 14 01357 g009
Figure 10. Visualization results of segmentation on KvasirSEG. The light pink part represents the segmentation result of the lesion area on the original image, and the darker pink part in the segmented lesion area represents the part with more obvious skin color in the original image.
Symmetry 14 01357 g010
Figure 11. PR and ROC curves for each ablation structure.
Symmetry 14 01357 g011
Table 1. Ablation experiments on the DRIVE dataset.
ModelSpecificitySensitivityAccuracyDiceAUC_ROC
BackBone0.98490.82810.97060.81300.9622
BackBone + CPA0.98540.81670.97040.82800.9747
MCPANet0.98360.83560.97050.83150.9871
The bold data in the table represent the maximum value achieved on each evaluation index.
Table 2. Ablation experiments on the CHASE dataset.
ModelSpecificitySensitivityAccuracyDiceAUC_ROC
BackBone0.98620.81550.97620.81220.9769
BackBone + CPA0.98550.83280.97570.81230.9896
MCPANet0.98490.84160.97580.81480.9898
The bold data in the table represent the maximum value achieved on each evaluation index.
Table 3. Comparison of different loss functions on the DRIVE dataset.
ModelSpecificitySensitivityAccuracyDice
MCPANet + Cross-entropy0.98360.83430.97030.8305
MCPANet + Dice0.98360.83560.97050.8315
The bold data in the table represent the maximum value achieved on each evaluation index.
Table 4. Comparison of different loss functions on the CHASE dataset.
ModelSpecificitySensitivityAccuracyDice
MCPANet + Cross-entropy0.98590.82970.97590.8131
MCPANet + Dice0.98490.84160.97580.8148
The bold data in the table represent the maximum value achieved on each evaluation index.
Table 5. Test results using the leave-one-out method on the STARE dataset.
ImageAccuracySpecificitySensitivityDiceAUC_ROC
00.97220.98330.84780.82880.9781
10.97760.99000.81840.82970.9684
20.98070.98640.89090.84680.9812
30.97140.98700.77670.80100.9715
40.96680.98240.80900.81480.9531
50.97800.98430.89150.84880.9854
60.97480.97760.94200.85670.9858
70.97570.97740.95400.85440.9925
80.98220.98570.94010.89230.9919
90.97370.97800.92370.84940.9858
100.97970.98640.89170.86210.9887
110.98070.98240.96030.88480.9914
120.98000.98740.90370.88940.9854
130.98030.98960.88690.89070.9879
140.97800.98670.88570.87410.9800
150.96820.98750.79890.83700.9708
160.97600.98820.85670.86410.9767
170.98660.99400.84550.86420.9710
180.98270.98770.87280.81300.9774
190.97100.98300.84080.78670.9738
Average0.97680.98530.87990.85050.9798
The bold data in the table represent the maximum value achieved on each evaluation index.
Table 6. Ablation experiments on the STARE dataset.
ModelSpecificitySensitivityAccuracyDiceAUC_ROC
BackBone0.98210.85940.97220.82560.9791
BackBone + CPA0.98370.86610.97480.83710.9796
MCPANet0.98530.87990.97680.85050.9798
The bold data in the table represent the maximum value achieved on each evaluation index.
Table 7. Comparison with other methods on the DRIVE dataset.
TypeMethodsYearAccuracySensitivitySpecificityDice
Unsupervised
method
Azzopardi et al. [24]20150.94420.76550.9704-
Chen et al. [25]20170.93900.73580.9680-
Tian et al. [28]20190.95800.86390.9690-
Jainish et al. [7]20200.96570.98900.7900-
Supervised
Method
U-Net [10]20150.95310.75370.98200.8142
R2U-Net [26]20180.95560.77920.98130.8171
DUNet [29]20190.95660.79630.98000.8237
AG-UNet [30]20200.95580.78540.98100.8216
CA-Net [9]20200.96050.77270.97880.7733
RVSeg-Net [31]20200.96810.81070.9845-
Guo et al. [32]20200.96910.81490.98390.8222
topGAN [33]20200.94300.91800.9300-
M-GAN [34]20200.97060.83460.98360.8324
Tong et al. [27]20210.96840.81170.98700.8174
SCS-Net [35]20210.96970.82890.98380.8189
SA-Net [36]20210.95690.8252--
PLRS-Net [37]20220.96820.82690.9817-
Ours20220.97050.83560.98360.8315
The bold data in the table represent the maximum value achieved on each evaluation index.
Table 8. Comparison with other methods on the CHASE dataset.
TypeMethodsYearAccuracySensitivitySpecificityDice
Unsupervised
method
Azzopardi et al. [24]20150.93870.75850.9587-
Tian et al. [28]20190.96010.87780.9680-
Supervised
Method
U-Net [10]20150.95780.82880.97010.7783
R2U-Net [26]20180.96340.77560.98200.7928
DUNet [29]20190.96100.81550.97520.7883
AG-UNet [30]20200.97520.81100.98700.8116
RVSeg-Net [31]20200.97260.80690.9836-
Guo et al. [32]20200.97510.84860.98360.8111
CA-Net [9]20200.96450.81200.97490.7409
M-GAN [33]20200.9736--0.8110
Tong et al. [27]20210.97390.83400.98680.7911
SCS-Net [35]20210.97440.83650.9839-
PLRS-Net [37]20220.97310.83010.9839-
Ours20220.97580.84160.98490.8148
The bold data in the table represent the maximum value achieved on each evaluation index.
Table 9. Comparison with other methods on the STARE dataset.
TypeMethodsYearAccuracySensitivitySpecificityDice
Unsupervised
Method
Azzopardi et al. [24]20150.93870.75850.9587-
Tian et al. [28]20190.96010.87780.9680-
U-Net [10]20150.96900.82700.98420.8373
Supervised
Method
R2U-Net [26]20180.97120.82980.98620.8475
Iter-Net [38]20200.97820.77150.99190.8146
M-GAN [35]20200.98760.83240.99380.8370
Tong et al. [27]20210.98050.80720.99270.8270
SCS-Net [35]20210.97360.82070.9839-
PLRS-Net [37]20220.97150.86350.9803-
Ours20220.97680.87990.98530.8505
The bold data in the table represent the maximum value achieved on each evaluation index.
Table 10. Comparison with other methods on the KvasirSEG dataset.
MethodsYearAccuracySensitivitySpecificityDice
U-Net [10]20150.94660.95940.94010.8212
Attention U-Net [39]20180.94400.95080.93750.8181
CE-Net [40]20190.95010.95690.94350.8307
CA-Net [9]20200.94220.94890.93570.8099
Ours20220.95210.95910.94530.8374
The bold data in the table represent the maximum value achieved on each evaluation index.
Table 11. Number of parameters and segmentation time for different models.
Model (Params)DRIVE
(10,000 Pathcs)
CHASE_DB1
(10,000 Pathcs)
STARE
(38,000 Patchs)
BackBone (7.42 M)1.29 s6.37 s7.05 s
BackBone + CPA (7.43 M)1.51 s7.37 s1.51 s
CA-Net (2.8 M)2.7 s3.77 s2.28 s
AG-UNet (28.3 M)6.21 s21.01 s15.89 s
MCPANet (7.46 M)0.83 s10.24 s1.02 s
Publisher’s Note: MDPI stays neutral with regard to jurisdictional claims in published maps and institutional affiliations.

