
Reliability Estimation for Stress-Strength Model Based on Unit-Half-Normal Distribution


Abstract
:1. Introduction
2. Entropy and Mean Residual Life
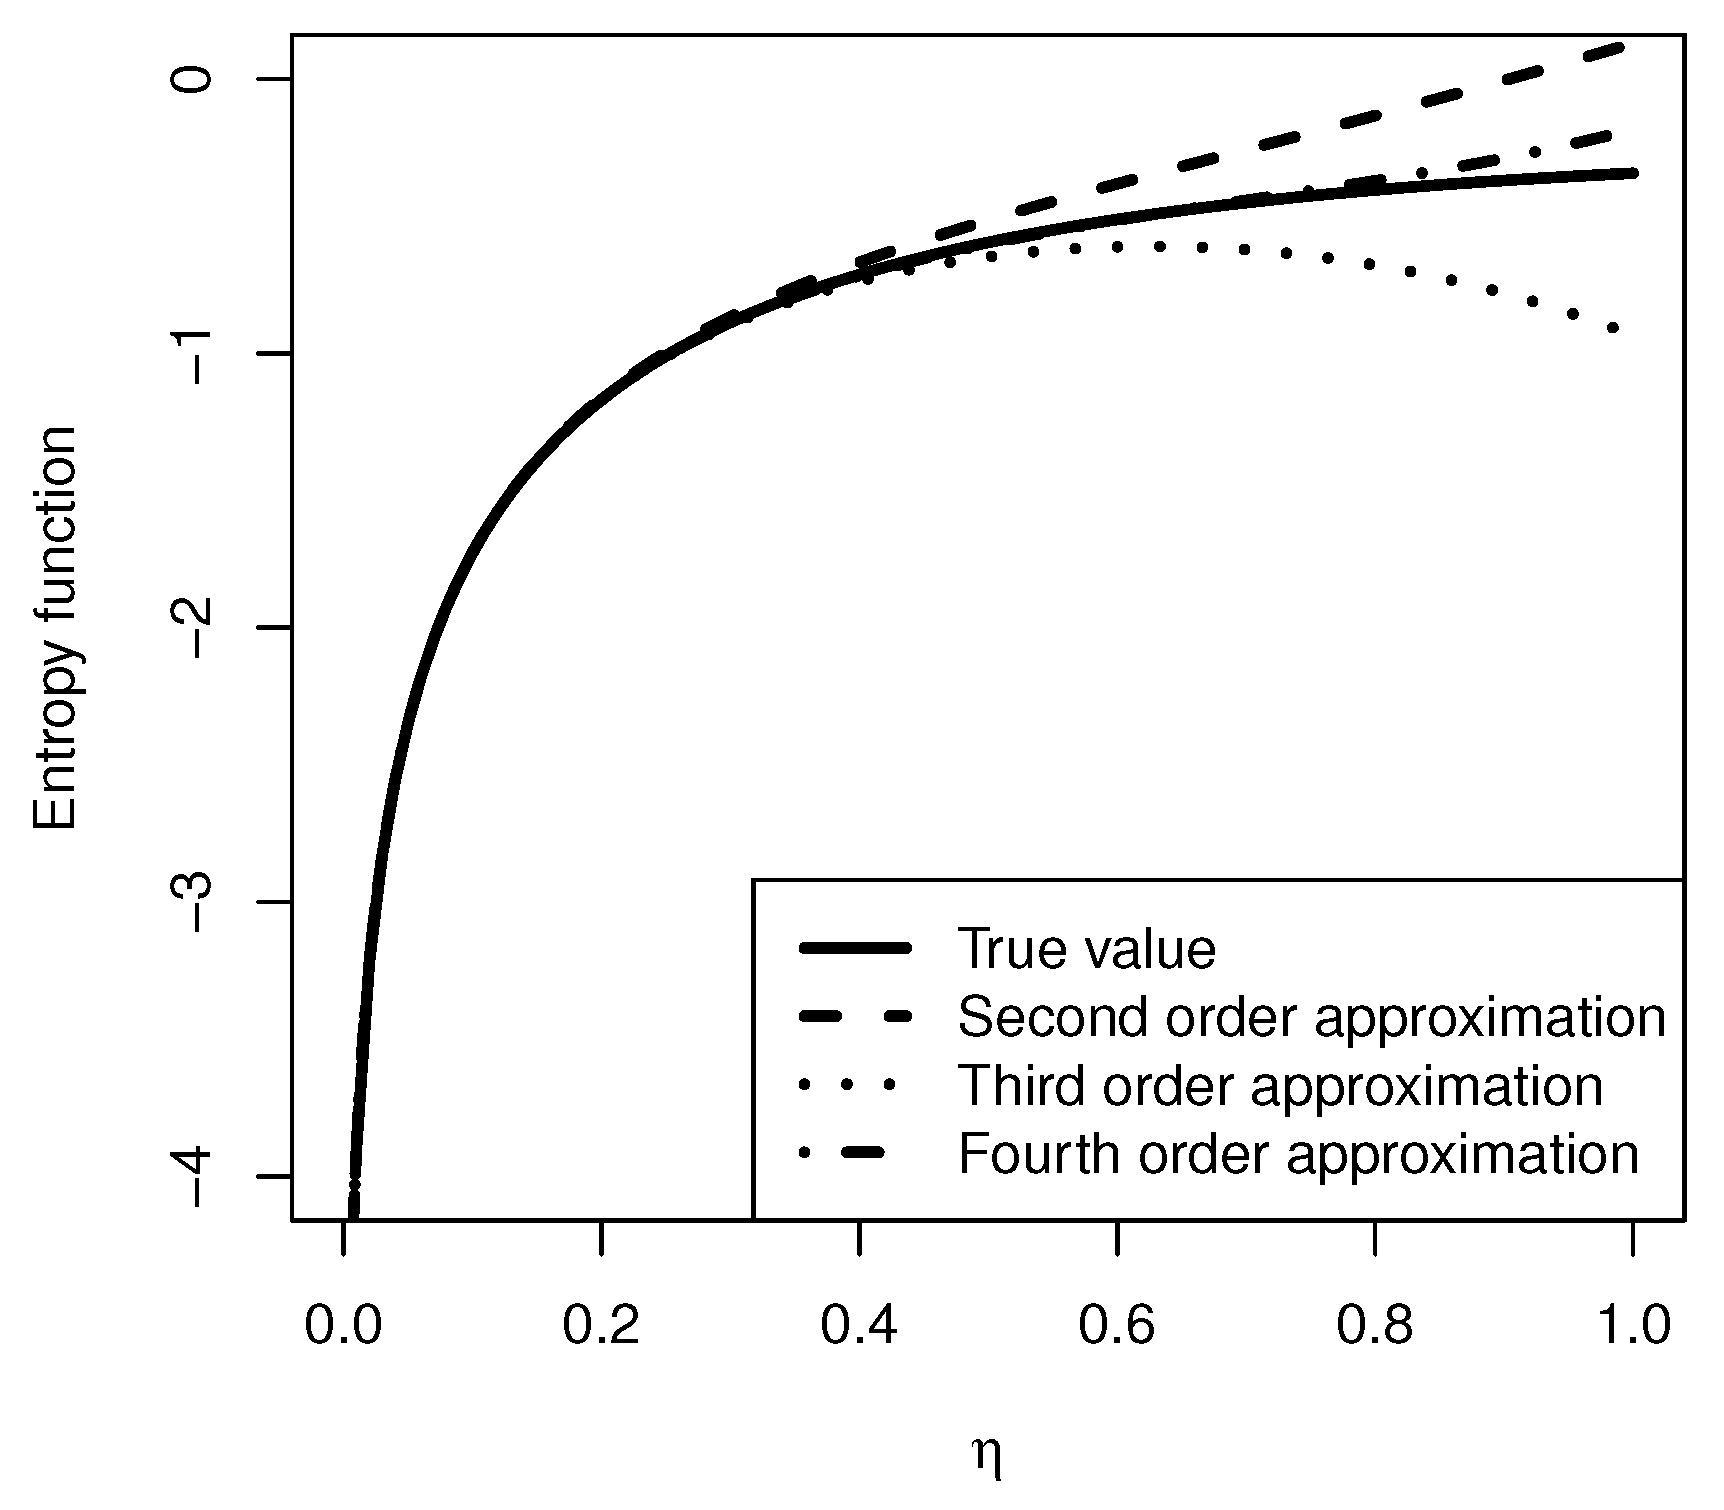
2.1. Entropy
2.2. Mean Residual Life
3. Stress–Strength Reliability Model
3.1. Maximum Likelihood Estimation of R
- 1.
- and
- 2.
- and
- 3.
- 4.
- .
- 1.
- , thenand.
- 2.
- , thenand,
3.2. Confidence Intervals for and
3.3. Exact PDF for R
| Algorithm 1: Algorithm to generate observations from . |
Require Initialize the algorithm fixing , , n and m
|
| Algorithm 2: Algorithm to generate observations from . |
Require Initialize the algorithm fixing , , n and m
|
| Algorithm 3: Algorithm to generate observations from . |
Require Initialize the algorithm fixing , , n and m
|
4. Interval Estimation of
4.1. Exact Confidence Interval
4.2. Asymptotic Distribution and Confidence Interval
4.3. Bootstrap Confidence Intervals
4.3.1. Parametric Bootstrap Sampling Algorithm
- Stage 1 Compute MLE of and , say and , based on data and .
- Stage 2 Based on and , generates samples from and from withwhere for , is generated independent observations from the uniform distribution of sample size n and m, respectively.
- Stage 3 Compute MLE of and , say and , based on data and , respectively.
- Stage 4 Compute MLE of R, say , based on and .
- Stage 5 Repeat Steps 2 to 4 B times and generate B bootstrap estimates of , and R.
4.3.2. Nonparametric Bootstrap Sampling Algorithm
- Stage 1 Draw random samples with replacement and from the original data and , respectively.
- Stage 2 Compute the bootstrap estimates and , say and , based on data and , respectively.
- Stage 3 Using and and Equation (8), compute the bootstrap estimate of R, say .
- Stage 4 Repeat Steps 1 and 3 B times and generate B bootstrap estimates of , and R.
5. Simulation Study
6. An Illustrative Example
7. Concluding Remarks
Author Contributions
Funding
Institutional Review Board Statement
Informed Consent Statement
Data Availability Statement
Conflicts of Interest
References
- Bakouch, H.S.; Nik, A.S.; Asgharzadeh, A.; Salinas, H.S. A flexible probability model for proportion data: Unit-half-normal distribution. Commun. Stat. Case Stud. Data Anal. Appl. 2021, 7, 271–288. [Google Scholar] [CrossRef]
- Topp, C.W.; Leone, F.C. A family of J-Shaped frequency functions. J. Am. Stat. Assoc. 1995, 50, 209–219. [Google Scholar] [CrossRef]
- Kumaraswamy, P. A generalized probability density function for double-bounded random processes. J. Hydrol. 1980, 46, 79–88. [Google Scholar] [CrossRef]
- Tadikamalla, P.R.; Johnson, M.L. Systems of frequency curves generated by transformations of Logistic variables. Biometrika 1982, 69, 461–465. [Google Scholar] [CrossRef]
- Johnson, N.L.; Kotz, S.; Balakrishnan, N. Continuous Univariate Distributions, 2nd ed.; Wiley: New York, NY, USA, 1994; Volume 1. [Google Scholar]
- Mazucheli, J.; Menezes, A.F.B.; Dey, S. The unit-Birnbaum-Saunders distribution with applications. Chil. J. Stat. 2018, 9, 47–57. [Google Scholar]
- Mazucheli, J.; Menezes, A.F.B.; Chakraborty, S. On the one parameter unit-Lindley distribution and its associated regression model for proportion data. J. Appl. Stat. 2019, 46, 700–714. [Google Scholar] [CrossRef] [Green Version]
- Kotz, S.; Lumelskii, Y.; Pensky, M. The Stress-Strength Model and Its Generalizations: Theory and Applications; World Scientific Publishing: Singapore, 2003. [Google Scholar]
- Shannon, C.E. A Mathematical Theory of Communication. Bell Syst. Tech. J. 1948, 27, 379–423. [Google Scholar] [CrossRef] [Green Version]
- R Core Team. R: A Language and Environment for Statistical Computing; R Foundation for Statistical Computing: Vienna, Austria, 2021; Available online: https://www.R-project.org/ (accessed on 10 January 2022).
- Ahsanullah, M.; Aazad, A.A.; Kibria, B.M.G. A Note on Mean Residual Life of the k out of n System. Bull. Malays. Math. Sci. Soc. 2013, 37, 83–91. [Google Scholar]
- Casella, G.; Berger, R. Statistical Inference; Duxbury Press: Belmont, CA, USA, 1990. [Google Scholar]
- Malik, H.J. Exact distributions of the quotient of independent generalized gamma variables. Can. Math. Bull. 1967, 10, 463–465. [Google Scholar] [CrossRef]
- Rao, C.R. Linear Statistical Inference and Its Applications; John Wiley & Sons, Inc.: Hoboken, NJ, USA, 2002. [Google Scholar]
- Davison, A.; Hinkley, D. Bootstrap Methods and Their Application; Cambridge University Press: Cambridge, UK, 1997. [Google Scholar]
- Efron, B.; Tibshirani, R.J. An Introduction to the Bootstrap; Chapman and Hall: New York, NY, USA, 1993. [Google Scholar]
- Efron, B. The Jackknife, the Bootstrap, and Other Resampling Plans; Society of Industrial and Applied Mathematics: Philadelphia, PA, USA, 1982. [Google Scholar]
- Efron, B. Better bootstrap confidence intervals. J. Am. Stat. Assoc. 1987, 82, 171–185. [Google Scholar] [CrossRef]
- Almonte, C.; Kibria, B.M.G. On some classical, bootstrap and transformation confidence intervals for estimating the mean of an asymmetrical population. Model Assist. Stat. Appl. 2009, 4, 91–104. [Google Scholar] [CrossRef]
- CustomPart.Net. Sheet Metal Cutting (Shearing). Available online: https://www.custompartnet.com/wu/sheet-metal-shearing (accessed on 3 January 2022).
- Dasgupta, R. On the distribution of Burr with applications. Sankhya B 2011, 73, 1–19. [Google Scholar] [CrossRef]
- Kay, S. Asymptotic maximum likelihood estimator performance for chaotic signals in noise. IEEE Trans. Signal Process. 1995, 43, 1009–1012. [Google Scholar] [CrossRef]
- Mazucheli, J.; Menezes, A.F.B.; Dey, S. Improved Maximum Likelihood Estimators for the Parameters of the Unit-Gamma Distribution. Commun. Stat. Theory Methods 2018, 47, 3767–3778. [Google Scholar] [CrossRef]
- Giles, D.E.; Feng, H.; Godwin, R.T. On the Bias of the Maximum Likelihood Estimator for the Two-Parameter Lomax Distribution. Commun. Stat. Theory Methods 2013, 42, 1934–1950. [Google Scholar] [CrossRef] [Green Version]
- Giles, D.E. Bias Reduction for the Maximum Likelihood Estimators of the Parameters in the Half-Logistic Distribution. Commun. Stat. Theory Methods 2012, 41, 212–222. [Google Scholar] [CrossRef]
- Lemonte, A.J. Improved point estimation for the Kumaraswamy distribution. J. Stat. Comput. Simul. 2011, 81, 1971–1982. [Google Scholar] [CrossRef]
- Firth, D. Bias reduction of maximum likelihood estimates. Biometrika 1993, 80, 27–38. [Google Scholar] [CrossRef]


| Method | R | |||
|---|---|---|---|---|
| MLE | −0.0044(0.0029) | −0.0025(0.0010) | −0.0052(0.0051) | |
| Npar.Boot | −0.0086(0.0029) | −0.0046(0.0010) | −0.0098(0.0051) | |
| Par.Boot | −0.0093(0.0029) | −0.0049(0.0010) | −0.0105(0.0050) | |
| MLE | −0.0039(0.0022) | −0.0029(0.0013) | −0.0014(0.0049) | |
| Npar.Boot | −0.0072(0.0022) | −0.0057(0.0013) | −0.0022(0.0048) | |
| Par.Boot | −0.0076(0.0022) | −0.0062(0.0013) | −0.0021(0.0047) | |
| MLE | −0.0032(0.0022) | −0.0029(0.0010) | −0.0017(0.0044) | |
| Npar.Boot | −0.0065(0.0022) | −0.0051(0.0010) | −0.0040(0.0043) | |
| Par.Boot | −0.0069(0.0022) | −0.0053(0.0010) | −0.0043(0.0043) | |
| MLE | −0.0033(0.0022) | −0.0017(0.0007) | −0.0042(0.0038) | |
| Npar.Boot | −0.0065(0.0022) | −0.0032(0.0007) | −0.0081(0.0037) | |
| Par.Boot | −0.0070(0.0022) | −0.0034(0.0007) | −0.0088(0.0037) | |
| MLE | −0.0020(0.0015) | −0.0021(0.0010) | ||
| Npar.Boot | −0.0043(0.0015) | −0.0043(0.0010) | ||
| Par.Boot | −0.0045(0.0015) | −0.0045(0.0010) | 0.0002(0.0035) | |
| MLE | −0.0024(0.0015) | −0.0016(0.0007) | −0.0019(0.0030) | |
| Npar.Boot | −0.0047(0.0015) | −0.0031(0.0007) | −0.0036(0.0030) | |
| Par.Boot | −0.0049(0.0015) | −0.0033(0.0007) | −0.0036(0.0030) | |
| MLE | −0.0027(0.0015) | −0.0011(0.0004) | −0.0036(0.0024) | |
| Npar.Boot | −0.0050(0.0015) | −0.0021(0.0004) | −0.0066(0.0024) | |
| Par.Boot | −0.0052(0.0015) | −0.0021(0.0004) | −0.0069(0.0024) | |
| MLE | −0.0016(0.0009) | −0.0013(0.0007) | −0.0002(0.0022) | |
| Npar.Boot | −0.0030(0.0009) | −0.0028(0.0007) | 0.0002(0.0022) | |
| Par.Boot | −0.0031(0.0009) | −0.0029(0.0007) | 0.0003(0.0022) | |
| MLE | −0.0011(0.0009) | −0.0010(0.0004) | −0.0007(0.0018) | |
| Npar.Boot | −0.0025(0.0009) | −0.0019(0.0004) | −0.0018(0.0017) | |
| Par.Boot | −0.0026(0.0009) | −0.0020(0.0004) | −0.0018(0.0017) | |
| MLE | −0.0005(0.0004) | −0.0002(0.0002) | −0.0007(0.0009) | |
| Npar.Boot | −0.0013(0.0004) | −0.0007(0.0002) | −0.0013(0.0009) | |
| Par.Boot | −0.0013(0.0004) | −0.0007(0.0002) | −0.0013(0.0009) |
| Method | R | ||||
|---|---|---|---|---|---|
| Exact | 0.2383(0.950) | 0.1163(0.943) | 0.2766(0.944) | ||
| Asympt. | 0.2108(0.944) | 0.1225(0.934) | 0.2732(0.941) | ||
| Non-par | t | 0.2402(0.949) | 0.1187(0.941) | 0.2768(0.942) | |
| Boot | q | 0.1671(0.945) | 0.1101(0.942) | 0.2769(0.943) | |
| CIs | 0.1720(0.943) | 0.1105(0.943) | 0.2744(0.942) | ||
| Par | t | 0.2394(0.942) | 0.1174(0.943) | 0.2801(0.945) | |
| Boot | q | 0.2384(0.951) | 0.1161(0.942) | 0.2765(0.943) | |
| CIs | 0.2382(0.949) | 0.1164(0.942) | 0.2750(0.947) | ||
| Exact | 0.2018(0.947) | 0.1838(0.943) | 0.2719(0.951) | ||
| Asympt. | 0.1842(0.946) | 0.1408(0.941) | 0.2713(0.947) | ||
| Non-par | t | 0.2201(0.950) | 0.1123(0.945) | 0.2718(0.948) | |
| Boot | q | 0.1834(0.949) | 0.1089(0.946) | 0.2617(0.947) | |
| CIs | 0.1923(0.948) | 0.1166(0.947) | 0.2742(0.953) | ||
| Par | t | 0.2386(0.947) | 0.1812(0.947) | 0.2760(0.949) | |
| Boot | q | 0.2381(0.948) | 0.1705(0.946) | 0.2748(0.951) | |
| CIs | 0.2385(0.949) | 0.1877(0.945) | 0.2742(0.958) | ||
| Exact | 0.2013(0.945) | 0.1349(0.952) | 0.2542(0.947) | ||
| Asympt. | 0.1838(0.942) | 0.1223(0.949) | 0.2527(0.942) | ||
| Non-par | t | 0.2206(0.949) | 0.1125(0.947) | 0.2721(0.943) | |
| Boot | q | 0.1832(0.949) | 0.1087(0.947) | 0.2611(0.948) | |
| CIs | 0.1920(0.947) | 0.1169(0.948) | 0.2557(0.946) | ||
| Par | t | 0.2249(0.948) | 0.1311(0.948) | 0.2758(0.947) | |
| Boot | q | 0.2245(0.947) | 0.1201(0.949) | 0.2751(0.946) | |
| CIs | 0.2249(0.948) | 0.1308(0.947) | 0.2556(0.945) | ||
| Exact | 0.2017(0.947) | 0.1271(0.943) | 0.2346(0.945) | ||
| Asympt. | 0.1841(0.946) | 0.1004(0.944) | 0.2320(0.944) | ||
| Non-par | t | 0.1918(0.949) | 0.1169(0.945) | 0.2232(0.945) | |
| Boot | q | 0.1799(0.948) | 0.1001(0.946) | 0.2311(0.946) | |
| CIs | 0.1801(0.949) | 0.1007(0.947) | 0.2301(0.951) | ||
| Par | t | 0.2116(0.946) | 0.1315(0.947) | 0.2351(0.946) | |
| Boot | q | 0.2011(0.947) | 0.1316(0.948) | 0.2313(0.947) | |
| CIs | 0.2007(0.948) | 0.1318(0.949) | 0.2332(0.955) | ||
| Exact | 0.1596(0.951) | 0.1643(0.941) | 0.2311(0.953) | ||
| Asympt. | 0.1503(0.945) | 0.1224(0.942) | 0.2311(0.949) | ||
| Non-par | t | 0.1501(0.949) | 0.1568(0.946) | 0.2278(0.945) | |
| Boot | q | 0.1424(0.947) | 0.1502(0.947) | 0.2199(0.946) | |
| CIs | 0.1425(0.947) | 0.1507(0.948) | 0.2121(0.946) | ||
| Par | t | 0.1602(0.947) | 0.1677(0.943) | 0.2401(0.948) | |
| Boot | q | 0.1599(0.948) | 0.1601(0.947) | 0.2397(0.946) | |
| CIs | 0.1566(0.947) | 0.1609(0.947) | 0.2320(0.945) | ||
| Exact | 0.1597(0.949) | 0.1065(0.952) | 0.2086(0.948) | ||
| Asympt. | 0.1504(0.942) | 0.1003(0.943) | 0.2078(0.946) | ||
| Non-par | t | 0.1495(0.951) | 0.1044(0.953) | 0.2084(0.951) | |
| Boot | q | 0.1485(0.948) | 0.0979(0.951) | 0.1999(0.947) | |
| CIs | 0.1486(0.945) | 0.0977(0.949) | 0.2082(0.943) | ||
| Par | t | 0.1604(0.949) | 0.1071(0.950) | 0.2117(0.948) | |
| Boot | q | 0.1601(0.948) | 0.1063(0.951) | 0.2085(0.945) | |
| CIs | 0.1598(0.948) | 0.1065(0.948) | 0.2080(0.944) | ||
| Exact | 0.1604(0.949) | 0.1026(0.935) | 0.1881(0.949) | ||
| Asympt. | 0.1510(0.934) | 0.1080(0.938) | 0.1865(0.945) | ||
| Non-par | t | 0.1485(0.950) | 0.0998(0.938) | 0.1856(0.946) | |
| Boot | q | 0.1449(0.948) | 0.0904(0.937) | 0.1855(0.947) | |
| CIs | 0.1451(0.951) | 0.0911(0.938) | 0.1870(0.945) | ||
| Par | t | 0.1649(0.946) | 0.1087(0.939) | 0.1882(0.942) | |
| Boot | q | 0.1601(0.949) | 0.1023(0.940) | 0.1876(0.944) | |
| CIs | 0.1604(0.947) | 0.1024(0.941) | 0.1875(0.935) | ||
| Exact | 0.1211(0.951) | 0.1372(0.937) | 0.1855(0.951) | ||
| Asympt. | 0.1169(0.941) | 0.1000(0.932) | 0.1856(0.940) | ||
| Non-par | t | 0.1171(0.943) | 0.0989(0.942) | 0.1823(0.942) | |
| Boot | q | 0.1078(0.948) | 0.0942(0.940) | 0.1799(0.946) | |
| CIs | 0.1081(0.947) | 0.0943(0.941) | 0.1854(0.946) | ||
| Par | t | 0.1285(0.946) | 0.1389(0.945) | 0.1899(0.948) | |
| Boot | q | 0.1203(0.945) | 0.1367(0.946) | 0.1862(0.945) | |
| CIs | 0.1213(0.949) | 0.1369(0.945) | 0.1860(0.944) | ||
| Exact | 0.1215(0.951) | 0.0810(0.954) | 0.1621(0.950) | ||
| Asympt. | 0.1172(0.940) | 0.0781(0.942) | 0.1617(0.944) | ||
| Non-par | t | 0.1149(0.944) | 0.0751(0.945) | 0.1602(0.948) | |
| Boot | q | 0.1102(0.943) | 0.0733(0.943) | 0.1599(0.950) | |
| CIs | 0.1101(0.942) | 0.0731(0.944) | 0.1625(0.949) | ||
| Par | t | 0.1201(0.942) | 0.0791(0.942) | 0.1672(0.947) | |
| Boot | q | 0.1172(0.941) | 0.0773(0.941) | 0.1624(0.943) | |
| CIs | 0.1199(0.941) | 0.0785(0.940) | 0.1623(0.950) | ||
| Exact | 0.0845(0.948) | 0.0563(0.946) | 0.1149(0.943) | ||
| Asympt. | 0.0830(0.945) | 0.0553(0.944) | 0.1147(0.942) | ||
| Non-par | t | 0.0865(0.942) | 0.0571(0.943) | 0.1153(0.944) | |
| Boot | q | 0.0818(0.944) | 0.0498(0.947) | 0.1001(0.944) | |
| CIs | 0.0830(0.943) | 0.5341(0.941) | 0.1154(0.953) | ||
| Par | t | 0.0838(0.942) | 0.0862(0.951) | 0.1162(0.945) | |
| Boot | q | 0.0834(0.941) | 0.0856(0.952) | 0.1049(0.943) | |
| CIs | 0.0836(0.943) | 0.0861(0.951) | 0.1150(0.954) |
| 0.04, 0.02, 0.06, 0.12, 0.14, 0.08, 0.22, 0.12, 0.08, 0.26, |
| 0.24, 0.04, 0.14, 0.16, 0.08, 0.26, 0.32, 0.28, 0.14, 0.16, |
| 0.24, 0.22, 0.12, 0.18, 0.24, 0.32, 0.16, 0.14, 0.08, 0.16, |
| 0.24, 0.16, 0.32, 0.18, 0.24, 0.22, 0.16, 0.12, 0.24, 0.06, |
| 0.02, 0.18, 0.22, 0.14, 0.06, 0.04, 0.14, 0.26, 0.18, 0.16 |
| 0.06, 0.12, 0.14, 0.04, 0.14, 0.16, 0.08, 0.26, 0.32, 0.22, |
| 0.16, 0.12, 0.24, 0.06, 0.02, 0.18, 0.22, 0.14, 0.22, 0.16, |
| 0.12, 0.24, 0.06, 0.02, 0.18, 0.22, 0.14, 0.02, 0.18, 0.22, |
| 0.14, 0.06, 0.04, 0.14, 0.22, 0.14, 0.06, 0.04, 0.16, 0.24, |
| 0.16, 0.32, 0.18, 0.24, 0.22, 0.04, 0.14, 0.26, 0.18, 0.16 |
| MLE | |||
| Npar.Boot | |||
| Par.Boot | |||
| K-S: | pval = 0.726 | ||
| K-S: | pval = 0.607 |
| R | ||||
|---|---|---|---|---|
| Exact | (0.199, 0.296) | (0.184, 0.273) | (0.437, 0.613) | |
| Asympt. | (0.191, 0.285) | (0.176, 0.262) | (0.438, 0.614) | |
| Non-par | t | (0.205, 0.277) | (0.190, 0.257) | (0.455, 0.586) |
| Boot | q | (0.204, 0.271) | (0.188, 0.250) | (0.463, 0.586) |
| CIs | (0.207, 0.274) | (0.191, 0.254) | (0.460, 0.584) | |
| Par | t | (0.196, 0.302) | (0.183, 0.276) | (0.425, 0.628) |
| Boot | q | (0.188, 0.287) | (0.175, 0.262) | (0.431, 0.615) |
| CIs | (0.199, 0.296) | (0.184, 0.273) | (0.437, 0.612) |
Publisher’s Note: MDPI stays neutral with regard to jurisdictional claims in published maps and institutional affiliations. |
© 2022 by the authors. Licensee MDPI, Basel, Switzerland. This article is an open access article distributed under the terms and conditions of the Creative Commons Attribution (CC BY) license (https://creativecommons.org/licenses/by/4.0/).
Share and Cite
de la Cruz, R.; Salinas, H.S.; Meza, C. Reliability Estimation for Stress-Strength Model Based on Unit-Half-Normal Distribution. Symmetry 2022, 14, 837. https://doi.org/10.3390/sym14040837
de la Cruz R, Salinas HS, Meza C. Reliability Estimation for Stress-Strength Model Based on Unit-Half-Normal Distribution. Symmetry. 2022; 14(4):837. https://doi.org/10.3390/sym14040837
Chicago/Turabian Stylede la Cruz, Rolando, Hugo S. Salinas, and Cristian Meza. 2022. "Reliability Estimation for Stress-Strength Model Based on Unit-Half-Normal Distribution" Symmetry 14, no. 4: 837. https://doi.org/10.3390/sym14040837
APA Stylede la Cruz, R., Salinas, H. S., & Meza, C. (2022). Reliability Estimation for Stress-Strength Model Based on Unit-Half-Normal Distribution. Symmetry, 14(4), 837. https://doi.org/10.3390/sym14040837