Article

Research on Control Strategy of Design Change Cross-Module Propagation

Department of Industrial Engineering, School of Mines, China University of Mining and Technology, Xuzhou 221116, China
*
Author to whom correspondence should be addressed.
Symmetry 2022, 14(2), 368; https://doi.org/10.3390/sym14020368
Submission received: 27 November 2021 / Revised: 27 January 2022 / Accepted: 10 February 2022 / Published: 12 February 2022
(This article belongs to the Special Issue Symmetry in Industrial Engineering)

Abstract

:
In the process of product design, design changes are unavoidable due to the diversification of customer requirements and the advancement of key technologies. Although modules are supposed to be functionally independent and “low-coupling” in modular products, the design change in a module can still propagate into other modules due to the interfaces among them, and this propagation increases the product development lead-time and costs. This study aims to solve the problem of cross-module propagation in design change. First, the dependence of modules on interfaces is analyzed from the perspectives of complex network characteristics, change propagation characteristics, and cost dependence, and then the correlation between modules is determined. Second, the cross-module change propagation impact is evaluated considering node importance, change cost, and propagation path length. The control strategies of cross-module design change propagation are proposed from the aspects of increasing the tolerance of interface and reducing the dependence of modules on interface, etc. Finally, a certain type of sanitation vehicle cab is utilized as an example to demonstrate the assessment process of the cross-module propagation impact of design change and to verify the feasibility of the proposed method and control strategies.

1. Introduction

Design change is inevitable as customer demand changes, science and technology progress, and suppliers change. It is well known that symmetry is a basic property of product design [1], including functional symmetry, structural symmetry, and principal symmetry, which can improve product performance, such as reducing wear and saving energy; thus, there are several correlations between product components. Increases in product complexity and individual customer requirements lead to the functional and structural relationships between components becoming more complex, making product design and change complicated and difficult; a design change in one component may lead to a change in adjacent components, thereby triggering change propagation. Therefore, the modular strategy in mass customization is widely adopted by manufacturing enterprises.
Modular design is a strategy to satisfy the needs of different levels of customers by product module division based on the functional and structural analysis of products with the same function and different performance, or different function, and different specifications within a certain range. Through the rapid configuration of product modules, product variants with different function/performance combinations can be obtained [2]. The modular product can be designed and maintained separately to improve feasibility and maintainability as well as reduce the development cycle of the product [3,4]. In theory, the modular product satisfies the characteristic of “high cohesion within modules and low coupling between modules,” but there are few completely independent product modules in the actual process of product design, and there are always correlation relationships and interactions between the modules through the interfaces. Therefore, cross-propagation can be implemented through the interfaces when a design change occurs in a certain component. Due to the effect of “high cohesion within modules”, the design change can be widely propagated within the “be propagated” modules without reasonable control; meanwhile change costs are increased, and the engineering significance of the modular design is objectively weakened. In conclusion, cross-module propagation should be avoided in modular products, and once this happens it has important significance to control strategy research.
A few studies combine design change and modular architecture [5], but there are some limitations: for example, that the evaluation of design changes impact between modules and components are not linked to cost, and the method of anticipating and controlling a propagation path has not been explored. To our knowledge, the design change propagation path has been predicted and optimized in the integrated product architecture, in which each pair of components and the relations between them are equally treated. However, this assumption is not applicable to a product with a modular architecture in which the relationship between components in the same module is generally relatively closer than that between components in different modules. Consequently, it is urgently necessary to pay attention to the design change propagation routing considering the impact of modular architecture.
Currently, the research regarding design change management is mainly carried out based on design change propagation analysis (Clarson et.al 2004 [6]; Krishna and Moon 2012 [7]), change impact assessment (Wang and Wei 2006 [8]; Gumus et.al 2008 [9]), and design change routing (Li et.al 2012 [10]; Li, Zhao, and Ma 2016 [11], Li et.al 2020 [12]). However, these studies focus on the integrated product; the characteristics of the modular structure are not considered in the evaluation of the relationship between components and the change propagation impact. Moreover, although the modular structure has concerned in a few studies (Lee et al. 2010 [5]), the assessment of the change propagation impact between components and modules is subjective, and there is a lack of exploration of strategies to control change propagation across modules. Consequently, it is essential to explore the relationships between modules in modular products, to accurately assess the change cross-module propagation impact, and to propose relevant control strategies.
Based on these issues, the evaluation of design change cross-module propagation impact is proposed in this study, and relevant control strategies combining product attribute and module structure are investigated. To achieve the above objectives, the correlation between modules is defined, considering the dependence of a module on an interface that is accordingly devised by comprehensively incorporating the topological characteristics, change propagation characteristics, and change propagation cost of the interfaces within the module as well as the association strength between interfaces. Otherwise, the change cross-module propagation impact is analyzed considering the importance of an interface, change propagation cost, and path length.
The remainder of this article is organized as follows. In Section 2, the related works are reviewed. In Section 3, the process of design change propagation impact control is outlined. In Section 4, the relationships between components and the correlation between modules is explored and illustrated. In Section 5, the relevant cross-module propagation control strategies are analyzed and explored. In Section 6, a case study of the evaluation of the design change propagation impact in a certain type of sanitation vehicle cab is implemented to expound the rationality and efficiency of the proposed method and control strategies. In Section 7, the conclusions and future works are presented.

2. Related Research

2.1. Product Modularization

The idea of modularization has been put forward for a long time. With the development of modular theory, a large number of experts have defined “module.” As the basic component unit of modular design and manufacturing, module generally refers to the parts or components with certain functions in the system that are relatively independent in structure and have defined and completed standard interfaces with each other [13]. The Introduction to Standardization (fifth edition) [14] defines modules as follows: “modules are standardized units with independent functions that can be made into a series separately, which usually composed of parts and components. These modules through different forms of interface with other units to form products, and can be divided, combined, interchangeable.” Modular strategy is based on modules, integrating standardization, universalization, serialization and combination, which is used to solve the diversified problems of complex system types, and is widely used in product design, construction engineering, logistics engineering, management science and other fields.
In the product design, with the increase of product complexity, certain components can exist as a variety of technical route designs and systems; small changes could mean significant reformation for the component [15]. The universality and interchangeability of the spare component requirement has become more and more urgent to the enterprise; therefore, “modular design” was put forward by European and American experts in the 1950s. Product modularization theory originates from the research on the complexity of product physical structure and system architecture: that the customized product can be realized by reorganizing product structure and function, and reducing the influence of design change on the whole product. A modular lathe headstock system composed of 63 different gears has been designed by United Lathe of Germany, which can form more than 60 kinds of transmission systems for different machine tools [16]. Bayliss and Clark [17] successfully applied modularization to the design of IBM360 computer, which solved the complex engineering problems in the computer development process and emphasized the importance of modularization method. Literature [18] believes that hierarchical decomposition of system and product physical structure can effectively reduce complexity. Ulrich [19] discussed the management significance of product architecture with reasonable modularity from five aspects: product evolution, product variables, parts standardization, product performance and product R&D management. Eppinger [20,21] focused on relevant technologies in product design and product research and development, and proposed that the final product structure could be determined by processing the relationship between different modules based on matrix. Otto and Wood [22] deeply summarized a variety of product modular design methods from a global perspective, and provided a specific method framework for some common and popular methods. In [23], techniques for identifying platform leveraging strategies within a product family are reviewed along with metrics for assessing the effectiveness of product platforms and product families, and a discussion of potential areas of research was concluded to help bridge the gap between planning and managing families of products and designing and manufacturing them. Based on product structure, Lai [24,25] developed the product modularization theory from the perspective of product life cycle, and proposed that design structure matrix could be used as a visual representation of product modularization structure. Suh [26] studied axiomatic design theory in the design process, laying a theoretical foundation for formulating design rules and modular design of complex products. Brun and Zorzini [27] introduced environmental constraints and added them into product customization strategies when studying the internal relationship between product development delay and modularization strategy.

2.2. Design Change Management Research

Due to the complex relationship between the components of a product, the change of one component will cause the change of other components connected to it, and then continue to cascade out along the relationships between components. In a modular product, although modules remain relatively independent, changes can propagate across modules through interfaces, affecting more components and causing losses. Currently, research on design change management mainly includes design change propagation analysis, change impact assessment, and design change propagation routing.
Regarding design change propagation analysis, Cohen [28] proposed a change propagation analysis method for change favorable representation, which can effectively represent the potential form of change. A flexible analysis method to analyze change propagation in modular product customization production has been introduced by Mikkola [29]. Bilal [30] established the network to describe product structure and association mode and proposed a change propagation analysis method based on axiomatic design theory.
Regarding change impact assessment, Poortinga [31] constructed a cost-driven demand change model to analyze and evaluate the impact of demand change on aircraft design cost. Tang [32] built a change impact assessment model based on the design structure matrix to, respectively, evaluate the range and degree of change impact. Cheng [33] regarded complex products as a directed weighted network of components and subsystems and evaluated the design change impact by calculating the direct, indirect, and significant impact of each node in the complex network. Li et al. [34] studied the correlation models of research and development and engineering change management of different products and clarified the relationship between these correlations and the time, cost, and quality of new product development. Yu et al. [35] used the directed weighted network model to represent the product structure under the given requirements to evaluate the impact of customer demand changes on design change propagation. Li et al. [36] quantitatively evaluated the impact of design change propagation on complex products by establishing the BBV scale-free network evolution model.
As for design change propagation routing, Ma, Jiang, and Liu established a design change analysis model based on the design attribute network, and the ant colony optimization is employed to search for the optimal propagation with a minimum accumulated change propagation intensity [37]. Li and Lin emphasized the parallel change propagation strategy to search for the shortest propagation path with the smallest time of design change [38]. Li proposed a multi-source design change routing methodology based on a directed and weighted network model, and an optimization model to minimize change propagation intensity was constructed [39]. Li introduced the multi-network theory to establish an optimization model aiming at minimizing change propagation intensity, change task execution time, and change cost, and the optimization scheme of change propagation path was solved by an improved genetic algorithm [40]. Ren et al. [41] proposed a design change routing approach based on a multi-view complex network model for the multi-source design change.
The above design change propagation optimization method has been widely applied to solve the problem of design change management in the integrated product, which reduces the cost of change propagation and improves the efficiency of product design. However, due to the lack of consideration of module structure, it is not suitable for modular products. There are a few studies on modular product design change management: Lee et al. [5] proposed an analytic network process approach to measure the relative importance of parts and modules in a modular product in terms of design change impacts and propagation, but the assessment result was subjective to a certain extent, and there is no further reasonable control of the propagation path. Li et al. [42] believed that interfaces between modules would propagate changes and affect components in other modules, and the range of change propagation could be controlled by identifying interfaces, therefore, the matrix-based clustering method was proposed in this research, which explores the propagation mechanism of modular products to a certain extent. However, this research only focused on the number of interfaces to explore the module division scheme through matrix clustering method, the impact of change propagation on a modular product is not assessed and controlled. Cheng et al. [2] used the design structure matrix to represent the association relationship between product components, calculated the module association dependence degree according to the association propagation path of the main control parts, and then analyzed the interaction and relationship between modules, but ignored the integration impact caused by change propagation.

2.3. Analysis of Correlation between Modules

The analysis of the correlation between modules includes the analysis of module coupling and the study of the decoupling strategy. Xiao et al. [43] used an immune algorithm to cluster recognition of functional coupling relations and recombined coupling functions through decoupling and splitting operations. Chen [44] proposed the complete correlation matrix and the coupling analysis method based on an evolutionary strategy for the coupling problem of heterogeneous module combinations. Yu et al. [45] proposed a functional coupling analysis method for adaptive mechanical systems based on functional-structure dependency analysis. Song et al. [46] introduced quantitative indexes of the strength of module relationship for the measurement of coupling complexity between modules. Choi et al. [47] utilized a flow chart to express the system structure and analyze the coupling relationship between modules. The above literature mainly analyzes functional couplings and relationships between components in product design, while ignoring the correlation between modules when the interface changes. Cheng et al. [2] calculated the dependency between modules based on the associated propagation path of instigating components, and then analyzed the interaction between modules and proposed the corresponding decoupling strategy. However, the integration impact assessment process and control strategy exploration caused by cross-module propagation due to interface component changes are not reflected in the studies.

2.4. Product Modelling in Design Change Management

Generally, the product is composed of numerous sub-systems and components, which interact through the transmission of energy, material, and information, and form a large number of complex correlation relations [48]. The establishment and analysis of the relationship between components effectively and reasonably is the prerequisite for design change management. Many techniques were developed to describe the relationships between components, and the product modelling models are classified into two categories: matrix-based models and network-based models.
In terms of the matrix-based model, the relationship between components is quantified as an element of a matrix. Design structure matrix (DSM) is the most widely used tool for product modelling [32,49,50]. Tang [32] explored a specific method to analyze the direct and indirect impacts of engineering changes based on DSM. Edwin [50] built the change propagation likelihood matrix and change impact matrix to develop an estimation technique for the changeability of a product. Hamraz [50] constructed a comprehensive matrix to describe the relations between components based on the function-behavior-structure scheme model. In terms of the network-based model, Yu [35] established a directed weighted network model of the product structure to assess the impact of change propagation. Li [51] introduced the weighted and directed complex network to express the function relationships, such as material, energy, and information. Compared with the matrix-based model, the network-based model can more clearly express the complex relationships of components, which can more comprehensively analyze the criticality of components.
In sum, the contributions of this article are twofold.
(1)
Theoretically, as the design change propagation is inevitable in the modular product, to solve the shortcomings of existing researches in Section 2.2: the lack of research on the assessment and control of design change propagation impact in the modular product. The method for evaluating correlation between modules is proposed in this paper, and three factors of the importance—components, change cost, and path length—are considered to analyze and evaluate the design change cross-module propagation impact. Moreover, the control strategies from the aspects of the structure and attributes of modules and interfaces are proposed to reduce the change in cross-module propagation impact.
(2)
Technologically, the structural characteristics of modular products are fully considered in this paper, the PageRank algorithm is introduced to calculate the importance of nodes, the dependencies of a module on the interfaces are proposed to calculate change propagation cost, and the change propagation path length is evaluated based on correlation between modules. Besides, correlation between modules is defined by considering the number of interfaces and the dependencies of a module on the interfaces that are devised by comprehensively incorporating the topological characteristics, change propagation characteristics, and cost dependence of the interfaces within the module.

3. Design Change Propagation Control Process

Figure 1 outlines the framework for design change propagation control process. This design change propagation control process assumes that the product has already been modularized. The process in Figure 1 includes three research contents. From the vertical dimension, three research contents show a progressive relationship; from the horizontal dimension, each research content has independent modeling methods and solving processes, which together constitute the design change propagation control study. The process begins by identifying the relationships of components and modules (Research content 1). In Research content 1, the structural and functional relationships between components are explored to established single-view networks. Subsequently, the network difference is defined based on a weighted least square method, which is combined with rules for edges merging direction in order to construct multi-view networks. Simultaneously, the dependence of a module on a component is evaluated from the perspectives of complex network characteristics, change propagation characteristics, and cost dependence to calculate the correlation between modules. In Research content 2, the change propagation impact is explored considering three indexes of change: propagation cost, importance of node, and change propagation path length. The final content in the framework consists of change propagation impact control strategies analysis of the given product module structure, product network connection and nodes attributes. The methods and tools involved in the framework are exhaustively explained in Section 4, Section 5 and Section 6.

4. Research on the Association Relationship in Modular Product Based on Multi-View Network

4.1. Research on the Relationships between Components

The relationships of components are usually determined according to their functions, structures, and other characteristics in existing research. The change parameter of the component exceeds the tolerance of structural or functional parameter, the adjacent nodes will also change, that is, change propagation [52]; therefore, exploring the functional and structural connection relationship between components and establishing a reasonable and accurate network model are important prerequisites for optimizing a change propagation path. In this chapter, single-view networks are established based on structural association and function (material, energy and information) association. The network difference is calculated by the least square method, and the edge weight and direction of each single-view network are optimized and combined to establish a multi-view network.

4.1.1. Construction of Single-View Networks

Exploration of Functional Relationship

Function is the purpose of product design and the direct expression of customer needs. Functional relationships exist between components that share the same function in complex products. Generally, to meet specific function requirements, in addition to the original changed parts, other parts that carry the same function also need to be changed. Due to many factors influencing the functional correlation strength, such as material dependence strength, energy dependence strength and information dependence strength, etc.—among which the flow of fuel, air, oil and exhaust gas between components is regarded as material dependence—heat energy, electric energy, hydraulic pressure, etc., are regarded as energy dependence. Information dependencies include interaction with engine users to start the engine and control its speed. Therefore, functions are divided into material, energy and information levels, and single-view networks are established, respectively. Since the dependence strength and its importance are difficult to accurately measure, the weight of the connected edge is set to 1, and the direction of the edge is consistent with the direction of the functional flow in the functional single-view networks.

Exploration of Structural Relationship

Structure is a functional carrier, and structural relationship is often used to represent the fusion, connection and assembly relations between components. Unlike the functional view, the structural view network has no direction. The tightness of the structural association relationship between the components is determined by the stability of their connection; the closer the connection between two components [53], the evaluation criteria for association strength are shown in Table 1.

Representation of Single View Networks

In single-view networks, the components are modelled as the network node, Vk = {vki} represents the set of nodes, the relationships between the components are abstracted into edges, Ek = {ekij} represents the set of edges, the association strength is the weight of the edge, Rk = {rki,j} represents the set of weights, and the function flow direction is the edge direction, the direction set of edges is represented by Tk = {tkij}. The single-view network model can be represented as Gk = (Vk, Ek, Rk, Tk), where k = 1, 2, 3, and 4 to represent the material, energy, information, and structure networks, respectively, i, j = 1, 2, …, N, and N is the number of nodes in the network.

4.1.2. Construction of Multi-View Networks

A multi-view network needs to be constructed to comprehensively consider the functional and structural relationships between components, that is, all relationship and direction between components are aggregated into a network based on appropriate weights and direction strategy. The multi-view network can be represented as G = (V, E, R, T), where V = {vi} represents the set of nodes, E ={eij} indicates the set of edges, R = {ri,j} is the set of weights, and the direction set of the edges is represented by T = {tij}. The weight of the merged edge in the multi-view is defined as
r i , j = k = 1 4 α k · r i , j k
where αk is the weight of r i ,   j k , which is calculated by network diversity based on weighted least square method (WLSM) [54]. The comprehensive network diversity Dcom is introduced to measure the difference between four single-view networks and comprehensive network
D c o m = k = 1 4 α k D I ( G k ,   G )
In Equation (2), DI (Gk, G) is the difference degree between Gk and G:
  D I ( G k ,   G ) = 1 N i = 1 N 1 N j = 1 N ( r i , j k - r i , j ) 2
Since a smaller network diversity indicates a better compressive network, the optimization model for αk (k = 1, …, 4) is established as
  m i n   D c o m s . t . { 0 α k 1 k = 1 4 α k = 1  
Three rules are introduced in this paper to define the direction of edges in multi-view networks: ① If the directions of the edge between two nodes are the same, they are directly merged with each other in the same direction. ② The edges that have different directions do not need to be merged. ③ While the single-view network of structure has no direction, in order to merge into a multi-view network without ignoring any links, the undirected edge is regarded as a bidirectional edge, and each direction is weighted. Take the combination of r1i,j, r2i,j and r 4i,j as an example; the direction mergence result is shown in Figure 2.

4.2. Evaluation of Correlation between Modules

Generally, a module in the product consists of multiple components, and there are close functional and structural relations among components within the module. Although the characteristics of low coupling between modules will be satisfied in the module design phase, some interfaces between modules still cannot be avoided, thus, the correlation between modules also cannot be avoided. In this section, the correlation between modules will be evaluated by analyzing the dependence of the module on the interface and the relationships among interfaces.

4.2.1. Dependence of Module on Component

Since the different components will play different roles in the same module, the setting of interfaces will inevitably affect the strength of the correlation between modules, resulting in different change propagation impacts. The importance of components in modules is defined as the dependence of modules on components in this study, since the weighted complex network is used to establish the product internal relationship model; therefore, indicators are selected for quantification from the perspectives of complex network characteristics (betweenness and node strength), change propagation characteristics (change propagation index), and cost dependence according to the change propagation management research [36,41].

Betweenness

The betweenness is a global attribute of the network, which refers to the proportion of the number of shortest paths passing through a node and measures the centrality of a node in the network from the perspective of path length [55]. The path length is obtained by calculating the reciprocal of the connection weights. Assuming that the number of the shortest path from node s to node h is gsh, the betweenness of node i is
B i = s h g s i h g s h
where s, h = 1, 2, …, N, (N is the total number of nodes in the network) and shi.

Node Strength

The node strength is different from betweenness, which is an indicator of local node criticality and is mainly used to describe the closeness degree between a node and its neighbors [56]. Node strength is related to the connection weight between nodes in the directed weighted complex network, and is defined as
S i = j = 1 N r i , j + j = 1 N r j , i
in which ri,j and rj,i represent the weight of node i to j and node j to i, respectively.

Change Propagation Index

The change propagation index is used to determine the type of the component, that is, the absorber, carrier, or diffuser [57]. Different from the node strength, the propagation index is only related to the number of adjacent nodes and is defined as
K i = K o u t ( i ) K i n ( i ) K o u t ( i ) + K i n ( i )
where Kout(i) represents the out-degree of node i, that is the number of other nodes affected by node i changes. Kin(i) is the in-degree of node i, which is the number of nodes that can affect node i. The smaller the propagation index is, the more inclined it is to the absorber, and the better it can absorb the influence of change. The larger the propagation index is, the more inclined it is to the diffuser, which will cause more change propagation influence on the network.

Cost Proportion

The cost proportion measures the dependence of a module on a node from the aspect of economic dependency, which refers to the proportion of the redesign cost of the entire module. The cost proportion of node i in the module Mn is defined as
W i = C i C M n
where Ci means the redesign cost of node i, CMn represents the redesign cost of Mn.
Take the Brake module of the sanitation vehicle cab as an example, which includes seven components. The data on the edge of the Figure 3 show the correlation strength between components. Taking node 21 (Brake master cylinder) for example, for Betweenness, the path length between nodes is shown in Table 2. There are 42 shortest paths in module 4, which are listed in Figure 3, where there are 28 shortest paths through node 21, therefore, B23 = 0.67; for Node strength, as shown in Figure 3, the upstream nodes of node 21 (Brake Master Cylinder) contain 23, 24 and 27, and correlation strengths with that are 0.22, 0.63 and 0.15, respectively. The correlation strengths with downstream nodes are 0.22, 0.75 and 0.72 respectively, so S21 = 3.96; for Change propagation index, the out-degree of node 21 is 3, the in-degree of that is 3, K21 = 0; for Cost proportion, the total cost of components contained in module 4 is 2620, and the cost of component 21 (Brake Master Cylinder) is 420, so W21 = 0.16.
In conclusion, the larger the betweenness of the node, the shortest paths pass through the node, and the less influence of changes propagating to this node on the module in the component relationship network of a module. On the contrary, the greater the node strength, the change propagation index, and the cost proportion, the greater the impact of the change on the module. Therefore, the dependency of Mn on node i is defined as
d n , i = ω 1 1 B i + ω 2 S i + ω 3 K i + ω 4 W i  
where ω1, ω2, ω3, and ω4 represent the weight of betweenness, node strength, change propagation index, and cost proportion, respectively, and they are obtained by the information entropy weight method [58]. In order to ensure the same dimension, the four indexes were normalized, respectively. The dimensionless formula is as follows:
x i = x i - x m i n x m a x - x m i n
where xi′ the value of dimensionless, xi is the value of node i, xmax represents the maximum value in this indicator, and xmin represents the minimum value. Due to the different structures and costs of each module, the four indices have different weights in different modules.

4.2.2. Analysis of the Correlation between Modules

The different modules are connected by interfaces; therefore, the correlation between modules has been jointly determined by the number of interfaces, the weights (correlation strength) between interfaces, and the dependence of modules on components. As shown in Figure 4 (nodes with gray are interfaces, the data on the side represent the correlation strength between nodes), path 9–1 is the only path from M2 propagate to M1, and path 5–1 is the only way from M3 propagate to M1, that is, M2M1 and M3M1 have the same number of interfaces and dependence of module M1 on node 1 (d11 = 0.4). On account of r5,1 = 0.65 > r9,1 = 0.44, the correlation of M3M1 is higher than M2M1. Otherwise, the propagation from M1 to M2 can rely on path 1–9 and 8–9, the path 1–5 and 8–5 connects module M1 and M3, and r1,9 + r8,9 = r1,5 + r8,5, the dependence of M3 on interface 5 (d3,5 = 0.67) is more than that of M2 on interface 9(d2,9 = 0.45), thus, the correlation of M1M3 should be higher than of M1M2. Inspired from the above discussion, the correlation between modules can be defined as
R m n =   ( r i , j × d n , j )
where nodes i and j are the interfaces of module Mm and Mn, respectively, and node j is the downstream component connected with node i. Since the comprehensive network is directed and the number of interfaces and the related criticalities are different, R m n R n m  According to Equation (11), R12 = 0.288 and R21 = 0.176.

5. Evaluation of Cross-Module Change Propagation Impact

The purpose of modular design is that the product will be divided into multiple modules with low correlation for independent design and production according to the function and structure. Based on this, the new product that meets the market requirement can be designed quickly by replacing and/or changing a few modules to reduce the possibility of avalanches due to component change propagation. Although the modularization should try to meet the functional independence of each module, there is usually no completely independent module, and there are often a small number of interfaces between modules; therefore, it may still lead to the cross-module propagation of design changes, resulting in the influence of change propagation. As a result, it is necessary to quantitatively evaluate the adverse impact of cross-module change propagation of products, to quickly identify and prevent risks brought by the change in advance and improve the controllability of risks.
Due to the coupling relationship between product components, the design change can be propagated from one of the components to other components that are directly/indirectly related to it, and the entire production network. Components with a higher importance in the product association network are more likely to become change objects, resulting in more change propagation and change propagation impact. Consequently, the importance of the component can be measured from the perspective of the whole product association network to better analyze the change cross-module propagation impact. Otherwise, design change propagation will prolong the delivery time and waste a substantial amount of human and material resources in the process of product design, making it necessary to consider the time and cost when evaluating the impact of change propagation [34,59]. Finally, in order to limit the changed components to a few modules, it is necessary to aggregate the components with high correlation [60,61]. As result, the rapid diffusion of design change information among modules can be reduced by shortening the length of the design change propagation path. In sum, the design change cross-module propagation impact is evaluated from the aspects of the importance of a component, change propagation cost, and path length in this paper.

5.1. Analysis of the Importance of a Component

Generally, the importance of a component is positively proportional to design change impact; the more important the changed components are, the greater the propagation impact will be.
PageRank algorithm [61] is a ranking method of importance that is widely used at present, which scores each node according to the link structure between nodes. The original purpose of the algorithm is to evaluate the importance of web pages in search engine optimization, so as to improve the accuracy of search results. Zhang et al. [62] transferred the idea of the Page Rank algorithm and applied it to directed weighted networks. Considering that product node correlation network and Internet have similar complex network characteristics, and the relationships between components and the “propagated” characteristics in the process of change propagation are very similar to the interlinking of web pages, the analysis method of link structure between web pages can also be used to analyze node relationship in product network. In summary, PageRank algorithm is adopted to evaluate the importance of nodes.
PageRank algorithm is a search engine to calculate the ranking of web pages based on the mutual hyperlinks between web pages, whose key is summarized as follows: ① The PageRank value of a page that can be linked by many other pages will be higher, which means that this page is important. ② If a page with a high PageRank is linked to another page, the PageRank of the linked page will also be improved accordingly [63]. Due to the similarity between the relationship of components and web pages in the process of linking to each other, the PageRank algorithm is employed to quantify the importance of nodes in the complex network.
P R ( i ) = 1 - q N + q j = 1 N P R ( j ) N j
where PR(i) is the PageRank value of node i, the node j is the downstream node of node i, 0 < q < 1 is the damping factor, which represents the probability that the user will return at any time (q is generally valued as 0.85) [63]. N is the total number of nodes; Nj is the number that node j points to.

5.2. Analysis of Change Propagation Cost

The change propagation cost includes the capital cost and time caused by design change propagation, assuming that each component has a fixed development time and cost. In terms of the change propagation within the module, the cost and time of change propagation are influenced by change propagation impact probability. Nevertheless, change cross-module propagation is the result of the relationship between interfaces, which means that some of the modules beyond the initial change module need to be redesigned and changed, that is, a change in one module will cause a changing risk to its neighboring modules. Therefore, the evaluation of cross-module propagation is different from in-module propagation, which needs to consider the risk of changes to adjacent modules.
The change propagation impact probability refers to the likelihood that a component needs to be redesigned after the change propagation. Zheng [64] claimed that only when the redesign parameter of the associated component is propagated beyond its design tolerance does this component need to be changed; thus, the change propagation impact probability is equal to the probability that the changed parameter exceeds its design tolerance.
The dependency of the same module on different interfaces is different, which leads to changes on different interfaces that can cause varying degrees of cost and time risk to the same module. Consequently, the changing risk is related to the dependency of a module on interfaces, that is, d n , j × ( T M n + C M n ) and the change propagation cost between interfaces can be defined as
C T i j = I i , j × [ T j + C j + d n , j × ( T M n + C M n ) ]
in which, node i belongs to Mm, and j belongs to Mn. CTij represents the change propagation cost from node i to j, Ii,j is the change propagation impact probability that propagates from interface i to j, as capital cost and time have different units, dimensionless processing is required (Equation (10)). Tj and Cj are the dimensionless value of the time cost and the capital cost for redesigning component j, the higher the time cost and the capital cost required by components, the greater the value of Tj and Cj. In addition, dn,j represents the dependency of module Mn on interface j. T M n and C M n are the time cost and capital cost for redesigning Mn, respectively. Particularly, data standardization is established if there is a need for the above variables. As shown in Figure 5 (red nodes represent change nodes, gray nodes represent nodes that can be propagated, and data on the edge represent change propagation impact probability), the change propagation impact probability of cross-module propagation paths 9-1 and 9-8 are 0.41 and 0.23, respectively. Assuming that the redesign costs and time of nodes 1 and 8 are 1.29 and 0.39, the total cost of modules 1 and 2 are 4.13 and 5.19, respectively, the dependence of module 1 on nodes 1 is 0.4, and the dependence of module 3 on nodes 5 is 0.67, thus, the change propagation cost caused by path 9-1 is 1.21 and that caused by path 9-5 is 0.89.

5.3. Analysis of Change Propagation Path Length

The edge weights of the product association network reflect the relationships among components, and the change propagation path length is inversely proportional to the strength of the relationship between components [41]. Generally, the path length is directly denoted as the reciprocal of the strength of the relationship between components without considering the modular structure, that is Hi,j = 1/ri,j. Meanwhile, the relationships between interfaces and the correlation between modules ought to be considered in the calculation of change cross-module propagation path length.
H i , j = 1 r i , j × ( 1 + R m n )
where, component i is the interface of Mm, component j is the interface of Mn, and Mm and Mn are connected by nodes i and j.

5.4. Analysis of Change Propagation Probability

Change propagation probability refers to the possibility of propagating to the connected components if a component is changed, and it is positively proportional to the strength of the relationship between components [33]. Thus, the CPP can be regarded as the quantification of the relationship strength between components. In a product, a component may connect with more than one component, but the strengths of the relations are usually different. As long as the initial change propagation impact probability is not absorbed, the changed component will continue to change downward. Therefore, the change propagation probability between nodes i and j is defined as
P i , j = r i , j   r ( v i )
where   r ( v i ) represents the sum of relation strengths among node i and all the other nodes. As shown in Figure 6, red nodes represent change nodes, gray nodes represent adjacent nodes of change nodes, that is, nodes that are likely to be propagated, and data on the edge represent correlation strength. Node 2 is connected to nodes 3, 6, 7, 8, and 9, and the relation strengths are 0.32, 0.32, 0.36, 0.73, and 0.12, respectively. Then P2,3= 0.11 according to Equation (15).

5.5. Calculation of Cross-Module Change Propagation Impact

In the process of design change cross-module propagation, the change propagation impact is proportional to the importance of the interface. The greater the importance of the interface, the greater the change propagation impact on the whole product. Secondly, due to the fierce market competition, the ability to respond quickly to market demand and meet the demand at the lowest cost and time is crucial. The lower the change propagation cost, the smaller the impact. Similarly, the shorter the propagation path length is, the closer the relationship between interfaces, and the smaller the propagation impact. According to 5.4, the greater the change propagation probability between interfaces, the greater the possibility of change propagation across modules, and the greater the possibility of propagation impact. In sum, the cross-module change propagation impact from module Mm to Mn is defined as
C P I m n = i M m j M n [ w 1 P R ( j ) + w 2 C T i j + w 3 H i , j × P i , j ]
where the values of w1, w2, and w3 are obtained by the analytic hierarchy process, and w1 + w2 + w3 = 1 [65].

6. Analysis of Propagation Impact Control Strategy

According to Section 5, cross-module change propagation impact is inevitable due to the setting of some interfaces. This section discusses and analyzes the control of the design change cross-module propagation impact and provides the control strategy to make the modular product that satisfies market demand and can be designed quickly by changing and replacing a spot of modules.

6.1. Increase the Tolerance of Interfaces to Improve Module Adaptability

The cost and time of change cross-module propagation are related to the propagation impact probability between interfaces according to Equation (13); as a consequence, the change cross-module propagation impact can be indirectly reduced by decreasing change propagation impact probability. According to Section 5.2, the change propagation impact probability refers to the likelihood that a component needs to be redesigned after the change propagation, that is, the design change on components whose change range of design parameters exceeds its design tolerance (the value range of design parameters, for example, under normal circumstances, the constraint range of needle valve starting valve is 20–50 mpa; the needle stem diameter is constrained within the range of 3 to 15 mm) can propagate to downstream components based on the relationship network of components.
As shown in Figure 7, nodes with red color represent initial change nodes, the grey is the propagated node, nodes 10 (Hand brake box) and 61 (Back weldment) are interfaces of M1M2, the normalized sum of development cost and time of node 61 (Back weldment) is 0.50 and TM3 + CM3 is 19.40. Increasing the design tolerance of 61 (Back weldment) can reduce the change propagation impact probability of 10→61 from 0.24 to 0.15, thus reducing the change cost of cross-module propagation (3.011 to 1.88). As a result, the flexibility of modules can be improved by increasing the design tolerance of module interface parameters through established design principles [66] and expertise of the system/subsystem designers. (e.g., design the flexible piece to meet the long vehicle specification, and to trim the end (where itis welded to the common piece) to produce the short wheel base variant [4]) without damaging the topological structure of the product based on adaptive design, which has a positive impact on change propagation cost reduction.

6.2. Reduce the Dependence of Module on Interfaces

According to the Equations (11), (13) and (16), the correlation between modules and the change propagation cost will increase as the dependence of module on interfaces slants high, which will result in a stronger change cross-module propagation impact. Therefore, weakening the module dependence on interfaces or selecting components with low dependency as the module interface can effectively reduce the cross-module change propagation impact. As illustrated in Equation (9), two ways are proposed to reduce dependence: ① reducing the interface development cost and time (e.g., changing the supplier, optimizing the design process, implementing on site improvement, implementing process standardization, and coordinating man-machine cooperation) and ② weakening the relationship strength between interfaces and other components in the module. The decrease in the relationship strength between components in the module can reduce the value of node strength in the dependence index, and then affect the value of dependence.

6.3. Reduce the Relationship Strength between Interfaces

According to Equations (11) and (14), the design change cross-module propagation path length and the correlation between modules are directly proportional to the relationship strength (ri,j) between interfaces. Besides, in research [2], the reduction of the relationship strength between interfaces was proposed as a strategy to reduce coupling, therefore, the change in cross-module impact can be effectively controlled by reducing ri,j. Since the relationship strength between components is quantified based on functional and structural connections, two measures can be taken to reduce the strength. ① Function. As the functional relationship is quantified from the aspect of material, energy, and information, the relationship becomes stronger while more types of relationships are included between the two components/interfaces. Once the relationship strength between interface s is high due to the over-close functional relationship, the replacement of components with lower relationship strength to the interface can be considered as a way to fine-tune the module structure, to reduce the module correlation, and the change cross-module propagation impact. ② Structural. The structure is commonly used to represent the fusion, connection, and assembly relationship among components, and the tightness of the structural correlation relationship among components is determined by the stability of their connection. The evaluation criteria of the structural correlation strengths are illustrated in Table 1. Consequently, the relationship strength can be weakened through transforming physical connection mode in the premise of meeting the requirements of product structure connection, i.e., switching the hard-to-disassemble and fixed connection mode to a standardized and loose one when the correlation strength is too high due to over-close structural correlation (for example, welding change to bolted fastening).

6.4. Reduce the Change Propagation Probability

Based on the assessment process of the change propagation impact, the propagation impact correlates with the change propagation probability. According to Equation (16) and research [67], the cross-module change propagation impact can be reduced by reasonably reducing the change propagation probability. The change propagation probability is proportional to association strength according to Equation (15); two strategies can be used to control the high cross-module propagation impact caused by high propagation probability: ① decrease the association strength between interfaces based on strategy 3 and ② decrease the change propagation probability by enhancing the strength of association between other components connected to the change interfaces.

6.5. Reduce the Number of Interfaces

According to Equations(11) and (14), the change cross-module propagation impact is related to ( r i , j × d n , j ) that is proportional to the number of interfaces. Even if the importance of each interface, the change cost, and path length are small, once the number of interfaces is too large, the propagation impact will increase and, therefore, the number of interface can be reduced by adjusting the modular product structure to control the propagation impact [42,68,69].

6.6. Reduce the Importance of Interfaces in the Product Network

The greater importance of interfaces in the network, that is, the higher the PageRank value, the greater the change propagation impact caused by interfaces according to the change propagation impact assessment process. Based on the principle of PageRank, ① a node with a large in-degree has higher importance; meanwhile, ② the PageRank value of the upstream node is also positively correlated with importance. It can be reconsidered that determining the appropriate interface in case of the importance of an interface is high. For example, as Figure 8 shows (nodes with red color represent initial change nodes, and that with grey is the propagated node), assuming w1 = 0.53, w2 = 0.21, w3 = 0.26, in Scheme 1 T M 2 + C M 2 = 1.91, R12 = 0.475, the change cross-module propagation impact is 0.331. Node 9 is not suitable to be used as an interface because of its high importance; as a result, node 9 is divided into M1 on the premise of not damaging the product relationship, and node 3 and 10 serve as interfaces to form Scheme 2. In Scheme 2, T M 2 + C M 2 = 0.96, R12 = 0.161, and the cross-module propagation impact is reduced to 0.266. To sum up and according to research [2], the change propagation impact can be decreased by reducing the importance of interfaces in the product network.

7. Case Analysis

7.1. Data Processing

A four-wheel sanitation vehicle is a typical complex mechanical product, involving many kinds of components, and the relationship between the components is complex. Due to the increase of market demand and customer requirements, the redesign of the four-wheel sanitation vehicle is inevitable. In order to reduce the design difficulty and product change complexity, the modular strategy is adopted in four-wheel sanitation vehicle, which meets the applicable conditions of the proposed method in this paper. The cab is an important part of the four-wheel sanitation vehicle, the rationality of its design is related to the driver’s health and work efficiency, and it has a direct impact on the vehicle’s mobility and safety. According to the investigate and survey, the cab is easily affected by customer demand and technological development, such as a more comfortable cab space environment, more sensitive braking performance, and so on, which leads to the need to redesign the cab to achieve customer satisfaction. Therefore, this section describes the modular scheme of a certain type of sanitation vehicle cab as an example, analyzing the correlation of modules and verifying the rationality of the proposed control strategy. The cab is composed of 62 components and divided into 7 modules. The cab is shown in Figure 9, the overall cab is shown in Figure 9a, and module division is shown in 
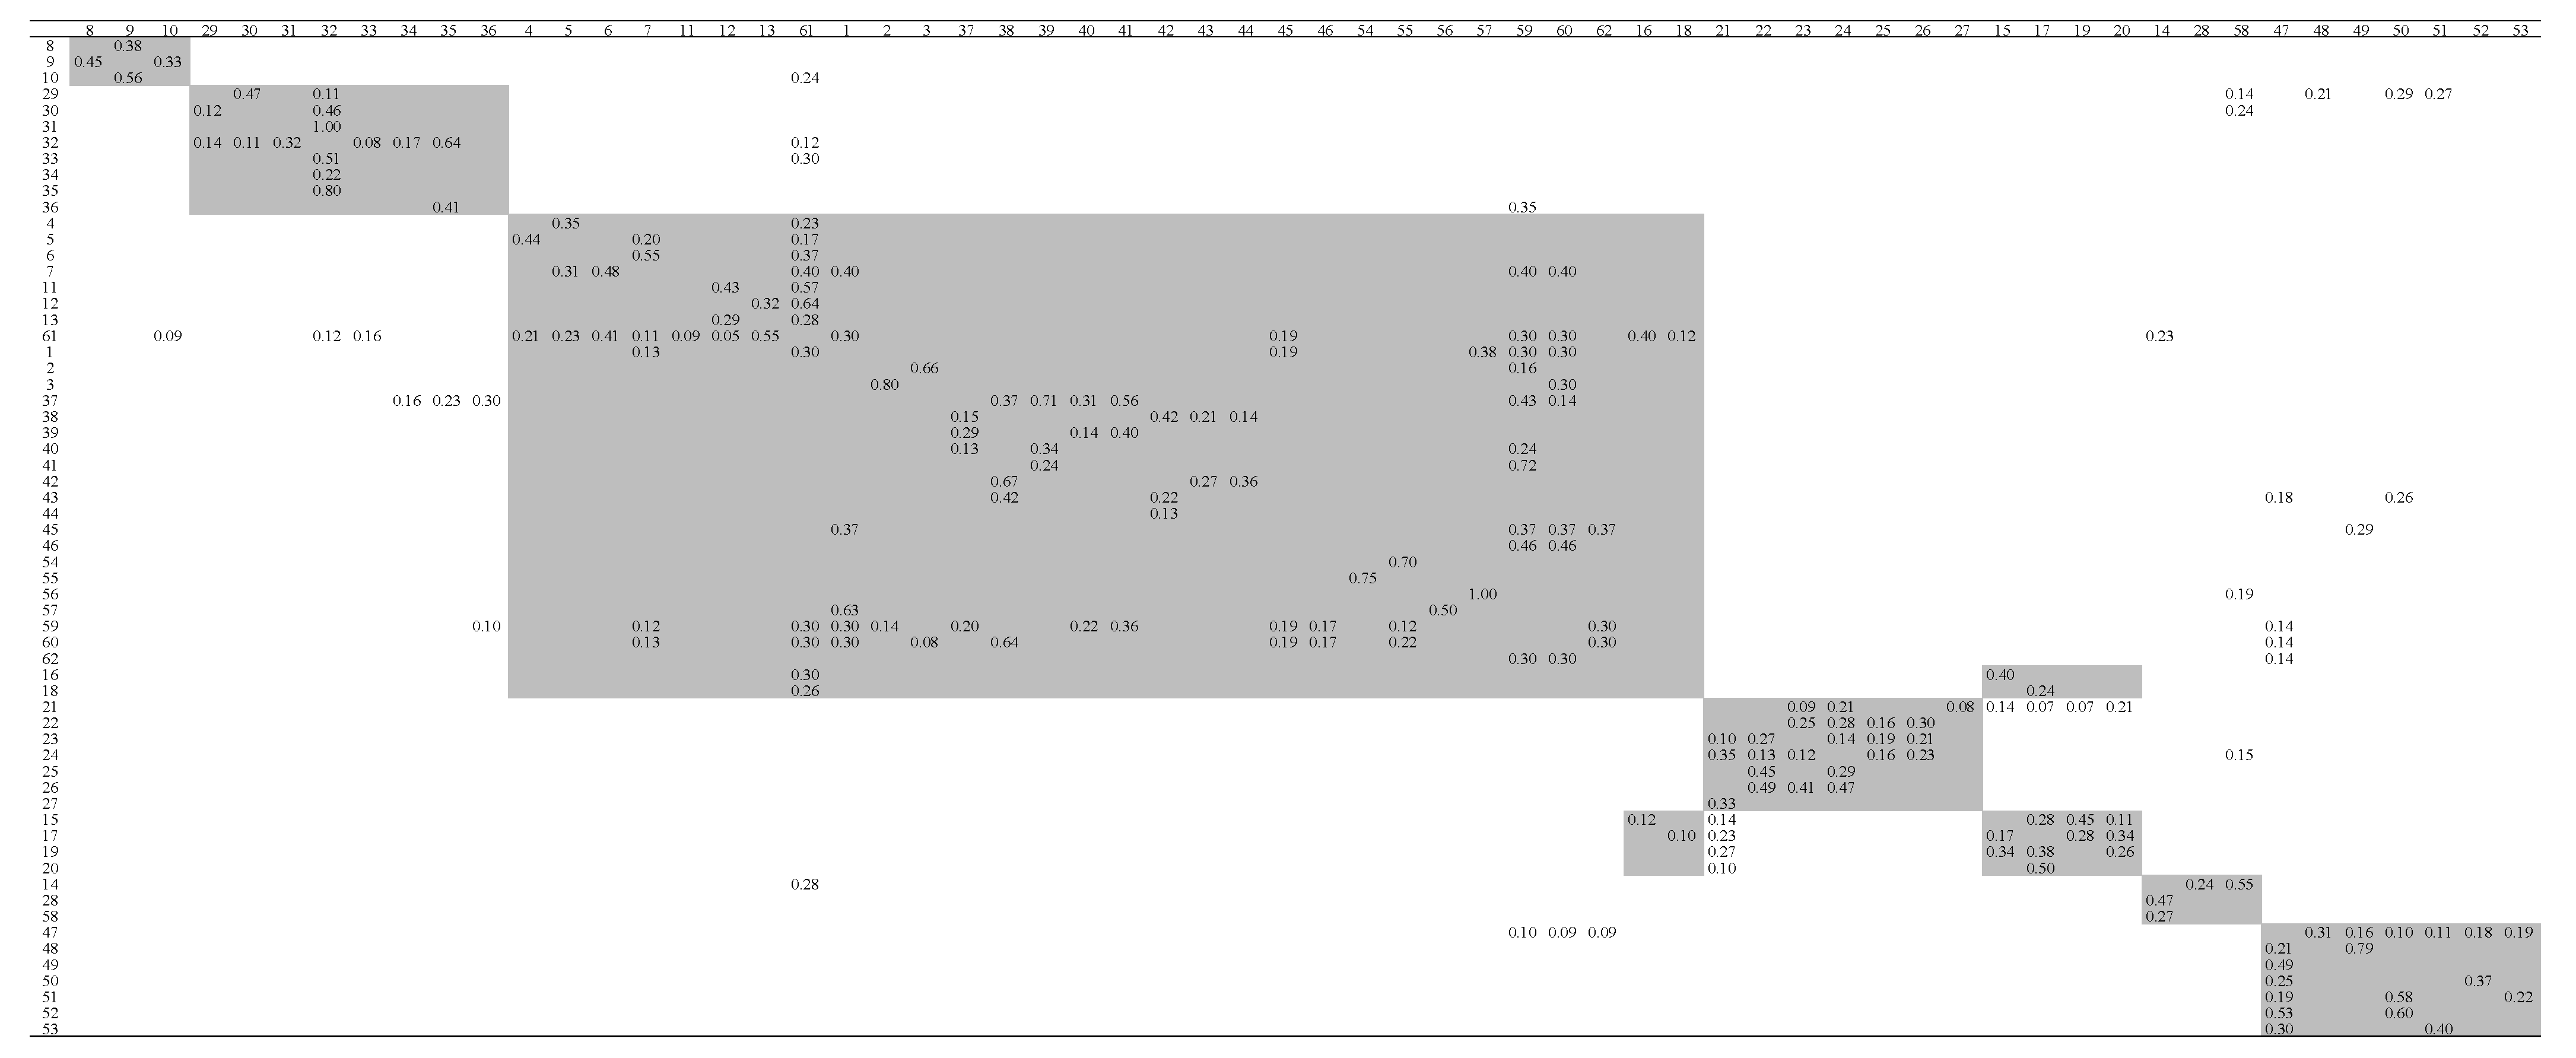
Figure 9b. The strength of the relationship between components is shown in Figure 10. The module names and their divisions are shown in Table 3, and the relationship of the whole product is shown in Figure 11. In Figure 11, nodes of the same module are represented by the same shape, and the grey is interfaces.
As shown in Figure 10, the first row and the first column represent the component numbers, the values between components represent the correlation strength. The higher the correlation strength, the closer the relationship between components, indicating that the change propagation is more likely to occur. The gray area in Figure 10 indicates the correlation strength within the same module.
According to Equations (5)–(8), the betweenness, node strength, change propagation index, and cost proportion of each node are calculated as shown in Table 4. To keep dimensional consistency, the four indexes were normalized in each module, and the weight of each index was calculated by the information entropy weight method. Since the total cost and relationship networks of modules are different, the weights of the four indexes in different modules are different. The specific weight and dependence of the module on components are shown in 
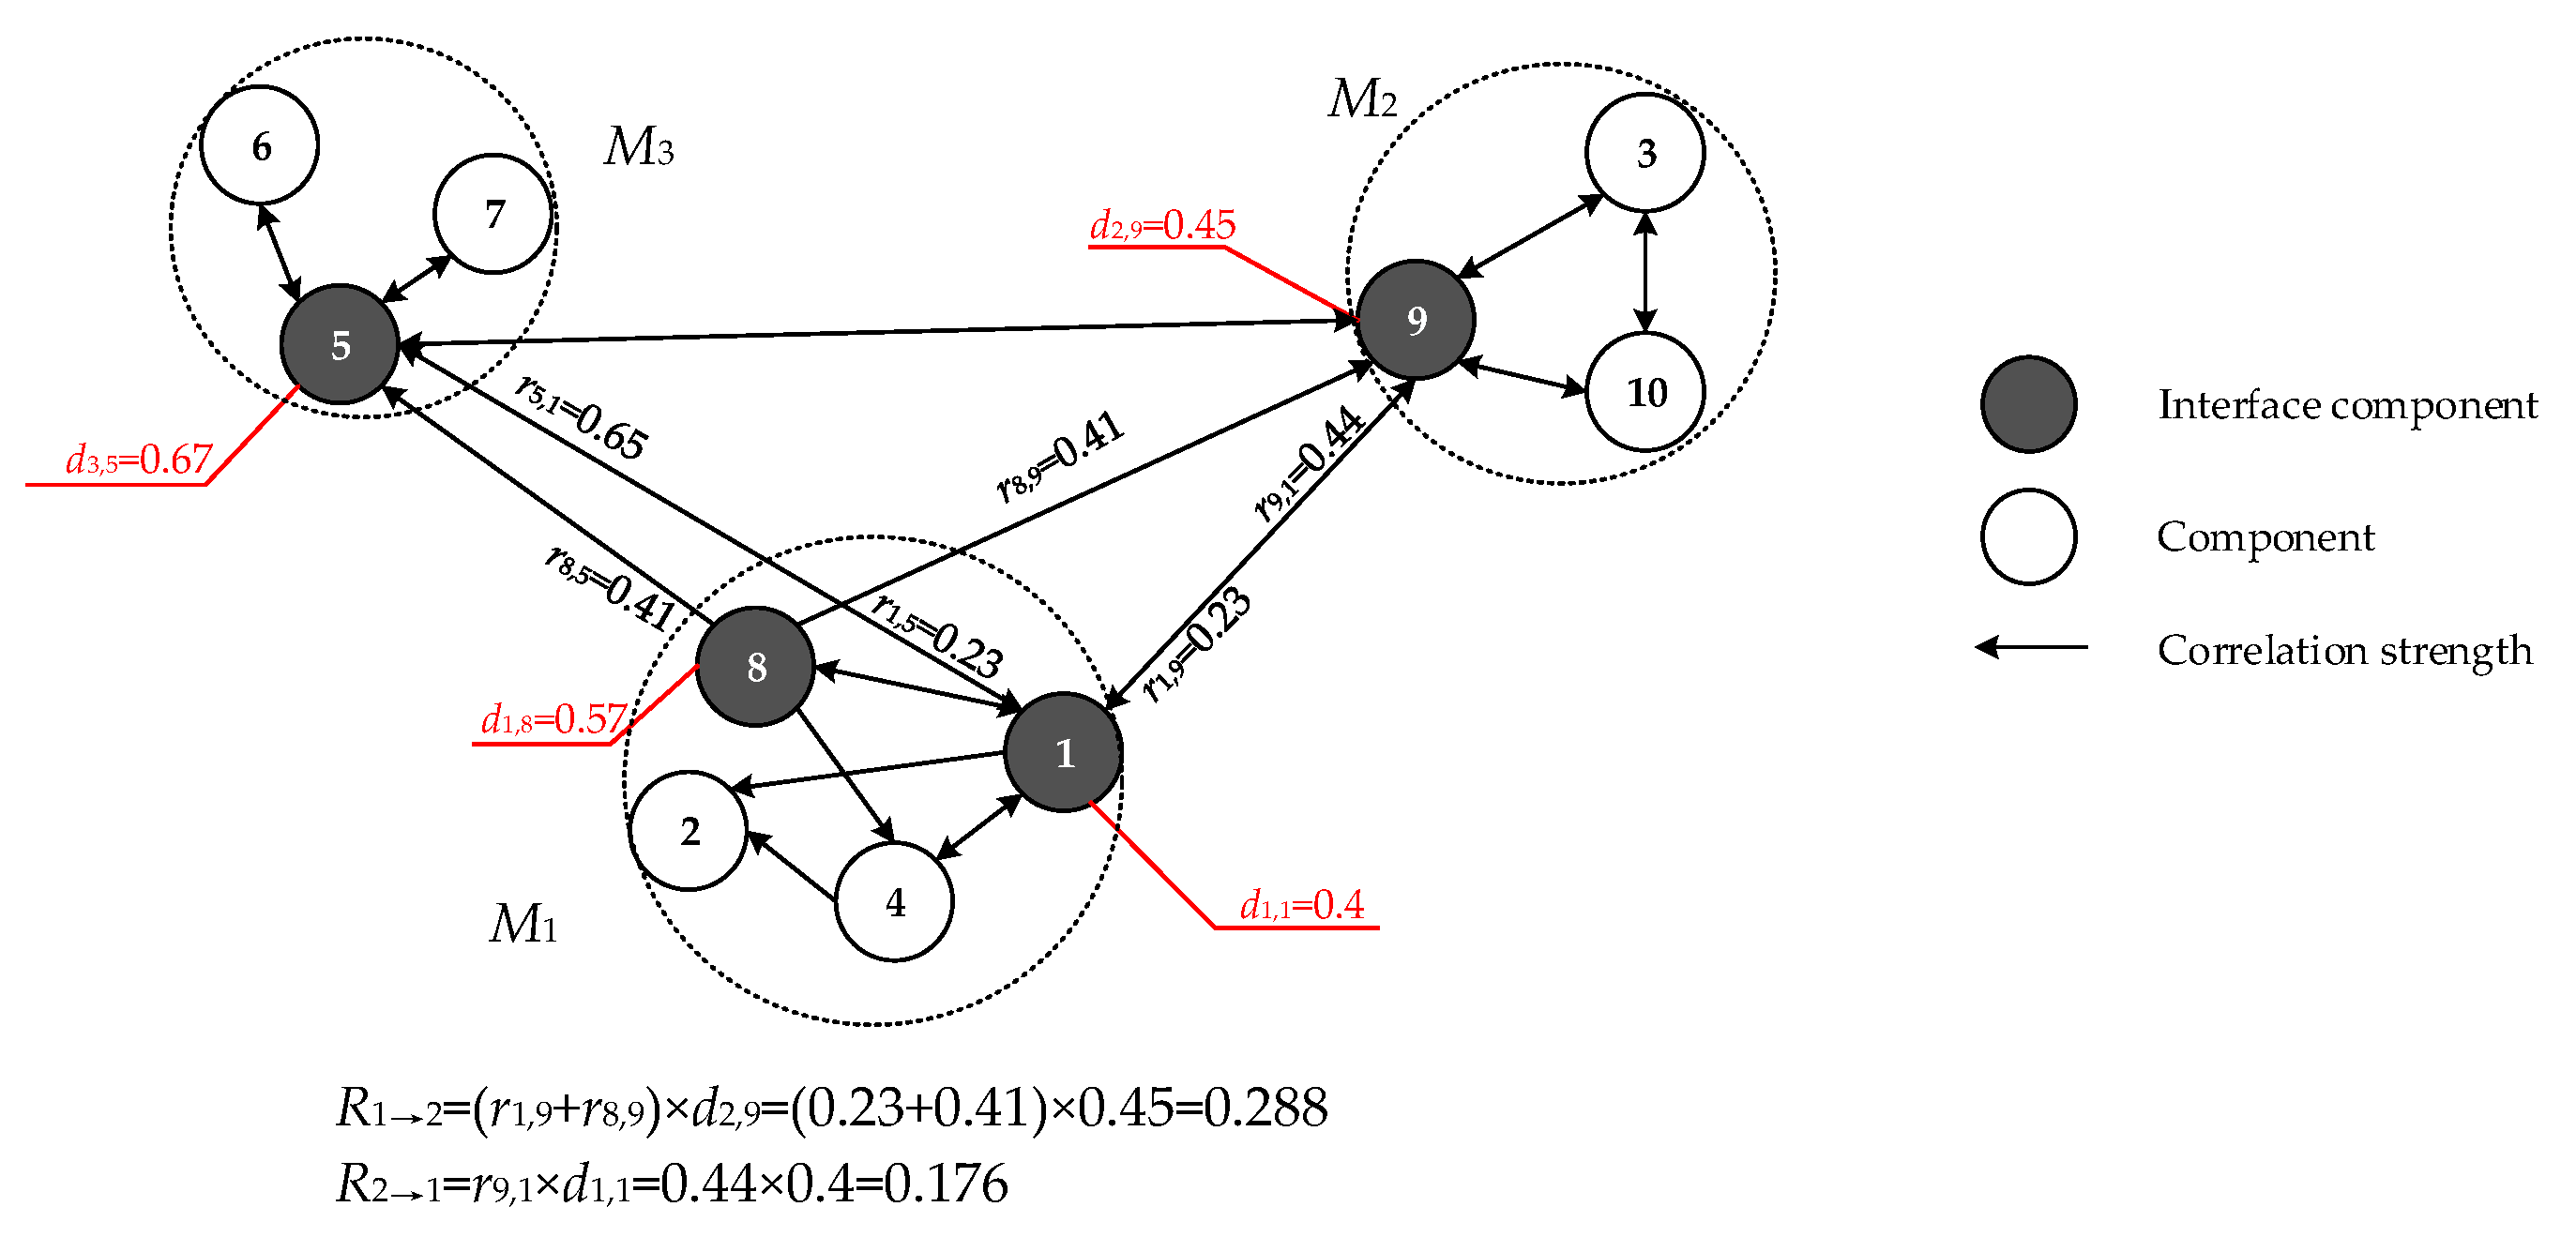
Table 5. According to Equation (11), correlations of modules of the sanitation vehicle cab are shown in Table 6.
According to Equation (15) and historical data, the change propagation probability and change impact probability among components are shown in Figure 12 and Figure 13. As shown in Figure 12 and Figure 13, the first row and the first column represent the component numbers, the values between components represent the change propagation probability and change propagation impact probability, respectively. The larger the change propagation probability, the greater the probability of change propagation; the larger the probability of change transmission, the higher the probability of adjacent parts being propagated; the larger the change propagation impact probability, the higher the probability of the propagated components needing to be changed. Meanwhile, the gray area in Figure 12 and Figure 13 indicates the change propagation probability and change propagation impact probability within the same module.
The development time and cost of each component were obtained by mining the enterprise database, and the importance of the node was obtained according to the PageRank algorithm, as shown in Table 7.
Based on the analytic hierarchy process, the weights of three indexes, the importance of node, change propagation cost and path length, are w1 = 0.27, w2 = 0.64, and 
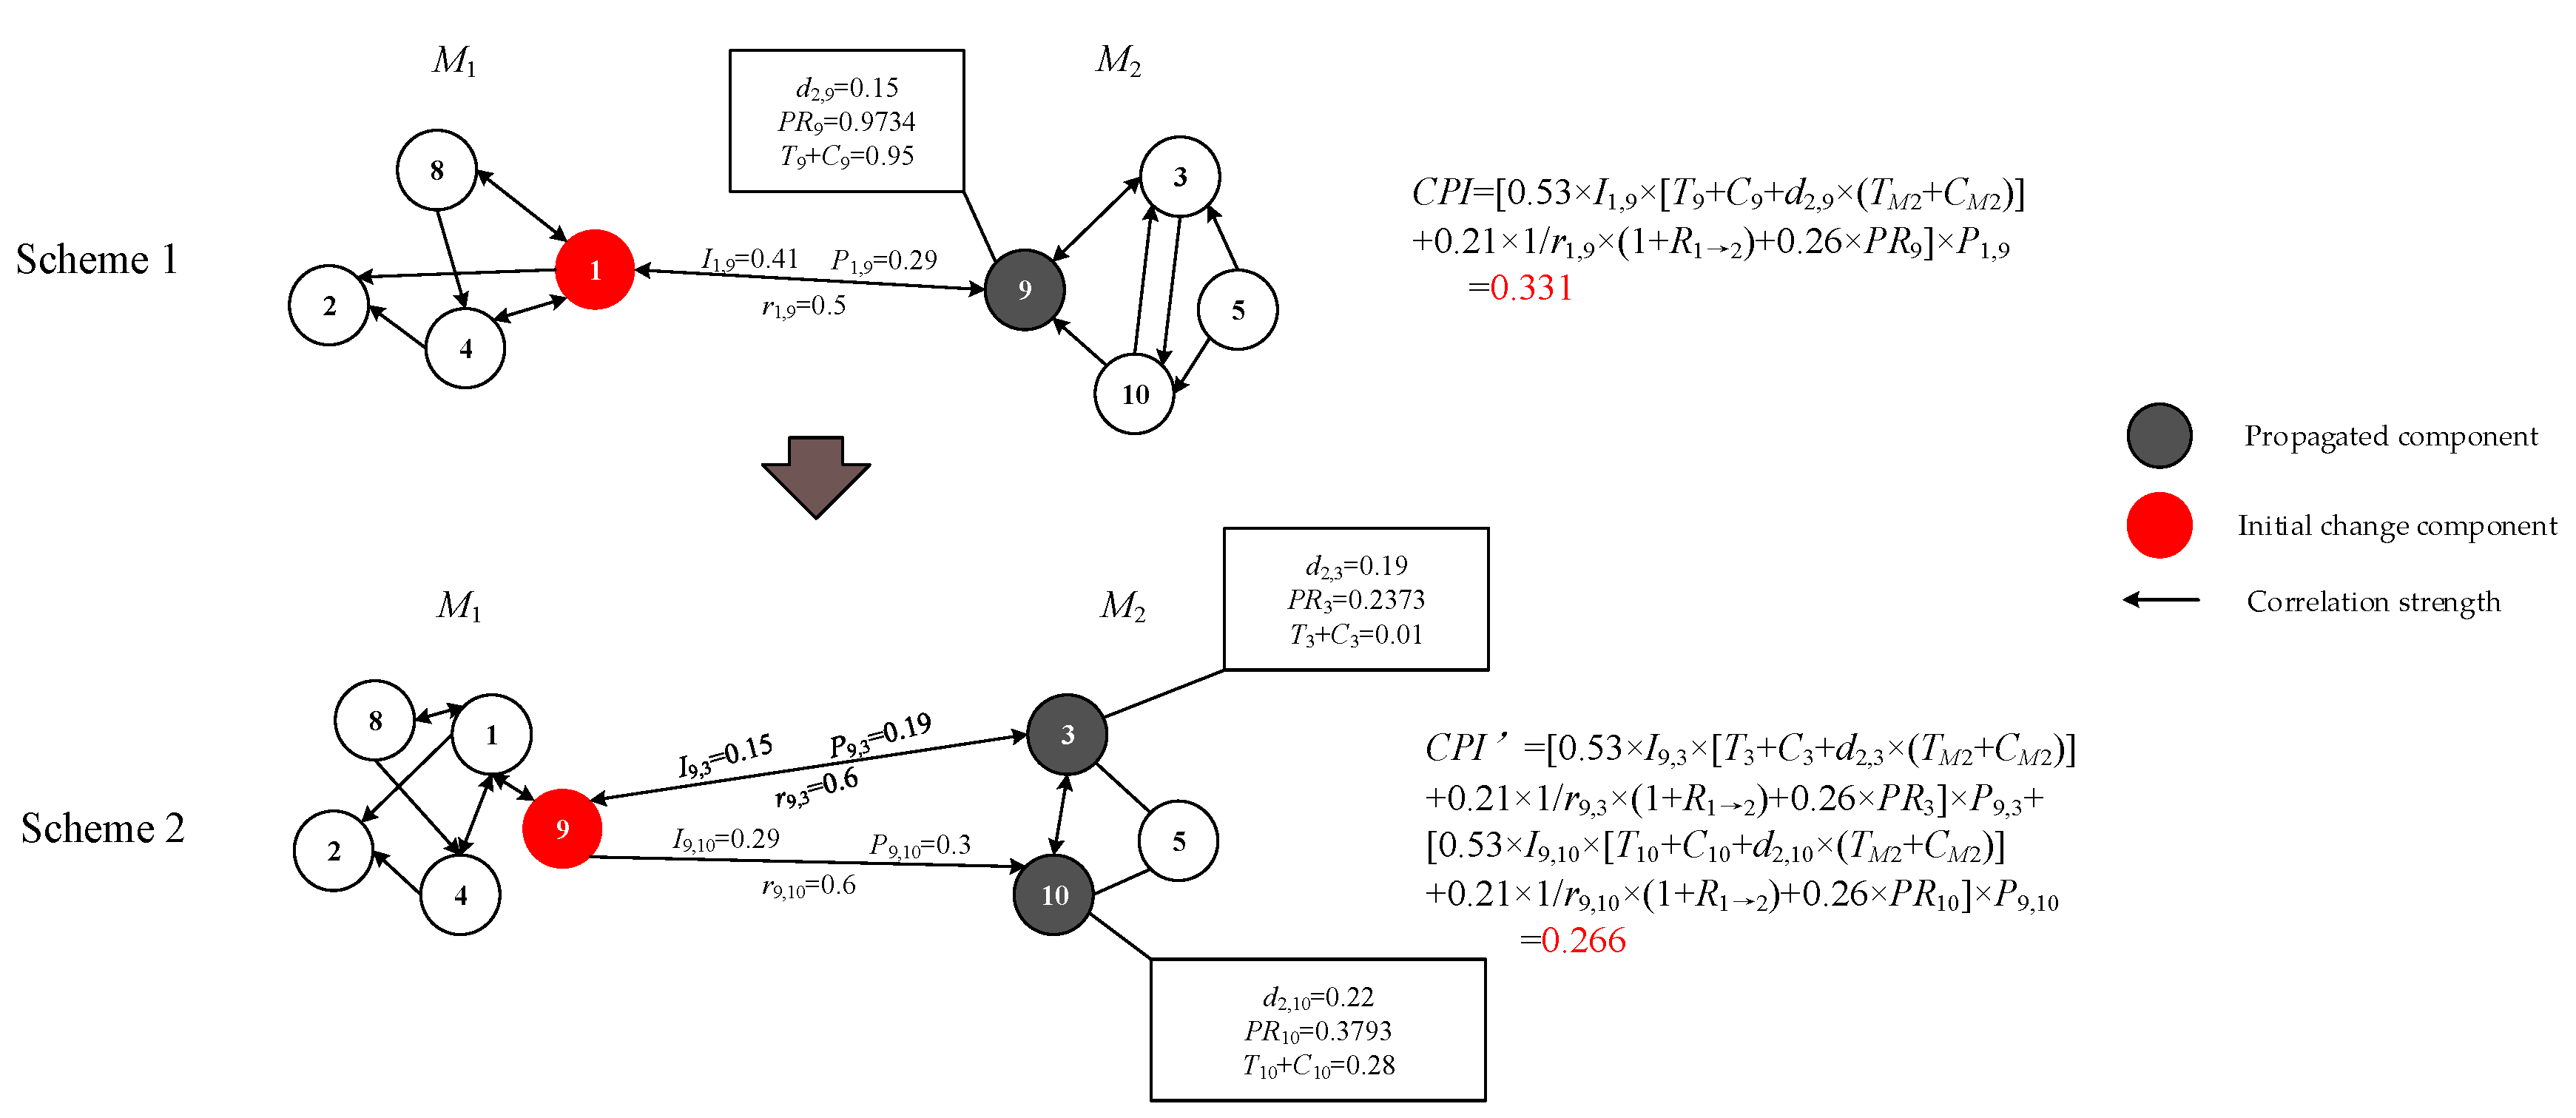
w3 = 0.09, respectively. The change cross-module propagation impact among different modules of the product is calculated according to Equation (16), as shown in Table 8 (gray indicates the change propagation impact that needs to be reduced), and the total design change cross-module propagation impact is 7.44.

7.2. Control of Change Cross-Module Propagation

As shown in Table 8, the module whose change propagation impact exceeds the average value (0.5) is optimized according to the propagation impact control strategy to reduce the impact.
1.
M1→M3, M2→M3, M6→M3
The propagation paths and design parameters of M1M3, M2M3, and M6M3 are shown in Table 9 (gray indicates design parameters that need to be optimized). As can be seen from the table: ① the development time and cost of module 3 are high, ② the dependence of module 3 on node 61 (rear weldment) is high, ③ the correlation of M2M3 is high, ④ the change propagation impact probabilities between node 36 (lower shaft dust jacket) and node 59 (left weldment) and between node 33 (steering wheel controller) and node 61 (rear weldment) are high, and ⑤ the change propagation probability between node 14 (instrument panel) and node 61 (rear weldment) is high.
Problem ① was caused by two factors, the first being that too many components were included in module 3, the other being that the development cost and time of component 6 (cab pedal: T6 + C6 = 1.40), 11 (shock-absorbing leather strap: T11 + C11 = 1.45), 12 (seat: T12 + C12 = 1.96), 18 (vacuum pump support: T18 + C18 = 1.06), 37 (door assembly 1: T37 + C37 = 1.01), and 38 (door assembly 2: T38 + C38 = 1.01) are high. Consequently, the cost can be reduced, and the development time can be shortened by changing the supplier, optimizing the design process, and implementing on-site improvement. Aiming at problem ②, the physical connection mode was improved (change the welding mode to adhesive connection and thread connection) to reduce the node strength of node 61 in the module (r61,5 = 0.57→0.34, r61,6 = 0.28→0.19), thus reducing the dependence of module 3 on node 61 and 59 (d3,61 = 0.62→0.58, d3,59 = 0.55→0.52). Simultaneously, the correlation between modules was decreased (0.2465→0.2327), which means the problem ③ was solved. In terms of problem ④, the tolerance of design parameters between the lower shaft dust jacket and the left weldment and between the steering wheel controller and the rear weldment can be increased according to strategy 1, sequentially, to reduce the propagation impact probabilities (I33,61 = 0.30→0.21, I36,59 = 0.35→0.27). Given problem ⑤, the way connection is unable to improve on account of the connection relationship between the instrument desk and welding pieces, which is a bolt connection. Therefore, the stickup connection between the instrument desk (node 14) and instrument (node 58) for bolt connection can be improved to increase the connection strength according to strategy 4, thereby reducing change propagation probability between 14–61. In conclusion, the change propagation impact after optimization is reduced to 6.58, a decrease of 0.86 (11.6%). The cross-module change propagation impact is shown in Table 10 (gray indicates the change propagation impact that needs to be reduced).
In addition to the above control strategies, the change cross-module propagation impact can be reduced by the module scheme being redistricted according to strategies 5 and 6, reducing the number of components in module 3, and replacing the existing interfaces 59 and 61 with interfaces of lower importance.
2.
M3→M5
The propagation path and design parameters of M3M5 are shown in Table 11 (gray indicates design parameters that need to be optimized). The relations between node 16 (vacuum booster motor support) and node 15 (vacuum booster motor), and between node 18 (vacuum pump support) and node 17 (vacuum pump) are close. However, the correlation strength between 16–61 and 18–61 in the module is only 0.13, which is significantly lower than that between nodes 15 and 18. Therefore, node 16 (vacuum booster motor support) and node 18 (vacuum pump support) can be divided into module 5 (brake assist module), in line with the principle of functional division. After the change, the total cross-module propagation impact is 6.15, down 0.43 (6.5%).
3.
M5→M4
As shown in Table 12 (gray indicates design parameters that need to be optimized), the development cost and time of node 21 are high, at the same time the correlation between modules is high because of a strong association between interfaces. To reduce the change cross-module propagation impact, first, the development cost and time can be decreased by supplier management (development time: 3.2→2.6, development cost: 420→335T21 + C21 = 1.09→0.84). Second, the strong connections between interfaces—screw connections, bolt connections, and welding—can be optimized into weak connections such as elastic deformation connections and lock connections to reduce the association strength according to strategy 3, thereby reducing module correlation and change propagation probability. After the change, the total product cross-module propagation impact is 5.85, a decrease of 0.3 (4.9%).
Furthermore, since paths between M5 and M4 are bidirectional, which leads to the number of the relationships between interfaces being large and the strength of that being large, the change cross-module propagation impact can be reduced by merging modules.
In summary, the change propagation effect of the cross-module decreases from 7.44 to 5.85 and shows a decrease of 21.4% through the improvement of product structure and component attributes. The optimization effect of each module is summarized in Table 13, and the design change cross-module propagation impact of the optimized product is shown in Table 14.

7.3. Result Analysis

In order to verify the effectiveness of the method mentioned above, the multi-population genetic algorithm in literature [41] is adopted in this paper to search for the optimal propagation path of the scheme before and after the implementation of the strategy (node 21 as the initial change node). The search results are shown in Table 15. According to the CPI of the optimal path, the propagation plan after the implementation of strategies is better, and the capital cost and time of the actual change are reduced to a certain extent. By comparing the optimal paths in Table 5, it can be seen that the optimal change propagation scheme of existing products can be found only through the design change propagation routing, which can help enterprises make better decisions about the product design change scheme, but it cannot optimize and improve the factors that negatively affect the change propagation impact in product modularization. For example, the excessive number of interfaces leads to the increase of the possibility of cross-module. According to the change propagation impact control strategy based on modular structure and component attributes proposed in the paper, the structure of modular products and attributes of interfaces can be reasonably optimized to control the change propagation integration impact, and better design change decisions can be made by combining relevant path optimization methods. Therefore, the implementation of propagation control strategy for modular products has a certain guiding significance in reality. In fact, it is inevitable to spend cost and time during the implementation of change propagation control strategies [70]. However, there will be a balance between the cost caused by design change propagation control and the reduced change propagation impact, which is indeed a research hotspot, the difficulty of which and has been studied and discussed in [70,71]. Therefore, the tradeoff between the cost of implementing the control strategies and changes in CPI is not explored in this paper.

8. Conclusions

With the increase in product complexity, modular strategy is becoming increasingly popular in the engineering design field. Meanwhile, design changes are inevitable due to the evolution of requirements and technological advances. Although modular products possess high cohesion within modules and low coupling between modules, completely independent modules are almost nonexistent in the actual design processes. The design change is likely to be propagated between modules because of the existence of interfaces, which lead to increased design costs and product development cycles.
In order to control the design change propagation in as few modules as possible to reduce the impact of the change propagation, the design change cross-module propagation impact is analyzed and evaluated based on three indexes: the importance of the node, the change propagation cost, and the propagation path length in the study. Six control strategies were introduced: ① increase the tolerance of interfaces to improve the module adaptability, ② decrease the dependence of the module on the interface, ③ reduce the strength of association between interfaces, ④ decrease the change propagation probability, ⑤ decrease the number of interfaces, and ⑥ reduce the importance of the interface in the product component network. These strategies provide a new research idea for product modular design. The cab of a sanitation vehicle, as an example, demonstrates the process of assessing the impact of the change cross-module propagation. The design change propagation path (in-module and cross-module propagation path) in the modular product will be identified and optimized in the future.

Author Contributions

Conceptualization, H.R. and Y.L.; methodology, H.R., Y.L. and T.L.; data curation, Y.N.; writing—original draft preparation, T.L. and J.Z. All authors have read and agreed to the published version of the manuscript.

Funding

This research was funded by the National Natural Science Foundation of China: 51505480, 72001203.

Institutional Review Board Statement

Not applicable.

Informed Consent Statement

Not applicable.

Data Availability Statement

Not applicable.

Conflicts of Interest

The authors declare no conflict of interest.

References

  1. Ip, C.N.; Dill, D.L. Better verification through symmetry. Form. Methods Syst. Des. 1996, 9, 41–75. [Google Scholar] [CrossRef]
  2. Cheng, X.; Wan, C.; Wan, L. Association Analysis between Modules and Decoupling Strategies in Modular Product Design. Comput. Integr. Manuf. Syst. 2020, 26, 1043–1051. [Google Scholar] [CrossRef]
  3. Martin, M.V.; Ishii, K. Design for variety: Developing standardized and modularized product platform architectures. Res. Eng. Des. 2002, 13, 213–235. [Google Scholar] [CrossRef]
  4. Suh, E.S.; De Weck, O.L.; Chang, D. Flexible product platforms: Framework and case study. Res. Eng. Des. 2007, 18, 67–89. [Google Scholar] [CrossRef]
  5. Lee, H.; Seol, H.; Sung, N.; Hong, Y.S.; Park, Y. An analytic network process approach to measuring design change impacts in modular products. J. Eng. Des. 2010, 21, 75–91. [Google Scholar] [CrossRef]
  6. Clarkson, P.J.; Simons, C.; Eckert, C. Predicting Change Propagation in Complex Design. J. Mech. Des. 2004, 126, 788–797. [Google Scholar] [CrossRef] [Green Version]
  7. Reddi, K.R.; Moon, Y.B. Simulation of new product development and engineering changes. Ind. Manag. Data Syst. 2012, 112, 520–540. [Google Scholar] [CrossRef]
  8. Wang, J.; Wei, F. Analysis and Evaluation of the Impacts on Engineering Change. Ind. Eng. 2006, 9, 32–35. [Google Scholar]
  9. Gumus, B.; Ertas, A.; Tate, D.; Cicek, I. The Transdisciplinary Product Development Lifecycle model. J. Eng. Des. 2008, 19, 185–200. [Google Scholar] [CrossRef]
  10. Li, Y.; Zhao, W.; Shao, X. A process simulation based method for scheduling product design change propagation. Adv. Eng. Inform. 2012, 26, 529–538. [Google Scholar] [CrossRef]
  11. Li, Y.; Zhao, W.; Ma, Y. A shortest path method for sequential change propagations in complex engineering design processes. Artif. Intell. Eng. Des. Anal. Manuf. 2015, 30, 107–121. [Google Scholar] [CrossRef]
  12. Li, M.; Sheng, J.; Li, Y.; Qi, W. Multi-Objective Path Optimization for Design Change Propagation on Complex Product. Mach. Des. Manuf. 2020, 6, 294–297. [Google Scholar] [CrossRef]
  13. Wang, H.; Sun, B.; Wang, J.; Wei, X. Methods Supporting Product Modularization Process Design for Mass Customization. Comput. Integr. Manuf. Syst. 2004, 1171–1176. [Google Scholar] [CrossRef]
  14. Li, C. Introduction to Standardization, 5th ed.; China Renmin University Press: Beijing, China, 2010. [Google Scholar]
  15. Liu, Y. Research on Complex Product Systems. Sci. Sci. Manag. S. & T. 2005, 26, 125–129. [Google Scholar] [CrossRef]
  16. Huang, C. Overview of Modular Product Development. Proc. Natl. Sci. Counc. Repub. China Part A Phys. Sci. Eng. 2000, 24, 149–165. [Google Scholar]
  17. Bazigos, M.N.; Burke, W.W. Theory Orientations of Organization Development (OD) Practitioners. Group Organ. Manag. 1997, 22, 384–408. [Google Scholar] [CrossRef]
  18. Kornberger, M.; Clegg, S. The Architecture of Complexity. Cult. Organ. 2003, 9, 75–91. [Google Scholar] [CrossRef] [Green Version]
  19. Ulrich, K. The role of product architecture in the manufacturing firm. Res. Policy 1995, 24, 419–440. [Google Scholar] [CrossRef] [Green Version]
  20. Eppinger, S.D. Model-based Approaches to Managing Concurrent Engineering. J. Eng. Des. 1991, 2, 283–290. [Google Scholar] [CrossRef]
  21. Eppinger, S.D. A Planning Method for Integration of Large-Scale Engineering Systems. In Proceedings of the International Conference on Engineering Design, Tampere, Finland, 19–21 August 1997; pp. 199–204. [Google Scholar]
  22. Otto, K.N.; Wood, K.L. Product Design: Techniques in Reverse Engineering and New Product Design; Stanford University: Stanford, CA, USA, 2001. [Google Scholar]
  23. Simpson, T.W. Product Platform Design and Customization: Status and Promise. Artif. Intell. Eng. Des. Anal. Manuf. 2004, 18, 3–20. [Google Scholar] [CrossRef] [Green Version]
  24. Lai, X. Design Structure Matrix-Based Product Representation for Life-Cycle Process-Based Modularity; Michigan Technological University: Houghton, MI, USA, 2008. [Google Scholar]
  25. Lai, X.; Gershenson, J.K. Representation of similarity and dependency for assembly modularity. Int. J. Adv. Manuf. Technol. 2007, 37, 803–827. [Google Scholar] [CrossRef]
  26. Suh, N.P. The Principles of Design; Oxford University Press: New York, NY, USA, 1990. [Google Scholar]
  27. Brun, A.; Zorzini, M. Evaluation of product customization strategies through modularization and postponement. Int. J. Prod. Econ. 2009, 120, 205–220. [Google Scholar] [CrossRef]
  28. Cohen, T.; Navathe, S.; Fulton, R. C-FAR, change favorable representation. Comput. Des. 2000, 32, 321–338. [Google Scholar] [CrossRef]
  29. Mikkola, J.; Gassmann, O. Managing modularity of product architectures: Toward an integrated theory. IEEE Trans. Eng. Manag. 2003, 50, 204–218. [Google Scholar] [CrossRef]
  30. Gokpinar, B.; Hopp, W.J.; Iravani, S.M. The Impact of Misalignment of Organizational Structure and Product Architecture on Quality in Complex Product Development. Manag. Sci. 2010, 56, 468–484. [Google Scholar] [CrossRef] [Green Version]
  31. Poortinga, H.C. From Business Opportunity to Cost Target. AACE Int. Trans. 1999, 7, 13. [Google Scholar]
  32. Tang, D. Analysis of Engineering Change Impacts Based on Design Structure Matrix. Chin. J. Mech. Eng. 2010, 46, 154–161. [Google Scholar] [CrossRef]
  33. Cheng, H.; Chu, X. A network-based assessment approach for change impacts on complex product. J. Intell. Manuf. 2010, 23, 1419–1431. [Google Scholar] [CrossRef]
  34. Li, W.; Moon, Y.B. Modeling and managing Engineering Changes in a complex product development process. Int. J. Adv. Manuf. Technol. 2012, 63, 863–874. [Google Scholar] [CrossRef] [Green Version]
  35. Yu, G.; Yang, Y.; Zhang, X.; Li, C. Network-Based Analysis of Requirement Change in Customized Complex Product Development. Int. J. Inf. Technol. Decis. Mak. 2017, 16, 1125–1149. [Google Scholar] [CrossRef]
  36. Li, Y.; Wang, X.; Li, X. Design Change Impact Assessment for Complex Product Based Complex Networks Propagation Dynamics. Comput. Integr. Manuf. Syst. 2017, 23, 1429–1438. [Google Scholar] [CrossRef]
  37. Ma, S.; Jiang, Z.; Liu, W. Evaluation of a design property network-based change propagation routing approach for mechanical product development. Adv. Eng. Inform. 2016, 30, 633–642. [Google Scholar] [CrossRef]
  38. Li, Y.; Lin, P. Parallel Change Propagation Model of Complex Product. Comput. Integr. Manuf. Syst. 2017, 23, 737–743. [Google Scholar] [CrossRef]
  39. Yupeng, L.; Mengze, L.; Zhaotong, W. Multi-source Design Change Propagation Path Optimization for Complex Product Based on Weighted and Directed Network Model. Chin. J. Mech. Eng. 2019, 55, 213–222. [Google Scholar] [CrossRef]
  40. Li, C.; Zhang, Z.; Cao, C.; Zhang, F. Multi-Objective Optimization of Design Change Propagation Paths in Complex Product. Comput. Integr. Manuf. Syst. 2021, 27, 842–856. [Google Scholar] [CrossRef]
  41. Ren, H.; Li, T.; Li, Y.; Huan, J. Multi-source design change propagation path optimisation based on the multi-view complex network model. J. Eng. Des. 2020, 32, 28–60. [Google Scholar] [CrossRef]
  42. Li, S.; Chen, L. Identification of Clusters and Interfaces for Supporting the Implementation of Change Requests. IEEE Trans. Eng. Manag. 2014, 61, 323–335. [Google Scholar] [CrossRef]
  43. Xiao, R.; Ku, Q.; Cao, P. Coupling Function Planning & Practical Example Based on Immune Clustering Recognition Approach. Comput. Integr. Manuf. Syst. 2006, 12, 1421–1430. [Google Scholar] [CrossRef]
  44. Chen, Y.; Teng, H. Comprehensive Dependency Matrix for Heterogeneous Modular Combination Coupling Analysis. Chin. J. Mech. Eng. 2012, 48, 21–28. [Google Scholar] [CrossRef]
  45. Yu, Y.-W.; Deng, Y.-M.; Lu, W.F.; Nee, A. Analysis of mechanical systems with adaptable functions for the evaluation of functional coupling and component importance. Int. J. Adv. Manuf. Technol. 2014, 76, 1449–1458. [Google Scholar] [CrossRef]
  46. Song, L.; Ji, Y.; Qi, G.; Gu, X. Evaluation Method for Evolution Control of Complex Modular Product Family. Comput. Integr. Manuf. Syst. 2012, 18, 2131–2137. [Google Scholar] [CrossRef]
  47. Choi, D.; Hwang, W. A Suggestion and a Contribution for the Improvement of Axiomatic Design. Trans. Korean Soc. Mech. Eng. A 2004, 28, 970–976. [Google Scholar] [CrossRef] [Green Version]
  48. Yu, J.; Cha, J.; Lu, Y.; Zhuang, Y. A remote CAE collaborative design system for complex product based on design resource unit. Int. J. Adv. Manuf. Technol. 2011, 53, 855–866. [Google Scholar] [CrossRef]
  49. Koh, E.C.; Caldwell, N.H.; Clarkson, P.J. A technique to assess the changeability of complex engineering systems. J. Eng. Des. 2013, 24, 477–498. [Google Scholar] [CrossRef]
  50. Hamraz, B.; Caldwell, N.H.M.; Ridgman, T.W.; Clarkson, P.J. FBS Linkage ontology and technique to support engineering change management. Res. Eng. Des. 2014, 26, 3–35. [Google Scholar] [CrossRef]
  51. Li, Y.; Wang, Z.; Zhang, L.; Chu, X.; Xue, D. Function Module Partition for Complex Products and Systems Based on Weighted and Directed Complex Networks. J. Mech. Des. 2016, 139, 021101. [Google Scholar] [CrossRef]
  52. Demoly, F.; Monticolo, D.; Eynard, B.; Rivest, L.; Gomes, S. Multiple viewpoint modelling framework enabling integrated product–process design. Int. J. Interact. Des. Manuf. 2010, 4, 269–280. [Google Scholar] [CrossRef]
  53. Li, Y.; Chu, X.; Chu, D.; Liu, Q. An integrated module partition approach for complex products and systems based on weighted complex networks. Int. J. Prod. Res. 2013, 52, 4608–4622. [Google Scholar] [CrossRef]
  54. Tang, L.; Lu, Y. Study of the grey Verhulst model based on the weighted least square method. Phys. A Stat. Mech. Its Appl. 2019, 545, 123615. [Google Scholar] [CrossRef]
  55. Barrat, A.; Barthelemy, M.; Pastor-Satorras, R.; Vespignani, A. The architecture of complex weighted networks. Proc. Natl. Acad. Sci. USA 2004, 101, 3747–3752. [Google Scholar] [CrossRef] [Green Version]
  56. Boccaletti, S.; Latora, V.; Moreno, Y.; Chavez, M.; Hwang, D.-U. Complex networks: Structure and dynamics. Phys. Rep. 2006, 424, 175–308. [Google Scholar] [CrossRef]
  57. Giffin, M.; De Weck, O.; Bounova, G.; Keller, R.; Eckert, C.; Clarkson, P.J. Change Propagation Analysis in Complex Technical Systems. J. Mech. Des. 2009, 131, 081001. [Google Scholar] [CrossRef] [Green Version]
  58. Li, X.; Wang, K.; Liu, L.; Xin, J.; Yang, H.; Gao, C. Application of the Entropy Weight and TOPSIS Method in Safety Evaluation of Coal Mines. Procedia Eng. 2011, 26, 2085–2091. [Google Scholar] [CrossRef] [Green Version]
  59. Uckun, S.; Mackey, R.; Do, M.; Zhou, R.; Huang, E.; Shah, J.J. Measures of product design adaptability for changing requirements. Artif. Intell. Eng. Des. Anal. Manuf. 2014, 28, 353–368. [Google Scholar] [CrossRef]
  60. Safaei, F.; Yeganloo, H.; Akbar, R. Robustness on topology reconfiguration of complex networks: An entropic approach. Math. Comput. Simul. 2019, 170, 379–409. [Google Scholar] [CrossRef]
  61. Brin, S.; Page, L. The Anatomy of a Large Scale Hypertextual Web Search Engine. Comput. Netw. ISDN Syst. 1998, 30, 107–117. [Google Scholar] [CrossRef]
  62. Zhang, K.; Li, P.; Zhu, B.; Hu, M. Evaluation Method for Node Importance in Directed-Weighted Complex Networks Based on PageRank. J. Nanjing Univ. Aeronaut. Astronaut. 2013, 45, 429–433. [Google Scholar] [CrossRef]
  63. Brin, S.; Page, L. Reprint of: The anatomy of a large-scale hypertextual web search engine. Comput. Networks 2012, 56, 3825–3833. [Google Scholar] [CrossRef]
  64. Zheng, Y.; Yang, Y.; Zhang, N.; Jiao, Y. Analysis Model for Impact of Change on Complex Product Design Tasks Based on In-Degree Evolving Rules. Comput. Integr. Manuf. Syst. 2017, 23, 1423–1428. [Google Scholar] [CrossRef]
  65. Saaty, T.L. The Analytic Hierarchy Process; McGraw-Hill: New York, NY, USA, 1980. [Google Scholar]
  66. Pahl, G.; Beitz, W.; Feldhusen, J.A.; Grote, K.H. Engineering Design: A Systematic Approach; Institution of Engineering and Technology (IET): Aachen, Germany, 1963. [Google Scholar]
  67. Li, Y.; Ni, Y.; Zhang, N.; Liu, Z. Modularization for the complex product considering the design change requirements. Res. Eng. Des. 2021, 32, 507–522. [Google Scholar] [CrossRef]
  68. Krause, D.; Beckmann, G.; Eilmus, S.; Gebhardt, N.; Jonas, H.; Rettberg, R. Integrated Development of Modular Product Families: A Methods Toolkit. In Advances in Product Family and Product Platform Design; Springer: New York, NY, USA, 2013; pp. 245–269. [Google Scholar] [CrossRef]
  69. Salvador, F. Toward a Product System Modularity Construct: Literature Review and Reconceptualization. IEEE Trans. Eng. Manag. 2007, 54, 219–240. [Google Scholar] [CrossRef]
  70. Watson, J.D.; Allen, J.D.; Mattson, C.A.; Ferguson, S.M. Optimization of excess system capability for increased evolvability. Struct. Multidiscip. Optim. 2016, 53, 1277–1294. [Google Scholar] [CrossRef]
  71. Eckert, C.; Isaksson, O.; Earl, C. Design margins: A hidden issue in industry. Des. Sci. 2019, 5, E9. [Google Scholar] [CrossRef] [Green Version]
Figure 1. Design change propagation control process.
Symmetry 14 00368 g001
Figure 2. Direction merge rules for the edges in the comprehensive networks.
Symmetry 14 00368 g002
Figure 3. Relationship between components of Brake module.
Symmetry 14 00368 g003
Figure 4. Calculation process of correlation between modules.
Symmetry 14 00368 g004
Figure 5. Calculation of the change propagation cost.
Symmetry 14 00368 g005
Figure 6. Change propagation probability calculation process.
Symmetry 14 00368 g006
Figure 7. Influence of design tolerances on change propagation costs.
Symmetry 14 00368 g007
Figure 8. Control strategy for importance of interfaces.
Symmetry 14 00368 g008
Figure 9. Cab of a sanitation vehicle.
Symmetry 14 00368 g009
Figure 10. Strength of relationship between components.
Symmetry 14 00368 g010
Figure 11. Network of relationship between components.
Symmetry 14 00368 g011
Figure 12. Change propagation probability matrix.
Symmetry 14 00368 g012
Figure 13. Change propagation impact probability matrix.
Symmetry 14 00368 g013
Table 1. Evaluation criteria for the strength of the structural connection.
Connection StrengthValueType of Connection
Strong1Non-transmittable connections: welding, sealing.
Medium0.6Active connection: shafting, bolts.
Weak0.2Easily separable connections: keyway, chute.
None0No connection
Table 2. Path length between nodes.
Node21222324252627
21 4.501.33 1.40
22 6.761.531.941.81
234.501.53 1.902.272.09
241.606.766.76 13.5127.03
25 13.51 1.73
26 2.3527.032.41
276.76
Table 3. Numbers and names of modules.
No.NameComponent Number
M1Hand brake module8, 9, 10
M2Veer module29, 30, 31, 32, 33, 34, 35, 36
M3Cab weldment module1, 2, 3, 4, 5, 6, 7, 11, 12, 13, 16,
18, 37, 38, 39, 40, 41, 42, 43, 44, 45,
46, 54, 55, 56, 57, 59, 60, 61, 62
M4Brake module21, 22, 23, 24, 25, 26, 27
M5Brake assist module15, 17, 19, 20
M6Instrument panel module14, 28, 58
M7Before the face of module47, 48, 49, 50, 51, 52, 53
Table 4. Dependence of modules on interfaces (excerpt).
ModuleNode1/BetweennessNode StrengthChange Propagation IndexCost Proportion
M1101.500.950.330.60
M2294.001.270.000.13
304.001.190.000.12
321.123.850.000.17
334.000.800.000.21
364.000.470.000.09
M31612.500.380.000.04
1812.500.380.000.05
4512.501.850.000.01
592.787.200.000.02
602.786.410.000.02
612.249.220.000.03
626.582.980.000.01
Table 5. Weights of indexes and the dependence of modules on interfaces.
ModuleNodeω1ω2ω3ω4DependenceModuleNodeω1ω2ω3ω4Dependence
M1100.350.110.530.100.35M4210.210.170.030.590.38
M2290.010.240.670.080.10M5150.180.010.670.140.21
300.09170.02
320.30190.15
330.11200.32
360.02M6140.000.110.570.310.14
M3160.020.320.580.070.25580.35
180.27M7470.030.320.180.460.58
450.37480.68
590.12490.12
600.52510.44
610.62
620.40
Table 6. Matrix of correlation between modules.
M1M2M3M4M5M6M7
M1 0.0932
M2 0.2465 0.09070.2959
M30.09660.0713 0.11420.03760.2189
M4 0.42530.0454
M5 0.13550.8349
M6 0.1615
M7 0.1991
Table 7. Development cost and time and importance of component (excerpt).
NodeDevelopment Time (day)Development Cost (RMB)Importance
12.50500.004.0840
22.50230.000.3854
32.50230.000.3854
41.0080.000.3717
52.50400.000.5296
64.50420.000.3717
71.50350.000.5296
81.00120.000.4986
91.60180.000.6473
104.00450.000.4967
113.50670.000.2216
124.50900.000.5004
132.00200.000.4343
143.50190.001.0207
153.50690.000.6691
Table 8. Design change cross-module propagation impact.
M1M2M3M4M5M6M7
M1 0.62
M2 1.32 0.290.47
M30.030.06 0.950.040.35
M4 0.320.12
M5 0.190.92
M6 1.30
M7 0.46
Table 9. Design parameter of M1M3, M2M3, M6M3.
ImportanceIi,jTj + Cj T M n   +   C M n dn,jRi→jri,jPi,j
10–611.8290.240.5019.400.620.08770.150.20
32–611.8290.120.5019.400.620.24650.190.11
33–611.8290.300.5019.400.620.24650.110.14
36–591.5350.350.3919.400.550.24650.110.23
14–611.8290.280.5019.400.620.15200.260.41
Table 10. Improved design change cross-module propagation.
M1M2M3M4M5M6M7
M1 0.54
M2 1.11 0.290.47
M30.030.06 0.950.040.35
M4 0.320.12
M5 0.180.92
M6 0.76
M7 0.43
Table 11. Design parameter of M3M5.
ImportanceIi,jTj + Cj T M n   +   C M n dn,jRi→jri,jPi,j
16–150.50500.401.484.020.210.11420.510.73
18–170.60580.240.104.020.020.11420.510.73
Table 12. Design parameter of M5M4.
ImportanceIi,jTj + Cj T M n   +   C M n dn,jRi→jri,jPi,j
15–210.8290.141.095.870.380.83490.570.26
17–210.8290.231.095.870.380.83490.570.23
19–210.8290.271.095.870.380.83490.320.17
20–210.8290.11.095.870.380.83490.720.40
Table 13. Control strategy summary.
ModuleStrategy NumberSpecific MeasuresChange Cross-Module Propagation Impact
M1M3(2)Reduce the total development cost and time of changing modules;7.44→6.58↓11.6%
M2M3(1)(2)(3)Increase design tolerance between interfaces;
Reduce the total development cost and time of changing modules;
Change the physical connection mode;
M6M3(2)(3)(4)Reduce the total development cost and time of changing modules;
Change the physical connection mode;
M3M5(3)(4)Optimize module division scheme;6.58→6.15↓6.5%
M5M4(2)(4)Reduce interface development cost;
Change the physical connection mode.
6.15→5.85↓4.9%
Table 14. Optimized change cross-module propagation impact.
M1M2M3M4M5M6M7M8M9
M1 0.51
M2 1.09 0.290.47
M30.030.07 0.050.050.350.030.07
M4 0.260.12
M5 0.850.63
M6 0.66
M7 0.43
M8 0.51
M9 1.09 0.290.47
Table 15. Optimal design change propagation path.
No.Change Propagation PathCPIDevelopment Cost (RMB)Development Time (day)
115-21-20-17-18-611.0432225.0015
2 *15-21-19-21-170.9471905.0013.4
Note: * represents the change propagation path after the implementation of the control strategies.
Publisher’s Note: MDPI stays neutral with regard to jurisdictional claims in published maps and institutional affiliations.

