Article

A Fault Diagnosis Method of Rolling Bearing Based on Wavelet Packet Analysis and Deep Forest

School of Mines, China University of Mining and Technology, Xuzhou 221000, China
*
Author to whom correspondence should be addressed.
Symmetry 2022, 14(2), 267; https://doi.org/10.3390/sym14020267
Submission received: 31 October 2021 / Revised: 20 December 2021 / Accepted: 8 January 2022 / Published: 29 January 2022
(This article belongs to the Special Issue Symmetry in Industrial Engineering)

Abstract

:
The frequent accidents caused by the main fan motor in coal mines have exposed the safety hazards of rolling bearings. When a rolling bearing fails, its symmetry is broken, resulting in a rapid decline in its safety performance and posing a great threat to the main fan. Therefore, accurate rolling bearing fault diagnoses are the key to ensuring the safe and durable operation of main fans. Thus, in this paper, we propose a new fault diagnosis method of rolling bearing based on wavelet packet analysis and deep forest algorithm. Firstly, experiments were conducted under different health states to guarantee the diversity of data relating to the rolling bearing’s main fan and then to ensure the accuracy of the fault diagnosis under different health states. On the basis of the collected vibration signal data, we conducted the wavelet packet analysis method to extract the characteristics of the vibration signal and obtained a feature vector that characterizes the health of the bearing. After that, the extracted feature vector was used as the feature vector of the deep forest algorithm to train the deep forest diagnosis model and determine the location and fault type of the bearing fault. Finally, the proposed method in this paper was validated with real-time monitoring data of a main ventilation fan and compared with other diagnostic algorithms, which not only verified the diagnostic capability of deep forest in handling small samples, but also verified the diagnostic capability of the fault diagnosis model. In summary, the proposed fault diagnosis approach is promising in real coal mine main fans.

1. Introduction

The rolling bearing is the core component of the coal mine main fan system, and its health exerts a key impact on the operation of the main fan. The main fan of the coal mine has a harsh working environment, a long service period, and complex working conditions. It is extremely prone to failures of the inner ring, outer ring, cage, and rolling elements of the rolling bearing at the drive end. The difficulty in fault diagnosis of rolling bearings is that the non-stationary vibration signals collected by the acceleration sensor have non-linear and time-varying characteristics. The use of ordinary methods to extract the characteristics of the vibration signal has a low fault recognition rate. The vibration signal data belong to the small sample data type, and the unbalanced problem is difficult to overcome. Therefore, seeking an effective feature extraction for non-stationary vibration signals and a fault diagnosis machine learning method suitable for small training samples is of great significance to the fault diagnosis of the rolling bearing of the coal mine main fan [1].
Affected by external and internal factors, the main fan of coal mine had different types of failures during operation. The failures caused by horizontal vibration and vertical vibration of the rolling bearing at the drive end account for more than 70% [2]. Moreover, the data of the vibration signal of the rolling bearing at the drive end are highly obtainable, and it is easy to arrange the sensor. Therefore, the vibration signal is selected as the feature vector that characterizes the health of the rolling bearing. Traditional main fan vibration signal analysis and processing mostly conduct Fourier transform analysis methods, wavelet analysis, and other methods, which cannot accurately reflect the non-stationary and short duration of the current vibration signal. It can only decompose low-frequency signals and cannot deal with high-frequency signals. The signal is decomposed [3]. Wavelet packet analysis is a good signal time-frequency analysis method, having obtained fruitful application results in two fields of signal analysis and image processing [4]. Wavelet packet analysis can overcome the shortcomings of traditional methods, extract the characteristics of the vibration signal, make the vibration signal pass through a series of filters with different center frequencies but the same broadband, and decompose the vibration signal in a more detailed time-domain plane. At the same time, this method can improve the resolution of the high frequency part of the vibration signal [5]. In recent years, wavelet packet analysis has been widely used in the field of fault diagnosis for aviation equipment, wind turbines, and power units. Many researchers have combined wavelet packet analysis with diagnostic networks such as support vector machines, bat generalized regression neural networks, and high-order cumulative to achieve fault diagnosis of rolling bearings, analog circuits, refrigerators, and other forms of mechanical equipment [6,7,8,9].
In the field of intelligent diagnosis, neural networks require a large number of typical fault samples to train models, making most neural network models limited in the engineering application process of fault diagnosis. The deep forest algorithm can overcome the problems of the high cost of fault sample labeling and difficulty in fault data collection, finishing efficient fault diagnosis under small training samples [10]. At the same time, neural networks rely on the choice of hyper-parameters, and parameter tuning is mostly manually selected [11,12]. The fault diagnosis method based on the deep forest algorithm is an efficient machine learning diagnosis method that uses random forest as the base feature extractor, applies guided aggregation strategy to learn the data, and uses k-fold cross-validation to refine the cascade forest layer expansion and validation, which can reduce the influence of hyper parameters on the model [13,14]. At present, the deep forest algorithm is widely used in the field of time series data and image processing data analysis, having achieved fruitful application results [15]. The deep forest algorithm can be used to process real-time monitoring data and historical data of environmental weather, as well as to realize online fault diagnosis of photovoltaic modules [16]. At the same time, the deep forest algorithm can be used to extract multi-level amplitude features and multi-level dense scale-invariant feature transformation features, amplitude features, and realize fault recognition in multi-feature mode [17,18,19]. In addition, some scholars used machine learning methods to improve the deep forest model, solving the problems of the long characteristics of single-sample data of mechanical equipment vibration signals and the high cost of deep forest model data processing, and realized the fault diagnosis of mechanical equipment under small training samples [20]. The bearing vibration signal data samples of coal mine main fans cover a large number of sample points, mostly 1000–4000 data points. Deep learning algorithms have defects in processing such data, and it is often difficult to achieve accurate diagnosis due to large computational complexity and imperfect feature learning system [21]. Therefore, in order for the fault diagnosis of the main fan bearing of the coal mine to be completed, it is necessary to find a way to improve the deep forest algorithm.
Aiming at the shortcomings of the intelligent fault diagnosis method described in this article, combined with the advantages of wavelet packet analysis in feature extraction, we propose a fault diagnosis method for the rolling bearing of coal mine main fan based on wavelet packet analysis and deep forest algorithm. Firstly, we collected the vibration signals of the rolling bearing at the drive end of the main fan with different spectrum information, and then we applied the wavelet packet analysis feature extraction method to decompose the vibration signals and obtain the effective feature parameters that characterize the fault state. After that, the effective feature parameters extracted by the wavelet packet feature were used as the input of the deep forest algorithm, and the diagnosis model based on the wavelet packet and the deep forest algorithm was trained. Finally, the validity of the fault diagnosis method for the rolling bearing of the driving end of the coal mine main fan under the condition of small training samples was verified.

2. Background

2.1. The Introduction of Deep Forest Algorithm Theory

The multi-granularity cascade deep forest algorithm is an ensemble algorithm based on random forest classifiers that can be used for classification learning of small sample data. The deep forest algorithm is mainly implemented through two steps: cascading forest structure construction and multi-granularity scanning.

2.1.1. Deep Forest Cascade Forest Structure

Deep forest mainly stacks multi-layer random forests by cascading, which requires less training data to obtain better classification performance, and this process does not require too much adjustment of the hyper parameter. The cascading forest structure of the deep forest is composed of N-layer random forests. The input feature is a multi-dimensional feature vector, and the output feature is each decision tree, with the output result being an N-type vector. Each layer has a combination of different types of random forests. The cascading forest structure shown in Figure 1 selects two random forest structures, namely, random forest and complete random forest. Among them, each completely random forest includes 500 trees, and each node randomly selects a feature as the judgment condition. According to this discriminant condition, the child nodes are generated. When each child node contains only the same type of vector, the characterization learning is stopped. Each random forest also includes 500 trees, and the node features are selected randomly, with the number of selected features D being the number of input feature vectors. The random forest nodes are divided by the condition of the maximum feature of the Gini coefficient.
As shown in Figure 2, taking three types of vectors as an example, we show the generation process of three types of vectors.
The figure shows the vector generation process flow of one of the three classification problems, wherein the triangle is the x-type vector. Input the x-type vector into the random forest, and each decision tree in each layer can calculate the occurrence probability of each type of feature vector. Then, by averaging the probabilities generated by all decision trees, the probability of occurrence corresponding to each type of vector output by the random forest can be obtained.

2.1.2. Deep Forest Multi-Grain Scanning Structure

Deep forest multi-granularity scanning is mainly used to enhance the feature representation capability of the deep forest by different sampling windows. We took three types of vectors as an example, as shown in Figure 3.

2.1.3. The Construction Process of Deep Forest Model

On the basis of the random forest algorithm and the related theoretical knowledge of the deep forest, the construction process of the deep forest algorithm can be obtained. Taking three types of vectors as an example, we show the construction process in Figure 4.
The first step in implementing the deep forest algorithm is multi-granularity scanning that preprocesses the original features. Firstly, the original input features are preprocessed using multi-grain scanning, and the original 400-dimensional sequence feature vectors are processed using 100-dimensional, 200-dimensional, and 300-dimensional sliding windows, which can yield 301 three-class vectors, 201 three-class vectors, and 101 three-class vectors, respectively. Then, these three class vectors are input into random forest A1, completely random forest A2, random forest B1, completely random forest B2, random forest C1, and completely random forest C2, which leads to finally obtaining 1806-dimensional, 1206-dimensional, and 303-dimensional feature vectors, respectively.
The second step is to construct a cascading forest structure and train the feature vector output by the first step. Firstly, the 1806-dimensional feature vectors obtained from the 100-dimensional sliding window are input into the first cascade forest for training, and then the 12-dimensional class distribution vectors are obtained. Then, the 12-dimensional class distribution vector is spliced with the original 100-dimensional sliding window to obtain the 1818-dimensional feature vector as the input data of the second layer. Subsequently, the cascade forest training result of the second layer is spliced with the feature vector obtained from the 200-dimensional sliding window to obtain the input data of the third layer of the cascade forest. Then, the class distribution vector obtained from the training of the cascade forest of the third layer is spliced with the feature vector obtained from the 300-dimensional sliding window, and the input of the next layer can be obtained. This training process is looped all the time, and the training is stopped when the ideal classification result is obtained. Finally, the distribution probability of each class vector is obtained by averaging the class vector results of each level and taking the maximum for it to obtain the final output prediction result.

2.2. Wavelet Packet Feature Extraction Method

2.2.1. Basic Principles of Wavelet Packet Decomposition

Firstly, the definition of wavelet packet is clarified. For the filter coefficients hn and gn, the following equation is satisfied [22]:
g n = ( 1 ) n h 1 n
For the orthogonal scale function ϕ ( t ) and wavelet function φ ( t ) , the two-scale relationship is satisfied as shown in Equation (2).
{ ϕ ( t ) = 2 k h ( k ) ϕ ( 2 t k ) φ ( t ) = 2 k g ( k ) ϕ ( 2 t k )
In order to better represent the wavelet packet function, the symbols μ 0 ( t ) = ϕ ( t ) and μ 1 ( t ) = φ ( t ) are adopted. Under a fixed scale, μ 0 , μ 1 , h and g can be defined as a set of functions called wavelet packets. The high-pass filter and the low-pass filter together form a wavelet filter, and the recurrence relationship is shown in Equation (3).
{ μ 2 n ( t ) = 2 k h ( k ) μ n ( 2 t k ) μ 2 n + 1 ( t ) = 2 k g ( k ) μ n ( 2 t k )
In the equation, n is the number of layers of decomposition. With the help of the wavelet filter, the nth frequency band of the upper layer can be decomposed, and then one obtains the next layer of μ 2 n , μ 2 n + 1 sub-channel vibration signal.

2.2.2. Wavelet Packet Decomposition and Reconstruction Algorithm

The wavelet packet analysis method can realize the decomposition of both the low-frequency part of the signal and the high-frequency part. The decomposition process is neither redundant nor sparse, which enables efficient time-frequency localization analysis of signals containing a large amount of medium- and high-frequency information. The signal is decomposed by wavelet packet to generate 2n to sub-channel signals, and the decomposition structure of the three-layer wavelet packet decomposition, for example, is shown in Figure 5.
After the original vibration signal is collected, the wavelet packet decomposition is applied to obtain the high-frequency part and the low-frequency part. Then, the second layer is decomposed again, and the decomposition at this time is not only completed for the low-frequency part, but the semi-decomposition of both the low-frequency and high-frequency parts is performed simultaneously. Each wavelet decomposition gets two sequences, and the decomposition relationship can be expressed by Equation (4).
S = S S S + d S S + S d S + d d S + S S d + d S d + S d d + d d d
The wavelet packet transform is mainly used to expand the signal over the wavelet packet function and solve the inner product of the vibration signal and the wavelet packet function. The wavelet packet transform can make the original vibration signal similar to the wavelet packet function. The wavelet coefficients are the coefficients of the wavelet packet function similar to the original vibration signal. The reconstruction process of wavelet packet satisfies Equation (5).
μ 2 n ( t ) = 2 k [ h ( k ) μ n ( k 2 t ) + g ( k ) μ n ( k 2 t ) ]

2.2.3. Wavelet Packet Energy Feature Extraction

Wavelet packet energy feature extraction is a key step in the wavelet analysis method. In the wavelet packet energy spectrum, E n , m is usually used to represent the energy of the nth layer of the mth sub-band μ n , m . The node number increases sequentially from low to high frequencies, starting from zero, which can be expressed as shown in Equation (6).
E n , m = k = 1 N μ n , m 2
where m satisfies the set { m | m = 0 , 1 , , 2 n 1 } and n is the length of the original vibration signal. In order for the effect of the relative value of energy size to be eliminated, the energy of each sub-band extracted by the wavelet packet energy feature is normalized. The energy feature vector composed of the energy of all sub-bands can be expressed as shown in Equation (7).
E = [ E n , 0 , E n , 1 , , E n , m , , E n , 2 i 1 ]
With the energy of each sub-band known, it can be solved to obtain the sum of the energy of each sub-band. The expression for the sum of energy obtained by solving can be expressed as shown in Equation (8).
E 1 = E n , 0 + E n , 1 + + E n , m + + E n , 2 i 1
The normalized energy eigenvector is denoted by equation, which is the percentage of the total energy accounted for by the normalized wavelet packet energy in each sub-band. The expression of equation is shown in Equation (9).
E q = E 1 E = [ E n , 0 E , E n , 1 E , , E n , m E ]

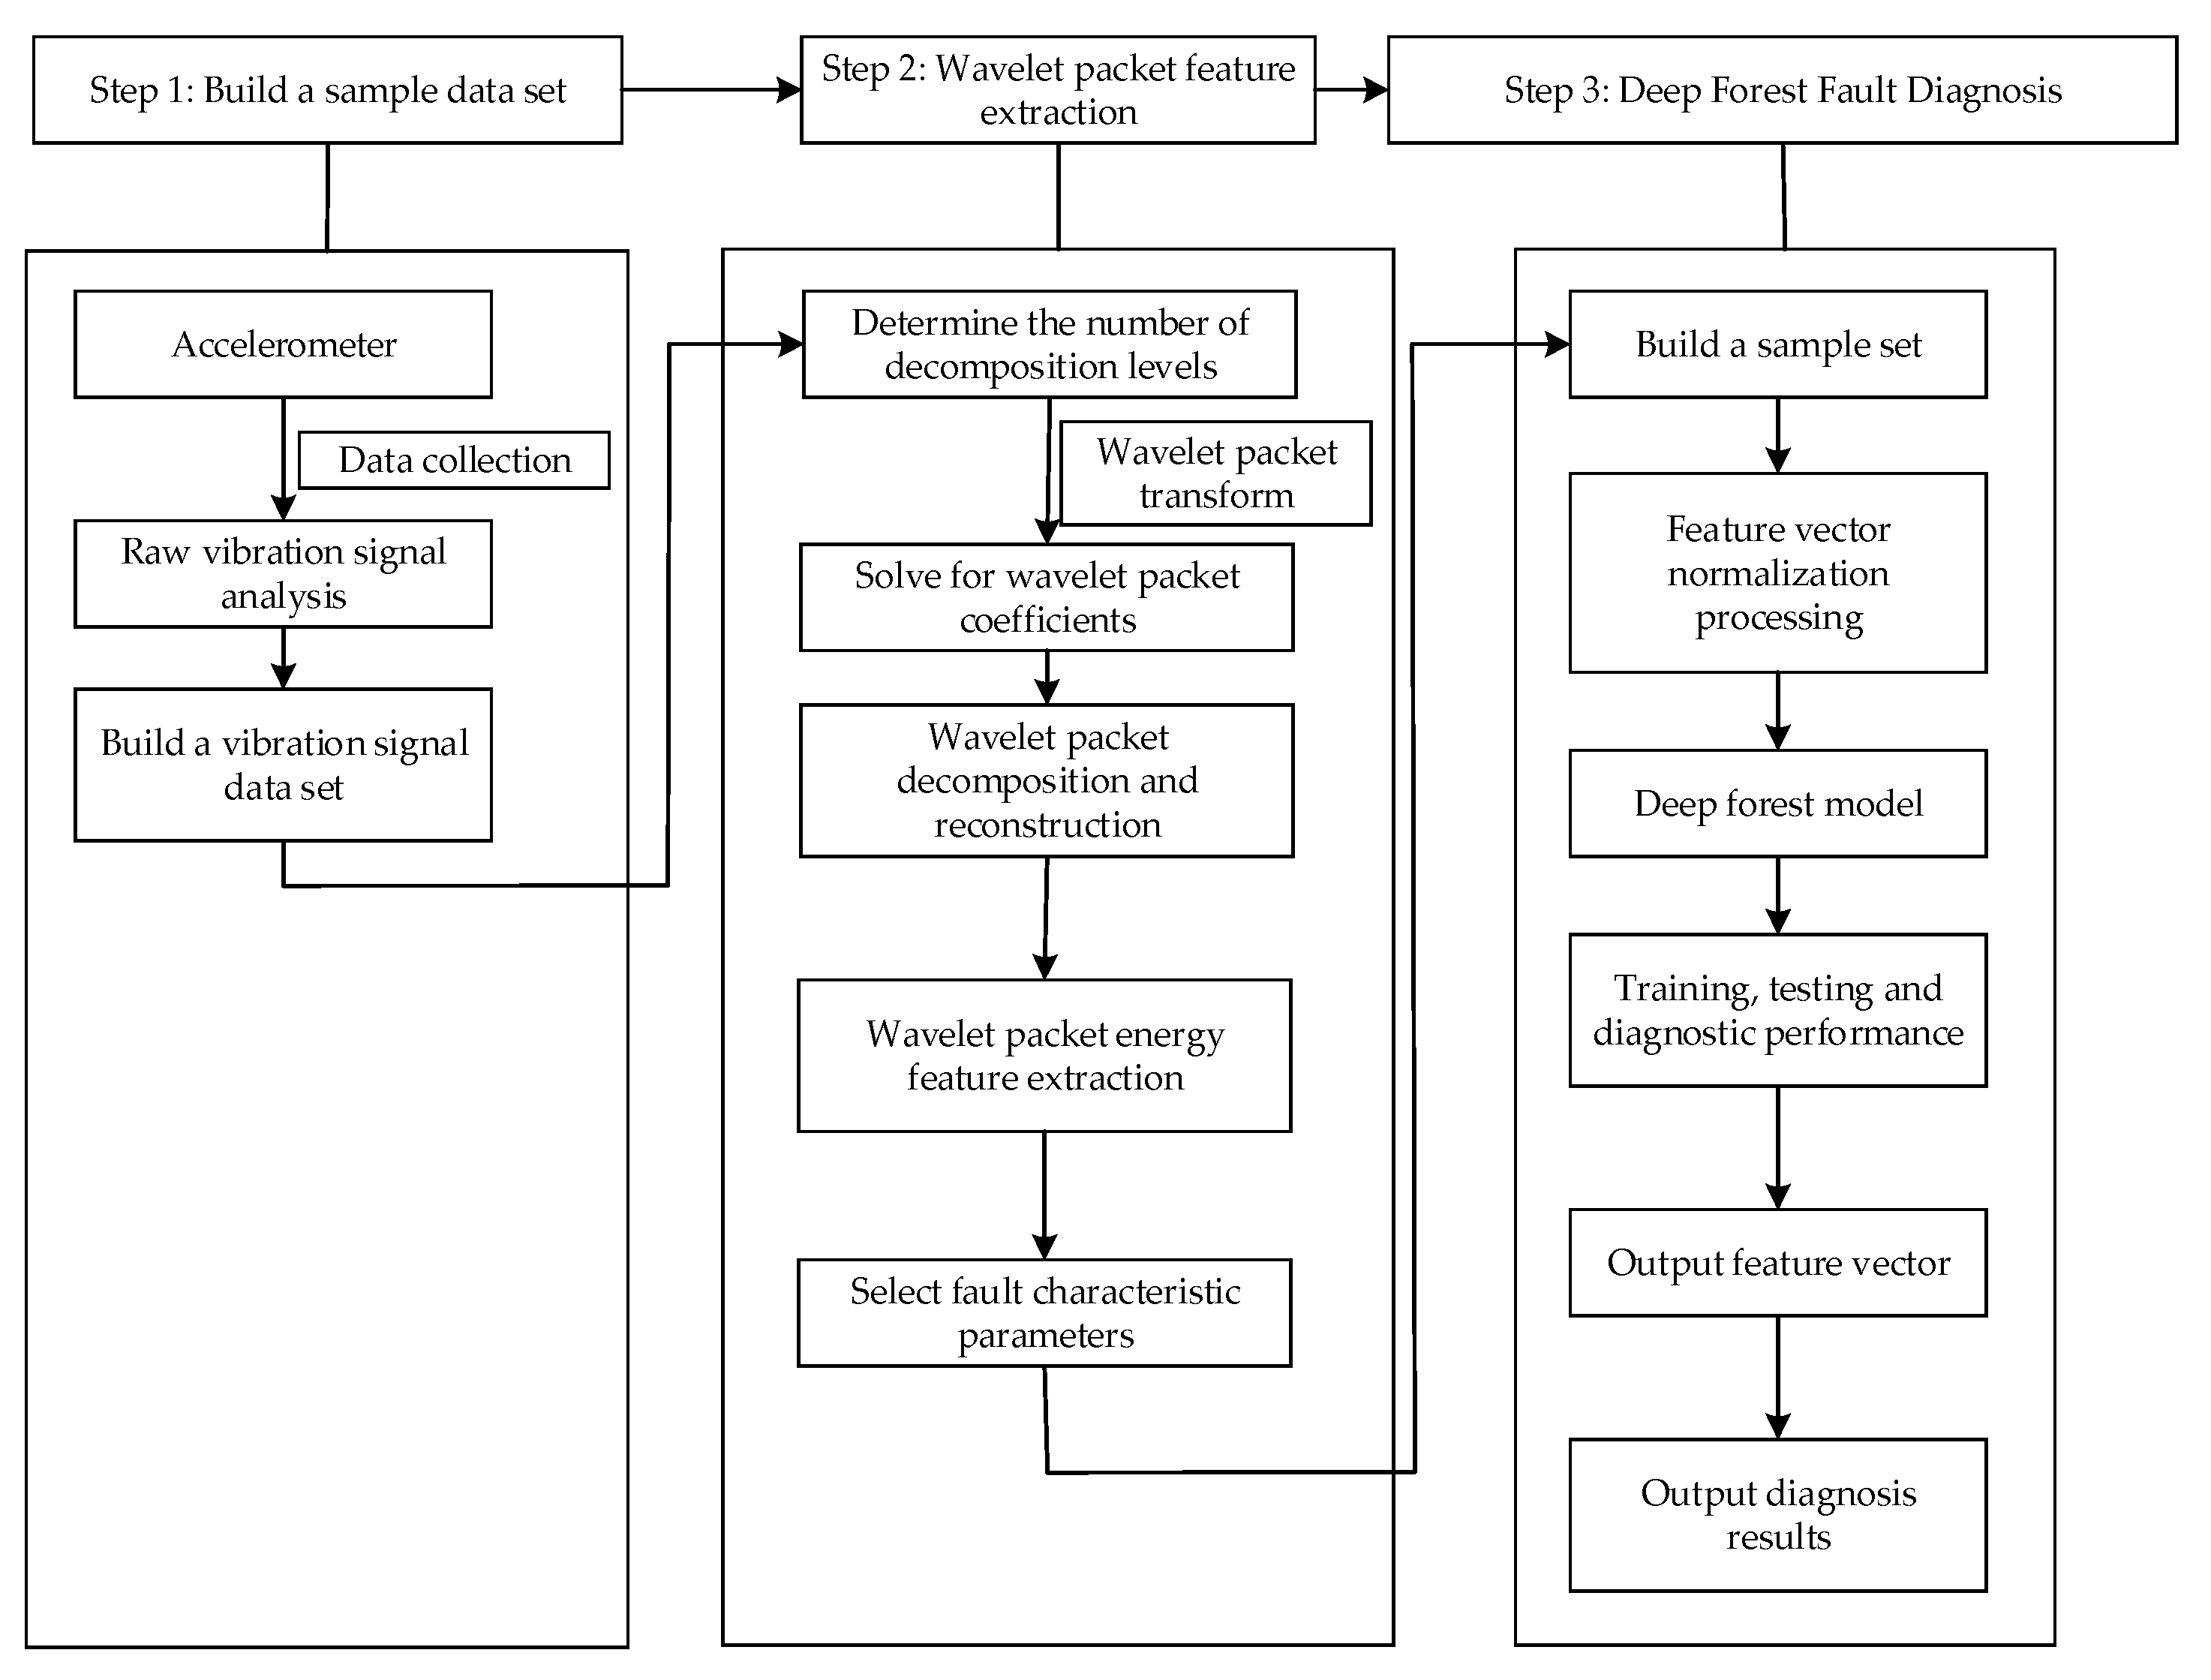
3. Fault Diagnosis Process of Coal Mine Main Fan Bearing Based on Wavelet Packet–Deep Forest Algorithm

In the field of coal mine main fan fault diagnosis, the deep forest algorithm has a strong feature learning capability. However, to better characterize the fault state of coal mine main fan bearings, researchers often select vibration data samples with more than 1000 data points. The deep forest algorithm has a large computational complexity and a low diagnostic accuracy when dealing with long data types. Therefore, in order for the diagnostic accuracy of the deep forest algorithm to be improved, a wavelet packet analysis feature extraction method is selected to process the bearing fault data samples, and a diagnosis method based on the wavelet packet–depth forest algorithm is introduced. The method includes three steps, specifically involving the construction of a sample dataset, wavelet packet feature extraction, and deep forest algorithm fault diagnosis, as shown in Figure 6.
In the field of the coal mine main fan fault diagnosis, the deep forest algorithm has strong feature learning capability. Meanwhile, the deep forest model often selects vibration data samples with more than 1000 data points in order to better characterize the fault state of coal mine main fan bearings. The deep forest algorithm has a large computational complexity and low diagnostic accuracy when dealing with data of long data types. Therefore, in order for the diagnostic accuracy of the deep forest algorithm to be improved, a wavelet packet analysis feature extraction method is selected to process the bearing fault data samples, and a diagnosis method based on wavelet packet-depth forest algorithm is introduced. The method includes three steps, specifically involving the construction of a sample dataset, the wavelet packet feature extraction, and deep forest algorithm fault diagnosis, as shown in Figure 6.
(1)
Construction of the sample dataset. Under a certain sampling frequency, the vibration signal monitoring data of five typical health states of rolling bearing at the driving end of coal mine main fan are obtained by acceleration sensors: normal state, inner ring failure, outer ring failure, cage failure, and rolling body failure. Then, the vibration signal dataset is constructed using the monitoring data.
(2)
Feature extraction based on wavelet packet decomposition. Firstly, the wavelet packet coefficients of the tree structure are obtained by selecting the appropriate number of wavelet packet decomposition layers and applying the wavelet packet decomposition method to the wavelet packet transform of the vibration signal. Then, the wavelet packet coefficients are decomposed and reconstructed to obtain the reconstructed signal. Subsequently, the wavelet packet energy features are extracted to obtain the energy distribution of each sub-band. Finally, the energy of the sub-bands under different health states is analyzed to obtain the feature parameters that can characterize the health state of the main ventilation fan in coal mines, and the fault feature vector set is constructed.
(3)
Construction of fault diagnosis model. After wavelet packet feature extraction, the fault sample dataset is divided into two parts: the training set and the test set. Then, the feature vectors in the dataset are normalized in order to reduce the computational effort of the diagnostic model. Then, the normalized feature vectors are input into the multi-granularity scan structure of the diagnostic model to obtain the transformed augmented vectors. Subsequently, the transformed broadened vectors are input to the cascaded forest structure to obtain the feature class vectors. After that, the training set is input to the fault diagnosis model to train the deep forest fault diagnosis model. At the same time, the test set is input to the fault diagnosis model to determine the health status of the bearing according to the output of the deep forest algorithm, and then verify the diagnostic performance of the model.

4. Empirical Analysis

4.1. Construction of a Sample Dataset

As shown in Table 1, the data of the main ventilation fan monitoring and supervision system of a mining company in Shanxi in 2021 was selected as the sample of bearing fault diagnosis data. The main fan of this coal mine is in a typical high gas mine. The fan ventilation method is a central parallel type, and the ventilation method is a mechanical extraction type. The coal mine fan system is arranged with three vertical shafts—the main shaft, the secondary shaft, and the return shaft—where the main shaft and the secondary shaft are used for air intake and the return shaft is used for air return. The mine design ventilation easy period air volume is 12,900 m3/min, negative pressure is 2059 Pa, and the equilibrium hole is 6.21 m2. The ventilation difficult period air volume is 12,780 m³/min, negative pressure is 2178 Pa, and the equilibrium hole is 5.43 m
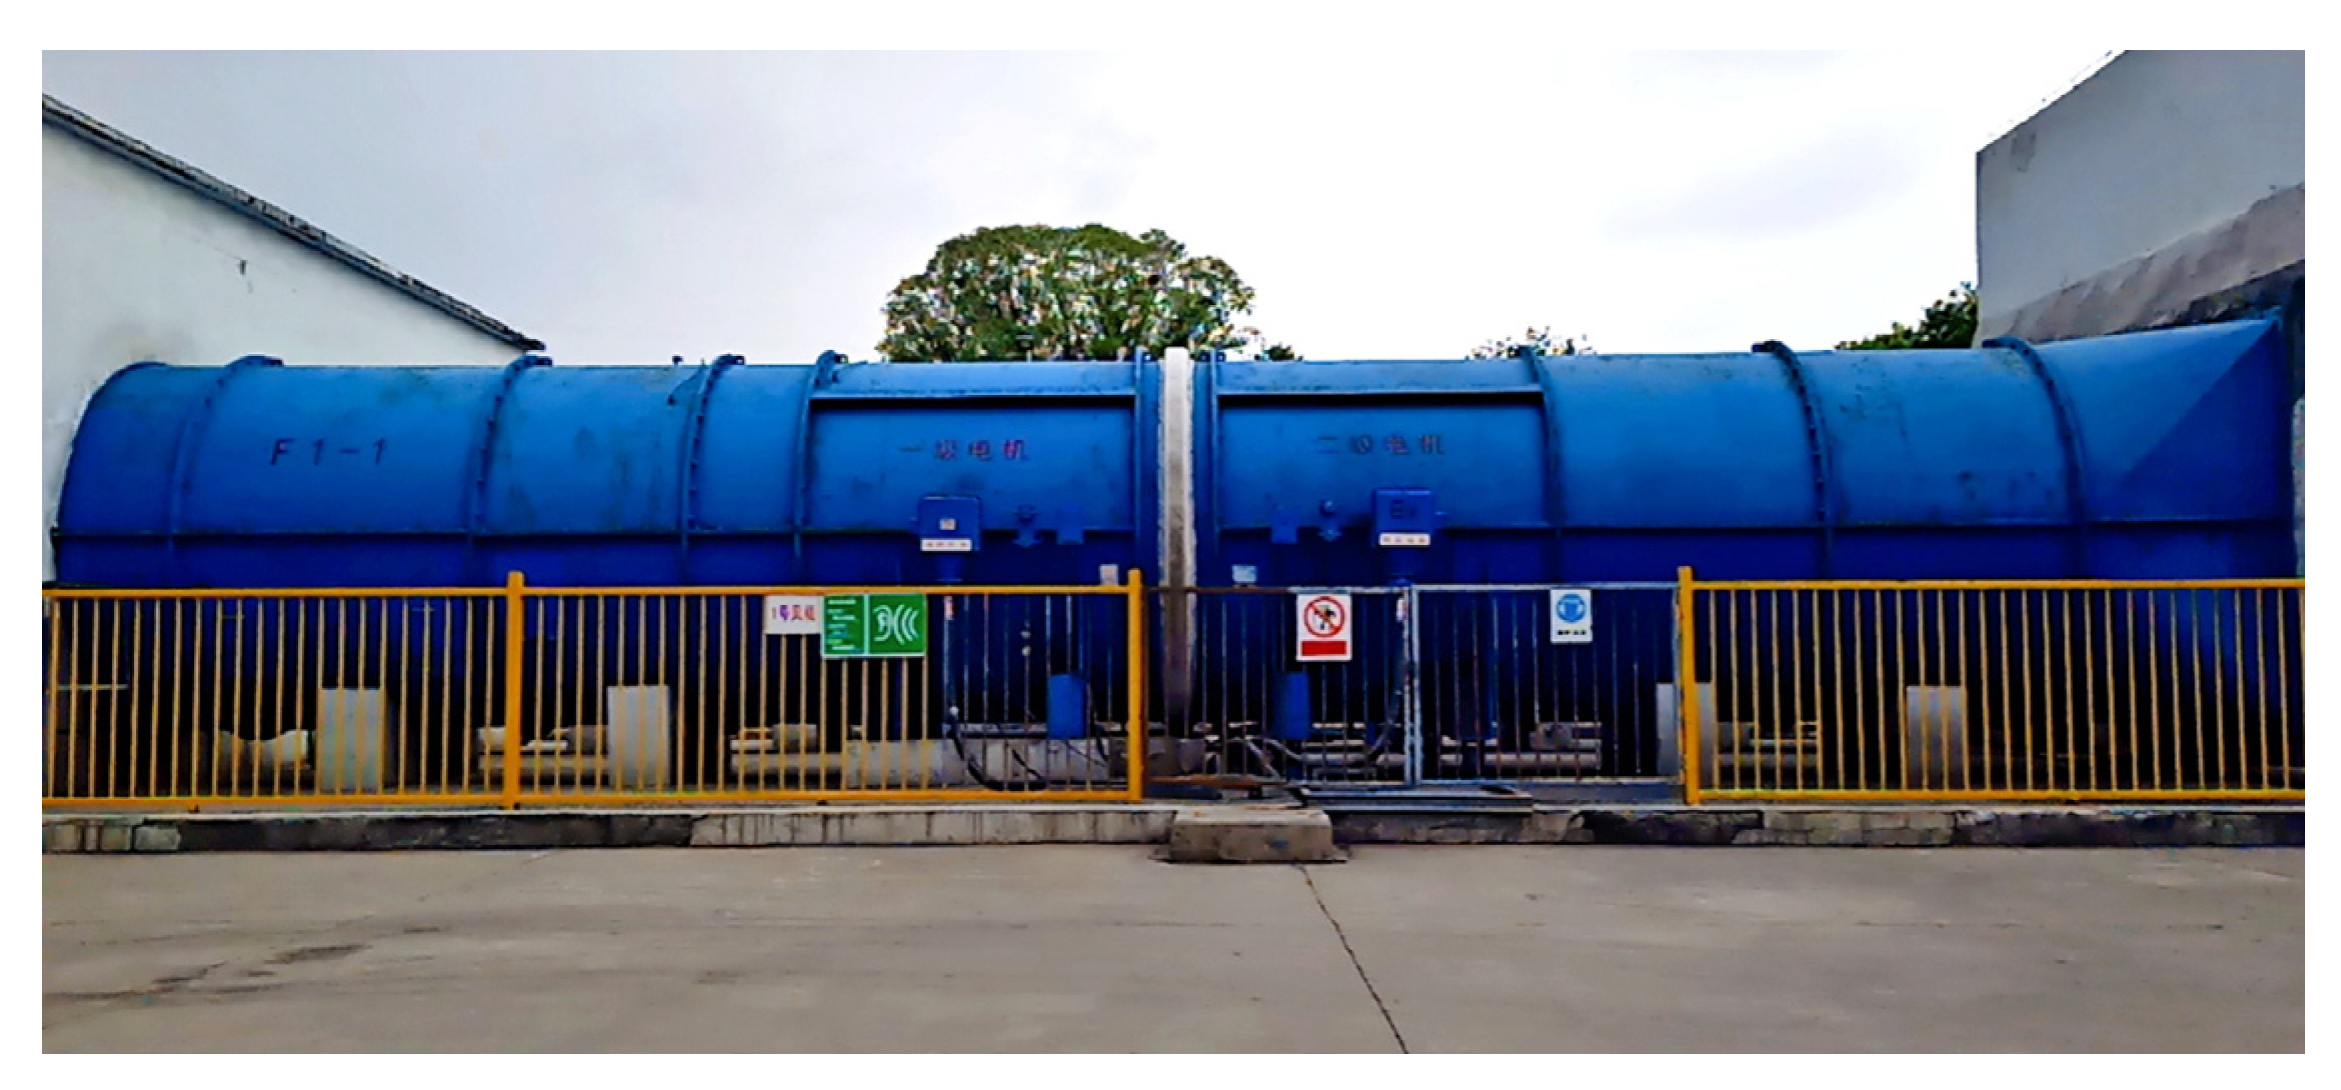
2. The return shaft is installed with two FBCDZ-8-No34 (2 × 800 KW) counter-rotating axial flow main ventilation fans with impeller, and the diameter of the impeller is 3.4 m; one of the fans is used for working production, and the other one is used as a backup. The condition of the fans on site is shown in Figure 7. The main fan is equipped with various sensors for gas, wind speed, negative pressure, etc., which can realize uninterrupted real-time inspection of the operation condition
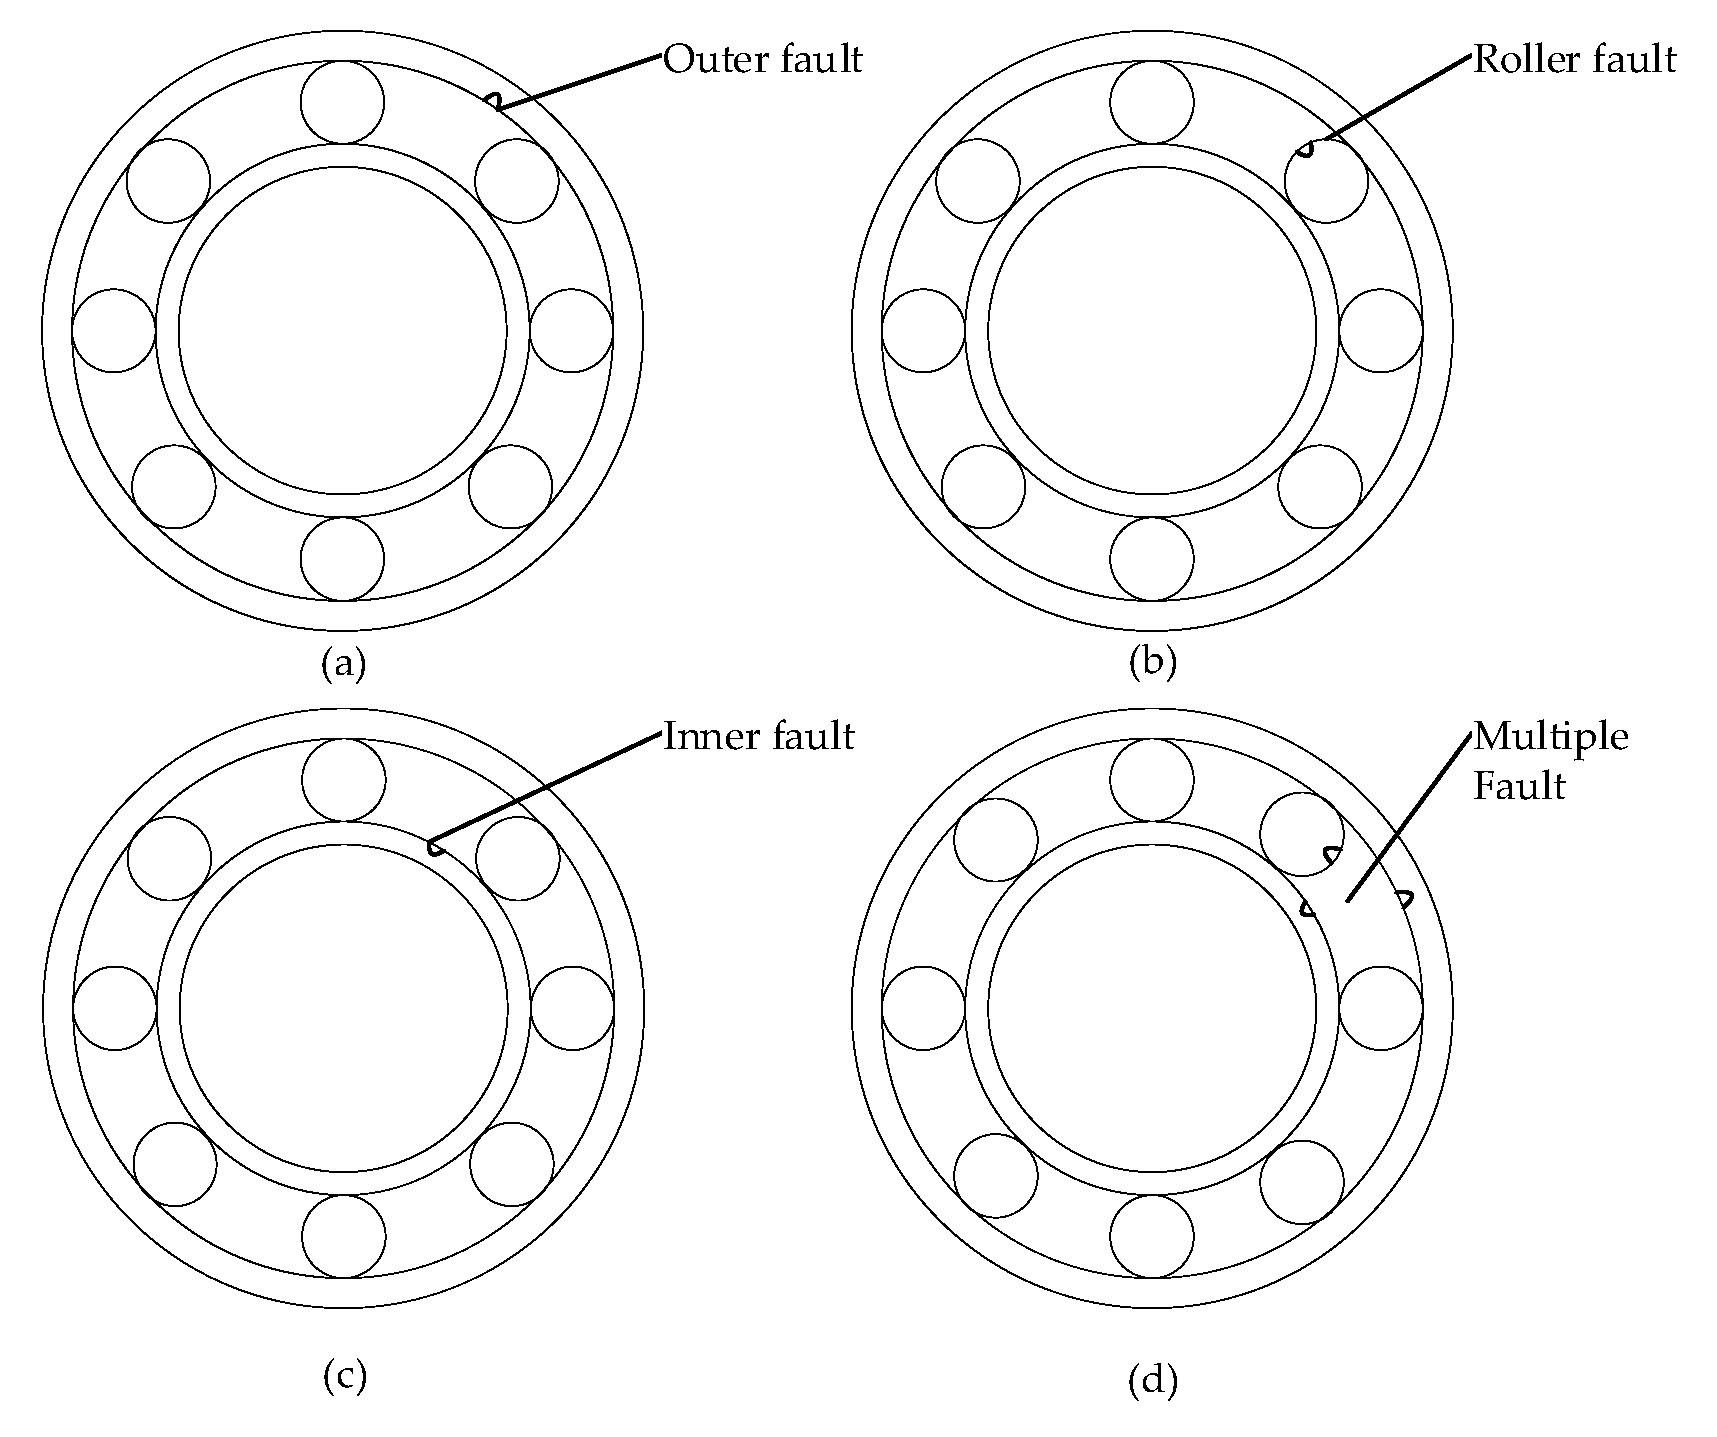
Using the acceleration sensor with a 12,000 sampling frequency for vibration signal acquisition, we can obtain five kinds of health status monitoring data for the main fan rolling bearing: normal state of the drive end bearing, inner ring failure, outer ring failure, rolling body failure, and cage failure. Among them, the four kinds of fault state diagram involved are shown in Figure 8.
During the initial commissioning phase of the main ventilator system, the site personnel will adjust the speed of the fan by means of a frequency converter and keep it running at a stable speed. The main ventilator is in a high gas mine and is in a difficult ventilation period. Therefore, the site personnel will set the frequency of the inverter according to the site air volume, negative pressure, gas concentration, and other conditions. After that, the inverter will adjust the bearing speed on the basis of the data collected by the sensors and ensure that the main ventilator is running under a stable working condition. At this time, the speed of the sampling motor is 1797 r/min, taking its approximate number as 1800 rpm. In addition, the data collected at the mine only covered the type of fault and did not record detailed information on the size of the fault. Therefore, in this experiment, the data involve one kind of normal state and four kinds of fault state data, and the label code is shown in Table 1. When 2000 consecutive vibration signal data points are selected as a set of vibration signal data samples, 200 sets of normal state monitoring data, 100 sets of inner ring fault monitoring data, 100 sets of outer ring fault monitoring data, 100 sets of rolling body fault monitoring data, and 200 sets of cage fault data can be obtained, being labeled and coded correspondingly. The data sample sets for this fault diagnosis model validation are allocated according to the ratio of one to four between the test set and the training set.

4.2. Feature Extraction Based on Wavelet Packet Decomposition

Before feature extraction of the vibration signal, the original vibration signal needs to be routinely analyzed. Then, the wavelet packet feature extraction method is applied to decompose the vibration signal and obtain the feature parameters that can effectively characterize the vibration signal.

4.2.1. Experimental Signal Analysis

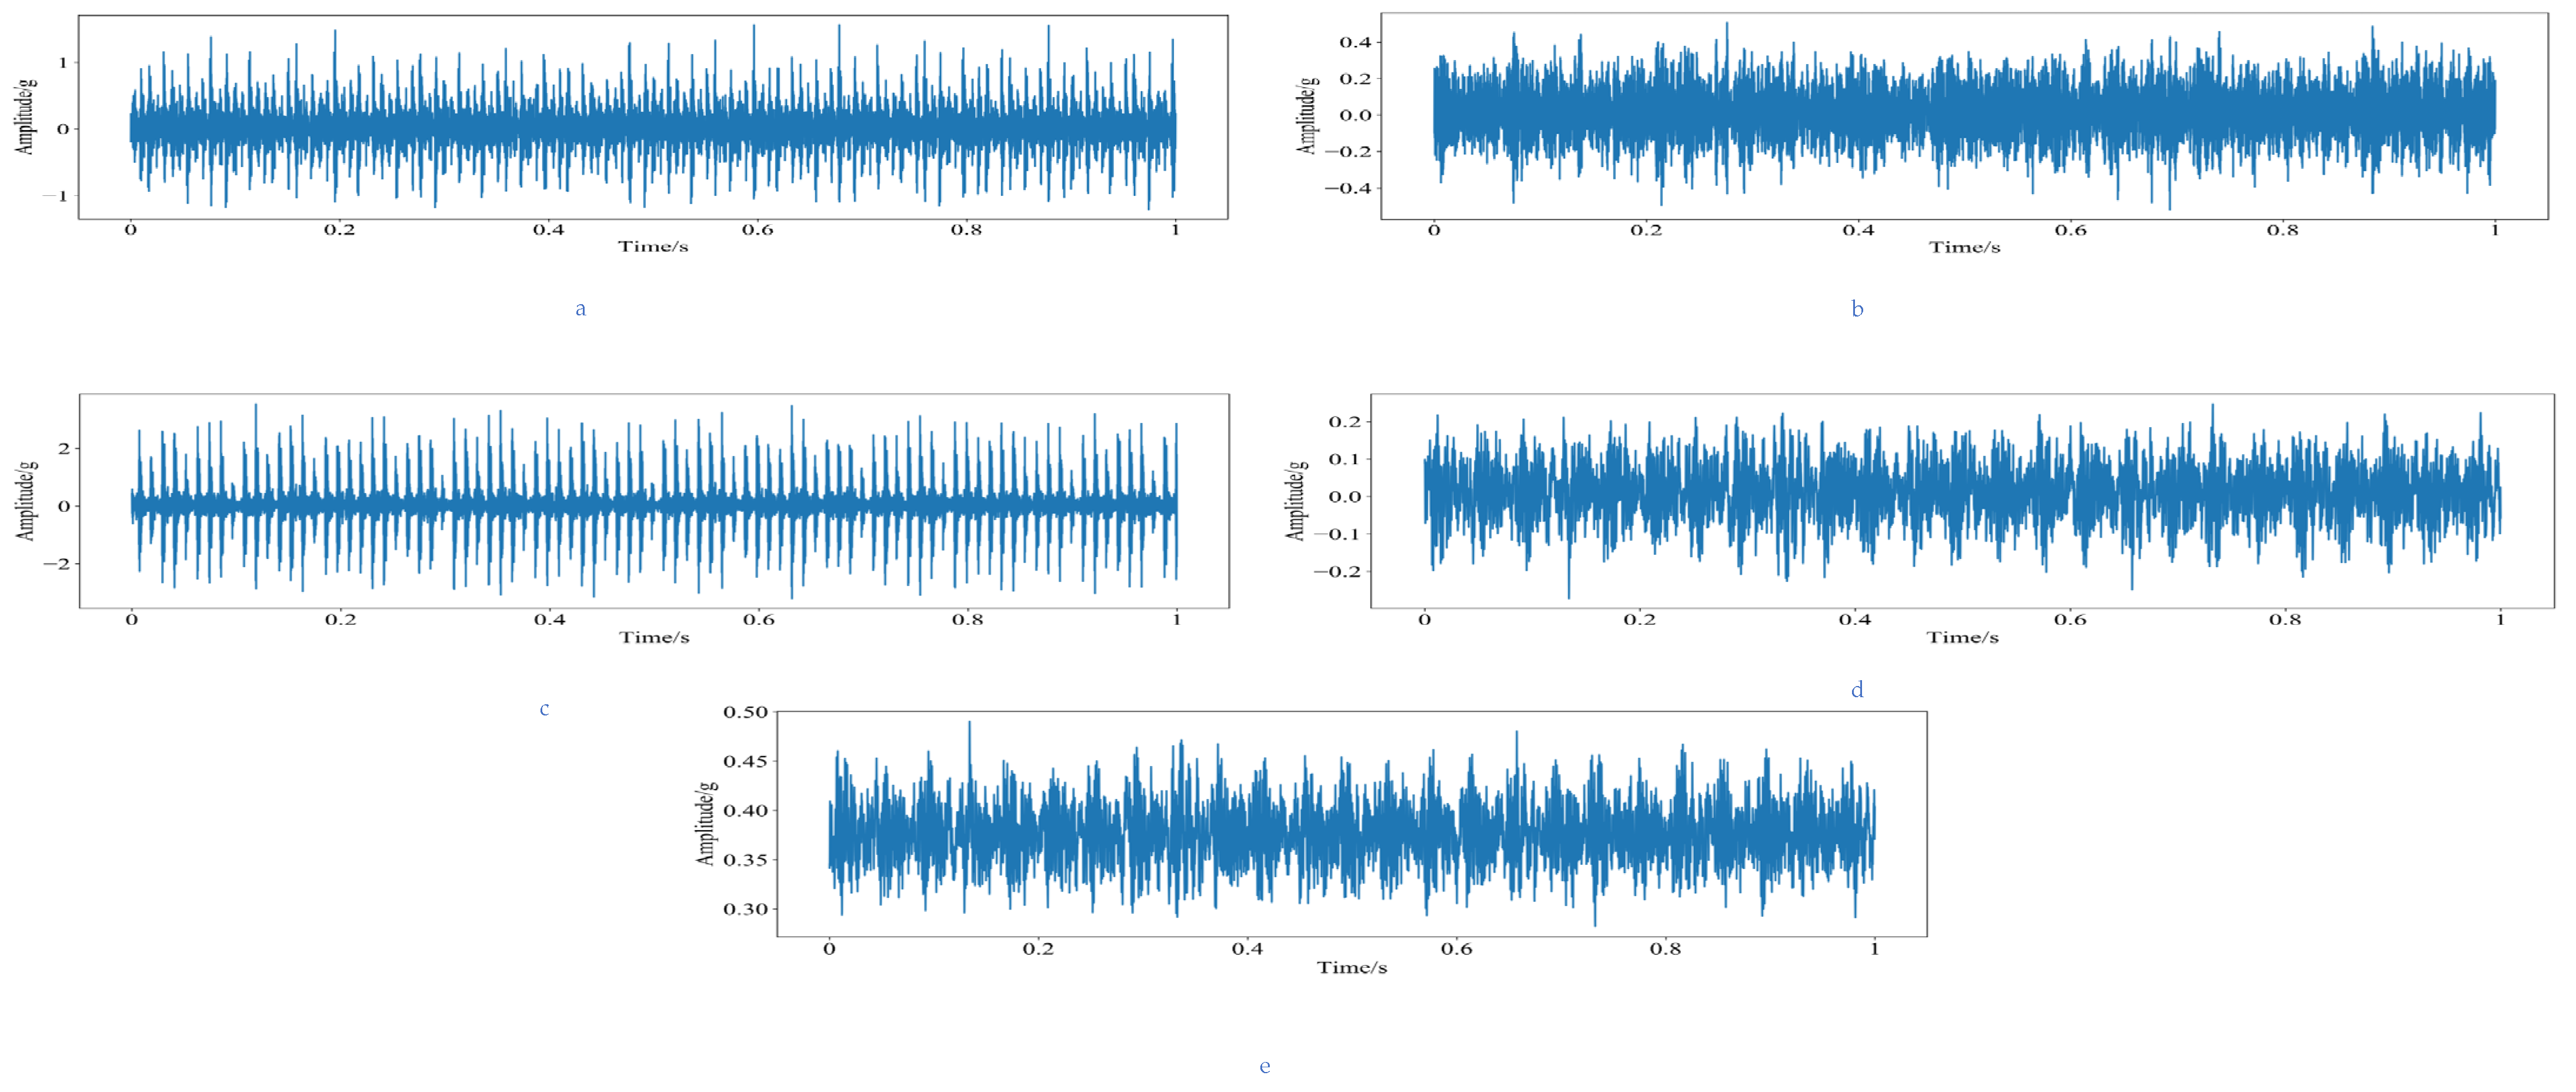
When the collected rolling bearing fault signals are processed, the data samples of the previous second can be obtained. Then, the time-frequency diagram analysis is performed on the data sample, and the time-domain diagram and the frequency spectrum diagram of the original bearing vibration signal are obtained, as shown in Figure 9 and Figure 10.
For the time domain curve, the vibration amplitude of the bearing was between 0.2 g and 0.2 g in the cage fault state, and the vibration amplitude was average. The vibration amplitude of the bearing was between −0.4 g and 0.4 g in the rolling body fault state, and the amplitude was smaller than the inner ring and outer ring fault state, and the vibration signal was uniform. It may have been due to its greater influence by noise interference and covered less fault information. In the inner ring fault state, the vibration amplitude of the bearing was between −1 g and 1.5 g, and the amplitude was smaller than that in the outer ring fault state. The bearing vibration amplitude in the outer ring fault state was stronger, and the amplitude was between −3 g and 3 g; the amplitude was larger, and it showed a continuous shock signal. The normal state of the bearing vibration amplitude was more stable, and the amplitude was between −0.2 g and 0.2 g; the amplitude was smaller, and the vibration signal was uniform.
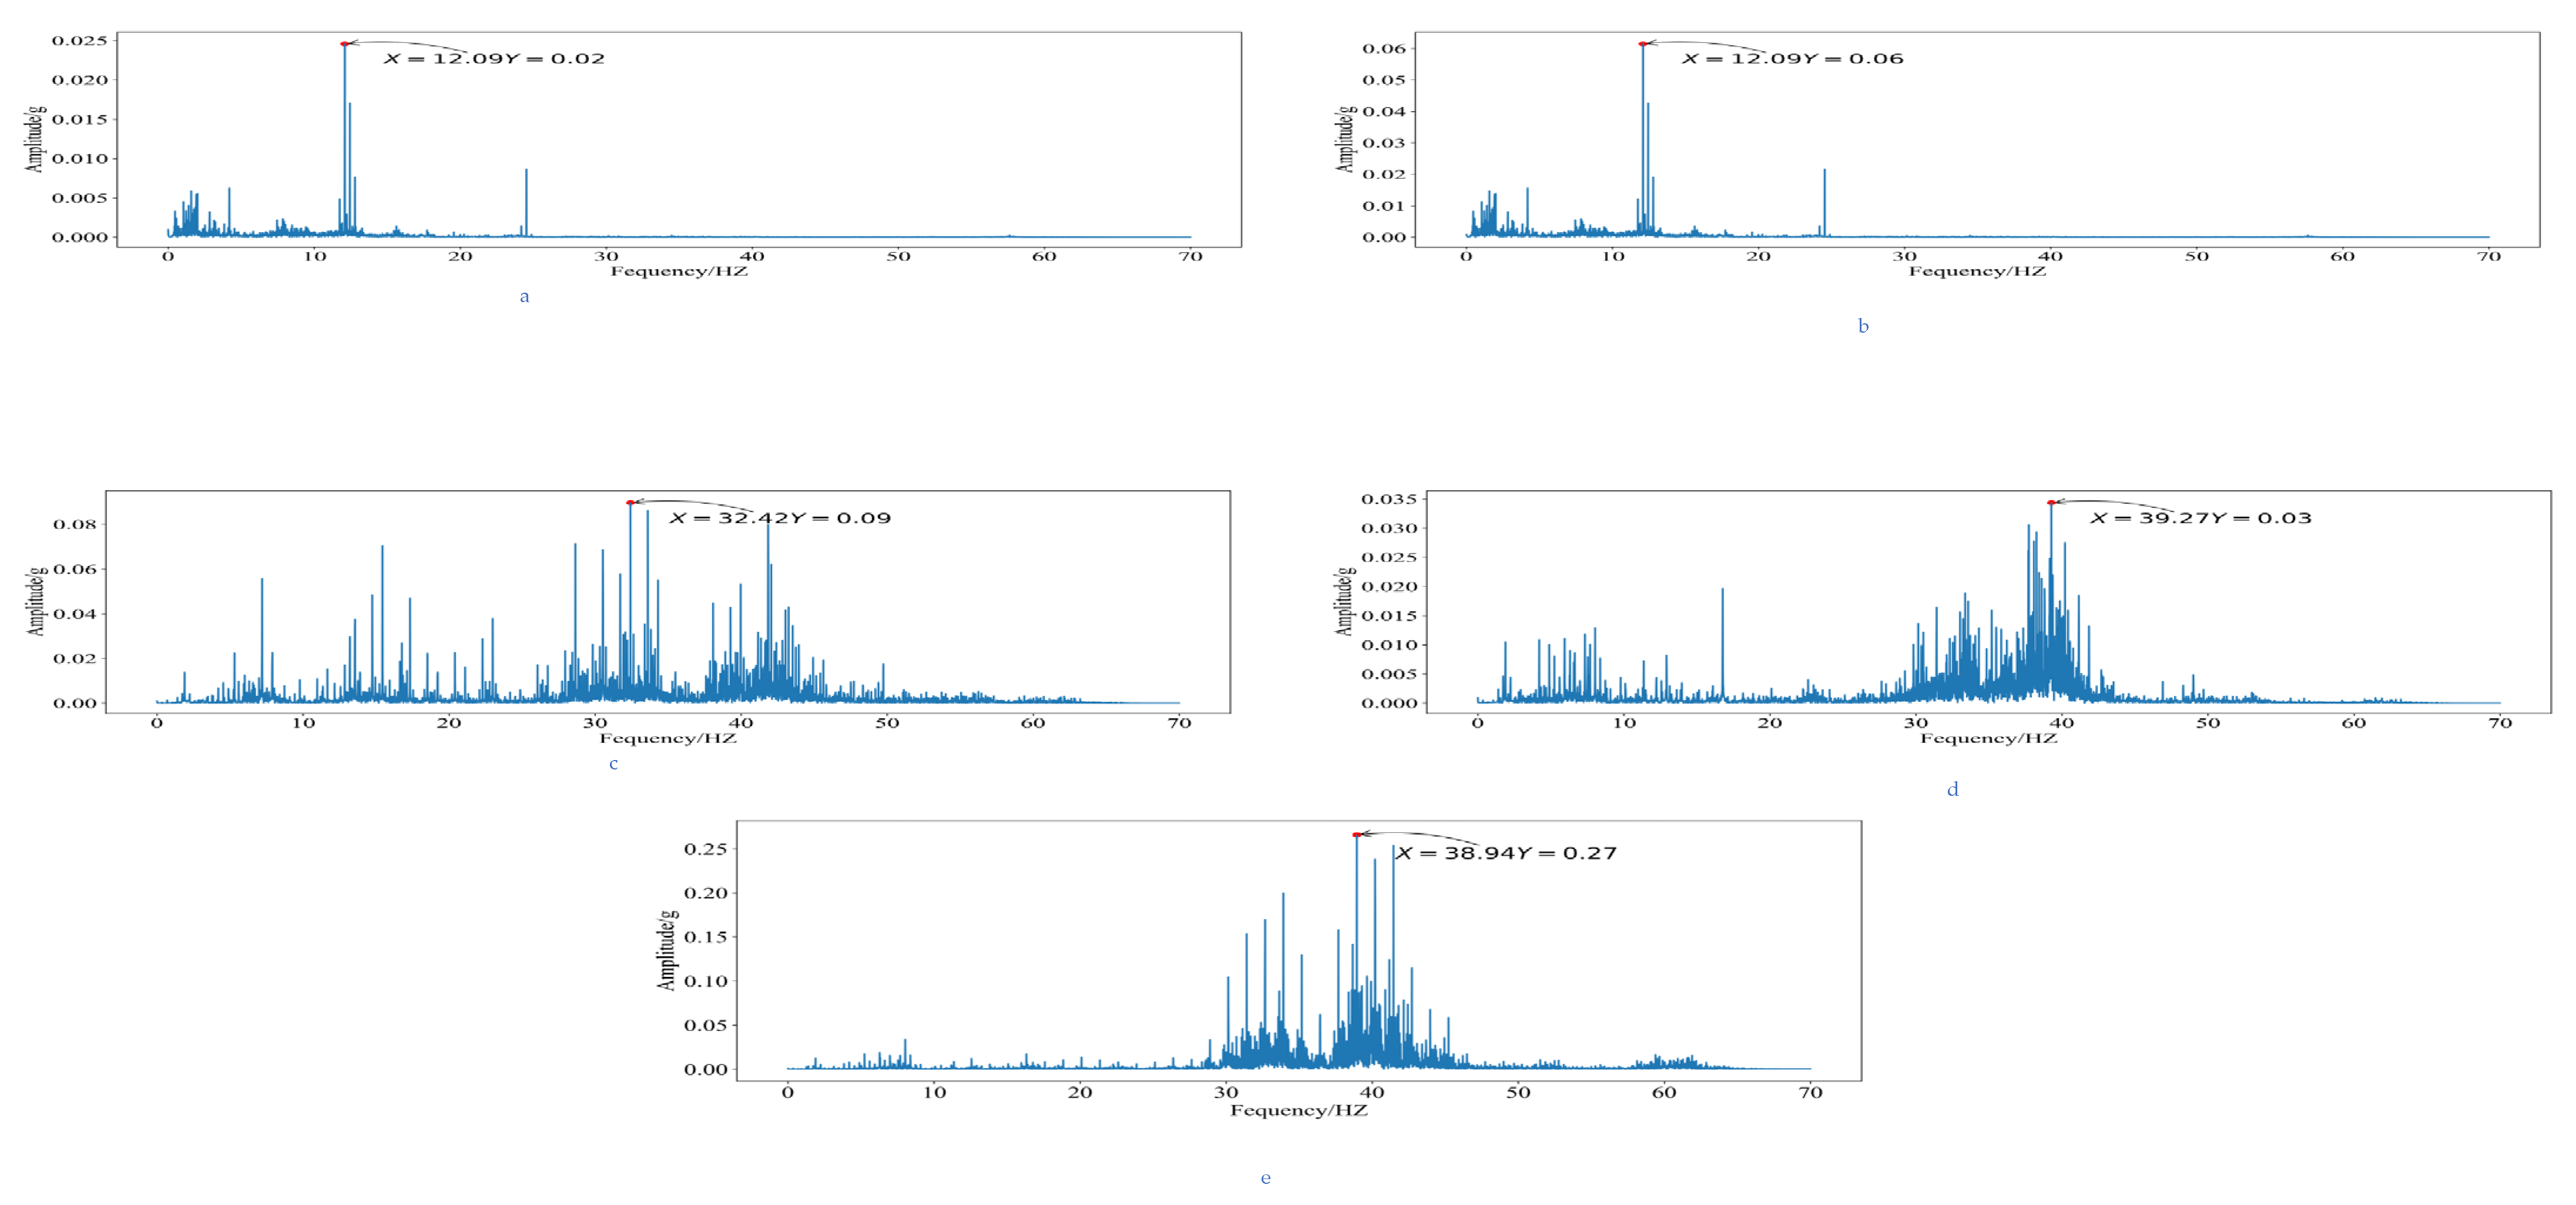
From Figure 10, it can be seen that for the spectrum curve, there were some differences in the characteristic frequencies of the five health states. The characteristic frequencies of 12.09 Hz, 12.09 Hz, 32.42 Hz, 39.27 Hz, and 38.94 Hz appeared in the cage fault state, rolling body fault state, inner ring fault state, outer ring fault state, and normal state, respectively, being very close to the characteristic frequencies obtained from the actual calculation. The vibration signal characteristic frequencies of the inner ring fault state and outer ring fault state were similar, and the bearing fault type cannot be identified by only using the ordinary vibration signal analysis method. Therefore, this paper combined wavelet packet analysis algorithm to decompose the vibration signal and obtain the feature vector with obvious energy difference. Then, the fault diagnosis of rolling bearing was realized by combining with the fault diagnosis method.
From the bearing normal state, outer ring fault state, inner ring fault state, and rolling body fault state, the cage fault state of the time frequency diagram can be seen, yet the fan bearing vibration time frequency diagram amplitude difference is not obvious. Except for the main frequency, the other frequency components of the normal state of the bearing are lower than the other healthy states. The energy values of the time-frequency diagrams of bearings in different health states are significantly different in different frequency bands. Therefore, in this paper, the wavelet packet method is chosen to extract the characteristic components of the vibration signals in different health states to characterize the health states of the bearings.

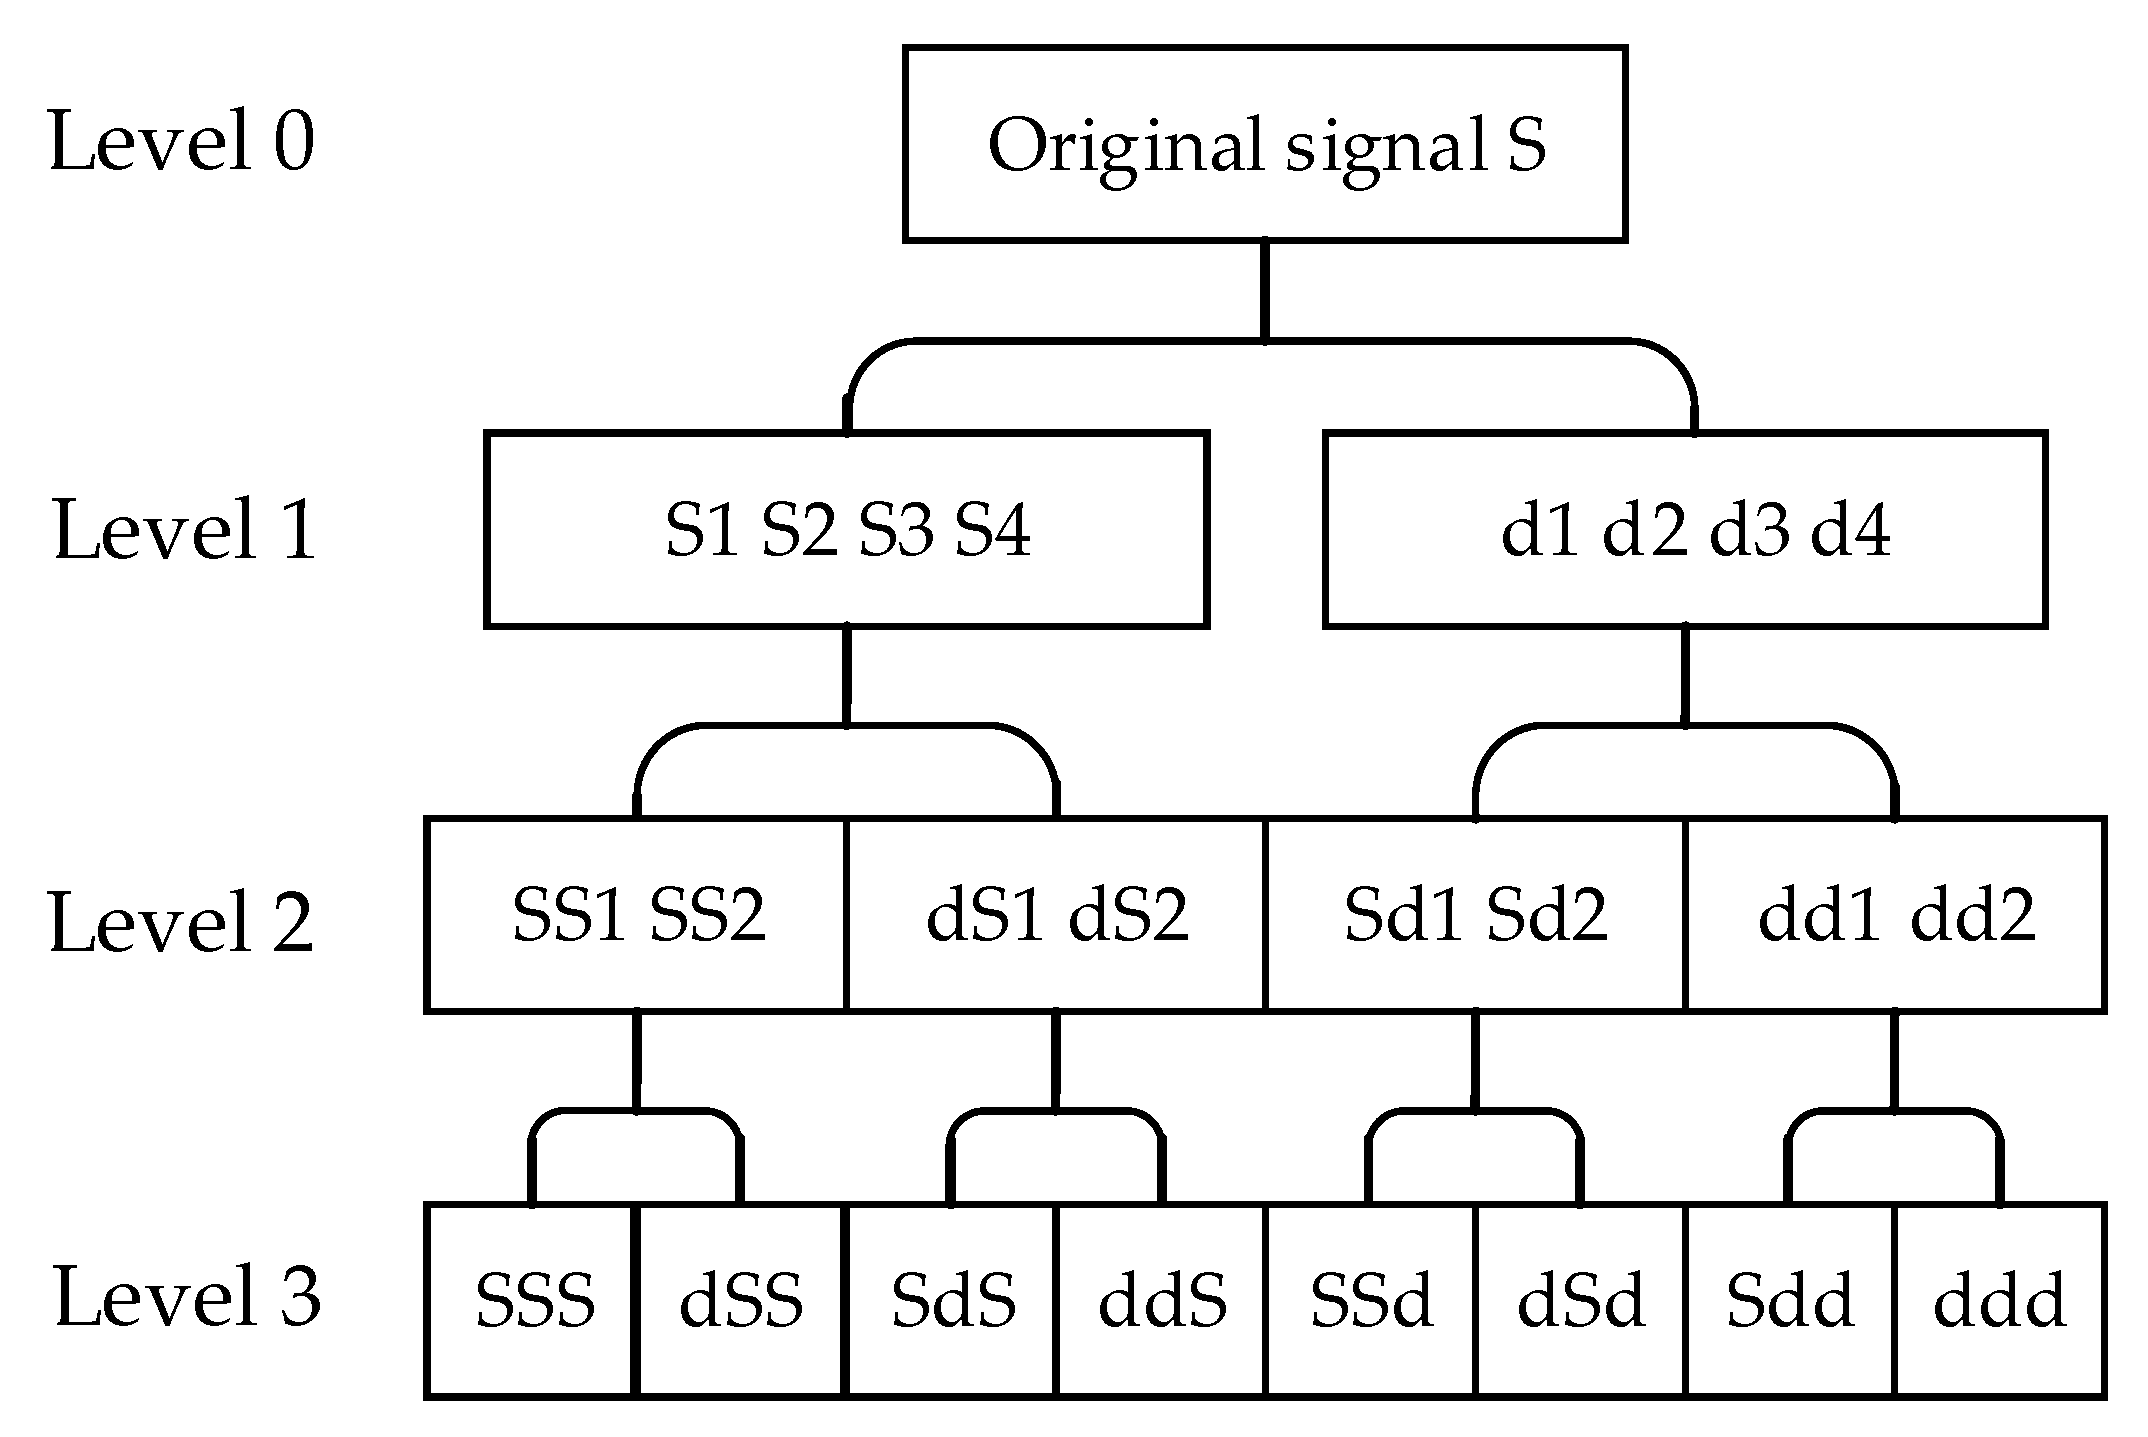
4.2.2. Wavelet Packet Feature Extraction

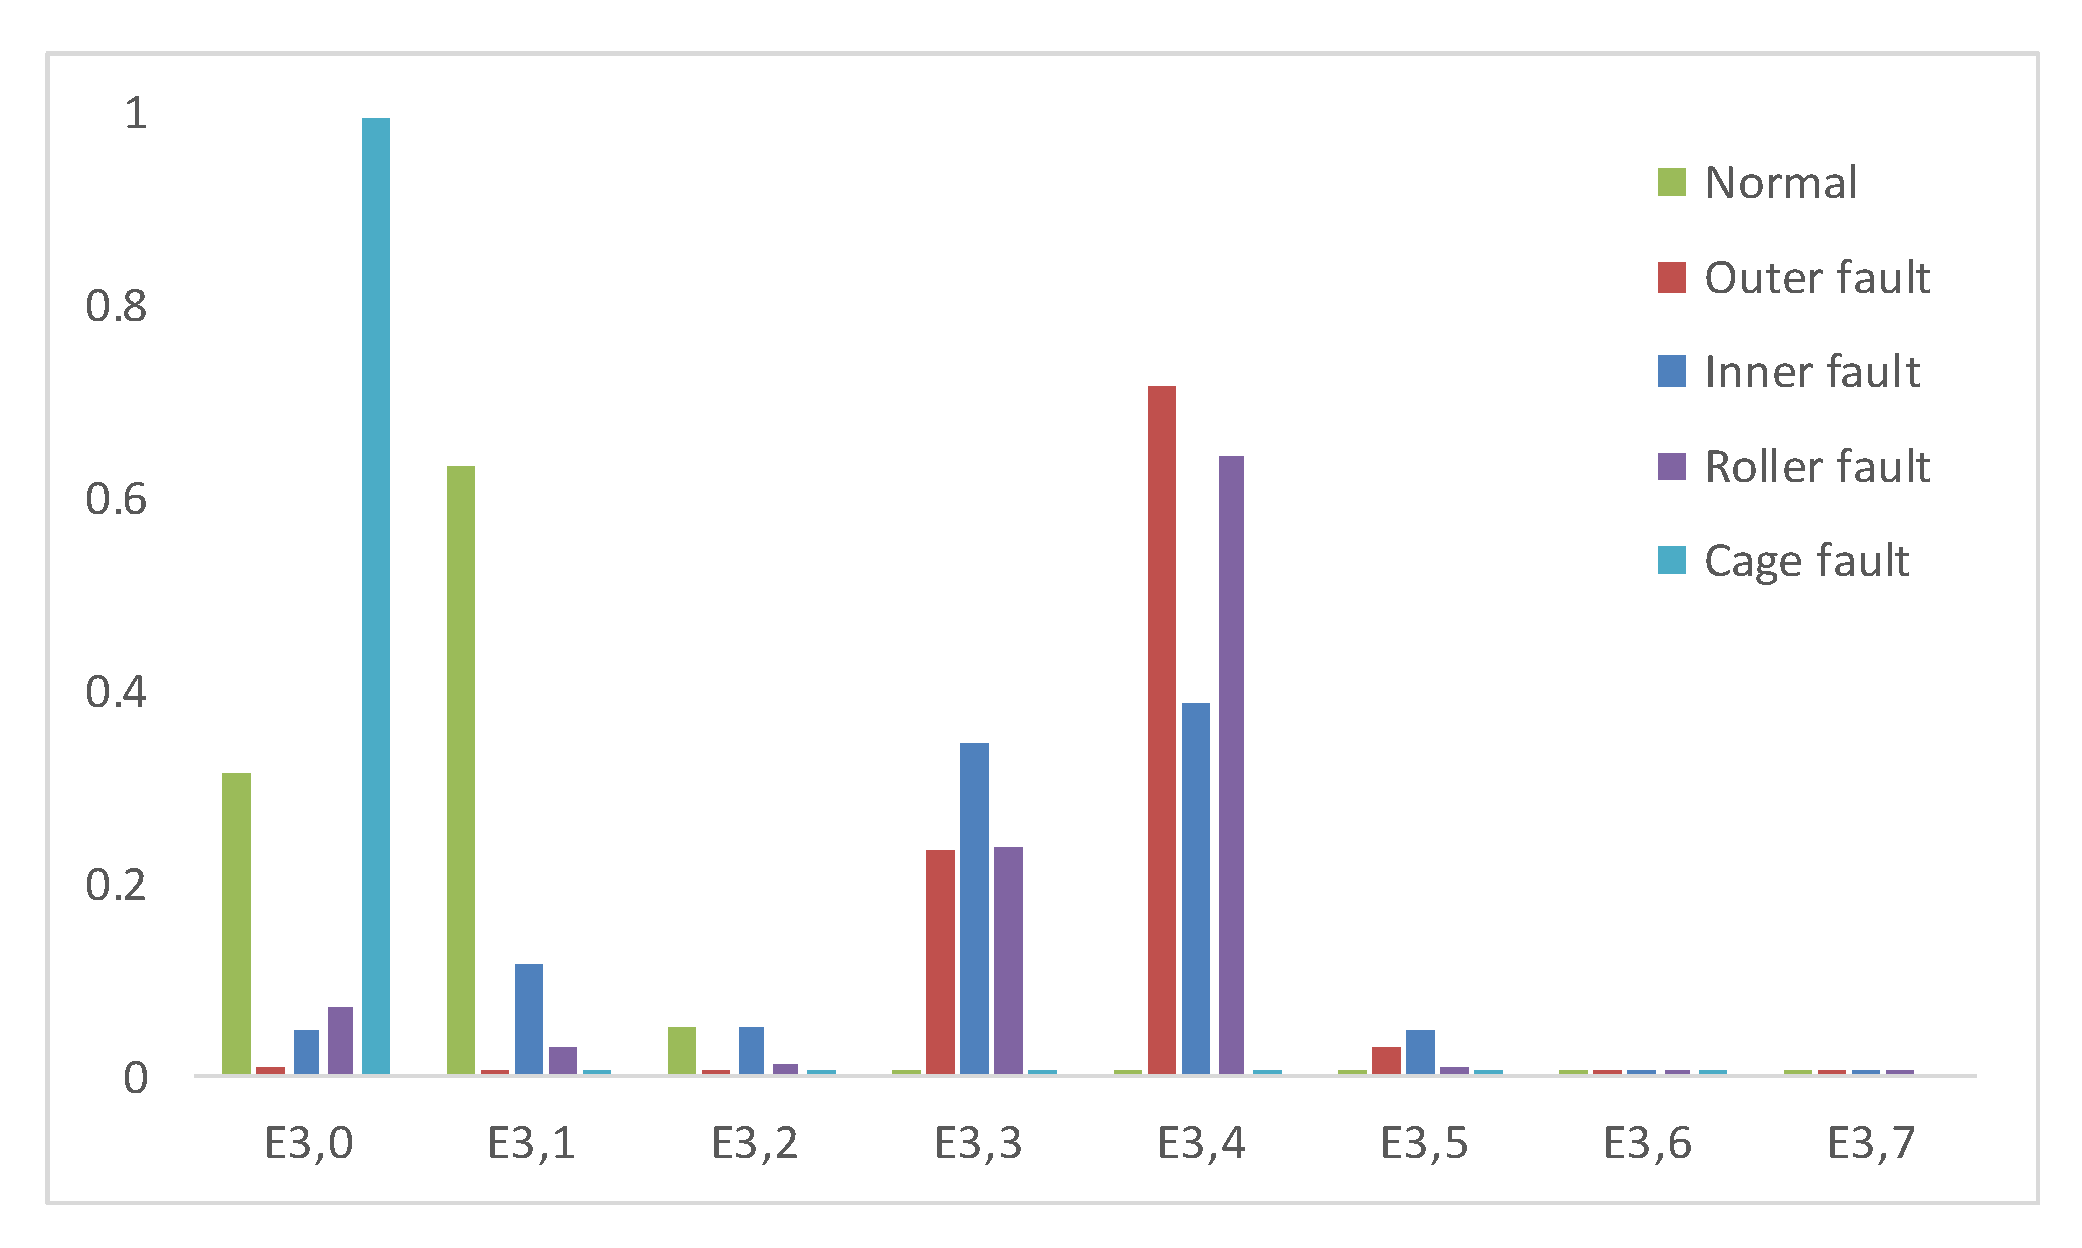
The three-layer wavelet packet decomposition was carried out with the help of Meyer wave, and the fault feature vectors of the five healthy states of rolling bearing normal, inner ring fault, outer ring fault, rolling element fault, and cage fault were obtained. Part of the data is shown in Table 2.
In order to eliminate the influence of large differences in the value ranges of different characteristic parameters of rolling bearings in different health states, we normalized the training samples of deep forest fault diagnosis of rolling bearing health states. The normalized rolling bearing fault diagnosis training samples are shown in Table 3.
The normalized rolling bearing wavelet packet energy feature vector was analyzed, and the energy histogram was able to be obtained, as shown in Figure 11.
The wavelet packet feature extraction of the rolling bearing can obtain the feature vector E that can characterize the failure state of the main fan. That is, E is used as a data sample to verify the fault diagnosis method, where E satisfies the formula E = [ E 3 , 0 , E 3 , 1 , E 3.2 , E 3 , 3 , E 3 , 4 , E 3 , 5 , E 3 , 6 , E 3 , 7 ] . Taking the extracted feature vector E as the input feature vector x of the deep forest, we found that x then satisfied the formula x = E = [ x 1 , x 2 , x 3 , x 4 , x 5 , x 6 , x 7 , x 8 ] .

4.3. Fault Diagnosis of Rolling Bearings at Driving End of Main Fan

According to the fault diagnosis process, the fault diagnosis of the rolling bearing of the driving end of the main fan of the coal mine can be carried out. There are five kinds of health status of rolling bearings, and thus the fault diagnosis process is a five-category problem.
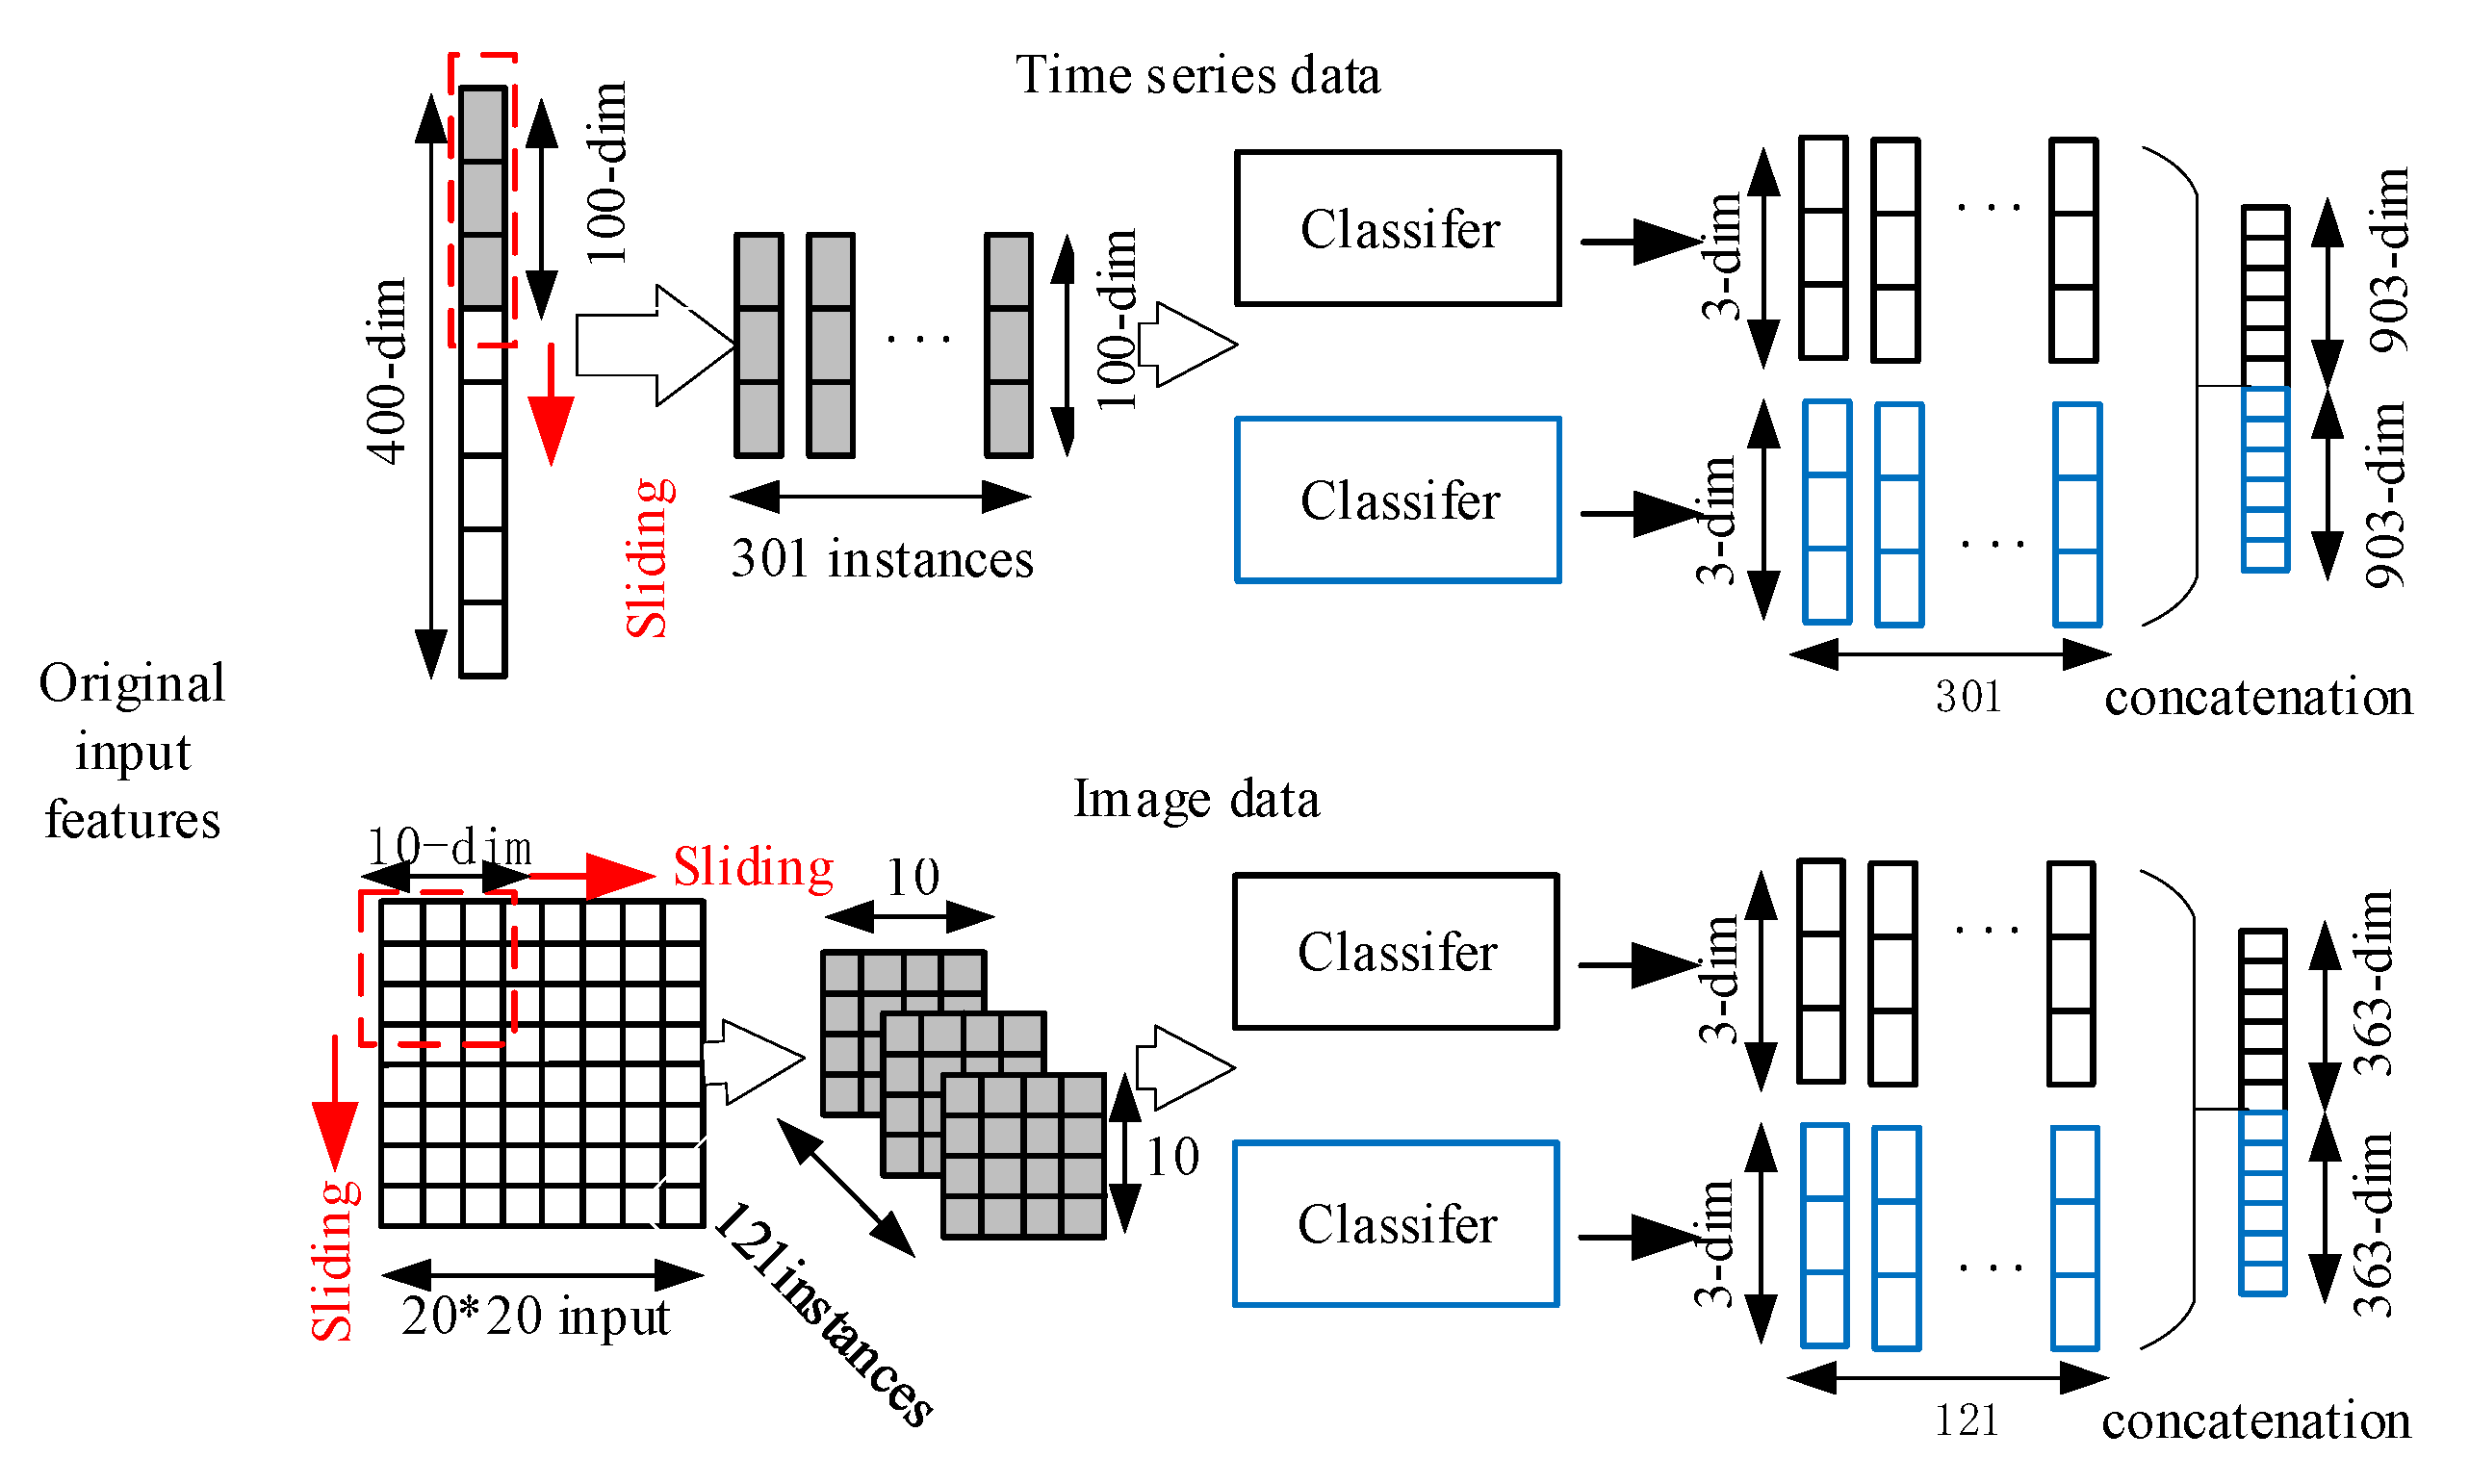
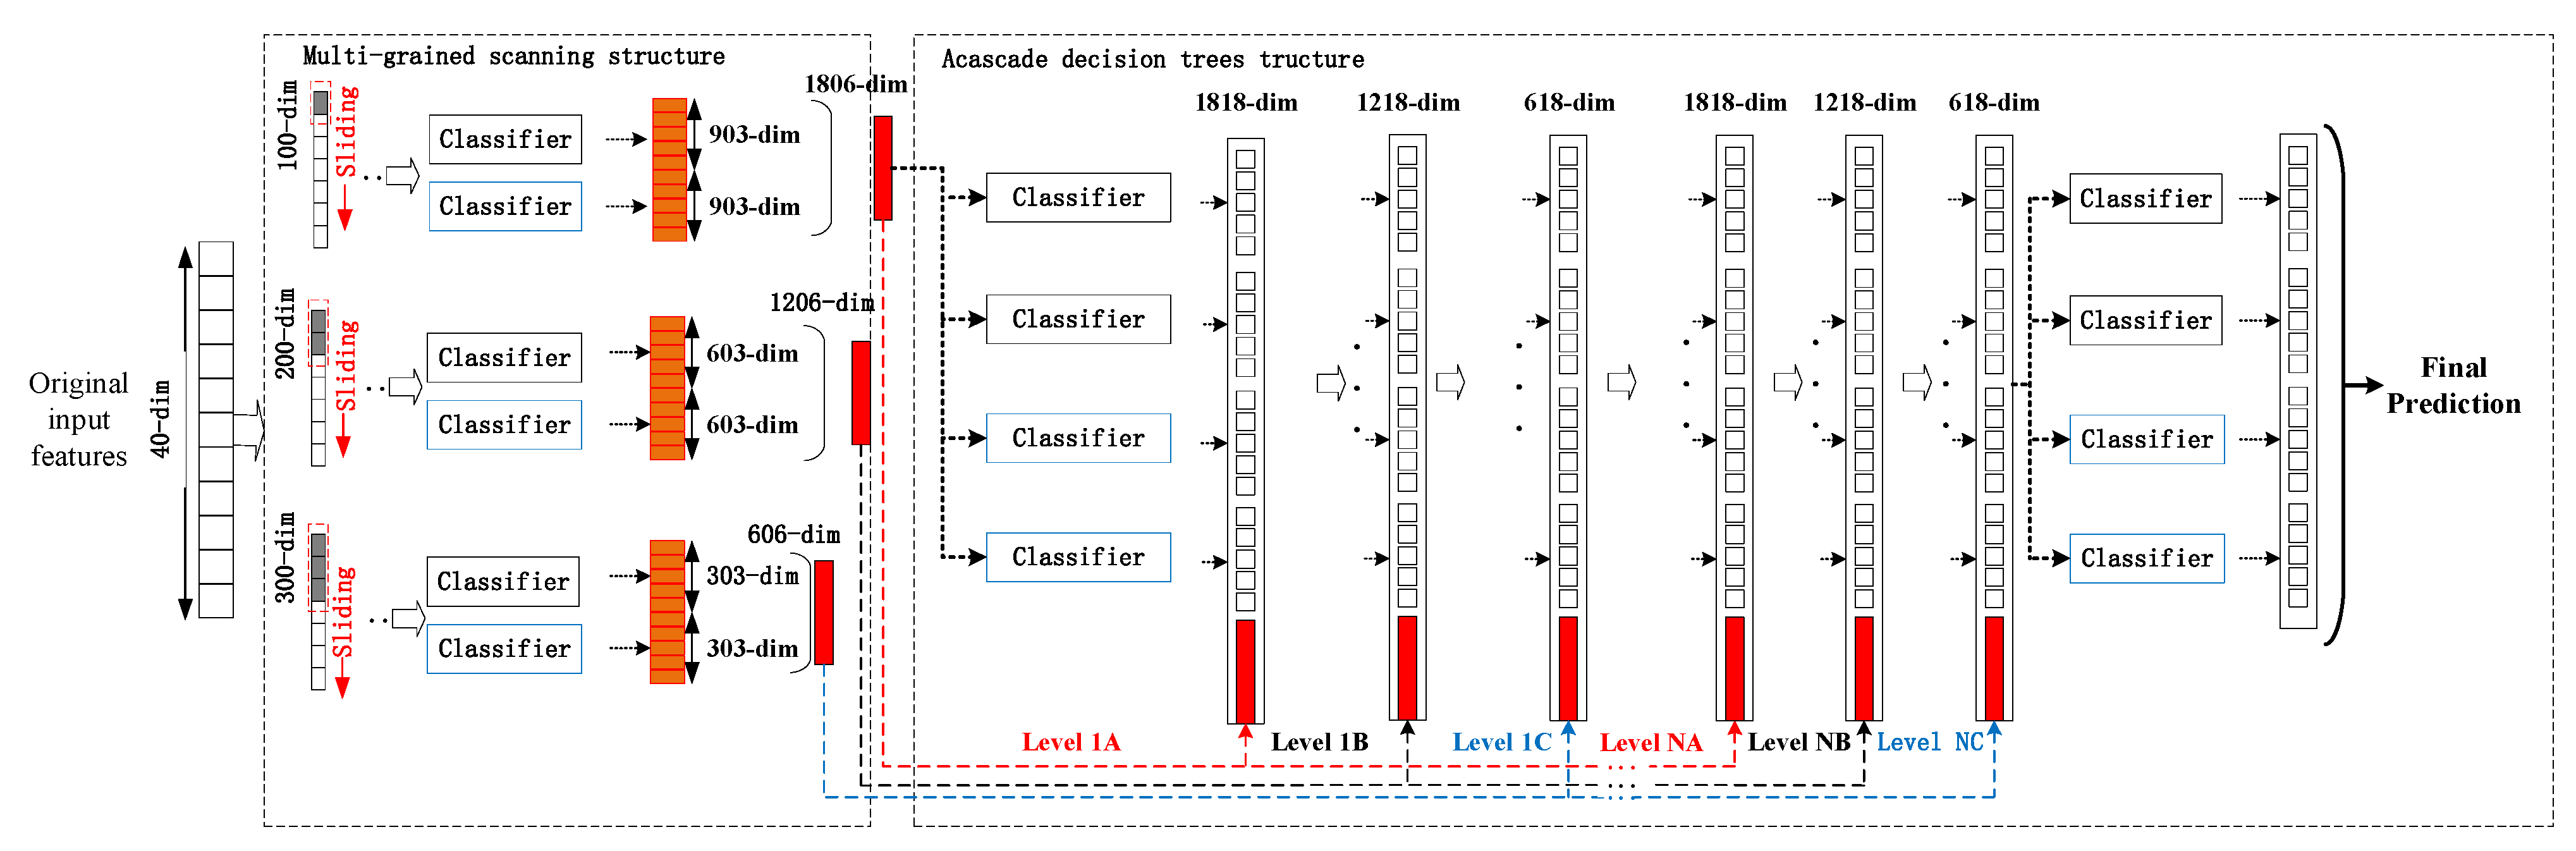
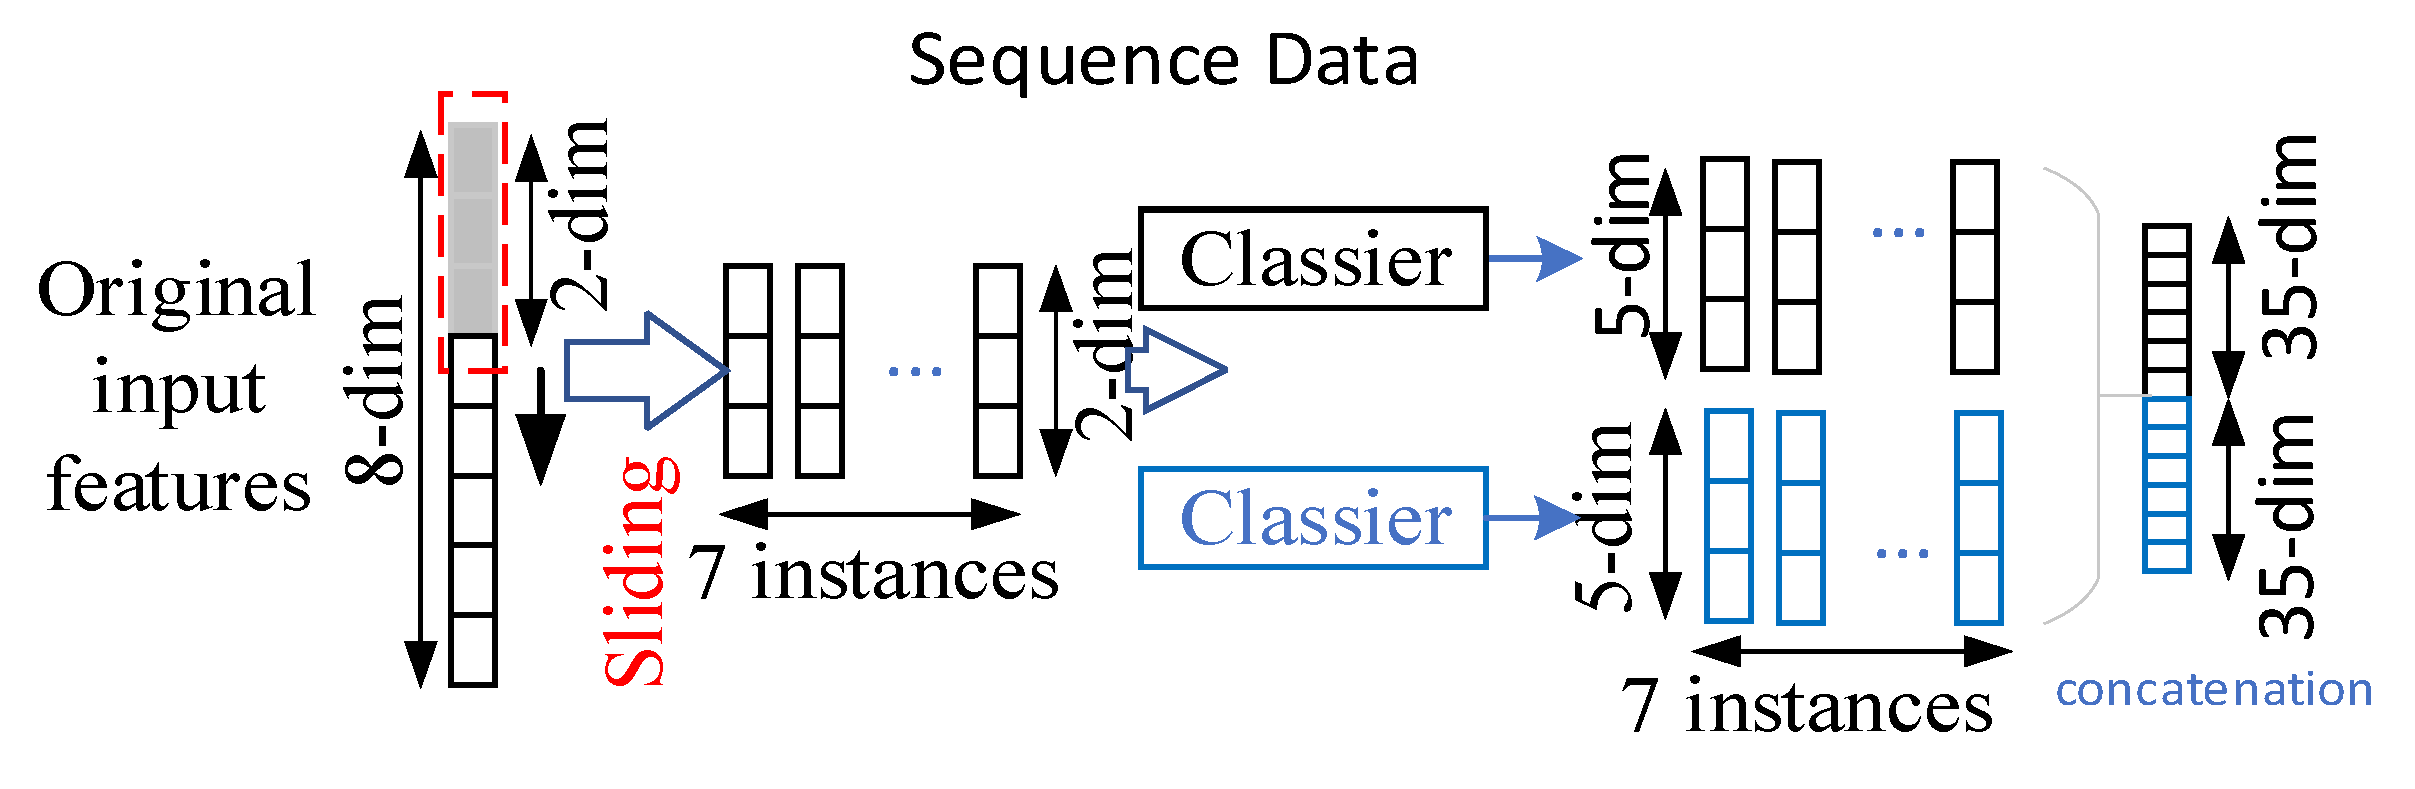
Firstly, we constructed a multi-granularity scanning structure. The eight-dimensional energy feature vector obtained by wavelet packet decomposition was input into the multi-granularity scanning structure. For the sequence data, two-dimensional, three-dimensional, and four-dimensional sliding windows were set to scan the original features. Taking 2D as an example, the process of multi-granularity scanning structure can be obtained, as shown in Figure 12.
For the sequence data of the five-classification problem, there were eight-dimensional original input features. In the case of step size 1, seven feature vectors can be obtained by scanning the input features using a sliding window of two-dimensional feature size. Inputting the seven two-dimensional feature vectors into the random forest A and completely random forest B, we found that seven five-dimensional transformed feature vectors can be generated. Finally, the class vectors generated by each forest were stitched together, and 70-dimensional transformed feature vectors corresponding to the original eight-dimensional input feature vectors can be output.
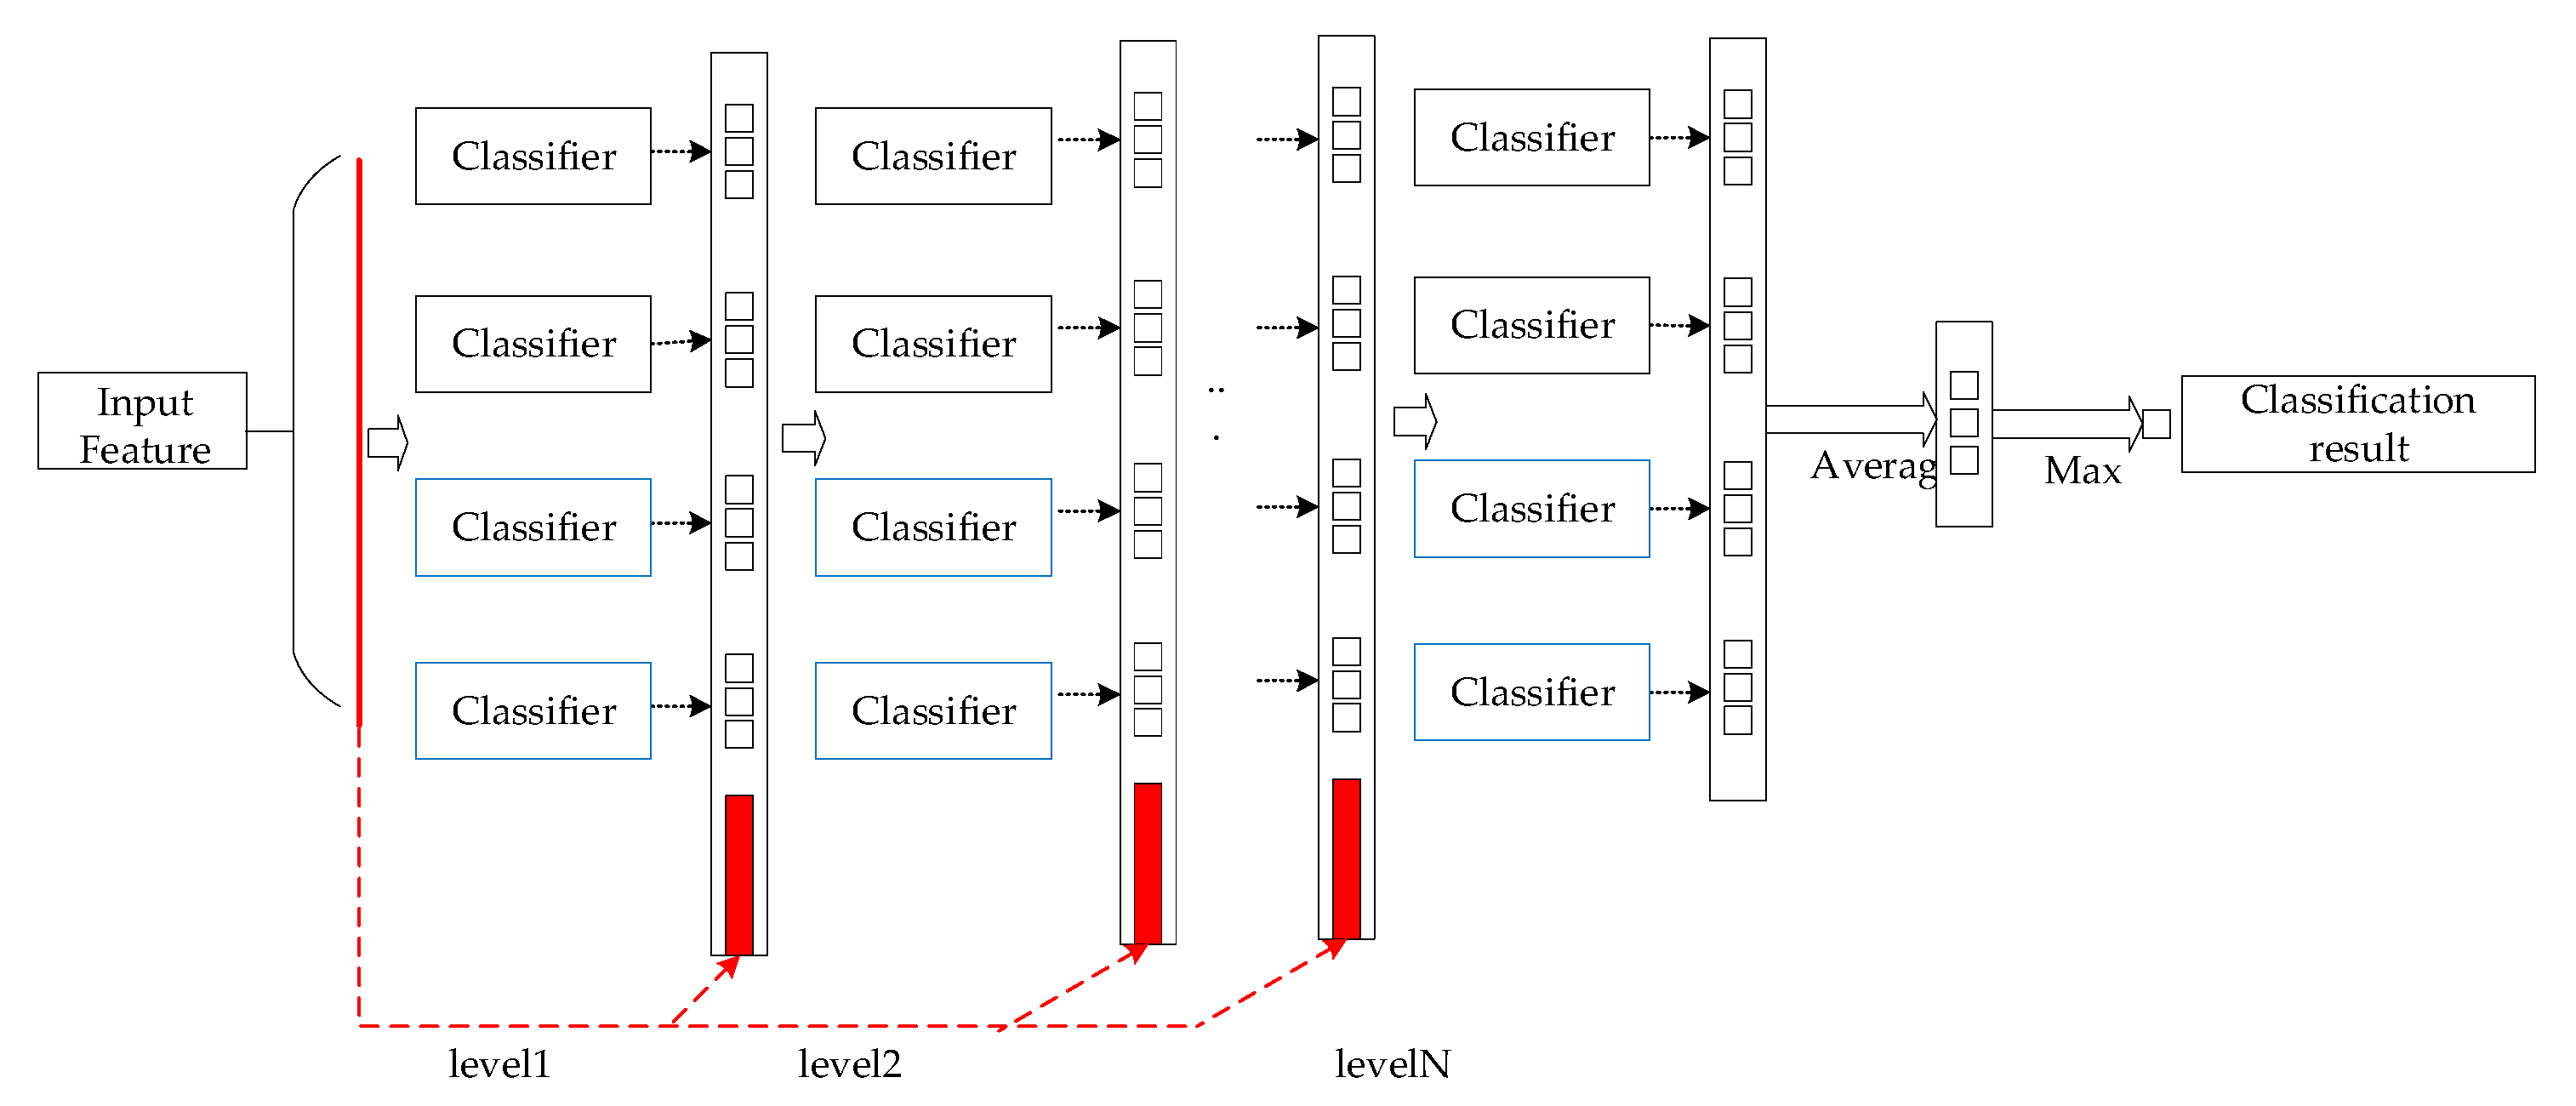
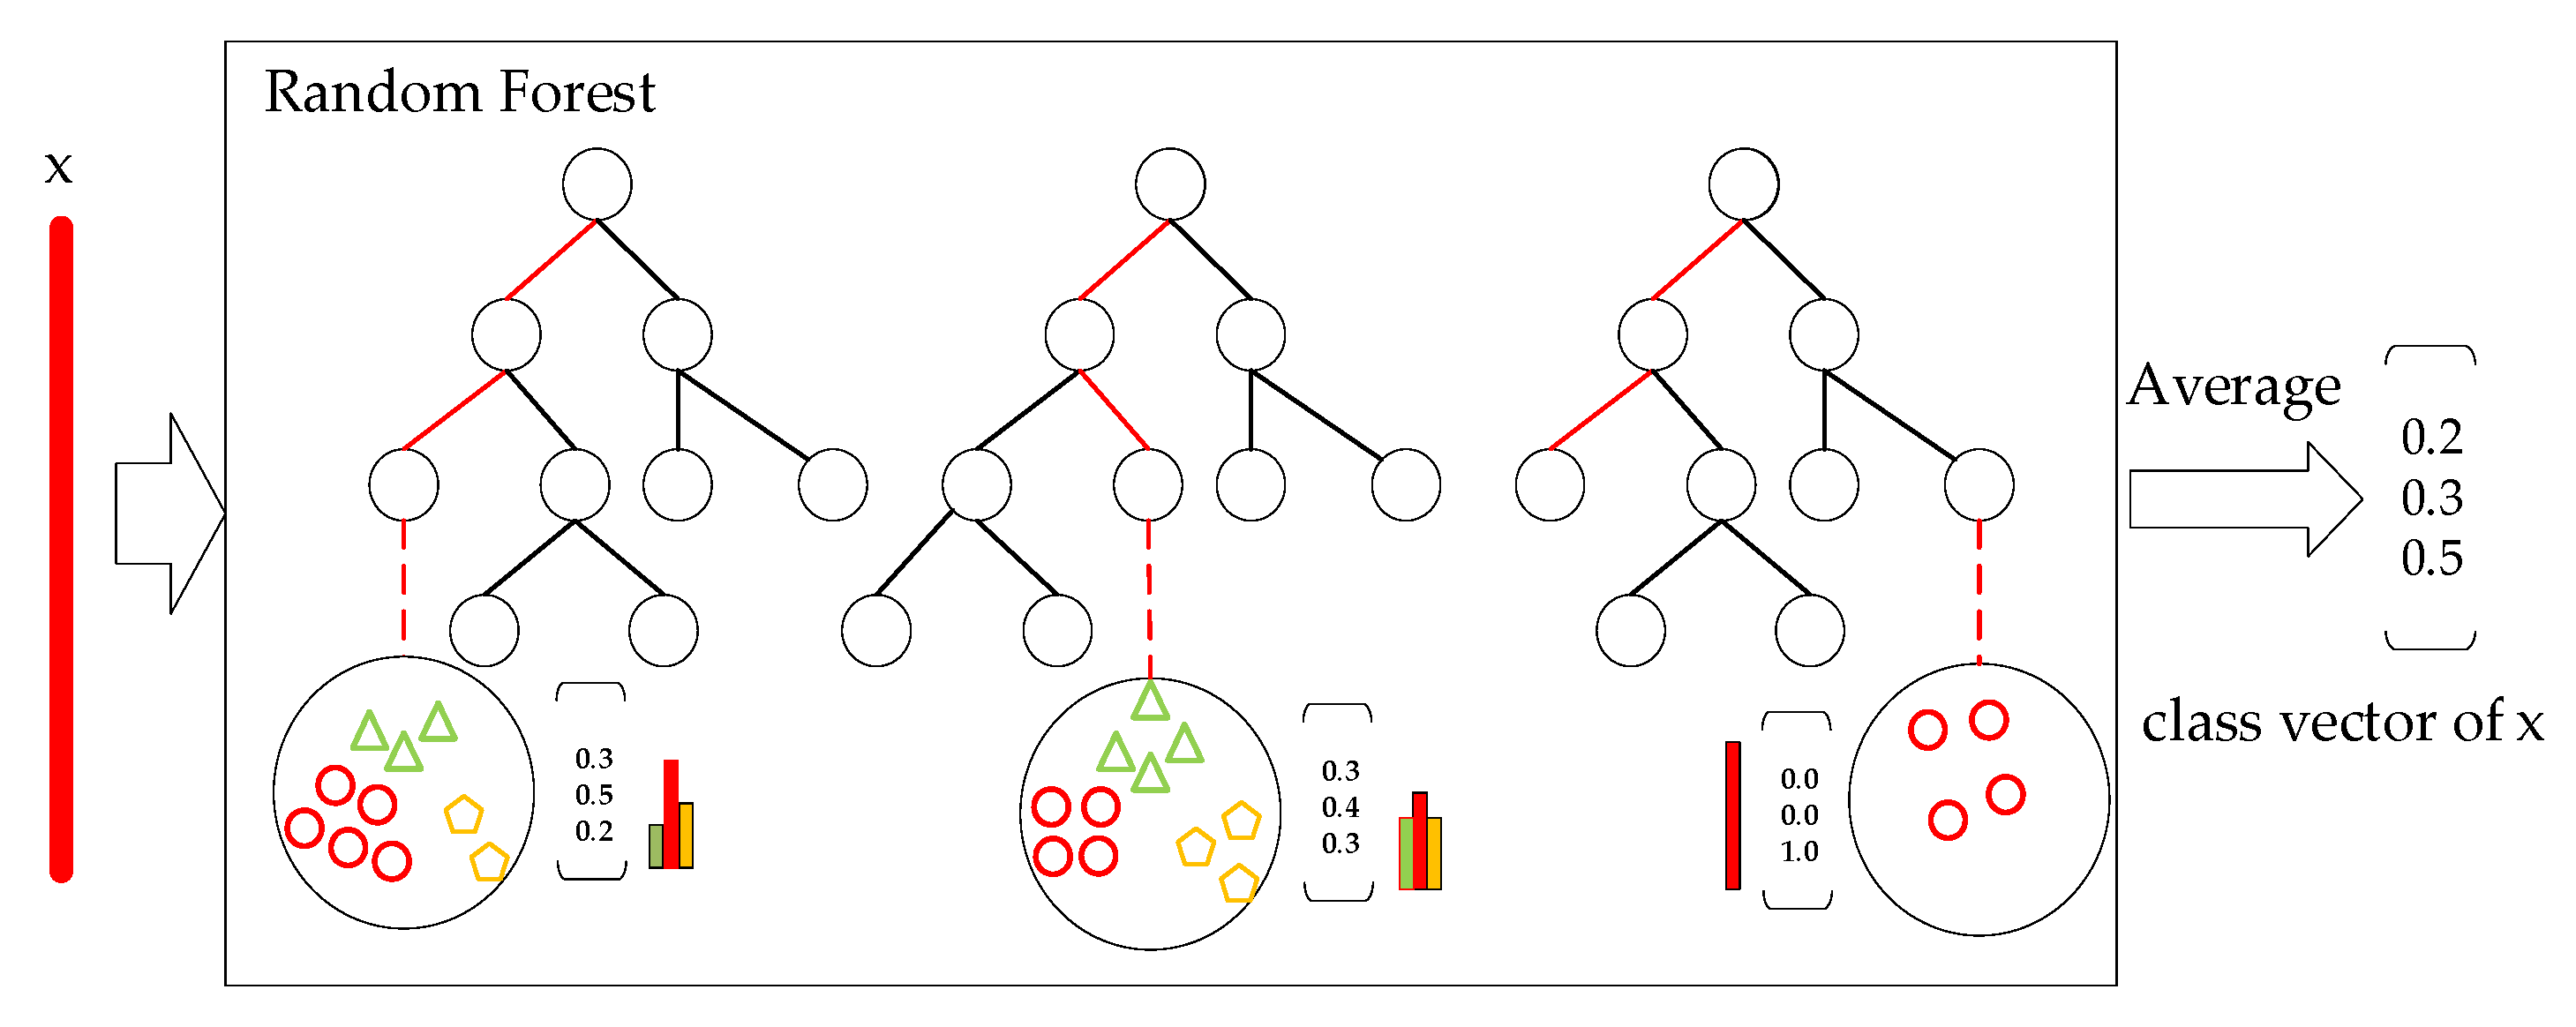
Then, the cascaded forest structure was constructed as shown in 
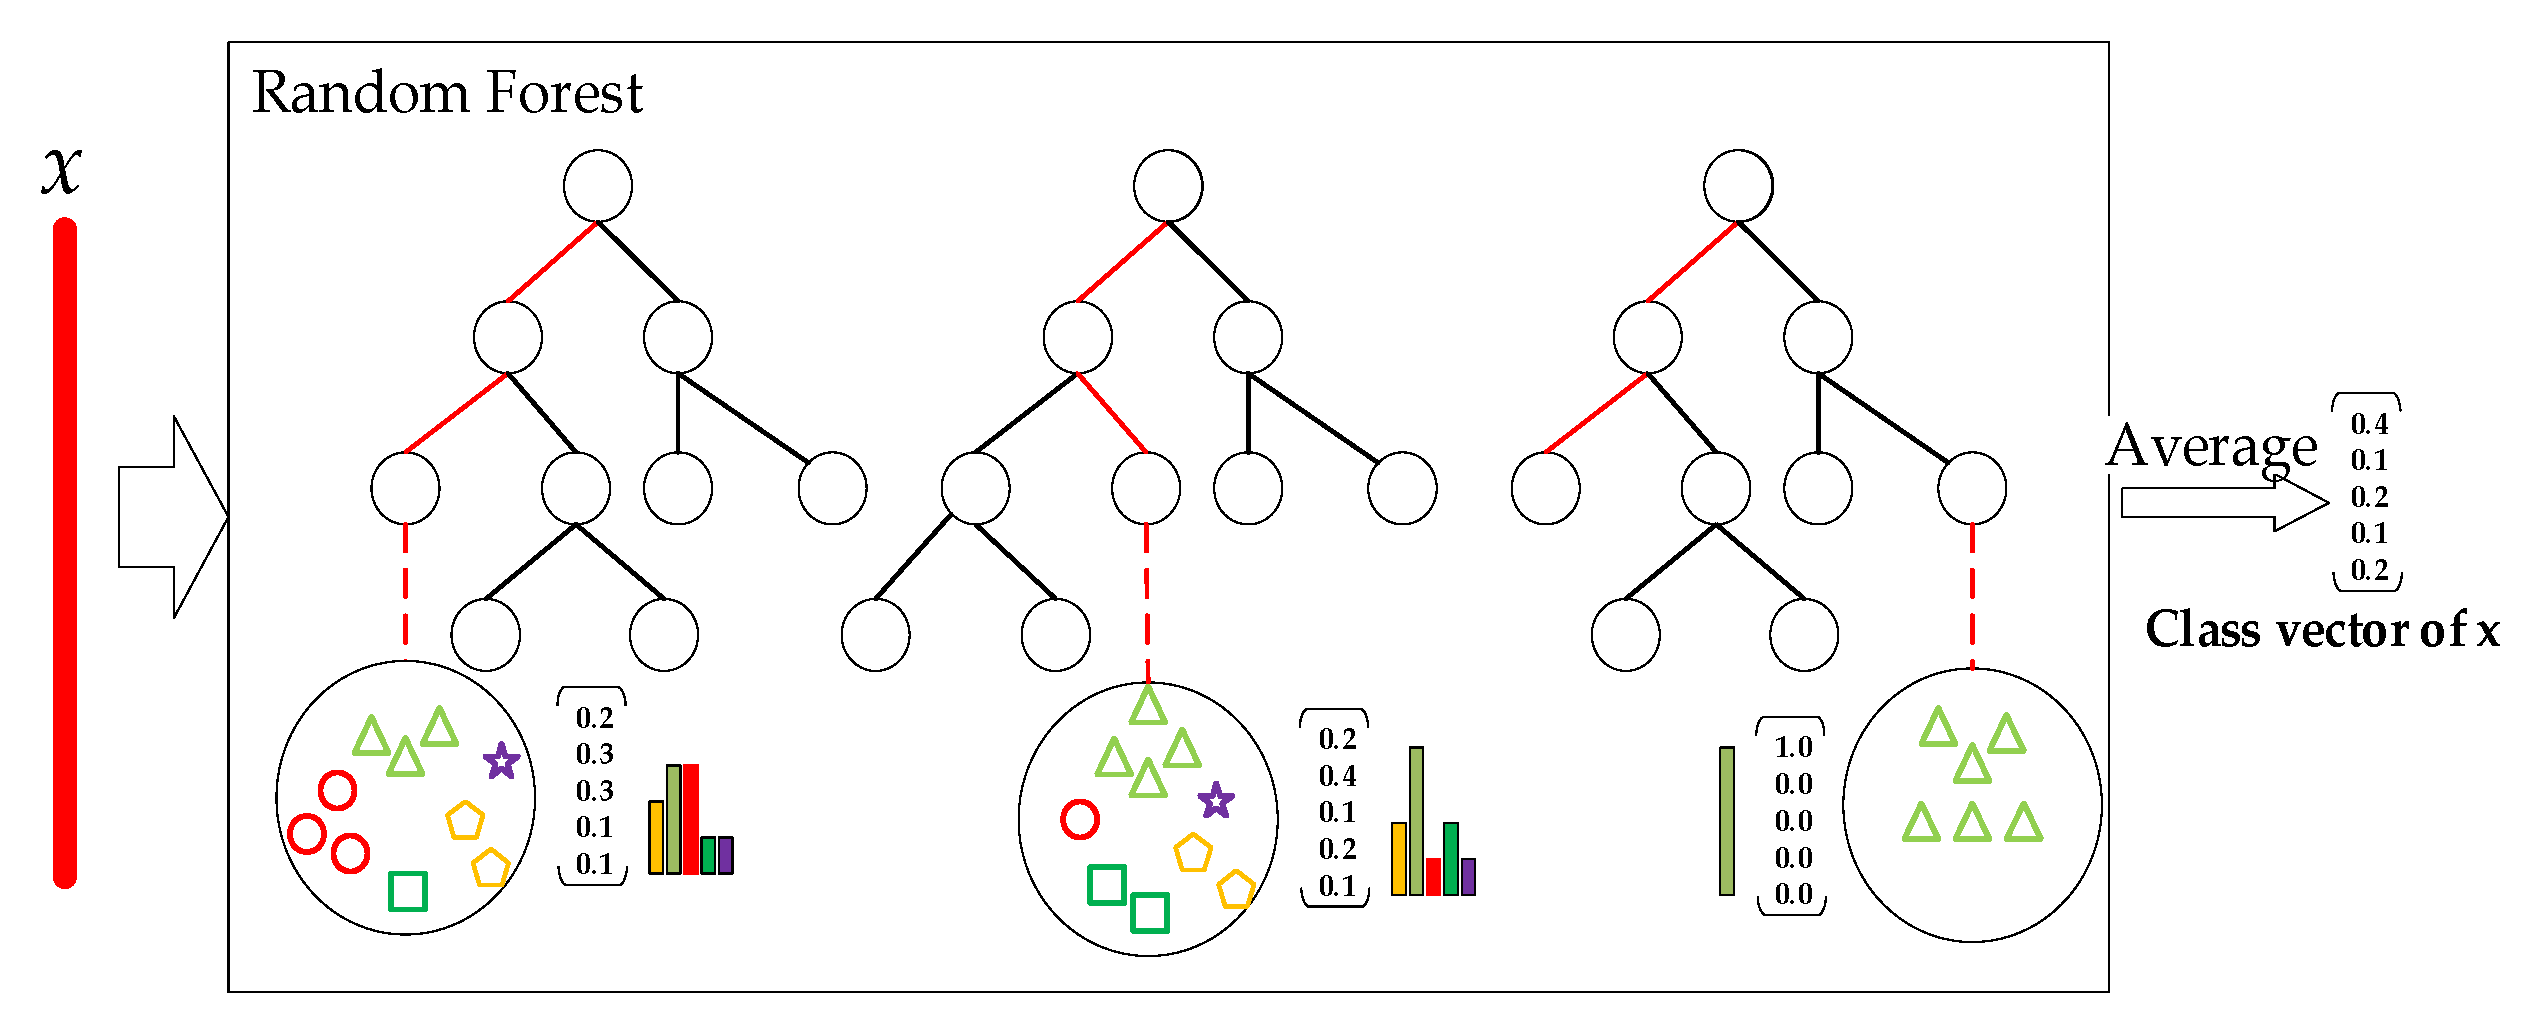
Figure 13. Each layer of the cascade forest structure was composed of multiple random forests. Each random forest contained multiple decision trees, and each tree outputted a result in the form of a class vector. The output of each decision tree was averaged, and the mean value was selected as the final prediction according to the maximum principle of the voting mechanism. The process of constructing a rolling bearing cascade forest structure was a five-category problem solving process, and the final output result of each random forest took the form of a probability of occurrence of a five-dimensional class vector. Therefore, taking the mean value of each decision tree output results in a five-dimensional class vector. The mean value with the highest probability of occurrence was selected as the final output of the model.
Finally, a fault diagnosis model of the rolling bearing of the main ventilator based on the deep forest was constructed, as shown in Figure 14.
As shown in Figure 14, the original input of the fault diagnosis of the rolling bearing of the main fan of deep forest was an eight-dimensional feature vector. In order to improve the feature diversity of the deep forest model, we used three sliding windows of different sizes in multi-granularity scanning, namely, two-dimensional, three-dimensional, and four-dimensional feature vectors. We used 2D feature window, 3D feature window, and 4D feature window to process sequence data samples and generate training sample data sets of seven, six, and five corresponding dimensions, respectively. Then, these training sample datasets were used to train Random Forest A1, Complete Random Forest A2, Random Forest B1, Complete Random Forest B2, Random Forest C1, and Complete Random Forest C2, respectively, which generated 70-dimensional, 60-dimensional, and 50-dimensional transform feature vector.
Then, we trained the results of the multi-granularity scan. The 70-dimensional transform feature vectors obtained from these two-dimensional sliding windows were input into the first-level cascade forest for training, and 20-dimensional augmented feature vectors were obtained. The 20-dimensional augmented feature vector was spliced with the 70-dimensional feature vector obtained from the original two-dimensional sliding window to obtain a 90-dimensional feature vector. Using these 90-dimensional feature vectors as the input data of the second-level cascading forest, we obtained the training results of the second-level cascading forest. Combining the training results of the second-level cascaded forest with the 60-dimensional feature vector obtained from the three-dimensional sliding window, we obtained the input data of the third-level cascading forest structure. Then, we concatenated the training results of the third-level cascade forest with the 50-dimensional feature vector obtained from the four-dimensional sliding window to obtain the input of the next layer. We repeated this process until the ideal classification result was obtained, and the training is ended. Finally, we took the average of the class vector results of each level to obtain the distribution probability of each class vector; took the maximum of it; and obtained the final output result, that is, we determined the type of fault diagnosis and the probability of occurrence of this type of fault.

4.4. Analysis of Results

We selected 560 sets of data samples to train the fault diagnosis model. Then, we selected the remaining 140 sets of data samples as the test set and carried out fault diagnosis experiments on the Python development platform to verify the effectiveness of the method proposed in this article. A set of fault diagnosis case results was selected for analysis, and an example of the fault diagnosis experiment result set is shown in Figure 15.
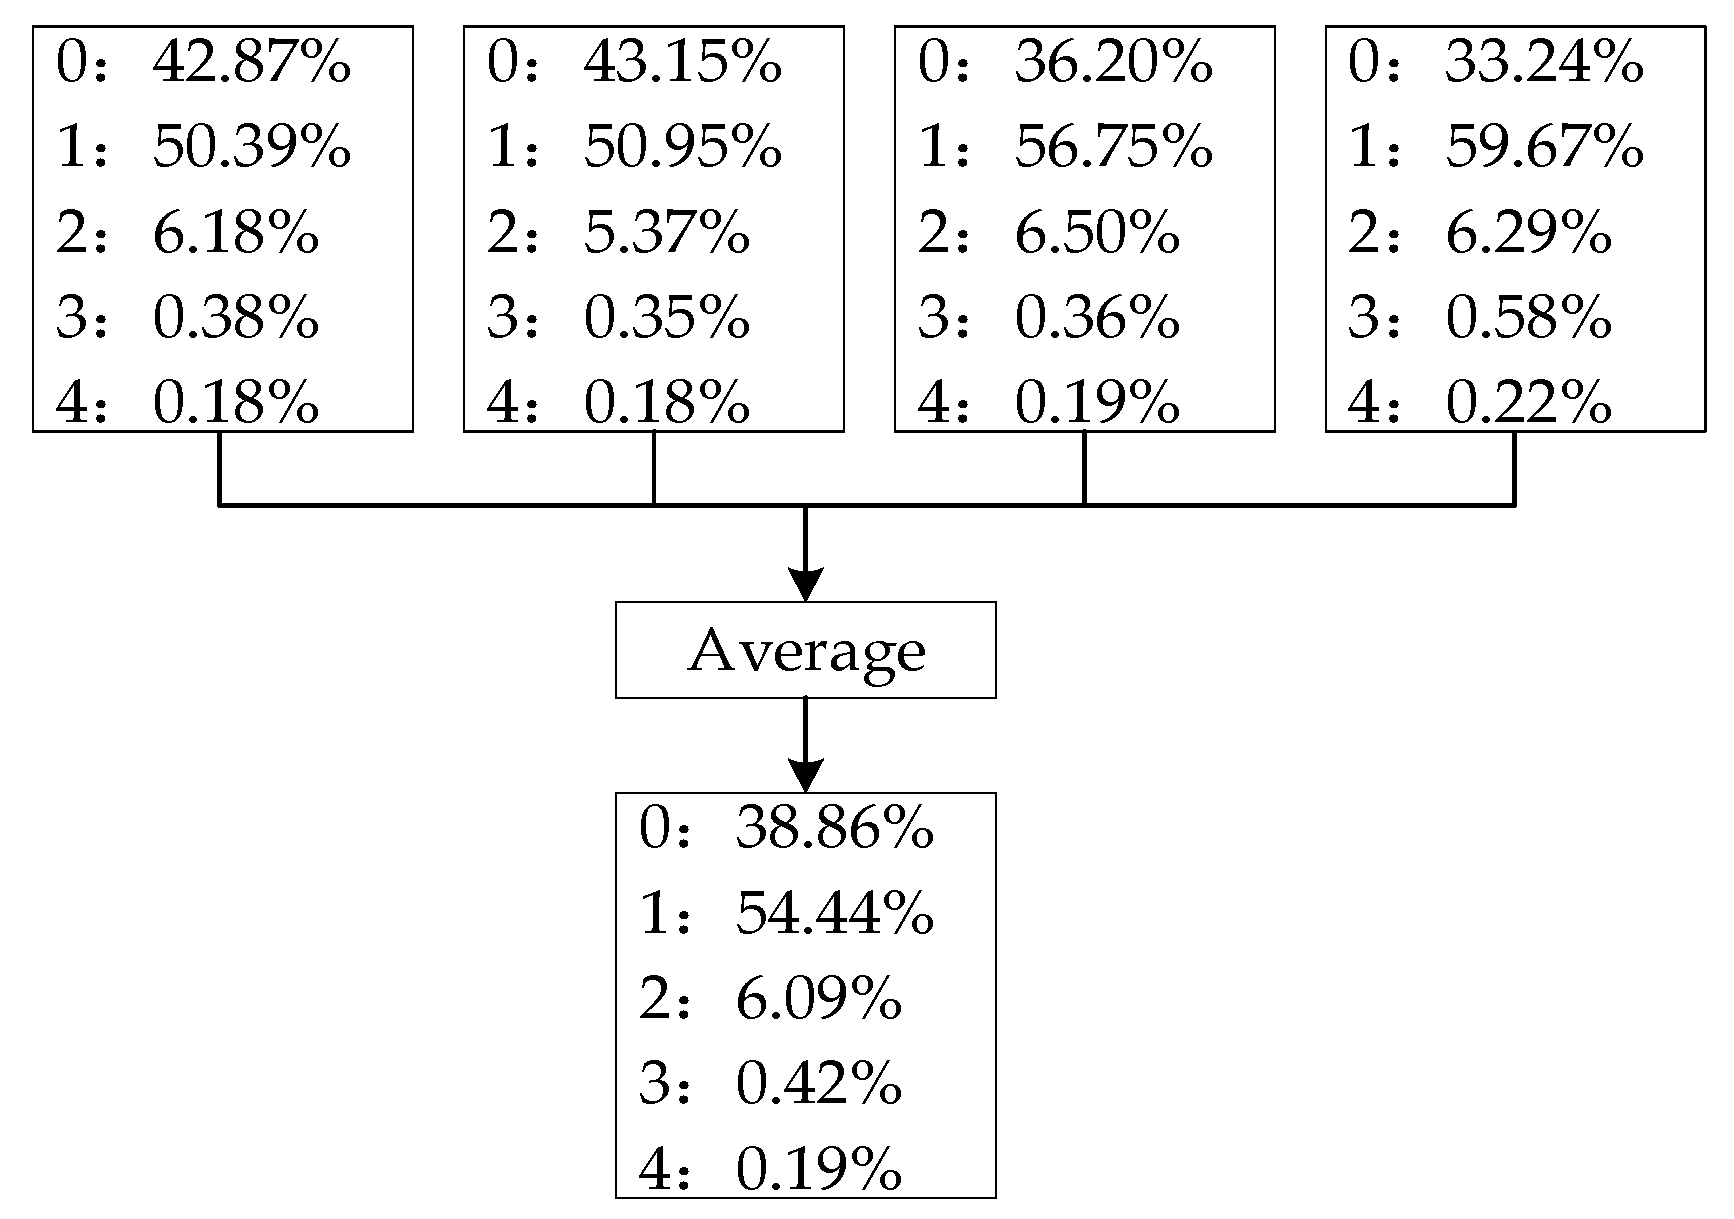
After the diagnosis model training was over, we took the results of the four random forest outputs as an example of the result vector set and obtained the result set s = {0:38.86%, 1:54.44%, 2:6.09%, 3:0.42%, 4:0.19%}; in accordance with the principle of maximizing the voting mechanism, the fault diagnosis result of this example was the Y1-type fault of the rolling bearing, that is, the inner ring fault, and the probability of its occurrence was found to be 54.44%.

4.5. Comparison Experiments

In order to verify the effectiveness of the method in this paper, we selected random forest algorithm, SVM, and BP network as the diagnostic comparison algorithms, and the rolling bearing data were trained according to the implementation process of the algorithm. We used the fault diagnosis training set to train the algorithm and used the test set to verify it. The results are shown in Table 4.
Comparing the fault recognition rates of the four methods, we found that the fault diagnosis model combining wavelet packet feature extraction and deep forest algorithm had significantly better fault diagnosis performance than random forest algorithm, SVM, and BP network when the same five health states were diagnosed. The average diagnostic accuracy of the method proposed in this article was as high as 98.5%. At the same time, when designing the fault diagnosis experiment, we found that the parameters of the deep forest did not need to be adjusted too much. The random forest algorithm, SVM, and BP network needed to adjust the parameters to improve the accuracy, which saved training time to a certain extent.

5. Conclusions

In this paper, a fault diagnosis method of rolling bearing based on wavelet packet analysis and deep forest was proposed, taking full advantage of the improved deep forest algorithm diagnosis ability. The following conclusions can be drawn:
(1)
In view of the fact that the vibration signal of the coal mine main ventilator often has the characteristics of non-stationary and vibration amplitude modulation, the wavelet packet analysis method was used to decompose the signal, and characteristic parameters that can accurately reflect the characteristics of the vibration signal were obtained. The results show that wavelet packet analysis can overcome the shortcomings of traditional feature extraction methods, decompose the time-domain plane of the vibration signal more finely, and at the same time improve the resolution of the high-frequency part of the vibration signal.
(2)
The deep forest algorithm was improved by introducing the wavelet packet analysis method, and the feature parameters after wavelet packet feature extraction were used as the input feature vector of the deep forest algorithm to achieve accuracy in the case of insufficient sample size and high model parameter settings.
(3)
In the process of processing the original data, wavelet packet feature extraction can save the time of multi-granularity scanning of the deep forest algorithm, thereby reducing the running time required for model training.
(4)
With small training samples, the diagnostic model proposed in this paper outperformed other types of diagnostic methods in terms of diagnostic accuracy, diagnostic speed, and model computational complexity, which verifies the superiority of the method proposed in this paper. Due to the limitation of data acquisition, the experimental data carried out in this paper were obtained from a coal mining company, and the extracted bearing speed was constant, which may directly lead to over-idealized experimental results close to 100%. Therefore, more kinds of sample data can be actively obtained in future studies. At the same time, this paper provides reasonable suggestions for fan safety managers to record specific information on bearing failures in a timely manner for better machine troubleshooting.

Author Contributions

Conceptualization, X.L. and Y.Z.; methodology, Y.Z.; software, Y.Z. and S.S.; validation, Y.Z., S.S., and F.W.; formal analysis, X.L.; investigation, Y.Z. and S.S.; resources, X.L.; data curation, Y.Z.; writing—original draft preparation, Y.Z.; writing—review and editing, X.L.; visualization, F.W. and S.S.; supervision, X.L.; project administration, X.L.; funding acquisition, X.L. All authors have read and agreed to the published version of the manuscript.

Funding

This research was supported by the National Key Research and Development Project of China (grant no. 2017YFC0804408).

Institutional Review Board Statement

Not applicable.

Informed Consent Statement

Not applicable.

Data Availability Statement

Not applicable.

Acknowledgments

The authors would like to acknowledge the support of the ShanDong Energy Group Xinglongzhuang coal mine.

Conflicts of Interest

The authors declare no conflict of interest.

References

  1. Chen, X.; Jiang, Y.; Zhou, B.; Zhan, H.; Li, H.; Lyu, G.; Sun, S. Early Weak Fault Diagnosis of Rolling Bearings Based on Fiber Bragg Grating Sensing Monitoring. Symmetry 2021, 13, 1473. [Google Scholar] [CrossRef]
  2. Xue, T.W.; Chun, Y.M.; Jing, F.Y.; Jing, S.X.; Yian, Y.C.; Leng, J.F. Research and application on vibration fault diagnosis of mine Fan bearing. Coal. Mine Mach. 2013, 4, 45–49. [Google Scholar]
  3. Jun, Q.L.; Zhen, P.W.; Depot, D.L. Application research of thermal balance in bearing temperature analysis for locomotive traction motor. Rail. W. Loco Mot. Car 2019, 11, 57–64. [Google Scholar]
  4. Wei, S.; Yu, X.C.; Jia, D.Z.; Guo, Z.L. Research on measurement results consistency method of rolling bearing vibration measuring instrument. Mech. Eng. 2019, 5, 130–135. [Google Scholar]
  5. Wang, W.; Du, Y.; Chau, K.; Chen, H.; Liu, C.; Ma, Q. A Comparison of BPNN, GMDH, and ARIMA for Monthly Rainfall Forecasting Based on Wavelet Packet Decomposition. Water 2021, 13, 2871. [Google Scholar] [CrossRef]
  6. Wang, H.; Wang, W.; Du, Y.; Xu, D. Examining the Applicability of Wavelet Packet Decomposition on Different Forecasting Models in Annual Rainfall Prediction. Water 2021, 13, 1997. [Google Scholar] [CrossRef]
  7. Balasubramanian, G.; Kanagasabai, A.; Mohan, J.; Seshadri, N.P.G. Music induced emotion using wavelet packet decomposition—An EEG study. Biomed. Signal Process. Control 2018, 42, 115–128. [Google Scholar] [CrossRef]
  8. Abdourahamane, Z.S.; Acar, R.; Serkan, S. Wavelet-copula-based mutual information for rainfall forecasting applications. Hydrol. Process. 2019, 33, 1127–1142. [Google Scholar] [CrossRef]
  9. Yin, Y.; Bai, Y.; Ge, F.; Yu, H.; Liu, Y. Long-term robust identification potential of a wavelet packet decomposition based recursive drift correction of E-nose data for Chinese spirits. Measurement 2019, 139, 284–292. [Google Scholar] [CrossRef]
  10. Yan, L.; Xia, W.; Zhao, Z.; Wang, Y. A Novel Approach to Unsupervised Change Detection Based on Hybrid Spectral Difference. Remote Sens. 2018, 10, 841. [Google Scholar] [CrossRef] [Green Version]
  11. Trivedi, S.K. A study on credit scoring modeling with different feature selection and machine learning approaches. Technol. Soc. 2020, 63, 101413. [Google Scholar] [CrossRef]
  12. Wang, C.; Han, D.; Liu, Q.; Luo, S. A Deep Learning Approach for Credit Scoring of Peer-to-Peer Lending Using Attention Mechanism LSTM. IEEE Access 2019, 7, 2161–2168. [Google Scholar] [CrossRef]
  13. Guo, S.; He, H.; Huang, X. A Multi-Stage Self-Adaptive Classifier Ensemble Model with Application in Credit Scoring. IEEE Access 2019, 99, 78549–78559. [Google Scholar] [CrossRef]
  14. Papouskova, M.; Hajek, P. Two-stage consumer credit risk modelling using heterogeneous ensemble learning. Decis. Support Syst. 2019, 118, 33–45. [Google Scholar] [CrossRef]
  15. Zhou, Z.H.; Feng, J. Deep forest: Towards an alternative to deep neural networks. arXiv 2017, arXiv:1702.08835. [Google Scholar]
  16. Zhang, J.; Song, H.; Zhou, B. SAR Target Classification Based on Deep Forest Model. Remote Sens. 2020, 12, 128. [Google Scholar] [CrossRef] [Green Version]
  17. Ma, W.; Yang, H.; Wu, Y.; Xiong, Y.; Hu, T.; Jiao, L.; Hou, B. Change Detection Based on Multi-Grained Cascade Forest and Multi-Scale Fusion for SAR Images. Remote Sens. 2019, 11, 142. [Google Scholar] [CrossRef] [Green Version]
  18. Zhang, Y.; Song, Y.; Wang, Y.; Qu, H. A fast training method for SAR large scale samples based on CNN for targets recognition. In Proceedings of the 2018 11th International Congress on Image and Signal Processing, BioMedical Engineering and Informatics (CISP-BMEI), Beijing, China, 13–15 October 2018; pp. 1–5. [Google Scholar]
  19. Li, G.; Ma, H.-D.; Liu, R.-Y.; Shen, M.-D.; Zhang, K.-X. A Two-Stage Hybrid Default Discriminant Model Based on Deep Forest. Entropy 2021, 23, 582. [Google Scholar] [CrossRef] [PubMed]
  20. Dong, Y.; Yang, W.; Wang, J.; Zhao, J.; Qiang, Y. MLW-gcForest: A Multi-Weighted gcForest Model for Cancer Subtype Classification by Methylation Data. Appl. Sci. 2019, 9, 3589. [Google Scholar] [CrossRef] [Green Version]
  21. Xu, X.; Su, B.; Zhao, X.; Xu, Z.; Sheng, Q.Z. Effective traffic flow forecasting using taxi and weather data. In Proceedings of the ADMA 2016 Advanced Data Mining and Applications: 12th International Conference, Gold Coast, Australia, 12–15 December 2016; pp. 507–519. [Google Scholar]
  22. Zhao, D.; Wang, H.; Wang, D.; Zhu, R.; Zhang, J. Quantitative classification of near-fault ground motions selected by energy indicators. Structures 2022, 35, 780–791. [Google Scholar] [CrossRef]
Figure 1. Example of cascading forest structure.
Symmetry 14 00267 g001
Figure 2. Flow chart of the generation process of x-type vectors.
Symmetry 14 00267 g002
Figure 3. Multi-granularity scanning structure diagram.
Symmetry 14 00267 g003
Figure 4. The construction process of the deep forest algorithm.
Symmetry 14 00267 g004
Figure 5. Three-layer wavelet packet decomposition structure diagram.
Symmetry 14 00267 g005
Figure 6. Fault diagnosis flowchart based on wavelet packet–deep forest algorithm.
Symmetry 14 00267 g006
Figure 7. FBCDZ-8-No34 counter-rotating axial flow coal mine main fan.
Symmetry 14 00267 g007
Figure 8. Rolling bearing failure sketch. (a) Outer fault. (b) Roller fault. (c) Inner fault. (d) Multiple fault.
Symmetry 14 00267 g008
Figure 9. Time domain diagrams of rolling bearings in different health states. (a) Time domain characteristic curve of rolling bearing inner ring failure. (b) Time domain characteristic curve of rolling bearing rolling element failure. (c) Time domain characteristic curve of rolling bearing outer ring failure. (d) Time domain characteristic curve of normal rolling bearing. (e) Time domain characteristic curve of rolling bearing cage failure.
Symmetry 14 00267 g009
Figure 10. The frequency spectrum diagrams of rolling bearings in different health states. (a) The frequency spectrum characteristic curve of rolling bearing cage failure. (b) The frequency spectrum characteristic curve of normal rolling bearing. (c) The frequency spectrum characteristic curve of rolling bearing inner ring failure. (d) The frequency spectrum characteristic curve of rolling bearing outer ring failure. (e) The frequency spectrum characteristic curve of rolling bearing rolling element failure.
Symmetry 14 00267 g010
Figure 11. Wavelet packet energy feature extraction diagram under different health conditions.
Symmetry 14 00267 g011
Figure 12. Construction process of multi-granularity scanning structure under a 2D window.
Symmetry 14 00267 g012
Figure 13. Construction process of rolling bearing cascade forest structure.
Symmetry 14 00267 g013
Figure 14. Fault diagnosis model of rolling bearing of main fan based on deep forest.
Symmetry 14 00267 g014
Figure 15. Example of fault diagnosis experiment result set.
Symmetry 14 00267 g015
Table 1. Rolling bearing health status, label coding, and data volume.
Bearing HealthOutput Fault Feature VectorLabel CodingSample Data Volume
NormalY00200
Inner ring failureY11100
Outer ring failureY22100
Rolling element failureY33100
Cage failureY44200
Table 2. Example of training samples for fault diagnosis of rolling bearings.
SequenceX1X2X3X4X5X6X7X8
13.49675 4.11059 0.50377 0.03127 0.00538 0.00196 0.00692 0.00042
24.54889 5.37067 0.56598 0.03524 0.00737 0.00338 0.00993 0.00038
33.07404 4.81892 0.55283 0.02923 0.00967 0.00203 0.00421 0.00048
42.82427 5.07006 0.53398 0.04956 0.00830 0.00259 0.00744 0.00051
53.88341 4.76665 0.59680 0.02818 0.00862 0.00215 0.00885 0.00056
63.53033 5.21762 0.55549 0.03266 0.00747 0.00275 0.00539 0.00047
72.05621 5.74676 0.57124 0.02189 0.00679 0.00266 0.00494 0.00034
82.35862 4.48616 0.59588 0.02411 0.00680 0.00242 0.00870 0.00038
92.04554 4.71590 0.64898 0.04372 0.00720 0.00252 0.00840 0.00045
102.95269 4.38476 0.53543 0.02320 0.00798 0.00216 0.01013 0.00060
Table 3. Example of training sample for fault diagnosis of rolling bearing after normalization processing.
SequenceX1X2X3X4X5X6X7X8
10.42868 0.50393 0.06176 0.00383 0.00066 0.00024 0.00085 0.00005
20.43151 0.50946 0.05369 0.00334 0.00070 0.00032 0.00094 0.00004
30.36202 0.56751 0.06510 0.00344 0.00114 0.00024 0.00050 0.00006
40.33240 0.59671 0.06285 0.00583 0.00098 0.00031 0.00088 0.00006
50.41779 0.51281 0.06420 0.00303 0.00093 0.00023 0.00095 0.00006
60.37749 0.55790 0.05940 0.00349 0.00080 0.00029 0.00058 0.00005
70.24447 0.68326 0.06792 0.00260 0.00081 0.00032 0.00059 0.00004
80.31519 0.59951 0.07963 0.00322 0.00091 0.00032 0.00116 0.00005
90.27373 0.63108 0.08685 0.00585 0.00096 0.00034 0.00112 0.00006
100.37296 0.55384 0.06763 0.00293 0.00101 0.00027 0.00128 0.00008
Table 4. Comparison of experimental results of rolling bearing fault diagnosis.
Health StatusSample SizeSVMBPRandom ForestDeep Forest
Normal40908090100
Inner ring failure208087.58095
Outer ring failure20858090100
Rolling element failure20907590100
Cage failure40857587.597.5
Average accuracy rate 8879.585.598.5
Publisher’s Note: MDPI stays neutral with regard to jurisdictional claims in published maps and institutional affiliations.

