1. Introduction
The physical, chemical, and biological properties and functionalities of a material can depend very strongly on the crystallographic structure of the compound and not only on its chemical composition. In material sciences the physical properties of graphite and diamond are fundamentally different while both are constituted of only carbon atoms. The 3-dimensional bonding scheme and electronic structure of diamond lead to a transparent crystal of high thermal and low electrical conductivity while the 2-dimensional bonding in graphite is responsible for the high light absorbance, and low thermal and relatively high electric conductivity. In chemistry and life sciences enantiomers, molecules with the same chemical formula, but a different “handedness” behave differently as for example D-asparagine has a sweet taste, while the natural occurring L-asparagine is tasteless. In addition, for pharmaceuticals the exact crystalline state of an active agent is often critical for its bio-availability.
It is therefore paramount to gain as much insight into the structure of a compound as possible in order to fully understand its properties. Over the last century, many different X-ray diffraction (and later on neutron diffraction) techniques have been developed for this purpose and an astounding number of crystal structures have been solved. More recently, electron diffraction in a transmission electron microscope (TEM) has been employed in crystallography, especially in cases where it was impossible to grow single crystals big enough for X-ray diffraction. In these cases, one can take advantage of the strong interaction of electrons with matter which allows using crystals that are only a few tens of nanometers in diameter. Especially for beam sensitive materials another advantage of electron over X-ray diffraction is the fact that for the same amount of beam damage, electron diffraction yields more information than X-rays [
1].
Especially 3D electron diffraction methods have been very successful in the recent years. Different variants of 3D electron diffraction (3D ED) have been developed using either stepwise acquisition of diffraction frames [
2,
3,
4] or data acquisition while continuously rotating the sample (continuous rotation electron diffraction) [
5]. In both cases the acquisition is automatized and therefore more rapid than manually recording the data, however, the displacement of the sample during the tilting meant that a re-centering step had to be included in between recorded frames. The so-called fast electron diffraction tomography [
6] overcame this constraint by calibrating the displacement of the sample during the tilt before the experiment and then programming the incident beam shift accordingly, so that the beam followed the displacement of the crystal. A comprehensive review of 3D ED method can be found in a paper by Gemmi et al. [
7].
All of these methods have allowed structure solutions of different types of crystals including beam sensitive materials like small molecules or zeolites and also the refinement of these structures [
8,
9]. However, there are structures that are even more beam sensitive such as some metal-organic-frameworks (MOF) or biological crystals. Even in these cases some structures have been solved from 3D ED [
10,
11]. Beam damage results in a loss of crystallinity and lower resolution data as reflections lose their intensity [
12]. For these materials, a 3D ED method where the irradiation dose is minimized is necessary. Low-dose electron diffraction tomography (LD-EDT) [
13] is such a method and in this manuscript we present a variety of examples of crystal structures that have been solved with this method. While the structure solution does not require very precisely measured diffraction intensities [
14], the quality of the data collection is important for the subsequent structure refinement. We also present the refinement results using the LD-EDT data.
2. Experimental
For the data acquisition the samples were dispersed in powder form on a copper grid covered with a holey amorphous carbon film. The electron diffraction data were obtained on a Philips CM300ST transmission electron microscope (TEM). The TEM is equipped with a Bruker AXS EDX, a Nanomegas spinning star precession module, a TVIPS F416 CMOS camera, and an in-house modified single tilt sample holder that allows tilt angles up to ±55°.
The chosen LD-EDT method [
13] is based on a tomography of the reciprocal space. An isolated particle of the powder is selected for data acquisition. The size of the crystal should typically be between several tens of nanometers and around a micron. The crystal is then carefully adjusted at the eucentric height of the goniometer in order to move as little as possible during the tomography. Without any prior orientation of the crystal, it is then placed inside a large selected area aperture (typically 2 µm in apparent diameter). The tomography data are then recorded over a large angular domain (usually between 60° and 110°) in discrete steps of typically 1°. In order to fully integrate the intensities over the reciprocal rods we applied precession to the diffraction [
15] with a precession half-angle of 1.05°. In order to minimize the electron dose, the sample undergoes during the data acquisition, the electron beam was blanked at all times except for the recording of the diffraction frames. For more details about the LD-EDT method see [
13].
After each tomography an image of the vacuum close to the sample was recorded in the same illumination conditions as used for a single frame of the tomography. Knowing the number of counts on the camera created by a single incident electron the electron dose for an individual diffraction frame was determined. The total dose used for the experiment is then obtained by multiplying the dose per frame with the number of frames.
The values of the experimental parameters are given in
Table 1. Starting from the recorded frames the indexing and reconstruction of the 3-dimensional reciprocal lattice was done using the PETS2 software [
16]. The structure solution was then attempted by SIR2014 [
17] and Superflip [
18] embedded into Jana2006 [
19]. For the refinement based on the dynamical theory of diffraction Jana2006 was used.
3. Results
In this manuscript we present the results on the structure solution and refinement of four compounds. The first compound, Sr
5CuGe
9O
24, is not beam sensitive and a low-dose technique is not really necessary for diffraction experiments on this crystal. Its rather complex structure for an oxide with 22 independent atom positions [
20] and good crystalline quality makes it a good test structure for our method in order to determine the minimal dose necessary for structure solution and refinement.
The second compound Mn-formiate ([Mn(HCOO)
2(H
2O)
2]
∞, is a metal-organic framework (MOF) structure [
21]. This MOF is known for its beam sensitivity and even though its structure is not very complex the solution and refinement of this structure is a real application of LD-EDT.
The third compound was a new germanium-based garnet-like structure containing Na atoms and presenting a site with mixed Na/Mn occupancy. In this case we were able to refine the Na/Mn ratio.
Finally, LD-EDT has been applied to solve a previously unknown mineral structure, bulachite [Al
6(AsO
4)
3(OH)
9(H
2O)
4]⋅2H
2O [
22]. This mineral contains unbound water molecules which make it beam sensitive.
3.1. Structure Solution
The program PETS2 yields the unit cell parameters and the sections of the reconstructed 3-dimensional reciprocal lattice. From the systematic extinctions observed on these sections the possible space groups can be deduced. The structure solution is then attempted using the SIR2014 and Superflip programs embedded into the Jana2006 suite.
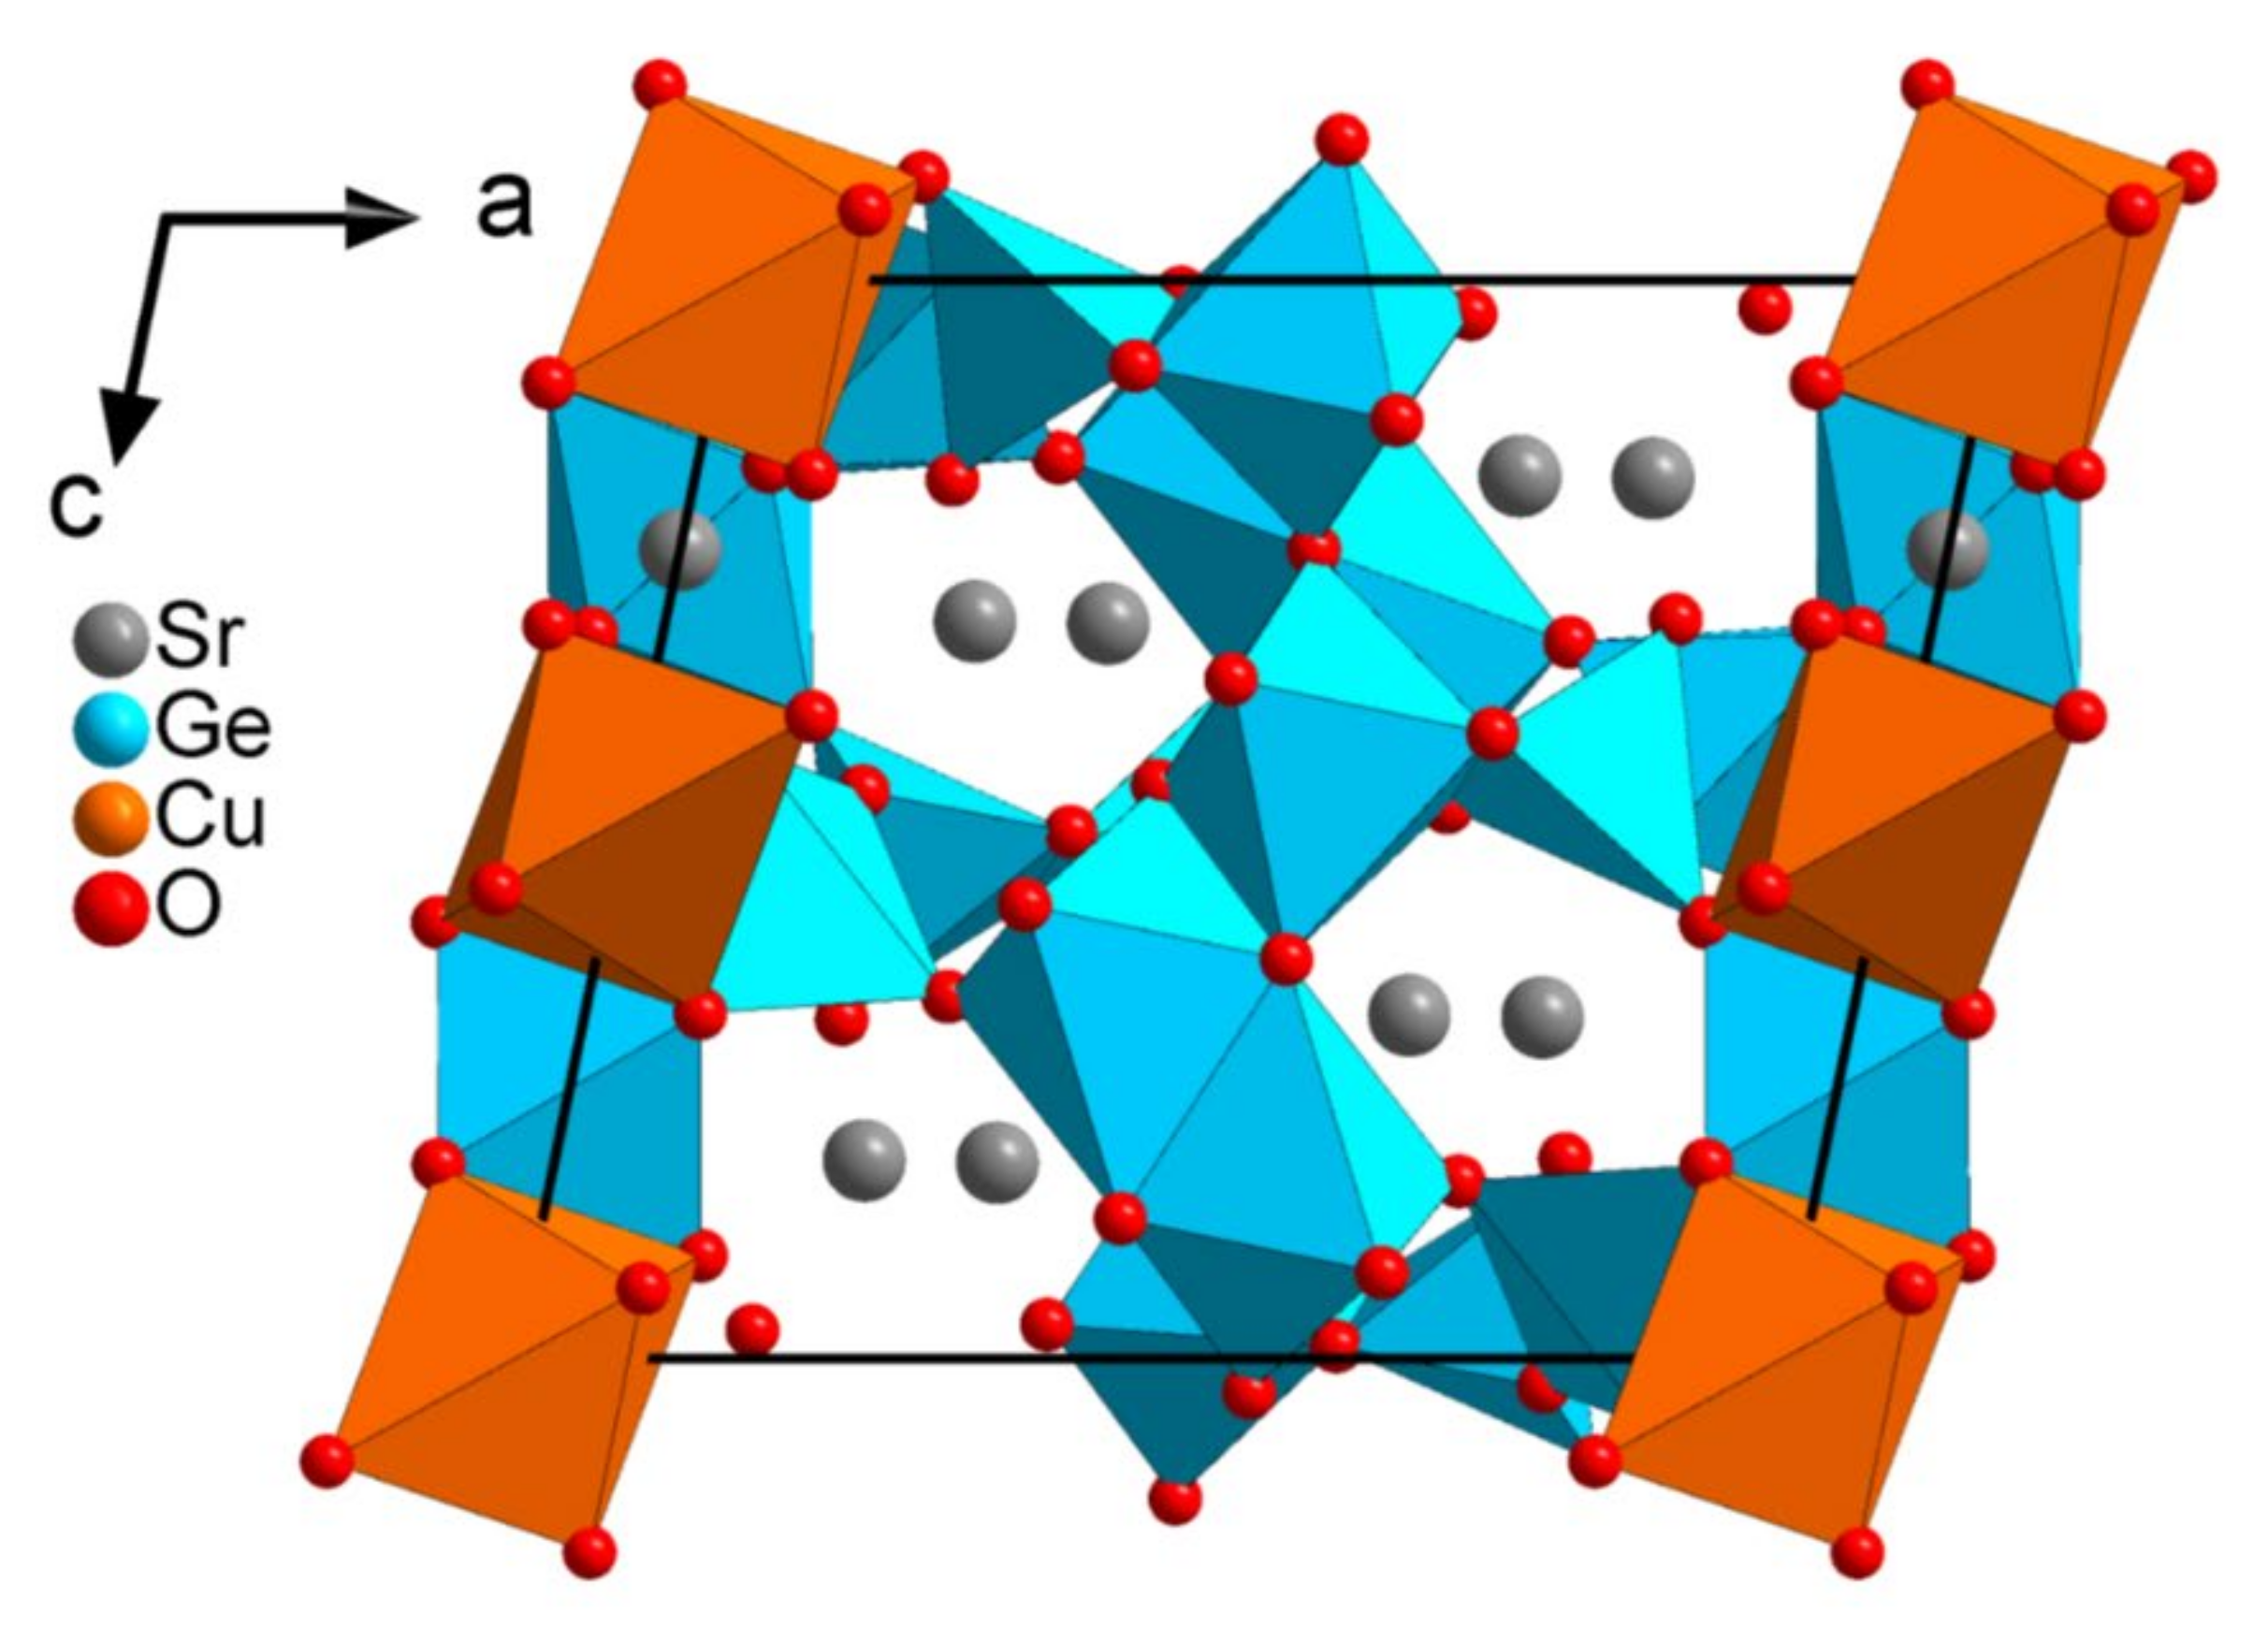
3.1.1. Sr5CuGe9O24
The unit cell was determined to be monoclinic with cell parameters
a = 12.20 Å,
b = 8.39 Å,
c = 10.57 Å and β = 101.6°.
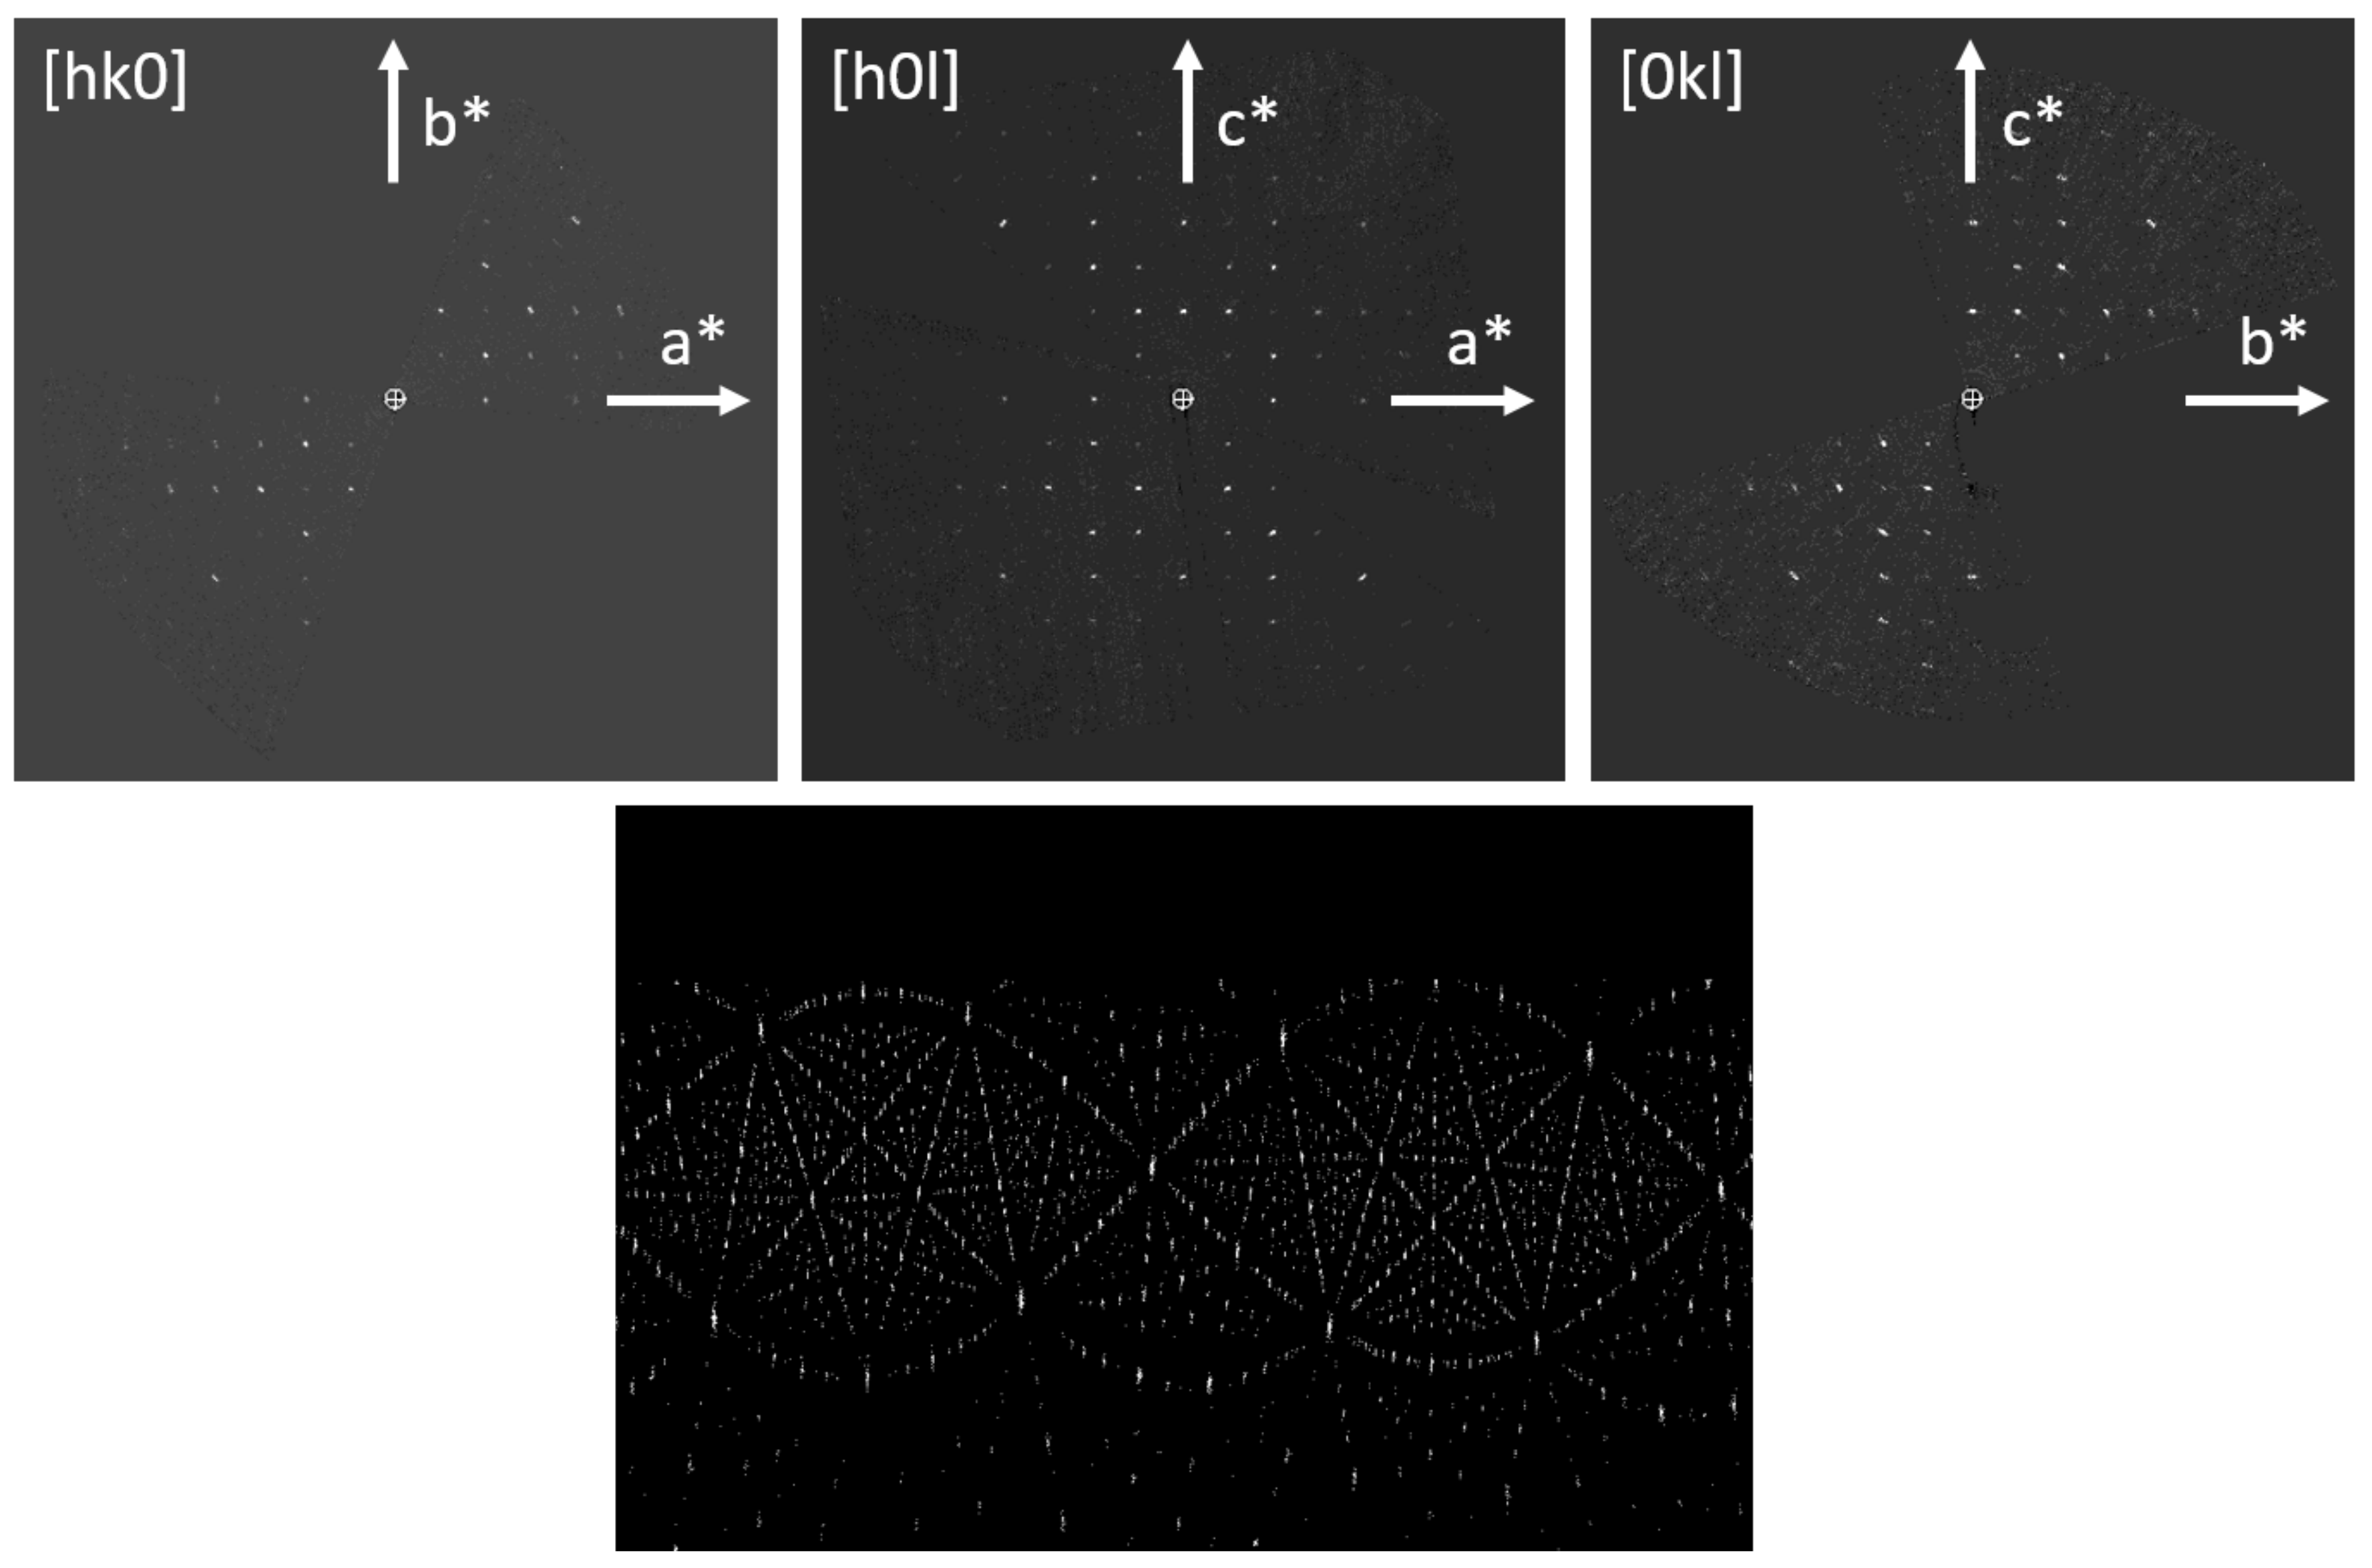
Figure 1 shows the sections
hk0,
h0
l, and 0
kl of the reconstructed 3D reciprocal lattice and the cylindrical projection of the intensity clusters used for the refinement of the tilt axis orientation. From the systematic absences (
hkl: none,
h0
l:
l = 2
n) the possible space groups
Pc and
P2/c were deduced. The best structure solution results were obtained by SIR2014 in space group
P2/c. The data set contains 1775 independent reflections representing a completeness of 69% up to a resolution of 0.8 Å.
The structure solution obtained by SIR2014 with a final residual value
R = 30 % contained all atom positions (cf.
Table 2). The three positions with the highest peaks in the potential map correspond to the heaviest ions (Sr), followed by the 5 positions for Ge and the single position for Cu. The next 13 positions are indeed the correct positions for the oxygen ions. The following 3 positions also interpreted as oxygen by SIR2014 have significantly lower peak heights in the potential map and are spurious peaks. The projection along the b-axis of the resulting structure is shown in
Figure 2.
Comparing these results with the atom positions refined from X-ray diffraction, one can see in
Table 2 that the average distance for the cations is 0.027 Å and for the oxygen it is 0.173 Å. The high accuracy of the positions obtained in the structure solution indicates already the high quality of the diffraction data.
3.1.2. Mn-Formiate ([Mn(HCOO)2(H2O)2]∞
The unit cell was determined to be monoclinic with cell parameters
a = 8.8 Å,
b = 7.2 Å,
c = 9.6 Å, and β = 97.7°.
Figure 3 shows the sections
hk0,
h0
l, and 0
kl of the reconstructed 3D reciprocal lattice and the cylindrical projection of the intensity clusters used for the refinement of the tilt axis orientation. The systematic absences were compatible with the known space group
P21/c. The best structure solution results were obtained by SIR2014 in space group
P21/c. The data set contains 976 independent reflections representing a completeness of 62% up to a resolution of 0.8 Å.
The structure solution obtained by SIR2014 with a final residual value
R = 34 % contained all atom positions (cf.
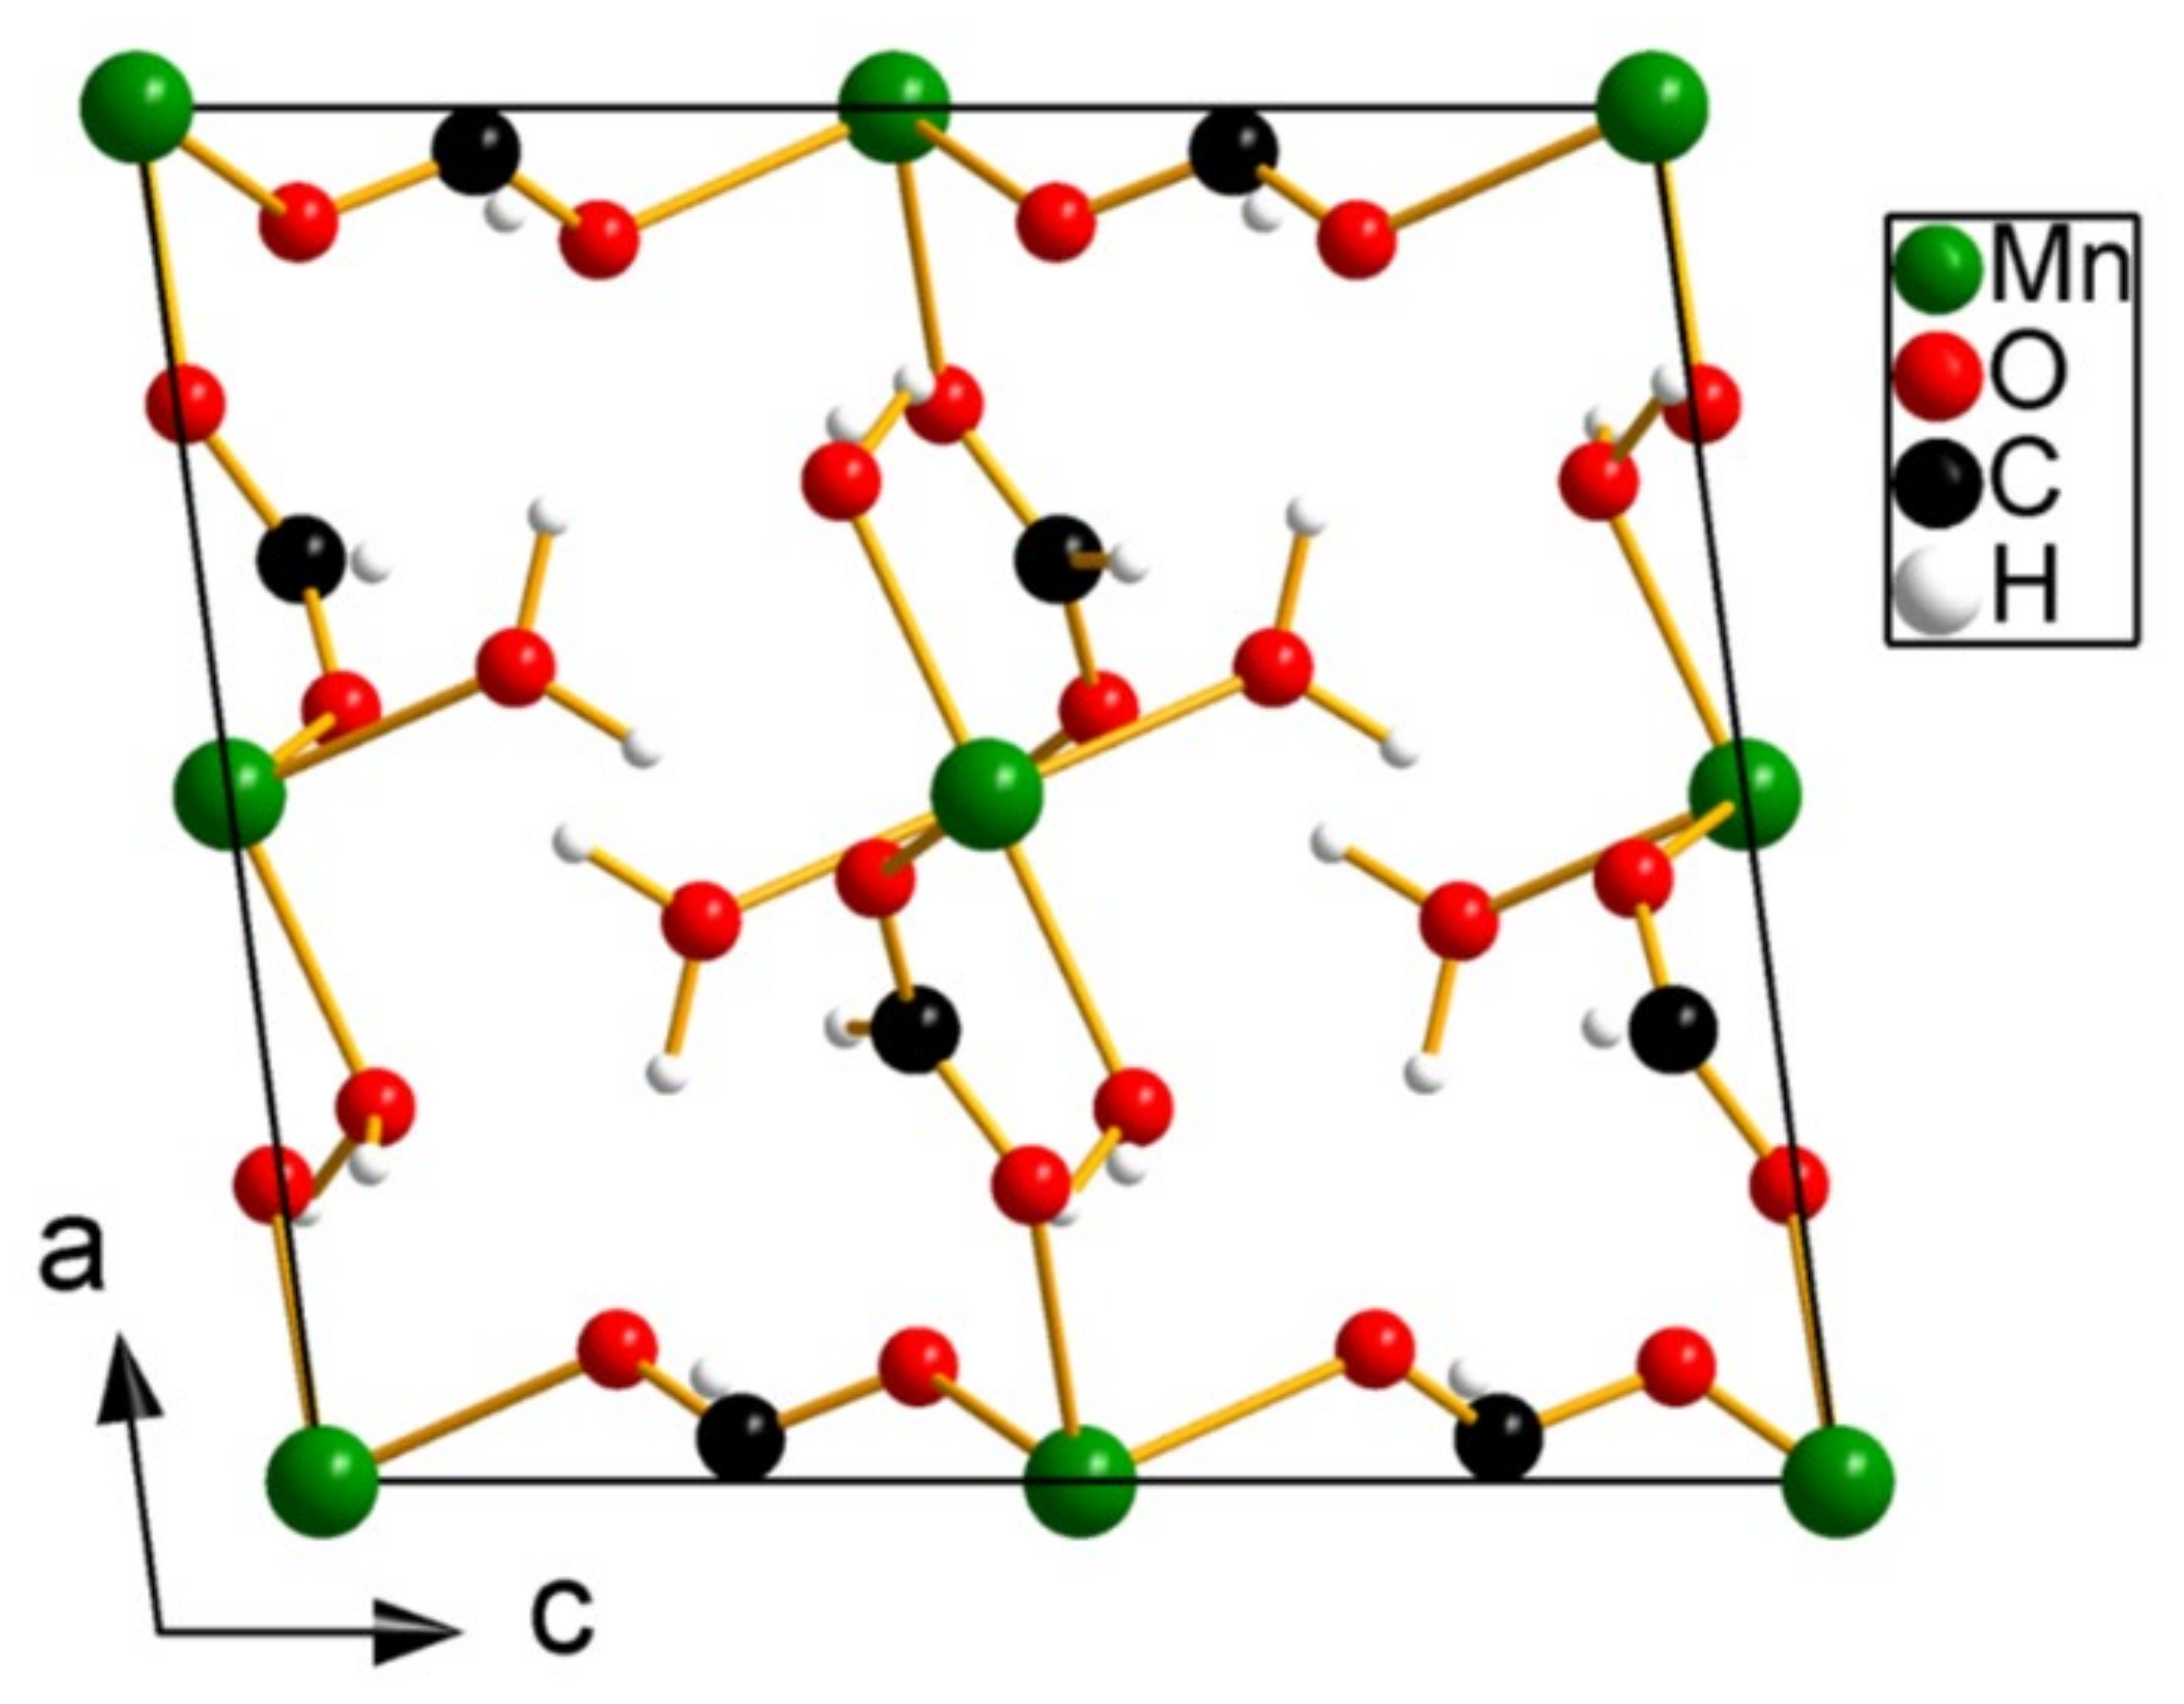
Table 3). SIR2014 correctly assigned Mn to the two highest peaks in the potential map. The C and O atoms being neighbors in the periodic table it is very difficult to distinguish between them on the basis of scattering power. Most of these atoms were also correctly assigned, except for O6 and C2, which were inversed. Knowing the molecule used in the synthesis, the correct identification of carbon and oxygen is no problem. The projection along the b-axis of the resulting structure is shown in
Figure 4.
The Mn are on special positions of the space group and the coordinates are therefore fixed by symmetry and cannot differ from those obtained from X-ray data. The coordinates of the O and C, however, are not fixed and the comparison shows that the average distance of the found positions is only 0.118 Å (
Table 3) with respect to the atom positions refined against X-ray diffraction data. As for the Sr
5CuGe
9O
24, the accuracy of the positions shows once again the high quality of the data.
3.1.3. Garnet (Na2/3Mn1/3)3Ge2Ge3O12
In the framework of expanding the range of germanium-based compounds in the pyroxene family, a sample with the nominal composition NaMnGe
2O
6 was synthesized at high temperature and high pressure. X-ray powder diffraction (XRPD) data were collected from 2θ = 16° to 60° using a D5000 Bruker diffractometer equipped with a focusing Ge(111) primary monochromator and an Elphyse linear detector, revealing the multi-phase nature of the sample. Examination of the diffraction pattern revealed the presence of the mixed Na, Mn germanate Na
2(Mn
0.26 Na
0.74) Mn
5Ge
6O
20 [
23], the remaining peaks being indexable in a body-centered cubic unit cell with a ≈12 Å, similar to that of garnets such as e.g., CdGeO
3 [
24]. A successful Rietveld refinement was performed using the Fullprof Suite software [
25] based on the garnet structure in the cubic
Ia-3d (n° 230) space group symmetry. Ge atoms were placed at the
16a and
24d Wyckoff positions, a fixed composition Mn
1/3Na
2/3 mixture at the
24c position, according to the stoichiometry deduced from the EDX measurements, and the oxygen atom at the
96c position. The scale factor, cell parameter, oxygen atom position, and an overall atomic displacement parameter (a.d.p.) were refined. The reflection profiles for both phases were treated using pseudo-Voigt functions. The atomic parameters of the secondary phase were taken from literature and fixed; only an overall a.d.p., profile and cell parameters, and scale factor were refined. The refinement yielded
Rwp = 15.2%,
RBragg = 3.44%, χ
2 = 6.76 with cell parameter
a = 11.9860(3) Å and a mass fractions of 64(1)% for the garnet phase (
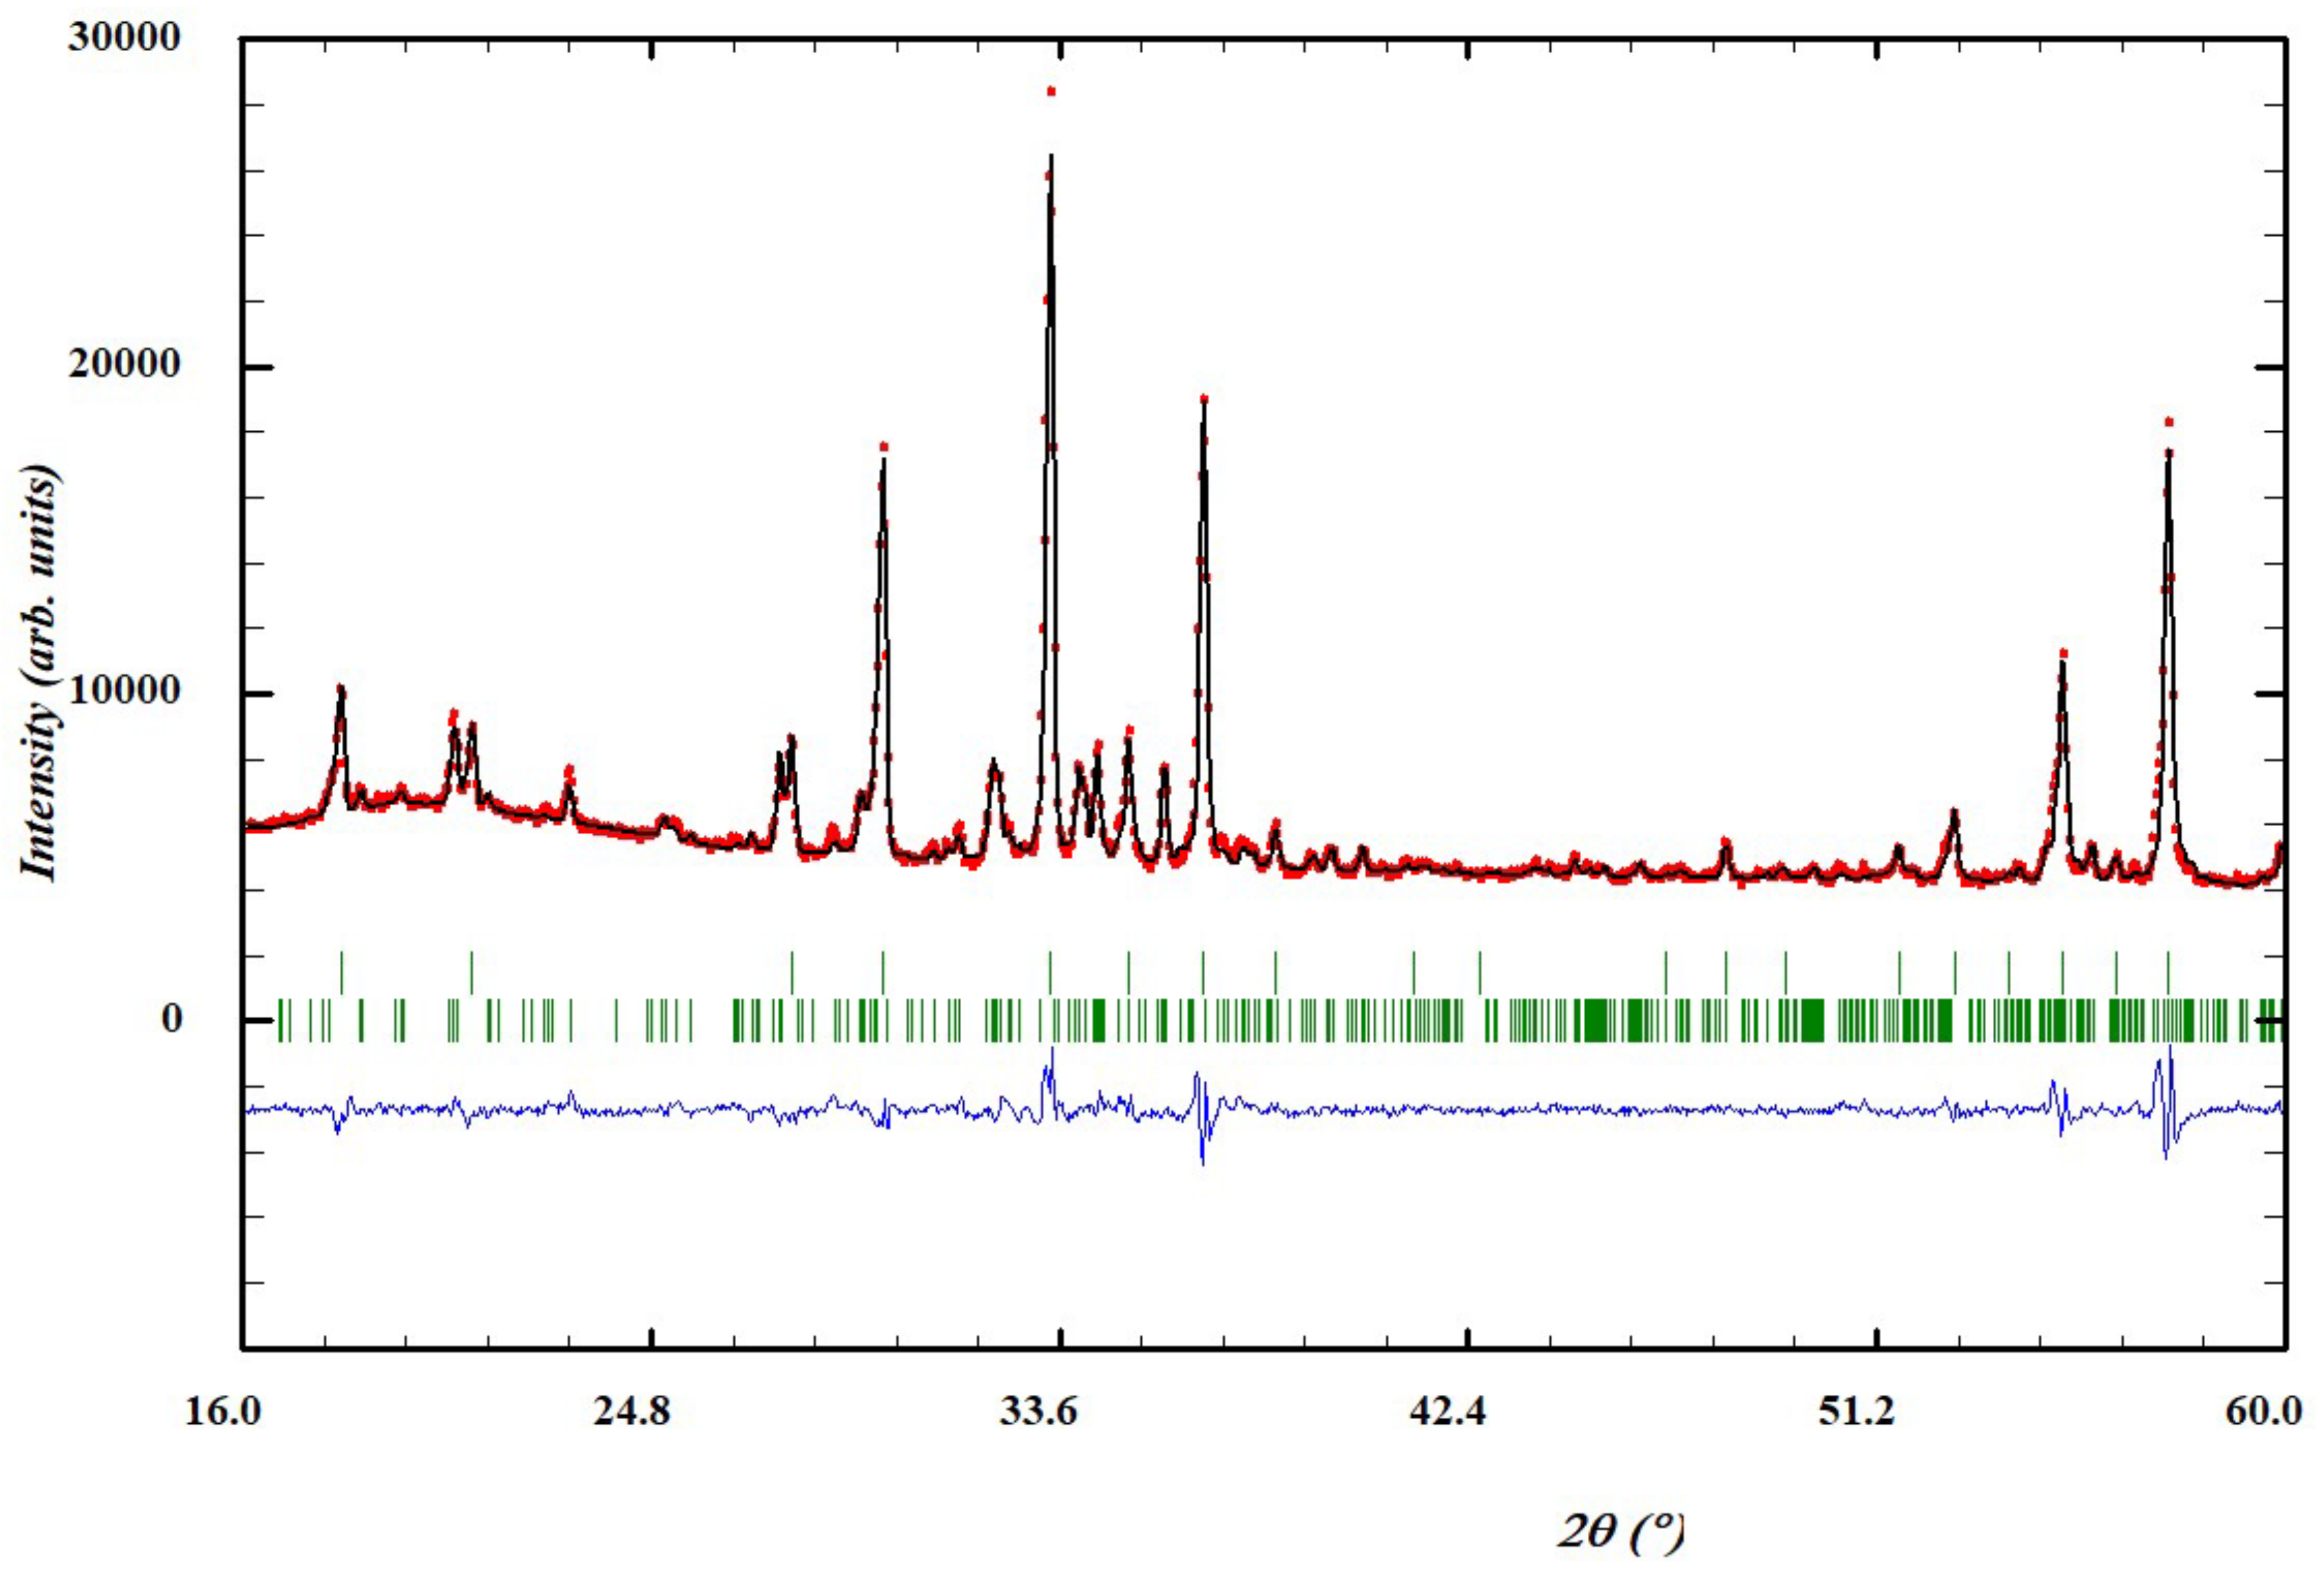
Figure 5). Given the high impurity phase proportion of the sample, it was decided to reinvestigate the structure of this new garnet compound using electron diffraction.
According to our experience, compounds containing alkaline species are most time sensitive to irradiation, therefore we decided to test the LD-EDT approach on this new garnet-like compound. The chemical composition was determined by EDX to be 20% Na, 11% Mn, and 69% Ge. LD-EDT data led to a cubic unit cell with parameter
a = 12.2 Å.
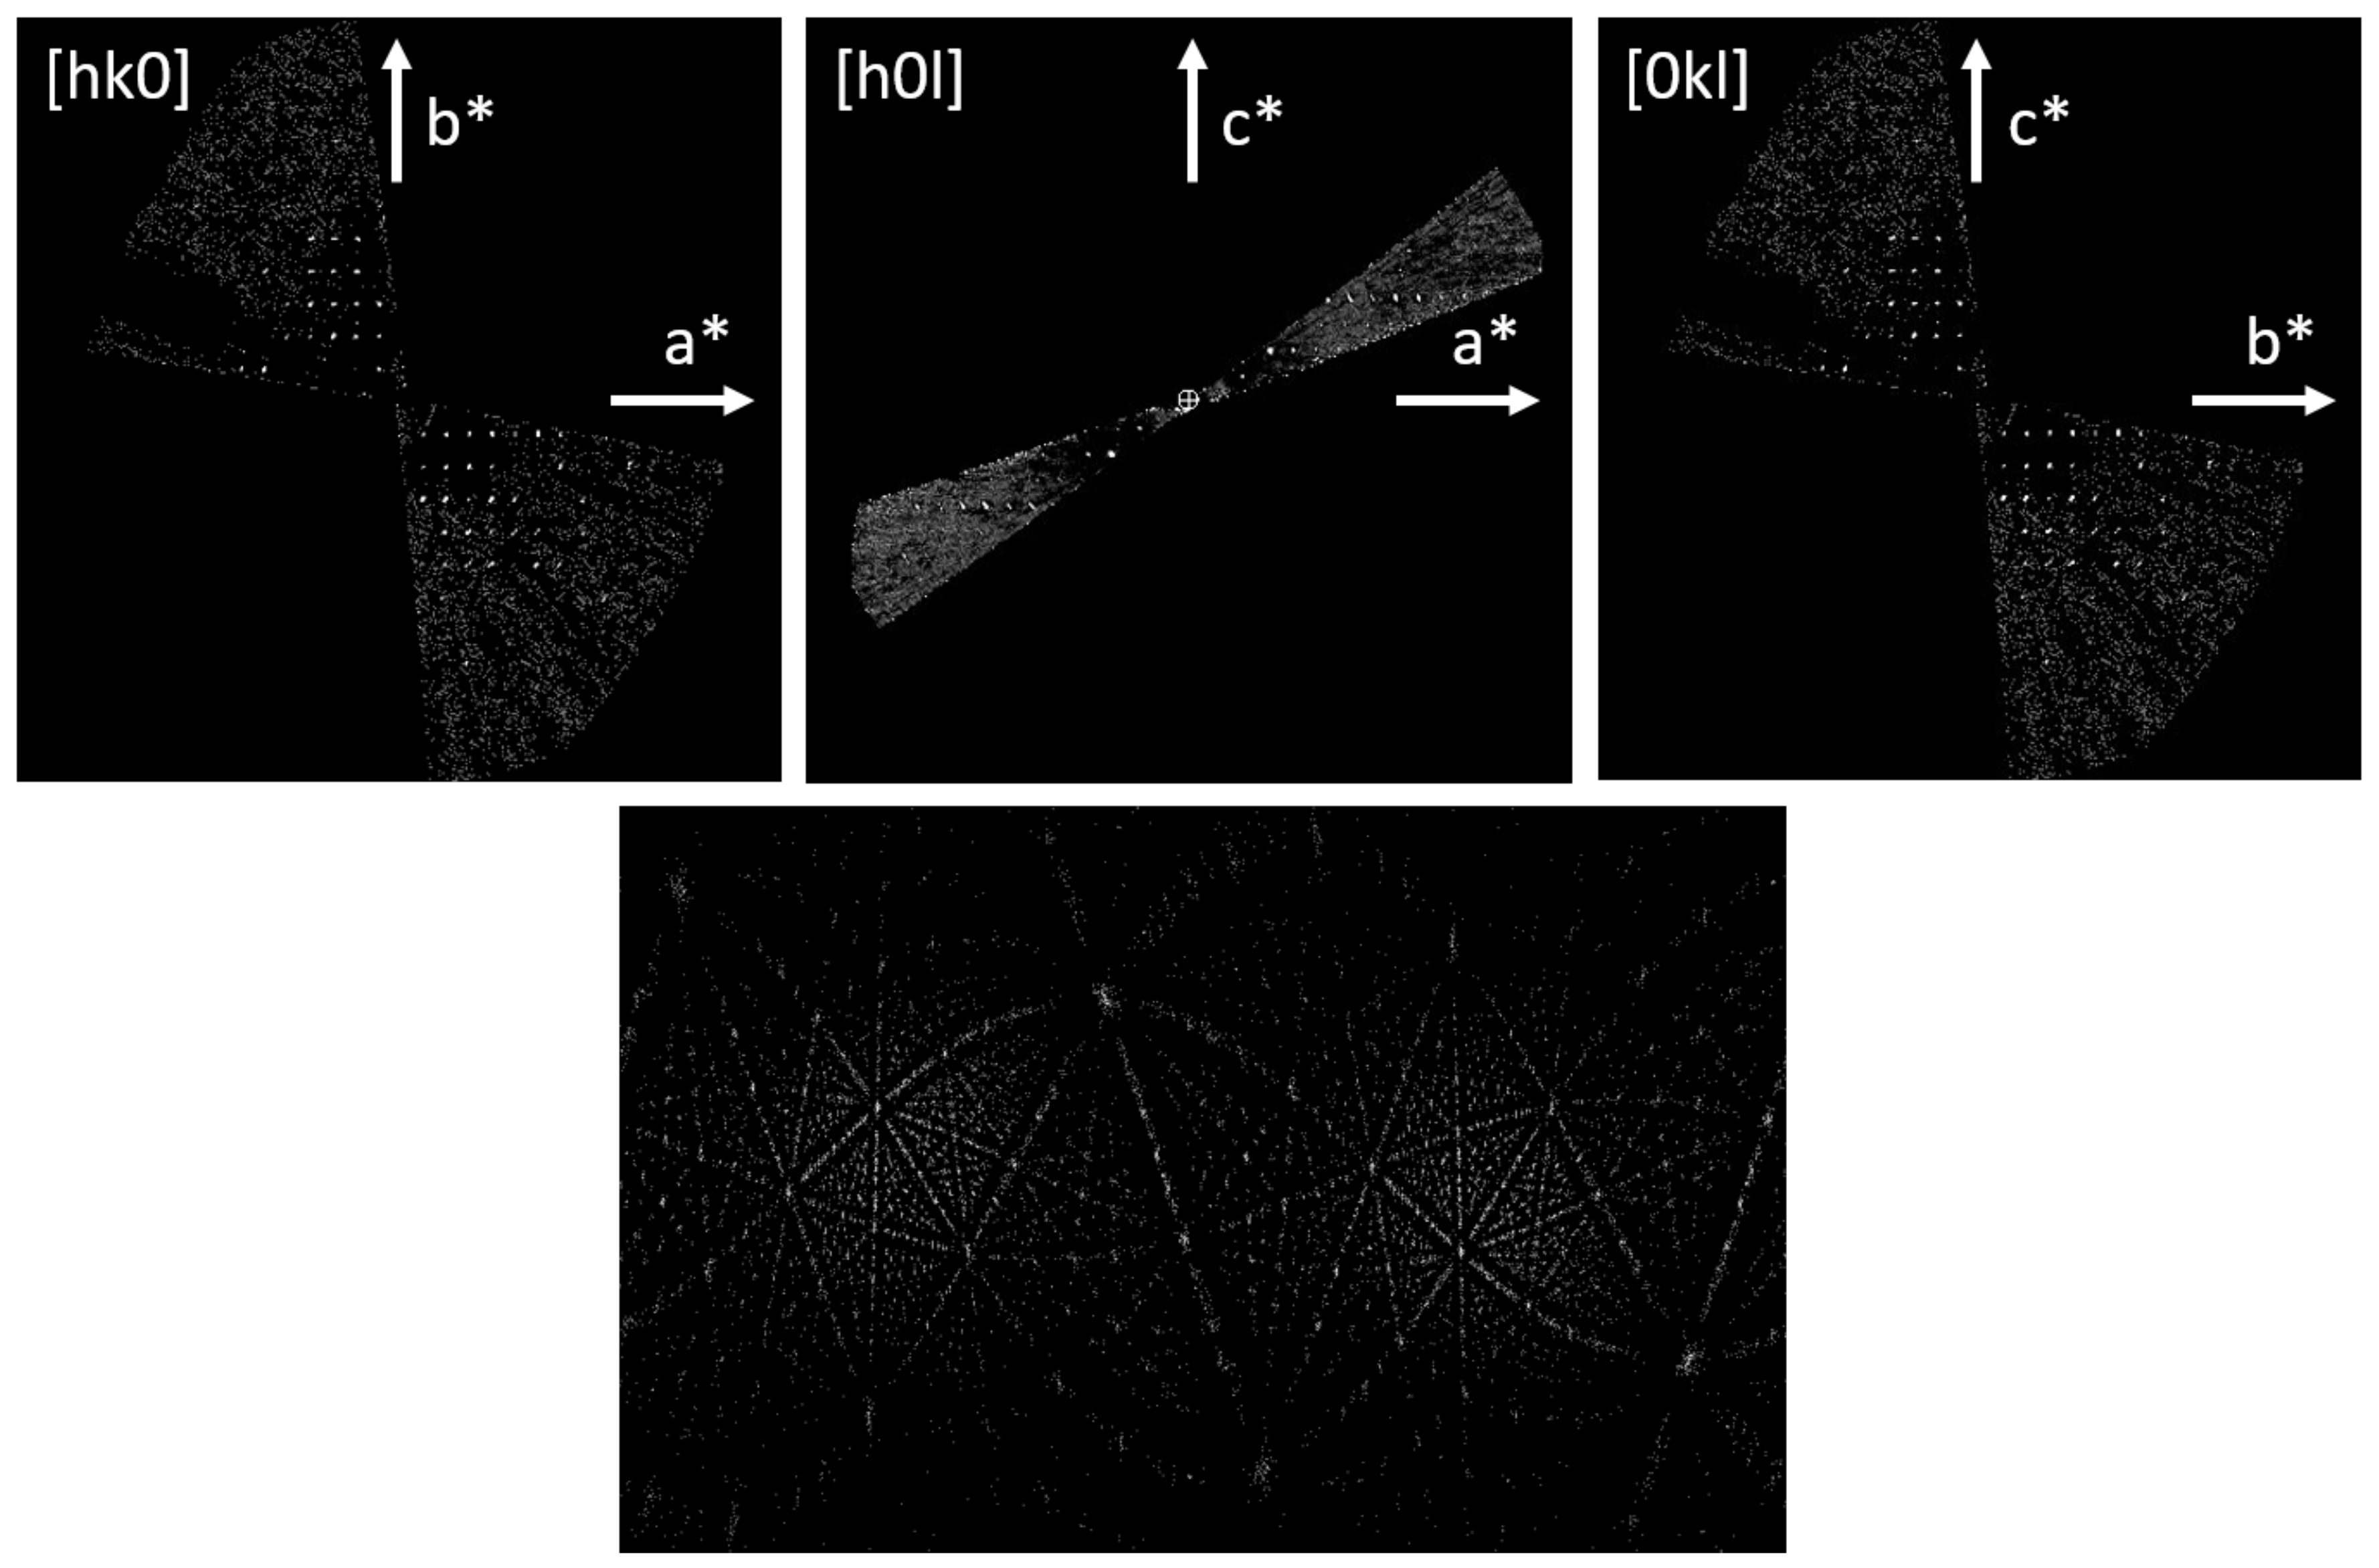
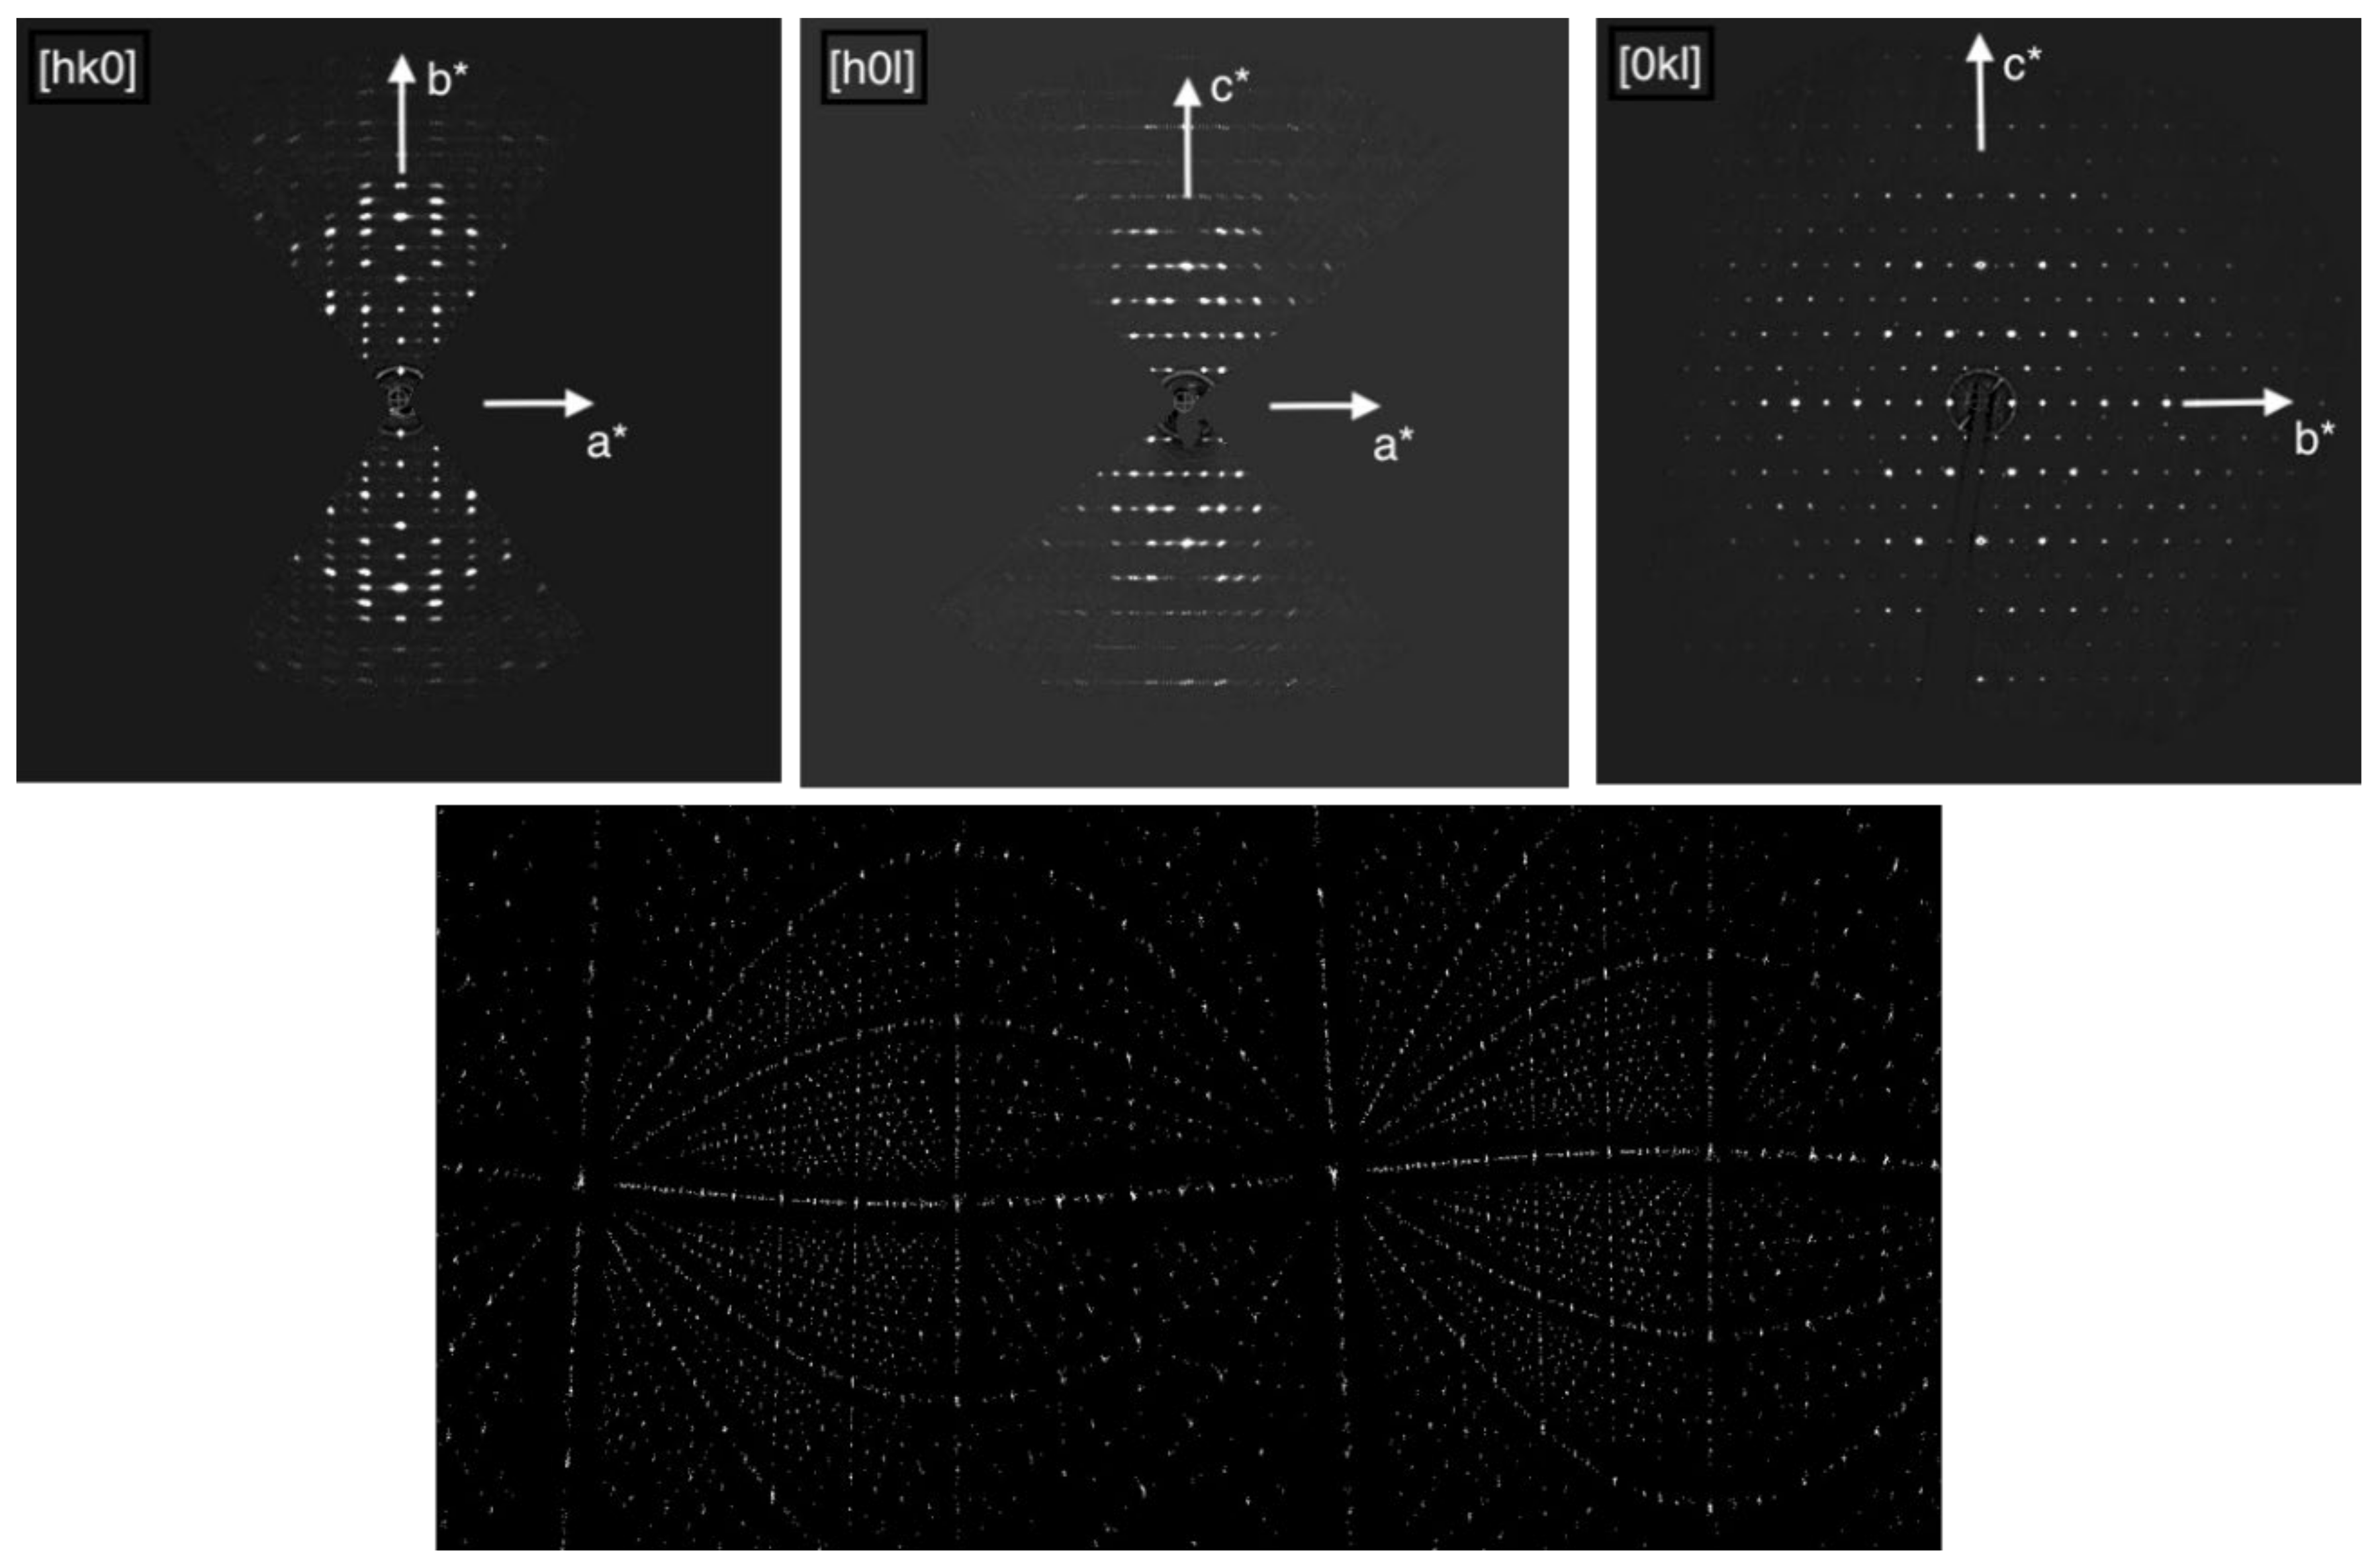
Figure 6 shows the sections
hk0,
h0
l, and 0
kl of the reconstructed 3D reciprocal lattice and the cylindrical projection of the intensity clusters used for the refinement of the tilt axis orientation. The structure was solved with a final
R-value equal to 28% by Superflip from a data set containing 220 independent reflections representing a completeness of 98% up to a resolution of 0.7 Å. The proposed space group is
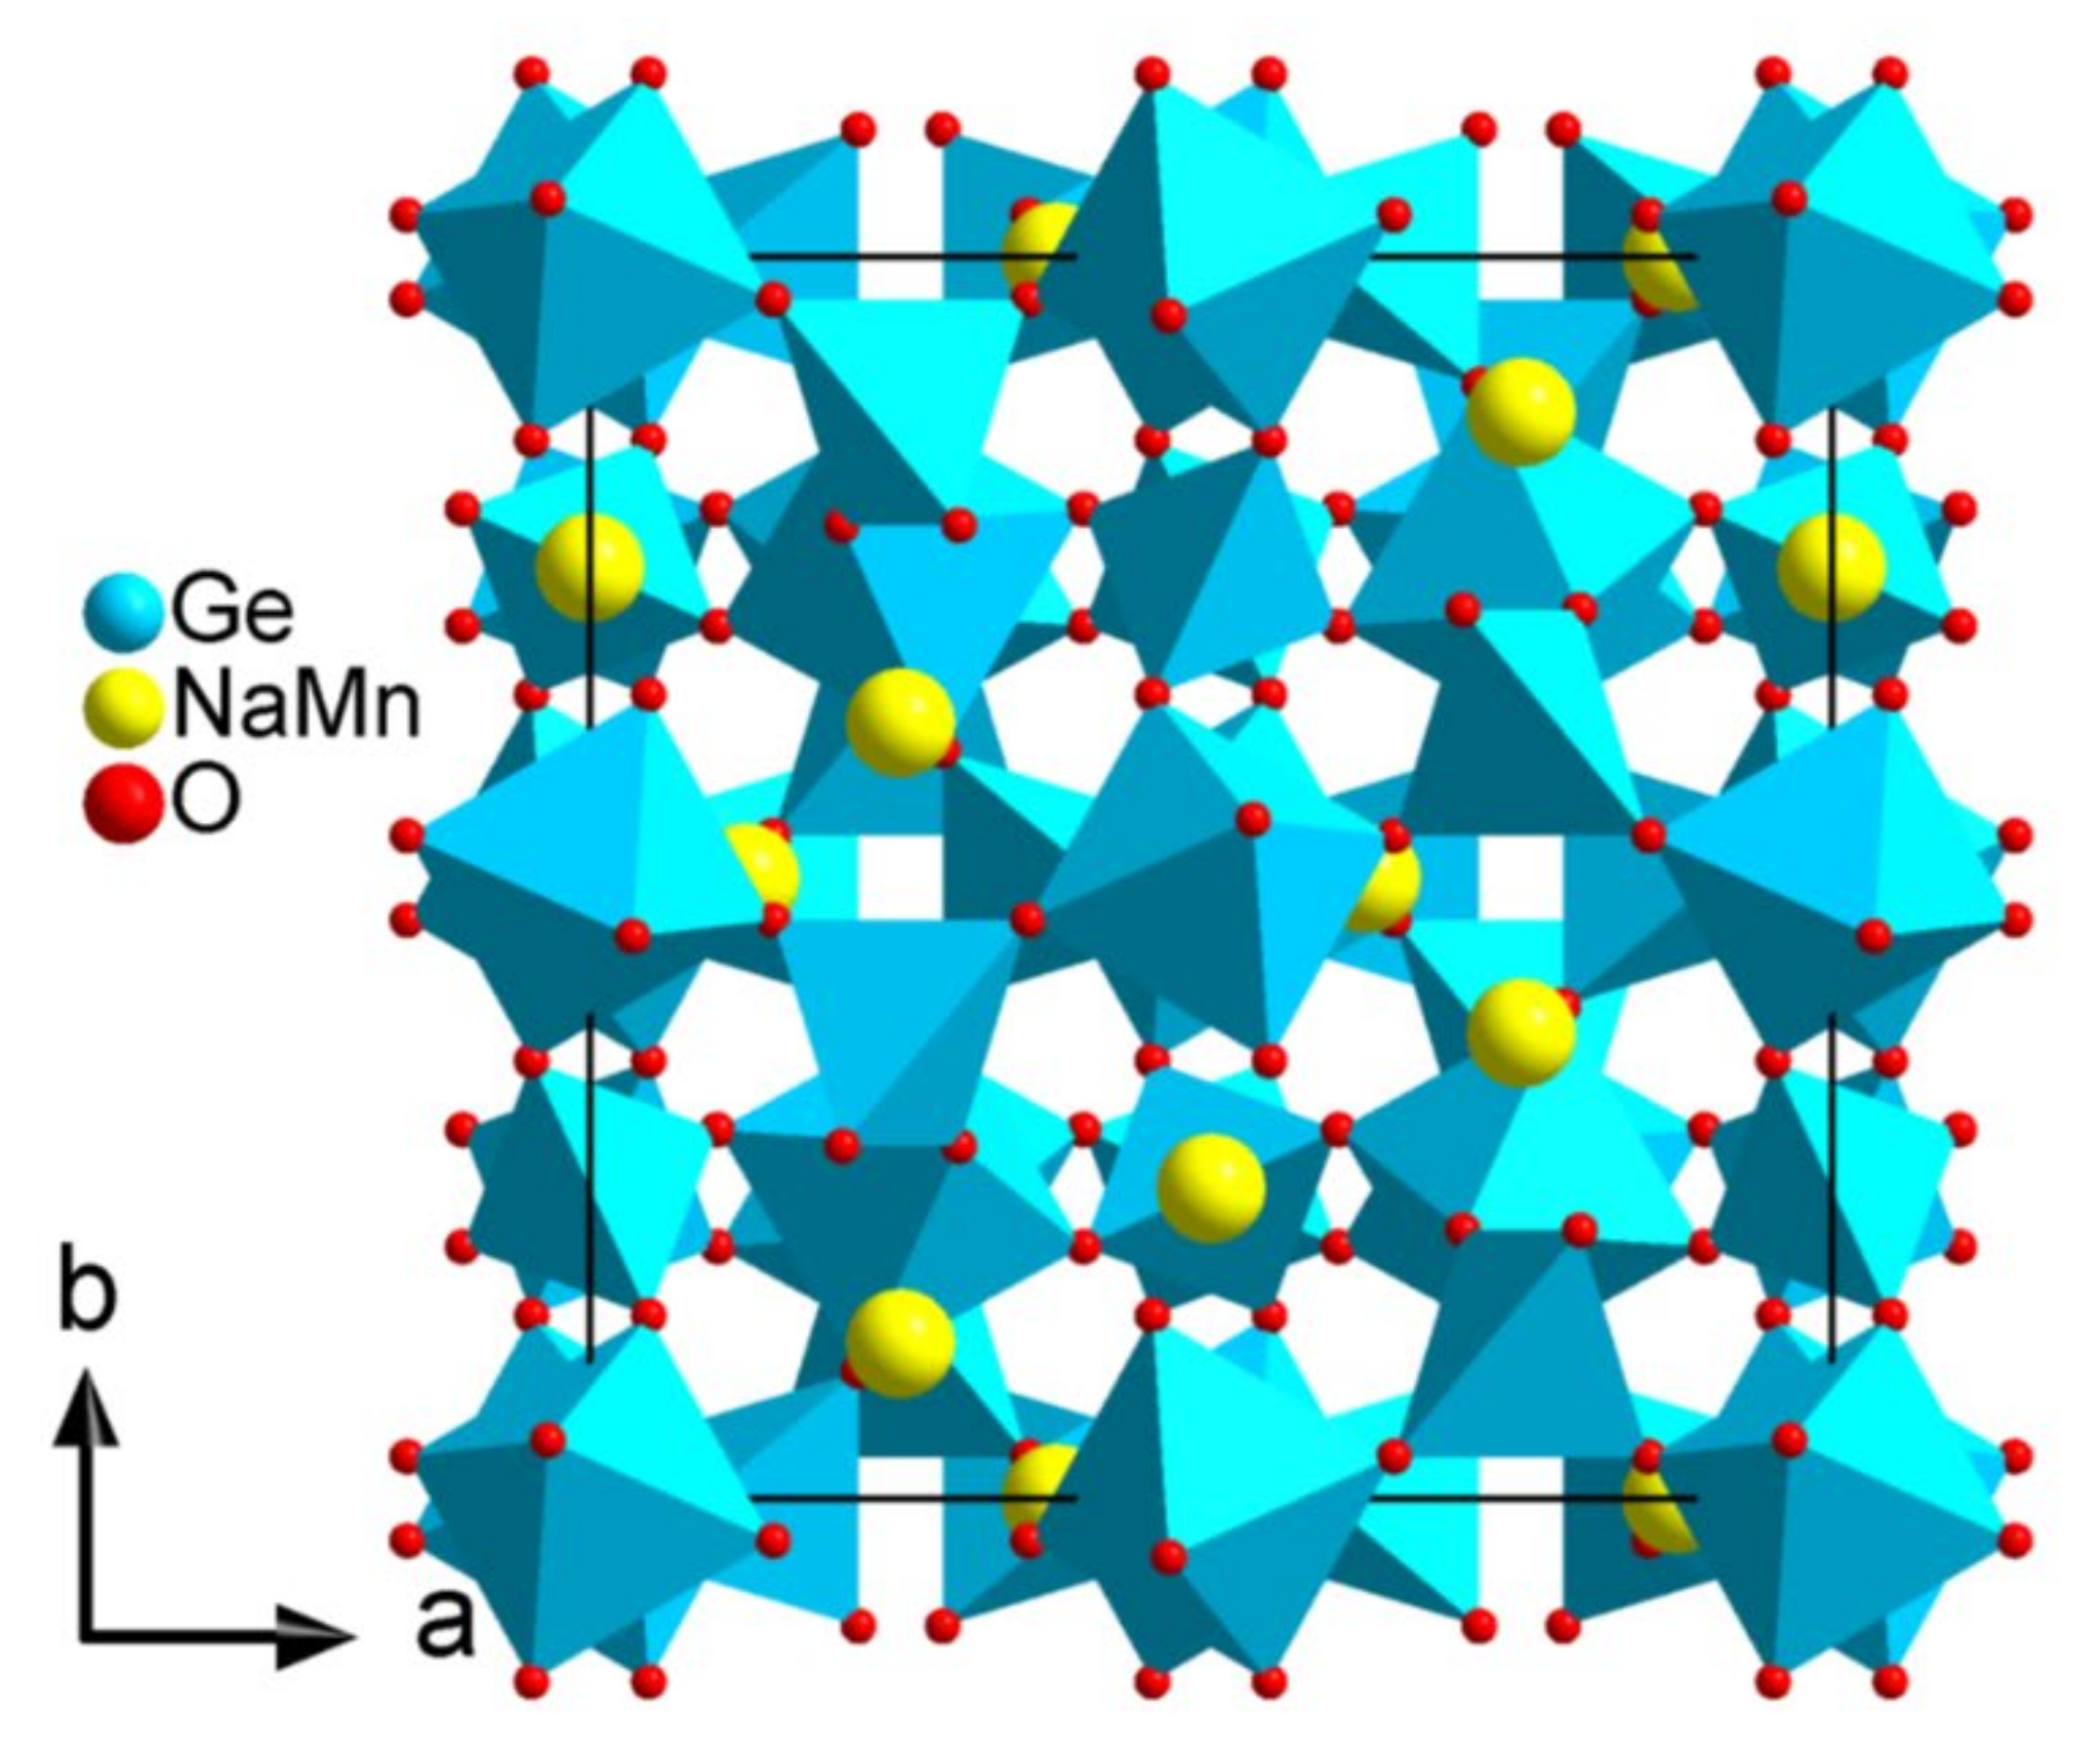
Ia-3d (n° 230). The structure agrees with the XRPD results reported above. The new garnet-like compound presents a very high symmetry, and only four independent positions. Atomic attribution from Superflip was corrected using chemical information from EDX composition and interatomic distances and the resulting structure is shown in
Figure 7.
3.1.4. Bulachite [Al6(AsO4)3(OH)9(H2O)4]⋅2H2O
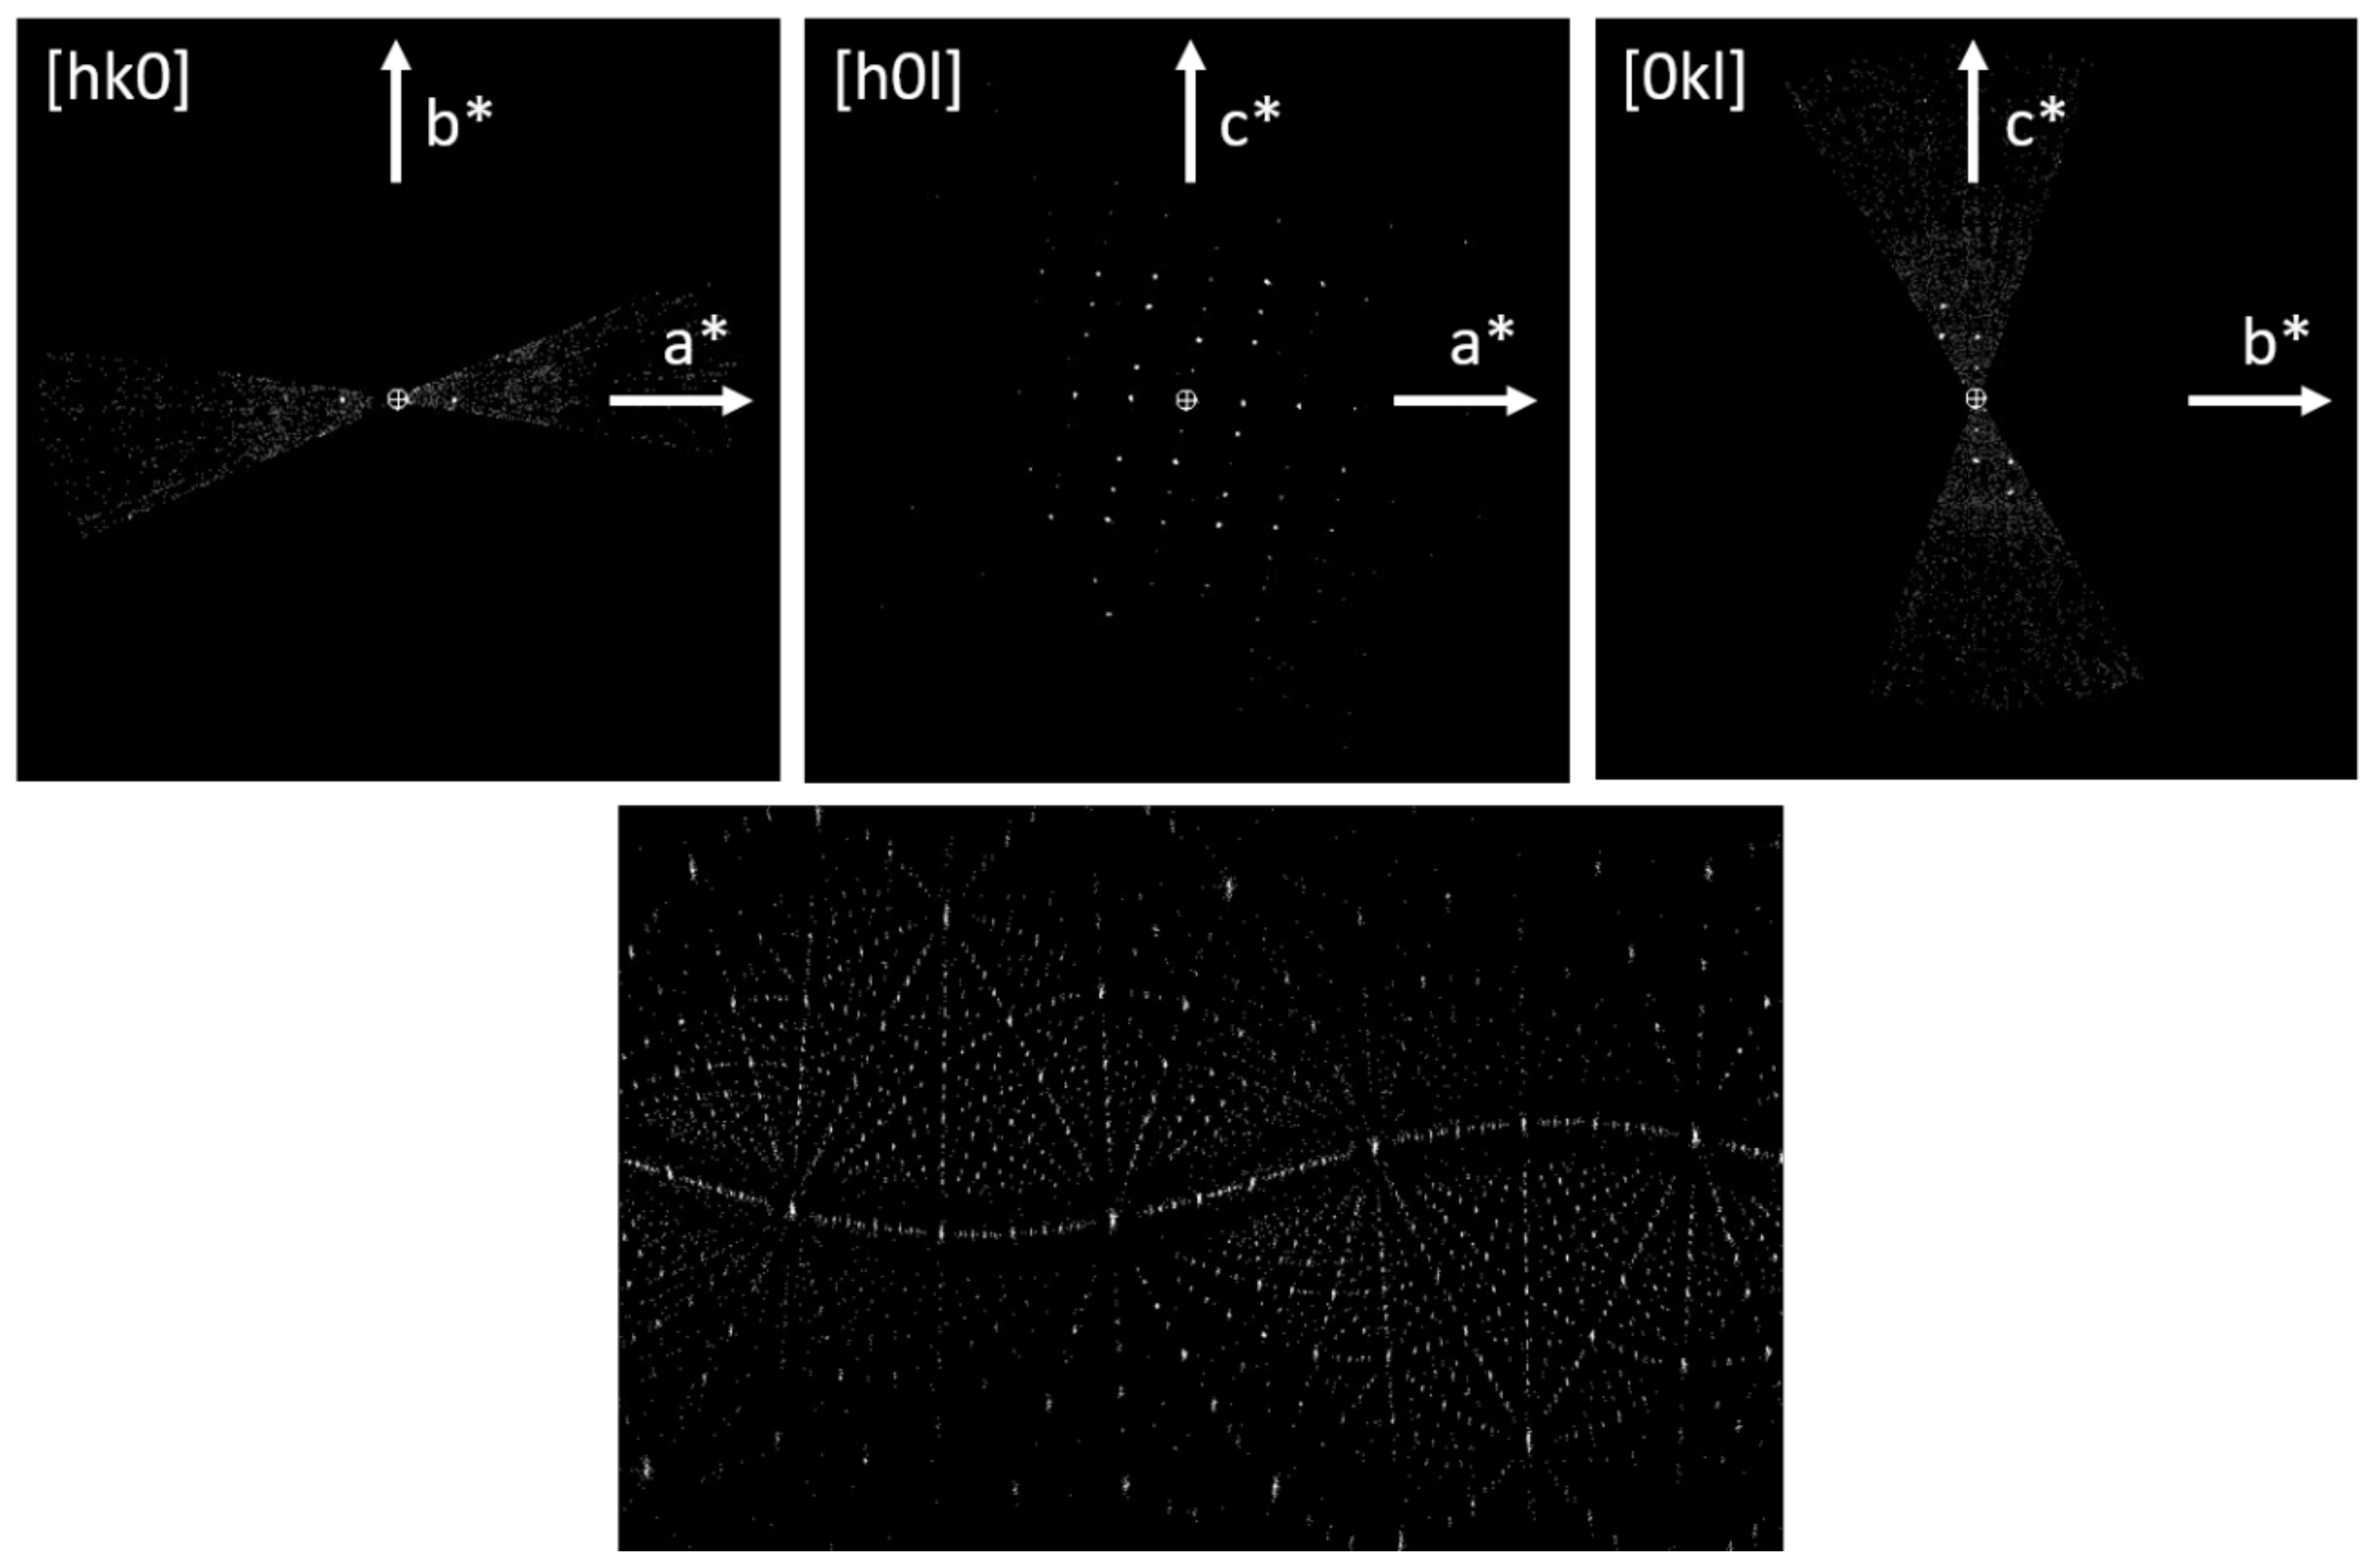
The orthorhombic unit cell was determined by PETS to have cell parameters of
a = 15.40 Å,
b = 17.66 Å, and
c = 7.81 Å.
Figure 8 shows the sections
hk0,
h0
l, and 0
kl of the reconstructed 3D reciprocal lattice and the cylindrical projection of the intensity clusters used for the refinement of the tilt axis orientation. The systematic extinctions were compatible with space groups
Pn21a and
Pnma. The data set contains 2438 independent reflections which corresponds to a completeness of 80% up to 0.8 Å resolution.
The best structure solution was obtained by SIR2014 in space group
Pnma with a final
R value of 30%. All cation positions were obtained, attributed by SIR2014 to elements according to their number of electrons: the first position was attributed to As, followed by the Al. The next 14 positions correspond to the oxygen forming the coordination polyhedra around the cations. The following two positions that SIR2014 interpreted as being hydrogen correspond in fact to the oxygen positions of free water molecules in between the polyhedral layers (see
Table 4 and
Figure 9). This structure solution was used for the refinement of synchrotron powder diffraction data, which confirmed the structure and allowed identifying oxygen atoms participating to hydroxyl groups, bonded and free water molecules among the found oxygen atoms using BVS calculations [
22].
Table 4 shows that the average distance between the cation positions in the unrefined structural model found by LD-EDT and the positions from Rietveld refinement [
22] is 0.079 Å, for the O
2- and OH
− anions the average distance is 0.110 Å, while for the oxygen positions from bonded H
2O molecules the distance is 0.186 Å. For the also detected free water molecules in between the polyhedral layers the precision is less good with an average distance of 0.324 Å.
3.2. Structure Refinement
After structure solution, first a kinematical refinement was performed in Jana2006 using the standard settings of all parameters. This refinement usually improved the
R-values slightly but no major changes in atom positions were observed. The structure refinement based on the dynamical theory of diffraction, however, significantly improved the atom positions and reduced the differences to the X-ray refined positions. The dynamical refinement was also performed in the Jana2006 suite. For this refinement several parameters can be chosen. For all structures presented here we first ran the refinement using default values of all parameters (observed reflections:
I/
σ(
I) > 3, maximal diffraction vector g(max) = 2 Å
−1, maximal excitation error (Matrix) = 0.01 Å
−1, maximal excitation error (Refine) = 0.1 Å
−1, RSg(max) = 0.4, number of integration steps = 128). In each case the refinement converged to reasonable
R values and atomic positions and/or occupancies. An improvement of the results could then be obtained in some cases by lowering the
I/
σ(
I) limit for observed reflections. Indeed, the TVIPS F416 camera has a high sensitivity (85 counts per incident electron) and a low noise level (variance between 2 and 5 for exposure times up to 1 s). These characteristics allowed us reducing the limit for observed reflections
I/
σ(
I) from the default value of 3 to values as low as 1.2. This increased the number of reflections used in the refinements and resulted in improved atomic positions in the final solutions. The final
R-values and GoF of the refined structures are reported in
Table 5.
3.2.1. Sr5CuGe9O24
Starting from the atomic positions obtained from the structure solution the coordinates of the atoms and their isotropic thermal displacement parameters were refined. The value of the thickness of the crystal was refined to 81.1 nm.
While the precision of the cation positions did not change much, the precision of the oxygen positions was improved from an average distance to the X-ray refined positions of 0.180 Å to 0.152 Å by the refinement (cf.
Table 6).
The refined structure of Sr
5CuGe
9O
24 confirms the particular features of this compound where three different environments for Ge ions with four-fold, five-fold, and six-fold coordination are present, respectively (
Figure 2). The Cu cations are coordinated by oxygen octahedra.
3.2.2. Mn-Formiate
The dynamical refinement of the atomic coordinates and the isotropic thermal displacement parameters of Mn-formiate yielded the positions in
Table 7. The value of the thickness of the crystal was refined to 54.1 nm.
In this particular case, the initial structure obtained by SIR2014 was already very close to the X-ray refined structure, so that the refinement even though it converged easily, did not make the model more accurate.
3.2.3. Garnet (Na2/3Mn1/3)3Ge2Ge3O12
The cations being on special positions, there is no degree of freedom in the coordinates and the positions are identical to those in the X-ray refined structure. The O position, however, is not fixed and one cation position has mixed Na/Mn occupancy. We applied a dynamical refinement using PETS2 and JANA2006 to refine the Na/Mn occupancy and the oxygen position from the LD-EDT data. The value of the thickness of the crystal was refined to 61.6 nm. The precision of the oxygen position was improved from a distance to the X-ray refined position of 0.121 Å to 0.046 Å by the refinement. The Na/Mn ratio initially fixed to 0.5/0.5 converged rapidly to 0.64/0.36, very close to the X-ray refinement result. (
Table 8).
It can be noted that a kinematical refinement of the Na/Mn ratio on the same data is not stable.
These results lead to two conclusions: First, the irradiation during the LD-EDT did not modify the composition of the compound through beam damage such as radiolysis; second, the good quality of the data allowed refining the occupancy ratio of the mixed site.
3.2.4. Bulachite
In the first steps of the refinement the atom positions identified by SIR2014 as H1 and H2 were not retained. A Fourier difference map, however, confirmed the existence of these ion positions and suggested that they are indeed oxygen positions of non-bonded water molecules. Including these positions and refining the coordinates and isotropic atomic displacement parameters of all atoms lead to final
R values as presented in
Table 5. The value of the thickness of the crystal was refined to 50.7 nm. It can be noted that the thermal displacement parameters of all atoms could be refined to meaningful values. The values of
Uiso of the non-bonded water molecules is significantly higher than those of the other oxygen ions.
The atomic coordinates of the refined structure are presented in
Table 9. There is an improvement in the precision of the cations and the O
2− and OH
− positions, but the distances of the water molecules from the X-ray refined positions seem to increase slightly.
4. Discussion and Conclusions
Working with beam sensitive materials, reducing the incident electron dose on the crystal is paramount in order to study its structure without causing structural changes during the experiment. Exposing the crystal to the incident beam exclusively during the recording of the diffracted intensities and blanking the beam at any other time seems to be the obvious basis.
The subsequent step is to optimize the signal to noise ratio of the diffracted intensities. This can be achieved by increasing the signal and/or reducing the noise. For a given illumination condition, i.e., a given dose rate, choosing a relatively large crystal allows obtaining higher diffracted intensities. This is possible in LD-EDT where the size limit for the crystal is given by the condition that it should stay inside the selected area aperture during the entire tomography. Using an aperture that selects an area of about 2 µm in diameter, a crystal of the order of 1 µm can easily be chosen. The large selected area aperture can lead to difficulties if the crystal is bent or if it contains smaller crystalline domains. In this case, choosing a different particle usually solves the problem.
Reducing the noise of the acquisition largely depends on the camera used for recording the diffraction frames. Modern direct detection cameras certainly are a good albeit costly choice for low noise acquisition. In this work we have shown that a sensitive CMOS camera also qualifies for the necessary signal to noise ratio that allows accurate data acquisition at a dose as low as 0.1 e−/Å2 for the entire data set.
Of course, using such a low dose will result in many reflections being very weak. The usual criteria for counting a reflection as observed (I/σ(I) > 3) will eliminate many reflections, leaving a small data set that may not be sufficient for the solution and refinement of complex structures. In the case of Sr5CuGe9O24 and due to the extremely low dose used for the data acquisition, we had to change this criterion and consider all reflections with I/σ(I) > 1.2 as observed. This was possible because of the low background noise of the TVIPS F416 camera and it was sufficient as it yielded enough reflections for the structure solution and refinement.
Finally, the quality of the recorded data depends on the comparability of the intensities recorded on different frames during the tomography. Other than the possibly induced structural changes by the incident beam, a shift in the diffracting crystal volume can introduce difficulties in the merging of the data from different frames. When the incident beam is smaller than the crystal, a shift of the beam with respect to the crystal (or the inverse) can lead to a change in thickness of the diffracting volume, a different orientation if the crystal is bent or a different density of structural defects. In the present case, LD-EDT not only preserves the same amount of crystal volume in the incident beam during the tomography, but even the identical volume, therefore keeping all the characteristics like defect density identical for all frames.
Here we have applied LD-EDT to four very different crystal structures: a complex oxide, a metal-organic framework, a mineral, and an oxide with mixed occupancy on one site, the latter three being very beam sensitive. The LD-EDT method maximizes the signal-to-noise ratio in all diffraction frames, allowing to use the incident electron dose very parsimoniously. The high quality of the obtained data at very low electron doses allowed us not only to solve the structures, but also to use dynamical diffraction theory to refine these structures. In the case of the mineral Bulachite it was possible to refine the thermal parameters of all atoms individually to meaningful values. The values of Uiso for the free water molecules were significantly higher than those for the other oxygen ions which could be attributed to a tendency of the free water molecules to leave the crystal under the effect of the vacuum in the TEM and/or the irradiation. Some of the refined Uiso were negative, which is not unusual for electron diffraction data even though the underlying reasons why this happens are not clear. They are therefore not very reliable, further progress has to be made in the data treatment of electron diffraction data in order to achieve a reliability comparable to what is obtained from X-ray diffraction data.
The low doses used in this work (down to 0.1 e−/Å2) are not only sufficient to address any structural study of beam sensitive minerals or metal-organic frameworks, but also open new application fields for this method for example in structural biology or in pharmaceutics.
Author Contributions
Investigation, H.K., S.K., E.Y. and P.B.; Methodology, H.K. and S.K.; Writing—original draft, H.K., S.K.; Writing—review & editing, H.K., S.K., E.Y. and P.B. All authors have read and agreed to the published version of the manuscript.
Funding
This research received no external funding.
Institutional Review Board Statement
Not applicable.
Informed Consent Statement
Not applicable.
Data Availability Statement
Data is contained within the article.
Acknowledgments
The authors are grateful to Dominique Luneau, Celine Darie, Ian Grey, Thomas Mangin, and Lei Ding for providing the samples of this study.
Conflicts of Interest
The authors declare no conflict of interest.
References
- Henderson, R. The potential and limitations of neutrons, electrons and X-rays for atomic resolution microscopy of unstained biological molecules. Q. Rev. Biophys. 1995, 28, 171–193. [Google Scholar] [CrossRef] [PubMed] [Green Version]
- Kolb, U.; Gorelik, T.; Kubel, C.; Otten, M.T.; Hubert, D. Towards automated diffraction tomography: Part I—Data acquisition. Ultramicroscopy 2007, 107, 507–513. [Google Scholar] [CrossRef] [PubMed]
- Kolb, U.; Gorelik, T.; Otten, M.T. Towards automated diffraction tomography. Part II—Cell parameter determination. Ultramicroscopy 2008, 108, 763–772. [Google Scholar] [CrossRef] [PubMed]
- Mugnaioli, E.; Gorelik, T.; Kolb, U. “Ab initio” structure solution from electron diffraction data obtained by a combination of automated diffraction tomography and precession technique. Ultramicroscopy 2009, 109, 758–765. [Google Scholar] [CrossRef] [PubMed]
- Nannenga, B.; Shi, D.; Leslie, A.; Gonen, T. High-resolution structure determination by continuous rotation data collection in MicroED. Nat. Methods 2014, 11, 927–930. [Google Scholar] [CrossRef] [PubMed] [Green Version]
- Gemmi, M.; la Placa, M.G.I.; Galanis, A.S.; Rauch, E.F.; Nicolopoulos, S. Fast electron diffraction tomography. J. Appl. Crystallogr. 2015, 48, 718–727. [Google Scholar] [CrossRef]
- Gemmi, M.; Mugnaioli, E.; Gorelik, T.E.; Kolb, U.; Palatinus, L.; Boullay, P.; Hovmöller, S.; Abrahams, J.P. 3D Electron Diffraction: The Nanocrystallography Revolution. ACS Cent. Sci. 2019, 5, 1315–1329. [Google Scholar] [CrossRef] [Green Version]
- Palatinus, L.; Corrêa, C.A.; Steciuk, G.; Jacob, D.; Roussel, P.; Boullay, P.; Klementova, M.; Gemmi, M.; Kopecek, J.; Domeneghetti, M.C.; et al. Structure refinement using precession electron diffraction tomography and dynamical diffraction: Tests on experimental data. Acta Cryst. B 2015, 71, 740–751. [Google Scholar] [CrossRef]
- Palatinus, L.; Brázda, P.; Boullay, P.; Perez, O.; Klementová, M.; Petit, S.; Eigner, V.; Zaarour, M.; Mintova, S. Hydrogen positions in single nanocrystals revealed by electron diffraction. Science 2017, 355, 166–169. [Google Scholar] [CrossRef]
- Ge, M.; Zou, X.; Huang, Z. Three-Dimensional Electron Diffraction for Structural Analysis of Beam-Sensitive Metal-Organic Frameworks. Crystals 2021, 11, 263. [Google Scholar] [CrossRef]
- Clabbers, M.; Xu, H. Macromolecular crystallography using microcrystal electron diffraction. Acta Cryst. 2021, 77, 313–324. [Google Scholar] [CrossRef] [PubMed]
- Glaeser, R.M. Specimen Behavior in the Electron Beam. Methods Enzymol. 2016, 579, 19–50. [Google Scholar] [PubMed]
- Kodjikian, S.; Klein, H. Low-dose electron diffraction tomography (LD-EDT). Ultramicroscopy 2019, 200, 12–19. [Google Scholar] [CrossRef] [PubMed]
- Klein, H.; David, J. The quality of precession electron diffraction data is higher than necessary for structure solution of unknown crystalline phases. Acta Crystallogr. 2011, 67, 297–302. [Google Scholar] [CrossRef] [PubMed]
- Vincent, R.; Midgley, P.A. Double conical beam-rocking system for measurement of integrated electron diffraction intensities. Ultramicroscopy 1994, 53, 271. [Google Scholar] [CrossRef]
- Palatinus, L. PETS—Program for Analysis of Electron Diffraction Data; Institute of Physics of the AS CR: Prague, Czech Republic, 2011. [Google Scholar]
- Burla, M.C.; Caliandro, R.; Carrozzini, B.; Cascarano, G.L.; Cuocci, C.; Giacovazzo, C.; Mallamo, M.; Mazzone, A.; Polidori, G. Crystal structure determination and refinement viaSIR2014. J. Appl. Crystallogr. 2015, 48, 306–309. [Google Scholar] [CrossRef]
- Palatinus, L.; Chapuis, G. SUPERFLIP—A computer program for the solution of crystal structures by charge flipping in arbitrary dimensions. J. Appl. Cryst. 2007, 40, 786–790. [Google Scholar] [CrossRef] [Green Version]
- Petřiček, V.; Dusek, M.; Palatinus, L. Crystallographic Computing System JANA2006: General features. Z. Kristallogr. 2014, 229, 345–352. [Google Scholar] [CrossRef]
- Klein, H.; Kodjikian, S.; Philippe, R.; Ding, L.; Colin, C.V.; Darie, C.; Bordet, P. Three different Ge environments in a new Sr5CuGe9O24 phase synthesized at high pressure and high temperature. Acta Cryst. 2020, B76, 727–732. [Google Scholar] [CrossRef]
- Poulsen, R.D.; Jørgensen, M.R.V.; Overgaard, J.; Larsen, F.K.; Morgenroth, W.; Graber, T.; Chen, Y.-S.; Iversen, B.B. Synchrotron X-ray Charge-Density Study of Coordination Polymer [Mn (HCOO)2 (H2O)2]. Chem. Eur. J. 2007, 13, 9775–9790. [Google Scholar] [CrossRef] [Green Version]
- Grey, I.E.; Yoruk, E.; Kodjikian, S.; Klein, H.; Bougerol, C.; Brand, H.E.A.; Bordet, P.; Mumme, W.G.; Favreau, G.; Mills, S.J. Bulachite, [Al6(AsO4)3(OH)9(H2O)4] 2H2O from Cap Garonne, France: Crystal structure and formation from a higher hydrate. Mineral. Mag. 2020, 84, 608–615. [Google Scholar] [CrossRef]
- Redhammer, G.J.; Roth, G.; Topa, D.; Amthauer, G. Synthetic aenigmatite analog Na2(Mn5.26Na0.74)Ge6O20: Structure and crystal chemical considerations. Acta Cryst. 2008, C64, i21–i26. [Google Scholar] [CrossRef] [PubMed]
- Prewitt, C.T.; Sleight, A.W. Garnet-Like Structures of High-Pressure Cadmium Germanate and Calcium Germanate. Science 1969, 163, 386–387. [Google Scholar] [CrossRef] [PubMed]
- Rodriguez-Carvajal, J. Recent advances in magnetic structure determination by neutron powder diffraction. Phys. B 1993, 192, 55–69. [Google Scholar] [CrossRef]
Figure 1.
Sections of the reconstructed 3D reciprocal lattice of Sr5CuGe9O24 (top), cylindrical projection of the intensity clusters used for refining the tilt axis orientation (bottom).
Figure 1.
Sections of the reconstructed 3D reciprocal lattice of Sr5CuGe9O24 (top), cylindrical projection of the intensity clusters used for refining the tilt axis orientation (bottom).
Figure 2.
Projection along the b-axis of the structure of Sr5CuGe9O24.
Figure 2.
Projection along the b-axis of the structure of Sr5CuGe9O24.
Figure 3.
Sections of the reconstructed 3D reciprocal lattice of Mn-formiate (top), cylindrical projection of the intensity clusters used for refining the tilt axis orientation (bottom).
Figure 3.
Sections of the reconstructed 3D reciprocal lattice of Mn-formiate (top), cylindrical projection of the intensity clusters used for refining the tilt axis orientation (bottom).
Figure 4.
Projection along the b-axis of the structure of Mn-formiate ([Mn(HCOO)2(H2O)2]∞.
Figure 4.
Projection along the b-axis of the structure of Mn-formiate ([Mn(HCOO)2(H2O)2]∞.
Figure 5.
Rietveld plot for the refinement of the (Na2/3Mn1/3)3Ge2Ge3O12 garnet structure. Red dots: observed data, black line calculated pattern, blue line: difference. The tick marks are for (Na2/3Mn1/3)3Ge2Ge3O12 top and Na2(Mn5.26Na0.74)Ge6O20 (bottom).
Figure 5.
Rietveld plot for the refinement of the (Na2/3Mn1/3)3Ge2Ge3O12 garnet structure. Red dots: observed data, black line calculated pattern, blue line: difference. The tick marks are for (Na2/3Mn1/3)3Ge2Ge3O12 top and Na2(Mn5.26Na0.74)Ge6O20 (bottom).
Figure 6.
Sections of the reconstructed 3D reciprocal lattice of the garnet (Na2/3Mn1/3)3Ge2Ge3O12 (top), cylindrical projection of the intensity clusters used for refining the tilt axis orientation (bottom).
Figure 6.
Sections of the reconstructed 3D reciprocal lattice of the garnet (Na2/3Mn1/3)3Ge2Ge3O12 (top), cylindrical projection of the intensity clusters used for refining the tilt axis orientation (bottom).
Figure 7.
Projection along the c-axis of the structure of the garnet (Na2/3Mn1/3)3Ge2Ge3O12.
Figure 7.
Projection along the c-axis of the structure of the garnet (Na2/3Mn1/3)3Ge2Ge3O12.
Figure 8.
Sections of the reconstructed 3D reciprocal lattice of bulachite (top), cylindrical projection of the intensity clusters used for refining the tilt axis orientation (bottom).
Figure 8.
Sections of the reconstructed 3D reciprocal lattice of bulachite (top), cylindrical projection of the intensity clusters used for refining the tilt axis orientation (bottom).
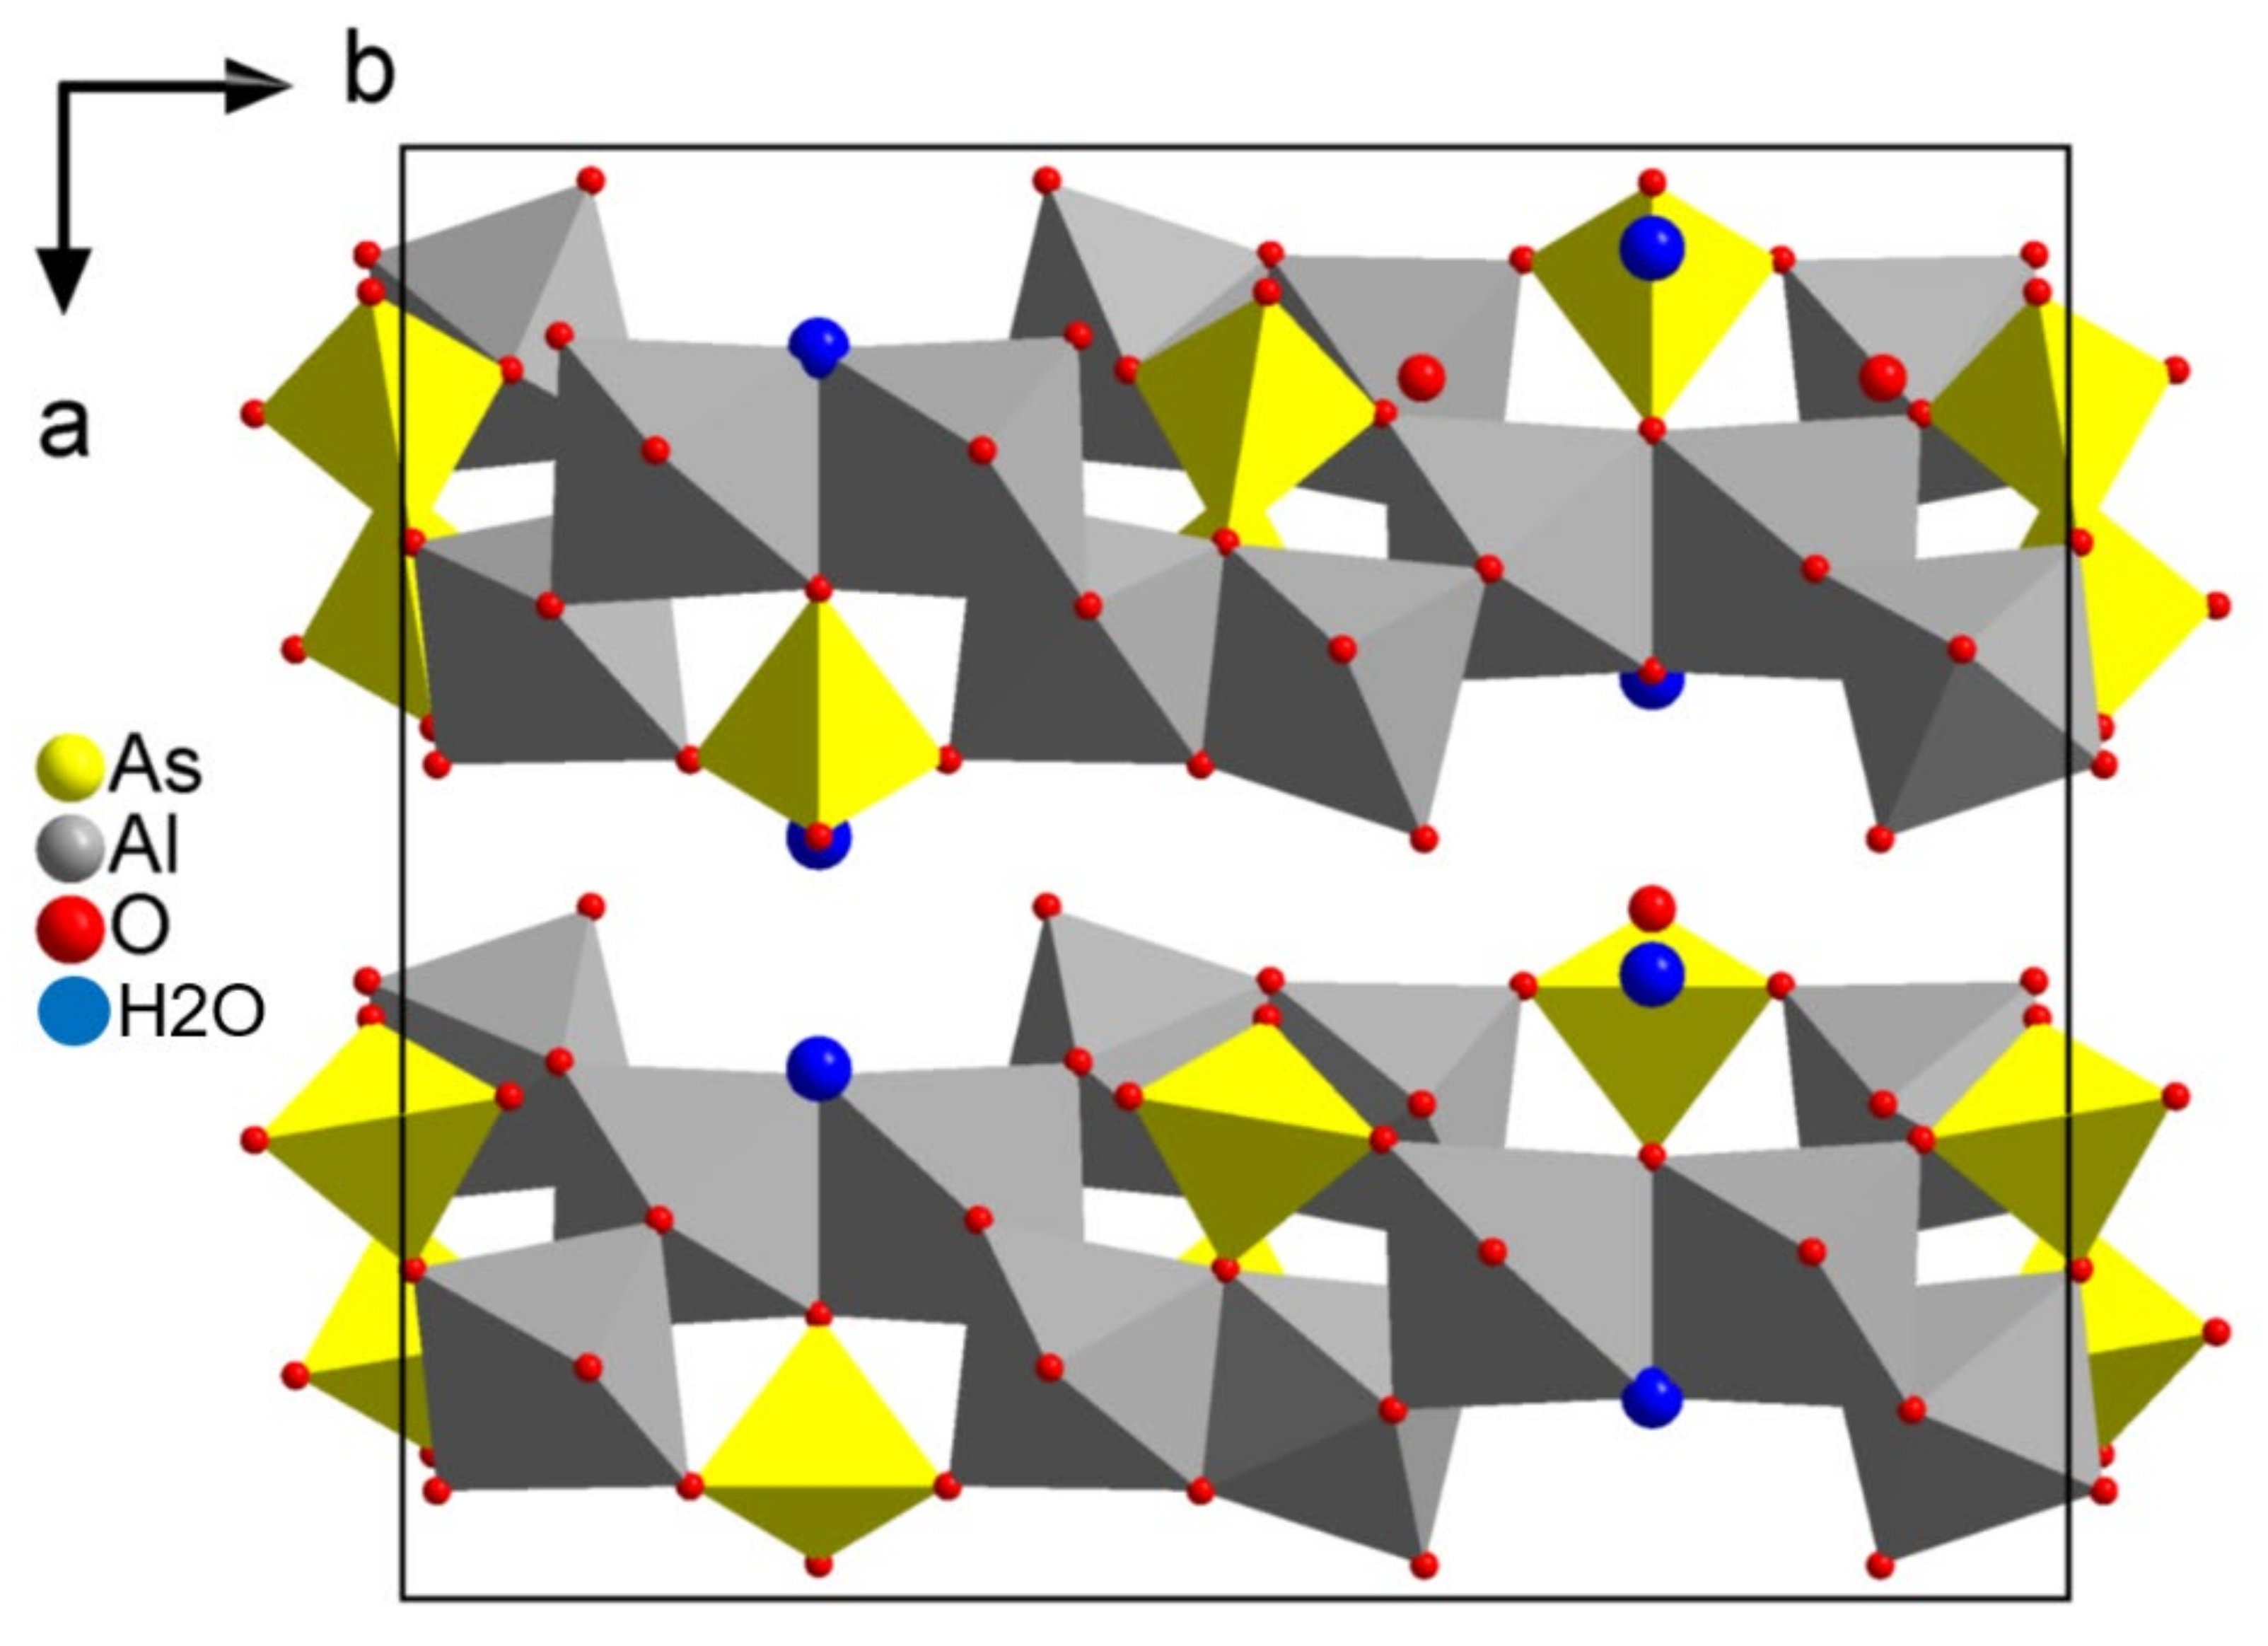
Figure 9.
Projection along the c-axis of the structure of the mineral bulachite [Al6(AsO4)3(OH)9(H2O)4]⋅2H2O.
Figure 9.
Projection along the c-axis of the structure of the mineral bulachite [Al6(AsO4)3(OH)9(H2O)4]⋅2H2O.
Table 1.
Values of the experimental parameters used for the data collection in LD-EDT.
Table 1.
Values of the experimental parameters used for the data collection in LD-EDT.
| Crystal | Tilt Step | Precession Angle | Number of Frames | Exposure Time per Frame | Total Dose |
|---|
| Sr5CuGe9O24 | 1 | 1.05 | 60 | 100 ms | 0.1 e−/Å2 |
| Mn-formiate [Mn(HCOO)2(H2O)2]∞ | 1 | 1.05 | 60 | 200 ms | 0.15 e−/Å2 |
| Garnet (Na2/3Mn1/3)3Ge5O12 | 1 | 1.05 | 95 | 260 ms | 0.13 e−/Å2 |
| Bulachite [Al6(AsO4)3(OH)9(H2O)4]⋅2H2O | 1 | 1.05 | 105 | 500 ms | 3 e−/Å2 |
Table 2.
Structure solution of Sr
5CuGe
9O
24 obtained by electron diffraction and comparison to the positions obtained by X-ray diffraction [
20].
Table 2.
Structure solution of Sr
5CuGe
9O
24 obtained by electron diffraction and comparison to the positions obtained by X-ray diffraction [
20].
| Atom | Wyck | Electron Diffraction Structure Solution | X-ray Diffraction | Difference (Å) | Average Difference (Å) |
|---|
| x | y | z | x | y | z | Uiso |
|---|
| Sr1 | 2e | 0 | 0.357 | 0.75 | 0 | 0.3531(8) | 0.75 | 0.007(2) | 0.031 | |
| Sr2 | 4g | 0.757 | 0.030 | 0.684 | 0.7559(4) | 0.0316(5) | 0.6837(4) | 0.0047(18) | 0.018 | |
| Sr3 | 4g | 0.652 | 0.483 | 0.680 | 0.6505(4) | 0.4849(5) | 0.6817(5) | 0.0080(17) | 0.031 | |
| Ge1 | 4g | 0.852 | 0.709 | 0.936 | 0.8529(5) | 0.7110(6) | 0.9356(5) | 0.0054(19) | 0.020 | |
| Ge2 | 4g | 0.589 | 0.174 | 0.371 | 0.5889(4) | 0.1750(7) | 0.3707(6) | 0.012(2) | 0.008 | |
| Ge3 | 4g | 0.788 | 0.669 | 0.489 | 0.7896(5) | 0.6712(7) | 0.4765(5) | 0.0072(18) | 0.039 | |
| Ge4 | 4g | 0.540 | 0.844 | 0.411 | 0.5412(4) | 0.8401(7) | 0.4122(6) | 0.009(2) | 0.036 | |
| Ge5 | 2e | 0 | 0.780 | 0.75 | 0 | 0.7801(9) | 0.75 | 0.008(2) | 0.001 | |
| Cu1 | 2a | 0 | 0 | 0.5 | 0 | 0 | 0 | 0.006(3) | 0.000 | |
| Cations | | | | | | | | | | 0.021 |
| O1 | 4g | 0.808 | 0.690 | 0.310 | 0.797(2) | 0.695(3) | 0.315(3) | 0.011(2) | 0.159 | |
| O2 | 4g | 0.542 | 0.958 | 0.626 | 0.544(2) | 0.964(3) | 0.630(3) | 0.011(2) | 0.063 | |
| O3 | 4g | 0.922 | 0.607 | 0.841 | 0.944(2) | 0.593(3) | 0.827(3) | 0.011(2) | 0.336 | |
| O4 | 4g | 0.644 | 0.677 | 0.496 | 0.646(2) | 0.675(3) | 0.489(3) | 0.011(2) | 0.088 | |
| O5 | 4g | 0.409 | 0.749 | 0.473 | 0.415(2) | 0.736(3) | 0.469(3) | 0.011(2) | 0.141 | |
| O6 | 4g | 0.662 | 0.985 | 0.410 | 0.671(2) | 0.977(3) | 0.421(3) | 0.011(2) | 0.150 | |
| O7 | 2f | 0.5 | 0.307 | 0.25 | 0.5 | 0.344(5) | 0.25 | 0.011(2) | 0.303 | |
| O8 | 4g | 0.899 | 0.841 | 0.062 | 0.910(2) | 0.818(3) | 0.065(3) | 0.011(2) | 0.224 | |
| O9 | 4g | 0.861 | 0.798 | 0.598 | 0.869(2) | 0.784(3) | 0.595(3) | 0.011(2) | 0.158 | |
| O10 | 4g | 0.704 | 0.733 | 0.828 | 0.716(2) | 0.724(3) | 0.836(3) | 0.011(2) | 0.171 | |
| O11 | 4g | 0.823 | 0.535 | 0.053 | 0.817(2) | 0.527(3) | 0.026(2) | 0.011(2) | 0.281 | |
| O12 | 2f | 0.5 | 0.755 | 0.25 | 0.5 | 0.740(4) | 0.25 | 0.011(2) | 0.122 | |
| O13 | 4g | 0.913 | 0.911 | 0.831 | 0.909(2) | 0.921(3) | 0.820(3) | 0.011(2) | 0.140 | |
| Oxygens | | | | | | | | | | 0.180 |
Table 3.
Structure solution of Mn-formiate obtained by electron diffraction and comparison to the positions obtained by X-ray diffraction [
21].
Table 3.
Structure solution of Mn-formiate obtained by electron diffraction and comparison to the positions obtained by X-ray diffraction [
21].
| Atom | Wyck | Electron Diffraction Structure Solution | X-ray Diffraction | Difference (Å) | Average Difference (Å) |
|---|
| x | y | z | x | y | z | Uiso |
|---|
| Mn1 | 2a | 0 | 0 | 0 | 0 | 0 | 0 | 0.004 | 0.000 | |
| Mn2 | 2d | 0.5 | 0.5 | 0 | 0.5 | 0.5 | 0 | 0.005 | 0.000 | |
| Mn | | | | | | | | | | 0 |
| O1 | 4e | 0.773 | 0.143 | 0.003 | 0.78450(5) | 0.15120(7) | 0.00599(5) | 0.008 | 0.154 | |
| O2 | 4e | 0.563 | 0.217 | 0.081 | 0.56126(6) | 0.21693(8) | 0.08061(6) | 0.008 | 0.024 | |
| O3 | 4e | 0.905 | 0.597 | 0.295 | 0.90332(6) | 0.60127(8) | 0.29393(5) | 0.007 | 0.036 | |
| O4 | 4e | 0.920 | 0.769 | 0.105 | 0.91588(6) | 0.75836(7) | 0.09698(5) | 0.007 | 0.116 | |
| O5 | 4e | 0.588 | 0.593 | 0.197 | 0.59155(6) | 0.61552(10) | 0.20059(6) | 0.01 | 0.197 | |
| O6 | 4e | 0.265 | 0.467 | 0.061 | 0.27190(5) | 0.48558(8) | 0.06818(5) | 0.008 | 0.184 | |
| C1 | 4e | 0.328 | 0.897 | 0.939 | 0.67129(5) | 0.11072(7) | 0.06784(5) | 0.007 | 0.100 | |
| C2 | 4e | 0.955 | 0.722 | 0.223 | 0.96723(6) | 0.71297(7) | 0.22071(5) | 0.008 | 0.130 | |
| O and C | | | | | | | | | | 0.118 |
Table 4.
Structure solution of bulachite obtained by electron diffraction and comparison to the positions obtained by X-ray diffraction [
22].
Table 4.
Structure solution of bulachite obtained by electron diffraction and comparison to the positions obtained by X-ray diffraction [
22].
| Atom | Wyck | Electron Diffraction Structure Solution | Synchrotron Radiation Diffraction | Difference (Å) |
|---|
| x | y | z | x | Y | z |
|---|
| As1 | 8d | 0.825 | 0.010 | 0.383 | 0.82245(18) | 0.00921(19) | 0.3827(4) | 0.042 |
| As2 | 4c | 0.900 | 0.25 | 0.574 | 0.9057(3) | 0.25 | 0.5824(6) | 0.111 |
| Al1 | 8d | 0.634 | 0.070 | 0.242 | 0.6329(6) | 0.0696(5) | 0.2444(17) | 0.027 |
| Al2 | 8d | 0.837 | 0.100 | 0.752 | 0.8397(6) | 0.0964(5) | 0.7535(16) | 0.064 |
| Al3 | 8d | 0.711 | 0.169 | 0.495 | 0.7207(6) | 0.1692(6) | 0.4971(16) | 0.152 |
| O1 | 8d | 0.733 | 0.998 | 0.284 | 0.7276(5) | 0.9939(6) | 0.2856(14) | 0.112 |
| O2 | 8d | 0.895 | 0.019 | 0.230 | 0.9002(6) | 0.0190(6) | 0.2359(12) | 0.094 |
| O3 | 8d | 0.815 | 0.092 | 0.500 | 0.8160(7) | 0.0885(5) | 0.5006(13) | 0.064 |
| O4 | 8d | 0.846 | 0.936 | 0.503 | 0.8459(7) | 0.9358(5) | 0.5099(13) | 0.055 |
| O5 | 4c | 0.802 | 0.25 | 0.495 | 0.8043(5) | 0.25 | 0.5078(18) | 0.108 |
| O6 | 4c | 0.984 | 0.25 | 0.418 | 0.9752(8) | 0.25 | 0.4186(14) | 0.137 |
| O7 | 8d | 0.917 | 0.175 | 0.701 | 0.9217(6) | 0.17267(14) | 0.7019(7) | 0.084 |
| Oh1 | 8d | 0.708 | 0.158 | 0.250 | 0.7085(9) | 0.1522(7) | 0.250(2) | 0.103 |
| Oh2 | 8d | 0.639 | 0.095 | 0.480 | 0.6300(10) | 0.0952(9) | 0.4819(19) | 0.141 |
| Oh3 | 8d | 0.919 | 0.021 | 0.749 | 0.9259(8) | 0.0208(7) | 0.772(3) | 0.212 |
| Oh4 | 8d | 0.739 | 0.157 | 0.735 | 0.7386(8) | 0.1541(7) | 0.740(2) | 0.065 |
| Oh5 | 4c | 0.646 | 0.25 | 0.522 | 0.6390(13) | 0.25 | 0.511(3) | 0.140 |
| Ow1 | 8d | 0.518 | 0.121 | 0.202 | 0.5229(9) | 0.1135(7) | 0.226(3) | 0.245 |
| Ow2 | 8d | 0.848 | 0.116 | 0.991 | 0.8415(13) | 0.1119(9) | 0.9944(19) | 0.128 |
| W1 | 4c | 0.948 | 0.25 | 0.029 | 0.93 | 0.25 | 0.018 | 0.294 |
| W2 | 4c | 0.363 | 0.75 | 0.063 | 0.3652 | 0.75 | 0.0187 | 0.354 |
Table 5.
Final R-values of the dynamical refinements.
Table 5.
Final R-values of the dynamical refinements.
| | R(obs) | wR(obs) | R(all) | wR(all) | GoF(all) | GoF(obs) |
|---|
| Sr5CuGe9O24 | 5.80 | 6.87 | 33.69 | 14.65 | 0.84 | 0.41 |
| Mn-formiate [Mn(HCOO)2(H2O)2]∞ | 7.25 | 9.53 | 58.66 | 18.48 | 1.29 | 0.43 |
| Garnet (Na2/3Mn1/3)3Ge2Ge3O12 | 7.62 | 9.15 | 44.80 | 17.02 | 0.96 | 0.48 |
| Bulachite [Al6(AsO4)3(OH)9(H2O)4]⋅2H2O | 10.56 | 11.15 | 24.68 | 13.37 | 2.24 | 1.24 |
Table 6.
Comparison of the atomic positions for Sr5CuGe9O24 refined using electron diffraction data with those refined using X-ray diffraction data.
Table 6.
Comparison of the atomic positions for Sr5CuGe9O24 refined using electron diffraction data with those refined using X-ray diffraction data.
| Atom | Wyck | X-ray Diffraction | Electron Diffraction Dynamical Refinement | Difference (Å) | Average Difference (Å) |
|---|
| x | y | z | Uiso | x | y | z | Uiso |
|---|
| Sr1 | 2e | 0 | 0.3531(8) | 0.75 | 0.007(2) | 0 | 0.3561(6) | 0.75 | −0.0179(3) | 0.024 | |
| Sr2 | 4g | 0.7559(4) | 0.0316(5) | 0.6837(4) | 0.0047(18) | 0.7553(5) | 0.0322(6) | 0.6833(6) | −0.0039(11) | 0.009 | |
| Sr3 | 4g | 0.6505(4) | 0.4849(5) | 0.6817(5) | 0.0080(17) | 0.6520(4) | 0.4850(6) | 0.6814(5) | −0.0110(7) | 0.019 | |
| Ge1 | 4g | 0.8529(5) | 0.7110(6) | 0.9356(5) | 0.0054(19) | 0.8524(3) | 0.7086(4) | 0.9339(4) | −0.0192(2) | 0.026 | |
| Ge2 | 4g | 0.5889(4) | 0.1750(7) | 0.3707(6) | 0.012(2) | 0.5865(6) | 0.1747(8) | 0.3711(8) | −0.0202(2) | 0.029 | |
| Ge3 | 4g | 0.7896(5) | 0.6712(7) | 0.4765(5) | 0.0072(18) | 0.7859(3) | 0.6706(4) | 0.4772(4) | −0.0200(3) | 0.045 | |
| Ge4 | 4g | 0.5412(4) | 0.8401(7) | 0.4122(6) | 0.009(2) | 0.5403(7) | 0.8464(9) | 0.4120(9) | 0.0033(15) | 0.052 | |
| Ge5 | 2e | 0 | 0.7801(9) | 0.75 | 0.008(2) | 0 | 0.7817(5) | 0.75 | 0.0008(14) | 0.013 | |
| Cu1 | 2a | 0 | 0 | 0 | 0.006(3) | 0 | 0 | 0.5 | 0.0037(22) | 0.000 | |
| Cations | | | | | | | | | | | 0.024 |
| O1 | 4g | 0.797(2) | 0.695(3) | 0.315(3) | 0.011(2) | 0.7981(13) | 0.6906(18) | 0.3083(16) | −0.0076(27) | 0.080 | |
| O2 | 4g | 0.544(2) | 0.964(3) | 0.630(3) | 0.011(2) | 0.5411(9) | 0.9594(12) | 0.6305(12) | −0.0178(9) | 0.052 | |
| O3 | 4g | 0.944(2) | 0.593(3) | 0.827(3) | 0.011(2) | 0.9390(14) | 0.6108(21) | 0.8369(19) | −0.0051(32) | 0.186 | |
| O4 | 4g | 0.646(2) | 0.675(3) | 0.489(3) | 0.011(2) | 0.6491(6) | 0.6840(8) | 0.4929(7) | −0.0209(4) | 0.129 | |
| O5 | 4g | 0.415(2) | 0.736(3) | 0.469(3) | 0.011(2) | 0.4115(25) | 0.7426(31) | 0.4586(33) | 0.0442(81) | 0.116 | |
| O6 | 4g | 0.671(2) | 0.977(3) | 0.421(3) | 0.011(2) | 0.6619(16) | 0.9801(22) | 0.4034(21) | 0.0057(44) | 0.189 | |
| O7 | 2f | 0.5 | 0.344(5) | 0.25 | 0.011(2) | 0.5 | 0.3095(14) | 0.25 | −0.0190(9) | 0.283 | |
| O8 | 4g | 0.910(2) | 0.818(3) | 0.065(3) | 0.011(2) | 0.9003(14) | 0.8253(20) | 0.0713(19) | −0.0028(34) | 0.150 | |
| O9 | 4g | 0.869(2) | 0.784(3) | 0.595(3) | 0.011(2) | 0.8685(18) | 0.8045(25) | 0.6051(23) | 0.0154(53) | 0.198 | |
| O10 | 4g | 0.716(2) | 0.724(3) | 0.836(3) | 0.011(2) | 0.7151(16) | 0.7362(22) | 0.8340(22) | 0.0071(47) | 0.104 | |
| O11 | 4g | 0.817(2) | 0.527(3) | 0.026(2) | 0.011(2) | 0.8280(19) | 0.5366(25) | 0.0305(23) | 0.0141(53) | 0.157 | |
| O12 | 2f | 0.5 | 0.740(4) | 0.25 | 0.011(2) | 0.5 | 0.7521(43) | 0.25 | 0.0402(112) | 0.098 | |
| O13 | 4g | 0.909(2) | 0.921(3) | 0.820(3) | 0.011(2) | 0.9184(13) | 0.9043(18) | 0.8380(17) | −0.0101(24) | 0.238 | |
| Oxygens | | | | | | | | | | | 0.152 |
Table 7.
Comparison of the atomic positions for Mn-formiate refined using electron diffraction data with those refined using X-ray diffraction data [
21].
Table 7.
Comparison of the atomic positions for Mn-formiate refined using electron diffraction data with those refined using X-ray diffraction data [
21].
| Atom | Wyck | X-ray Diffraction | Electron Diffraction Refinement | Difference (Å) | Average Difference (Å) |
|---|
| x | y | z | Uiso | x | y | z | Uiso |
|---|
| Mn1 | 2a | 0 | 0 | 0 | 0.004 | 0 | 0 | 0 | −0.0208(6) | 0.000 | |
| Mn2 | 2d | 0.5 | 0.5 | 0 | 0.005 | 0.5 | 0.5 | 0 | 0.0190(20) | 0.000 | |
| Mn | | | | | | | | | | | 0 |
| O1 | 4e | 0.78450(5) | 0.15120(7) | 0.00599(5) | 0.008 | 0.7822(12) | 0.1657(24) | 0.0020(11) | 0.0132(31) | 0.118 | |
| O2 | 4e | 0.56126(6) | 0.21693(8) | 0.08061(6) | 0.008 | 0.5811(10) | 0.1926(22) | 0.0769(9) | −0.0006(24) | 0.263 | |
| O3 | 4e | 0.90332(6) | 0.60127(8) | 0.29393(5) | 0.007 | 0.9102(13) | 0.6294(25) | 0.2995(13) | 0.0117(32) | 0.251 | |
| O4 | 4e | 0.91588(6) | 0.75836(7) | 0.09698(5) | 0.007 | 0.937(11) | 0.7687(25) | 0.1142(10) | 0.0112(29) | 0.246 | |
| O5 | 4e | 0.59155(6) | 0.61552(10) | 0.20059(6) | 0.01 | 0.5930(16) | 0.6017(35) | 0.2174(17) | 0.0700(62) | 0.193 | |
| O6 | 4e | 0.27190(5) | 0.48558(8) | 0.06818(5) | 0.008 | 0.2667(13) | 0.4926(32) | 0.0573(14) | 0.0289(40) | 0.120 | |
| C1 | 4e | 0.67129(5) | 0.11072(7) | 0.06784(5) | 0.007 | 0.6775(6) | 0.1198(11) | 0.0636(5) | −0.0311(4) | 0.101 | |
| C2 | 4e | 0.96723(6) | 0.71297(7) | 0.22071(5) | 0.008 | 0.9790(12) | 0.7221(28) | 0.2247(11) | 0.0120(32) | 0.131 | |
| O and C | | | | | | | | | | | 0.178 |
Table 8.
Comparison of the refined atomic positions and occupancies from LD-EDT data for the garnet (Na2/3Mn1/3)3Ge2Ge3O12 with the X-ray refined positions.
Table 8.
Comparison of the refined atomic positions and occupancies from LD-EDT data for the garnet (Na2/3Mn1/3)3Ge2Ge3O12 with the X-ray refined positions.
| Atom | Wyck | Dynamical Refinement From LD-EDT Data | X-ray Diffraction Refinement | Distance (Å) |
|---|
| x | y | z | Occ | Uiso | x | y | z | Occ | Uiso |
|---|
| Ge1 | 16a | 0 | 0 | 0 | 1 | −0.0215(1) | 0 | 0 | 0 | 1 | 0.01267 | |
| Ge2 | 24d | 3/8 | 0 | 1/4 | 1 | 0.0044(8) | 3/8 | 0 | 1/4 | 1 | 0.00633 | |
| Mn1 | 24c | 1/8 | 0 | 1/4 | 0.36(2) | 0.021(2) | 1/8 | 0 | 1/4 | 1/3 | 0.00887 | |
| Na1 | 24c | 1/8 | 0 | 1/4 | 0.64(2) | 0.021(2) | 1/8 | 0 | 1/4 | 2/3 | 0.00887 | |
| O1 | 96h | 0.0339(4) | 0.0471(4) | 0.6474(4) | 1 | 0.0008(9) | 0.0301(6) | 0.0469(7) | 0.6470(7) | 1 | 0.01267 | 0.046 |
Table 9.
Comparison of the atomic positions for bulachite refined using electron diffraction data with those refined using X-ray diffraction data.
Table 9.
Comparison of the atomic positions for bulachite refined using electron diffraction data with those refined using X-ray diffraction data.
| Atom | Wyck | Synchrotron Radiation Diffraction | Electron Diffraction Refinement | Difference (Å) | |
|---|
| x | y | z | B (Å2) | x | y | z | Uiso |
|---|
| As1 | 8d | 0.82245(18) | 0.00921(19) | 0.3827(4) | 0.0368(6) | 0.8242(2) | 0.0097(1) | 0.3832(2) | 0.0086(4) | 0.031 | Average cation distance: 0.057 Å |
| As2 | 4c | 0.9057(3) | 0.25 | 0.5824(6) | 0.0368(6) | 0.9034(3) | 0.25 | 0.5773(3) | 0.0074(6) | 0.054 |
| Al1 | 8d | 0.6329(6) | 0.0696(5) | 0.2444(17) | 0.0368(6) | 0.6334(4) | 0.0720(2) | 0.2396(4) | 0.0051(8) | 0.055 |
| Al2 | 8d | 0.8397(6) | 0.0964(5) | 0.7535(16) | 0.0368(6) | 0.8393(4) | 0.0966(2) | 0.7480(4) | 0.0063(7) | 0.056 |
| Al3 | 8d | 0.7207(6) | 0.1692(6) | 0.4971(16) | 0.0368(6) | 0.7140(4) | 0.1665(2) | 0.4916(4) | 0.0052(8) | 0.091 |
| O1 | 8d | 0.7276(5) | 0.9939(6) | 0.2856(14) | 0.0186(15) | 0.7289(7) | 0.9977(3) | 0.2846(6) | 0.0223(13) | 0.071 | Average oxygen distance (with ionic bonding): 0.102Å |
| O2 | 8d | 0.9002(6) | 0.0190(6) | 0.2359(12) | 0.0186(15) | 0.9011(7) | 0.0219(3) | 0.2307(6) | 0.0244(13) | 0.067 |
| O3 | 8d | 0.8160(7) | 0.0885(5) | 0.5006(13) | 0.0186(15) | 0.8128(7) | 0.0906(3) | 0.4958(6) | 0.0241(13) | 0.073 |
| O4 | 8d | 0.8459(7) | 0.9358(5) | 0.5099(13) | 0.0186(15) | 0.8407(7) | 0.9334(3) | 0.5053(6) | 0.0246(13) | 0.099 |
| O5 | 4c | 0.8043(5) | 0.25 | 0.5078(18) | 0.0186(15) | 0.8037(8) | 0.25 | 0.4855(7) | 0.0060(14) | 0.178 |
| O6 | 4c | 0.9752(8) | 0.25 | 0.4186(14) | 0.0186(15) | 0.9862(11) | 0.25 | 0.4348(10) | 0.0380(24) | 0.191 |
| O7 | 8d | 0.9217(6) | 0.17267(14) | 0.7019(7) | 0.0186(15) | 0.9179(7) | 0.1751(3) | 0.7036(6) | 0.0149(12) | 0.075 |
| Oh1 | 8d | 0.7085(9) | 0.1522(7) | 0.250(2) | 0.0186(15) | 0.7088(6) | 0.1552(2) | 0.2458(6) | 0.0107(11) | 0.062 |
| Oh2 | 8d | 0.6300(10) | 0.0952(9) | 0.4819(19) | 0.0186(15) | 0.6295(7) | 0.0921(3) | 0.4776(6) | 0.0200(13) | 0.050 |
| Oh3 | 8d | 0.9259(8) | 0.0208(7) | 0.772(3) | 0.0186(15) | 0.9323(6) | 0.0219(2) | 0.7482(6) | 0.0107(11) | 0.215 |
| Oh4 | 8d | 0.7386(8) | 0.1541(7) | 0.740(2) | 0.0186(15) | 0.7368(6) | 0.1569(2) | 0.7322(6) | 0.0167(12) | 0.084 |
| Oh5 | 4c | 0.6390(13) | 0.25 | 0.511(3) | 0.0186(15) | 0.6445(9) | 0.25 | 0.5121(7) | 0.0084(15) | 0.064 |
| Ow1 | 8d | 0.5229(9) | 0.1135(7) | 0.226(3) | 0.0186(15) | 0.5233(8) | 0.1238(3) | 0.2010(7) | 0.0346(16) | 0.270 | H2O polyhedra: 0.198 Å |
| Ow2 | 8d | 0.8415(13) | 0.1119(9) | 0.9944(19) | 0.0186(15) | 0.8420(8) | 0.1189(3) | 0.9924(7) | 0.0341(15) | 0.125 |
| W1 | 4c | 0.93 | 0.25 | 0.018 | 0.074(11) | 0.9654(13) | 0.25 | 0.0290(12) | 0.0611(31) | 0.560 | Free H2O: 0.53 Å |
| W2 | 4c | 0.3652 | 0.75 | 0.0187 | 0.074(11) | 0.3400(20) | 0.75 | 0.0581(18) | 0.1872(66) | 0.503 |
| Publisher’s Note: MDPI stays neutral with regard to jurisdictional claims in published maps and institutional affiliations. |
© 2022 by the authors. Licensee MDPI, Basel, Switzerland. This article is an open access article distributed under the terms and conditions of the Creative Commons Attribution (CC BY) license (https://creativecommons.org/licenses/by/4.0/).


