1. Introduction
The coseismic deformation field is caused by fault dislocation, distributed in the area near the fault, and is the dominant factor causing the seismic response of underground engineering structures in the near-fault region. Wells and Coppersmith [
1] gave the surface displacement-earthquake magnitude fitting relationship through the statistics and analysis of surface rupture zone observation data worldwide, which was used as a basis for assessing the maximum deformation of the coseismic deformation field at different earthquake magnitudes. J. Cheng [
2] described the relationship between rupture and earthquake magnitude in China and compared it with the worldwide pattern. Further, Ran H.L. [
3] presented the surface deformation data for western China.
Underground projects such as tunnels play an important role as lifeline projects in daily production life and post-earthquake disaster relief. The existing studies mainly focus on the surface area of the co-earthquake deformation field. The ground deformation caused by the occultation rupture [
4] extends from the fault surface, and the difference between surface and subsurface deformation becomes non-negligible with increasing depth. Callisto [
5] found that the same significant seismic damage exists in deeply buried tunnels in a statistical study of seismic damage. A similar typical situation was also found in the Longxi tunnel [
6] in the Wenchuan earthquake, which was a typical deeply buried tunnel that also suffered severe damage during the earthquake. In a study of the Kumamoto earthquake, Zhang X. [
7] found a correlation between seismic damage and surface coseismic deformation in the Tawarayama tunnel. Huang, Lu Y. [
8] studied the significance of coseismic displacement for tunnel design. K. Ma [
9] found that the stability of the surrounding rock around the underground structure is closely related to the distance between the structure and the fault. Shrestha Rajyaswori [
10] found that the factors influencing the seismic damage of tunnels in the near-fault region are fault distance, earthquake magnitude, and burial depth of the structure. With the increase in the burial depth of engineering structures in near-fault regions, the existing knowledge of the depth of the coseismic deformation field lags behind the current engineering practice, and it is necessary to extend the study of the coseismic deformation field from the surface to the deeply buried strata in the burial depth range of underground engineering.
For the coseismic deformation field inside the strata, scholars have researched from the perspectives of experiments, numerical simulations, and theories, etc. Anastasopoulos [
11] studied the surface deformation and rupture law caused by fault dislocation based on model tests; Ashtiani [
12] studied the effect of fault dislocation on building foundation by centrifugal tests. Model tests are limited by the research tools and cannot consider both structural scale and fault scale. Loukidis [
13] studied the process of fault rupture propagation in sandy soil by numerical simulation. Baziar [
14] evaluated the effect of fault dislocation on tunnel structure by a numerical model. Li H. [
15] studied the propagation law of fault dislocations and the influencing factors of surface deformation based on the finite element method. Compared with model tests, numerical methods can study a larger scale area, but the large computational volume prevents them from being able to have a sufficiently fine simulation of the strata at the structural scale while considering faults. At present, the research on the interior of the strata is mainly focused on the fault scale, and the research on the deformation field of the strata within the burial depth of the structure at the engineering scale is rarely reported.
By studying the distribution of the deformation degree of the deformation field inside the strata, it is of great significance to quickly and accurately evaluate the ground shaking damage force and guide the post-earthquake emergency rescue. Most of the current seismic intensities are classified by the PGA of ground shaking, while there is no relevant index for the evaluation of the degree of stratigraphic dislocation. Zhang C. J. [
16] found that the surface ground shaking intensity has a strong correlation with the earthquake coseismic deformation field. The existing code [
17] has only a rough suggested value for the avoidance of the fault-affected zone for above-ground structures, and there is no clear method and standard for the consideration of anti-staggering for underground works in the near-fault area. Concerning the concept of ground vibration intensity distribution at the surface, it is necessary to introduce a corresponding concept to quantitatively describe the distribution of the ground deformation degree inside the strata, defining this indicator as to the deformation intensity.
Because of the large spatial location difference between the stratum in which the deeply buried tunnel is located and the surface and the need to recognize the influence of the deformation field inside the stratum on the underground engineering, this paper investigates the intensity of stratum deformation inside the stratum. Firstly, based on the fault parameters obtained from the inversion of the typical Yushu earthquake in the Sichuan–Tibet region of China, the coseismic deformation field is calculated orthogonally in combination with the stratigraphic model of the Sichuan–Tibet region. The calculated results are compared with the surface observed deformation fields to verify the accuracy of the calculated results and the applicability of the adopted method. Based on the validated model, the deformation distribution law of the internal deformation field of the strata is analyzed according to the deformation propagation law with the surface deformation field and fault parameters as constraints. Typical monitoring locations are selected to statistically regress the equation of the relationship between the maximum deformation of the strata and the seismic intensity within a certain depth underground. By introducing the concept of deformation intensity and referring to the relevant structural deformation index, the intensity division of the subsurface deformation field is performed to form the intra-stratigraphic deformation intensity partition. The results obtained in this paper are intended to provide a basis for future construction of underground structures, such as tunnels near faults, and to provide a useful reference for rapid damage assessment and rescue planning in the relevant areas after earthquakes.
2. Modeling of Stratigraphic Deformation Field in the Sichuan–Tibet Region
2.1. Calculation Method Based on Dislocation Model
The coseismic displacement field caused by fault dislocation can be described by the dislocation theory. J.A. Steketee et al. [
18] were the first to introduce the elastic dislocation theory into the calculation of the earthquake coseismic deformation field, and then scholars worldwide made further developments and refinements on this basis. Y. Okada et al. [
19,
20] generalized the equation for the stratigraphic deformation caused by faults in the elastic half-space and formed one of the most widely used equations, which is shown in Equation (1)
where
,
,
) denotes the dislocation deformation field generated by the dislocation
(
) over the entire surface
in an isotropic medium.
Hashima A. et al. [
21] studied stratified half-space moderate effect strain fields and demonstrated by comparison that the results based on stratified stratigraphic models are more accurate than those obtained by uniform half-space stratigraphic models. Subsequently, Wang R.J. et al. [
22,
23] improved the transfer stability of Green’s function in stratigraphic strata to control the propagation of computational errors in stratigraphic strata calculations. Zhou J. et al. [
24] analyzed the calculation of the internal deformation field of a spherical formation and found that the influence of the earth curvature effect on the formation deformation is small in the near field within 100 km of the fault. Dong J. et al. [
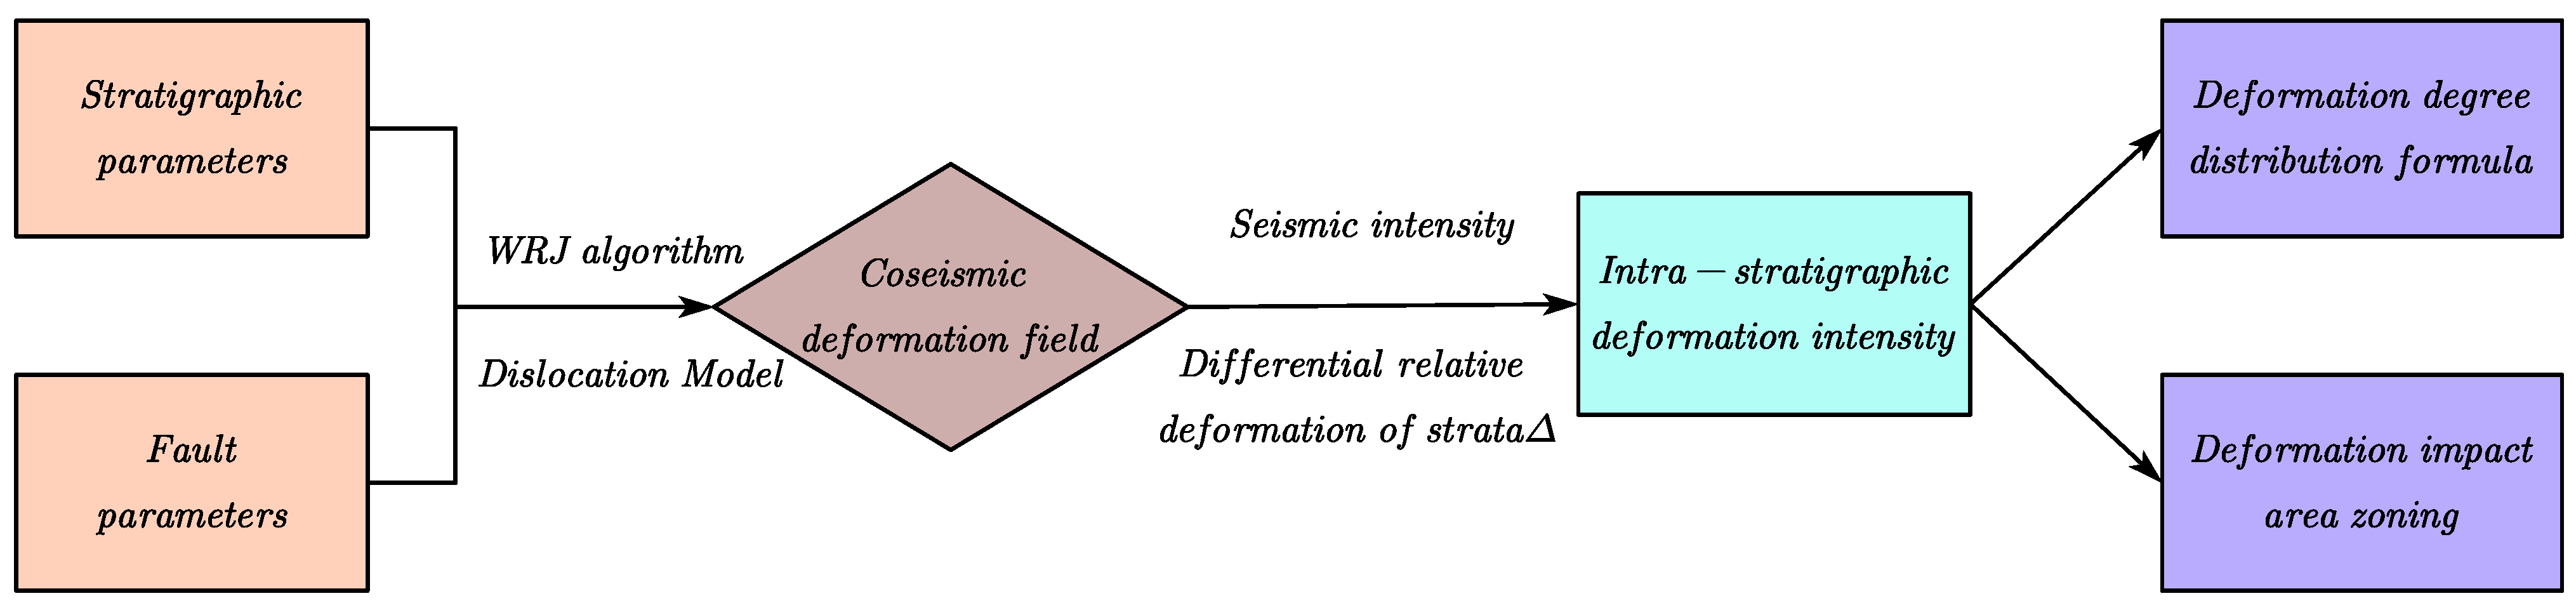
25] also found that the effect of geocurvature can be neglected in the local area of the near field. Taking into account the above research results, this paper proposes to use the Green’s function based on the horizontal stratigraphy in the near-fault zone at the engineering scale to calculate the co-seismic deformation field inside and at the surface of the strata by combining the fault model and stratigraphic model parameters, and the overall workflow is shown in
Figure 1.
2.2. Typical Earthquake Example Verification
At 7:49 a.m. on 14 April 2010, an earthquake of magnitude 7.1 on the Richter scale occurred in Yushu County, Yushu Tibetan Autonomous Prefecture, Qinghai Province, with a typical left-rotation almost purely strike-slip fault. The intensity of the epicenter reached nine degrees, causing a large number of casualties and property damage and was another earthquake that triggered serious disasters in China after the Wenchuan earthquake.
With the progress of measurement technology, geodetic data, such as GPS and INSAR, have a high surface coverage, which provides good conditions for studying the surface coseismic deformation field. Wang Q.C. [
26] found that the Yushu M
S7.3 earthquakes occurred on the Ganzi–Yushu fault zone, and the source fault was a north-west-trending high-angle fault. Shan B. [
27] simplified the finite fault model of the Yushu earthquake by ignoring the bending of the fault rupture surface in the northwest section, but the simplification of the model had less effect on the results because the coseismic dislocations of the Yushu earthquake were mainly located in the southeast section of the rupture surface. The above studies and the corresponding fault inversion data [
28] were synthesized, and the average slip of the Yushu earthquake-prone fault was determined to be 1.1 m. The specific parameters are shown in
Table 1.
To obtain a more accurate inversion, detailed stratigraphic parameters were collected for the Yushu area. Wu J. P. [
29] gave a model of the crustal velocity structure in the Sichuan and Yunnan regions in western China, which is shown in
Table 2.
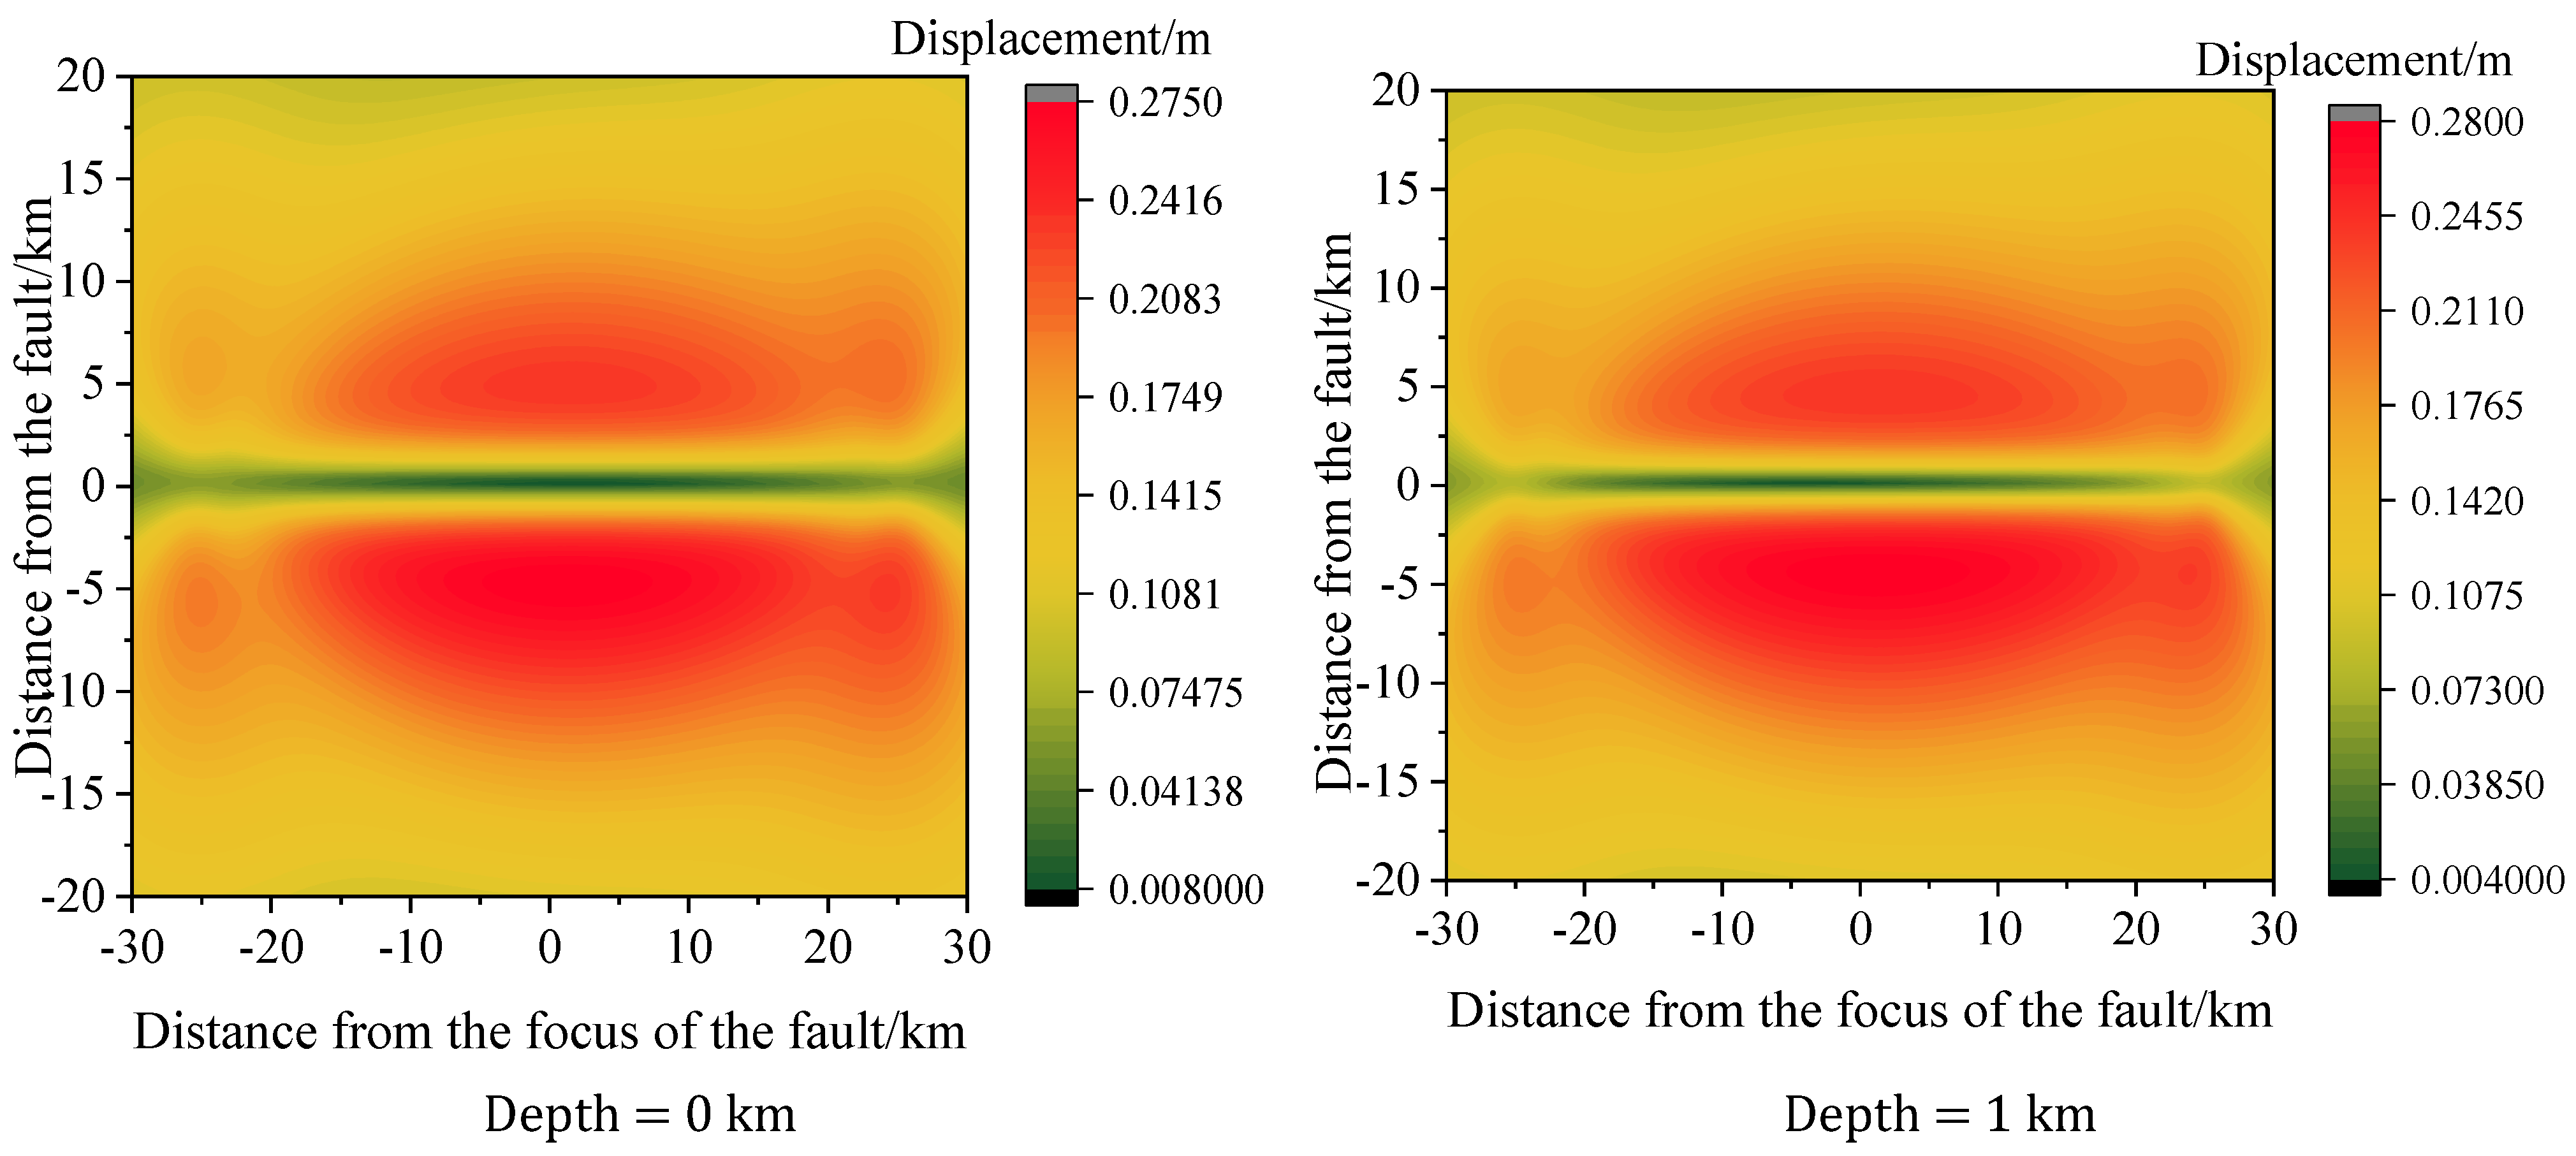
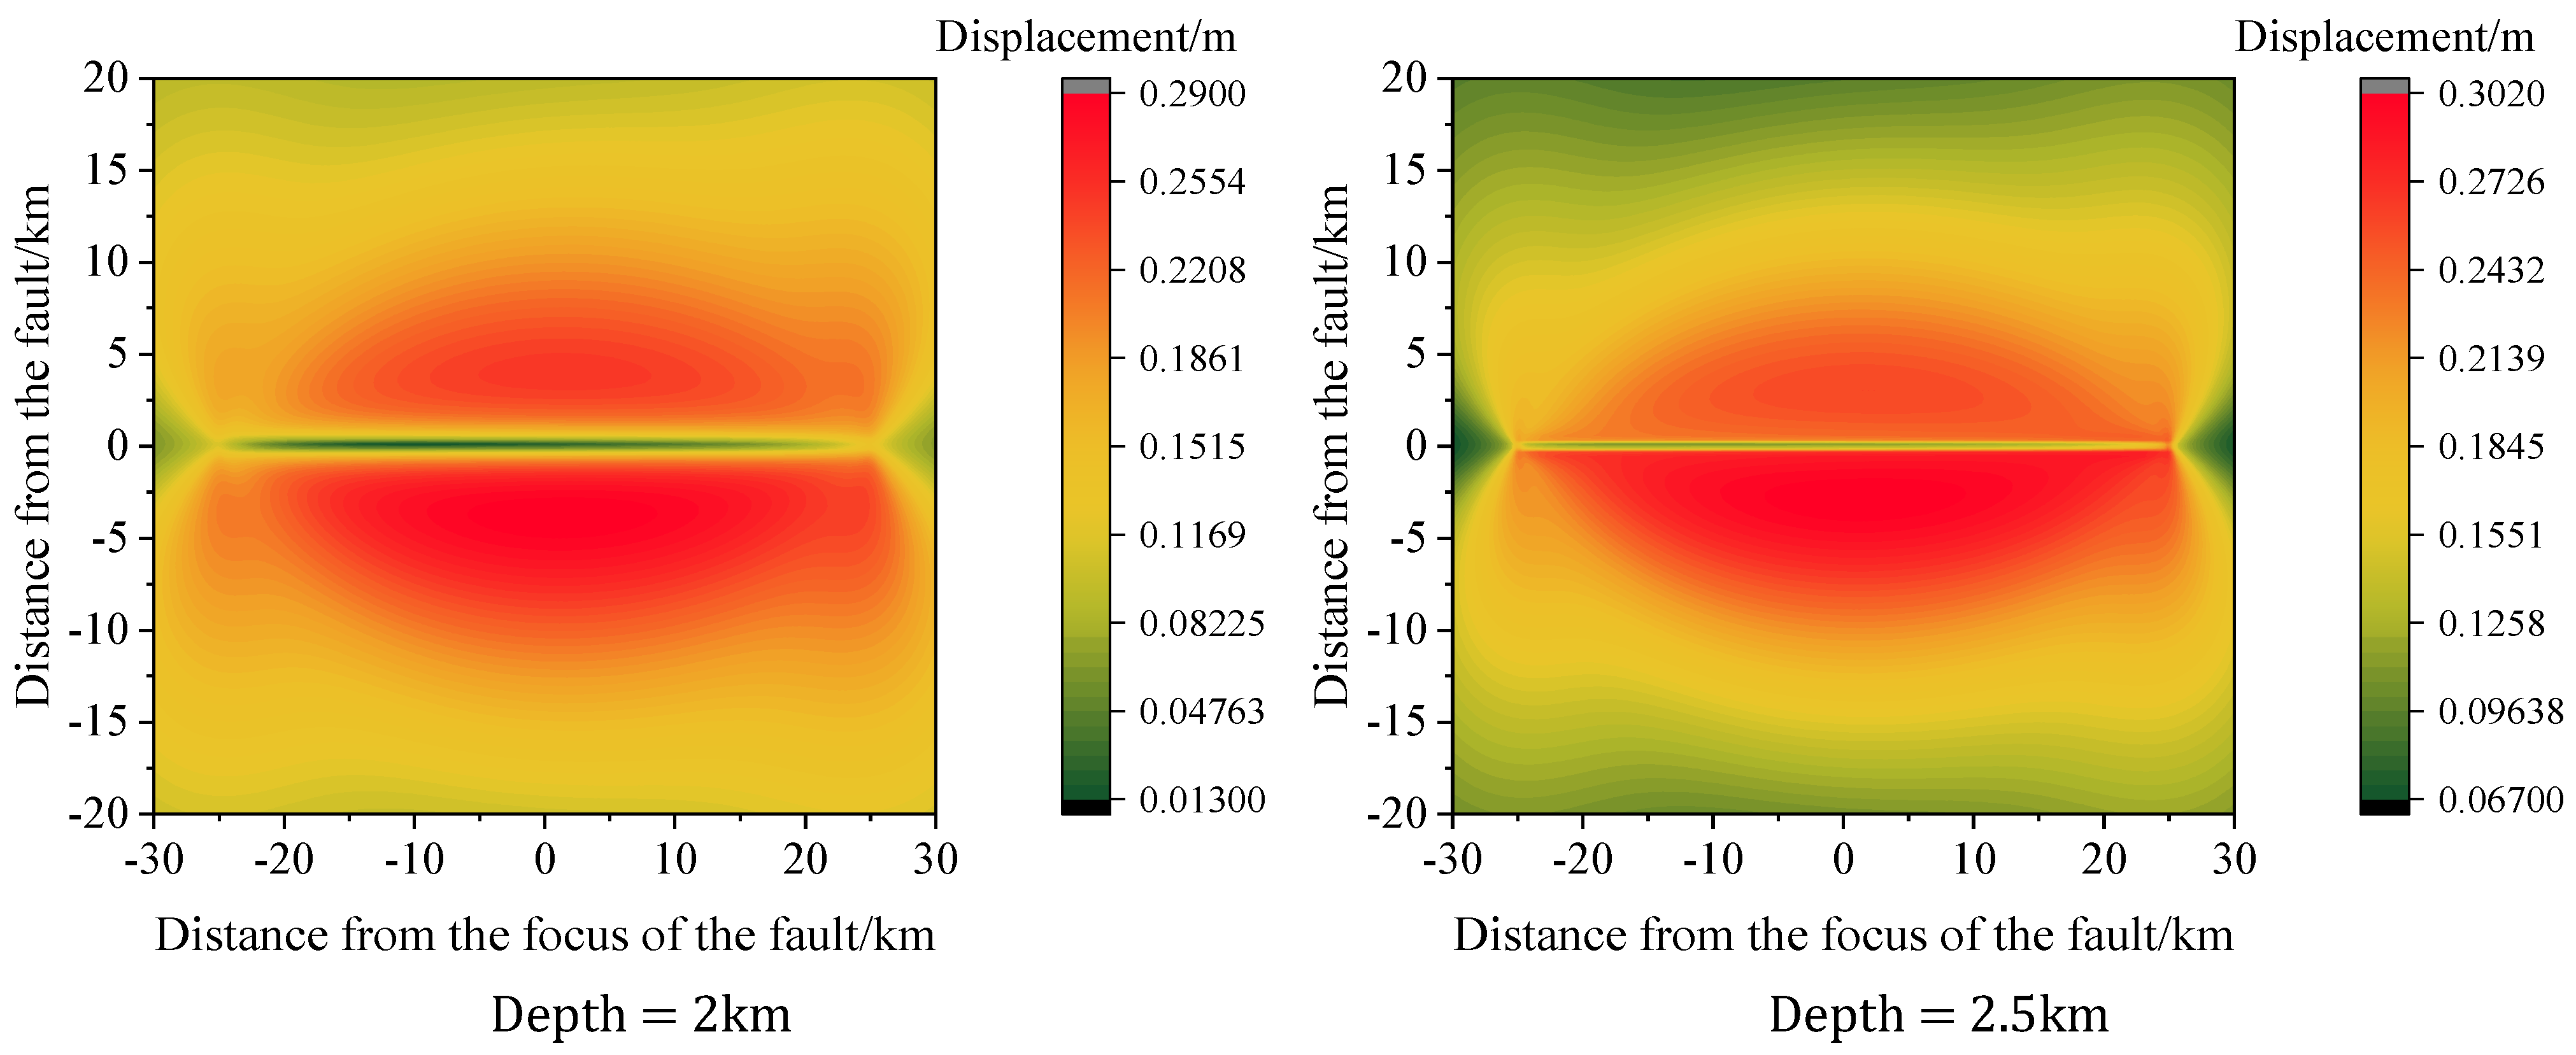
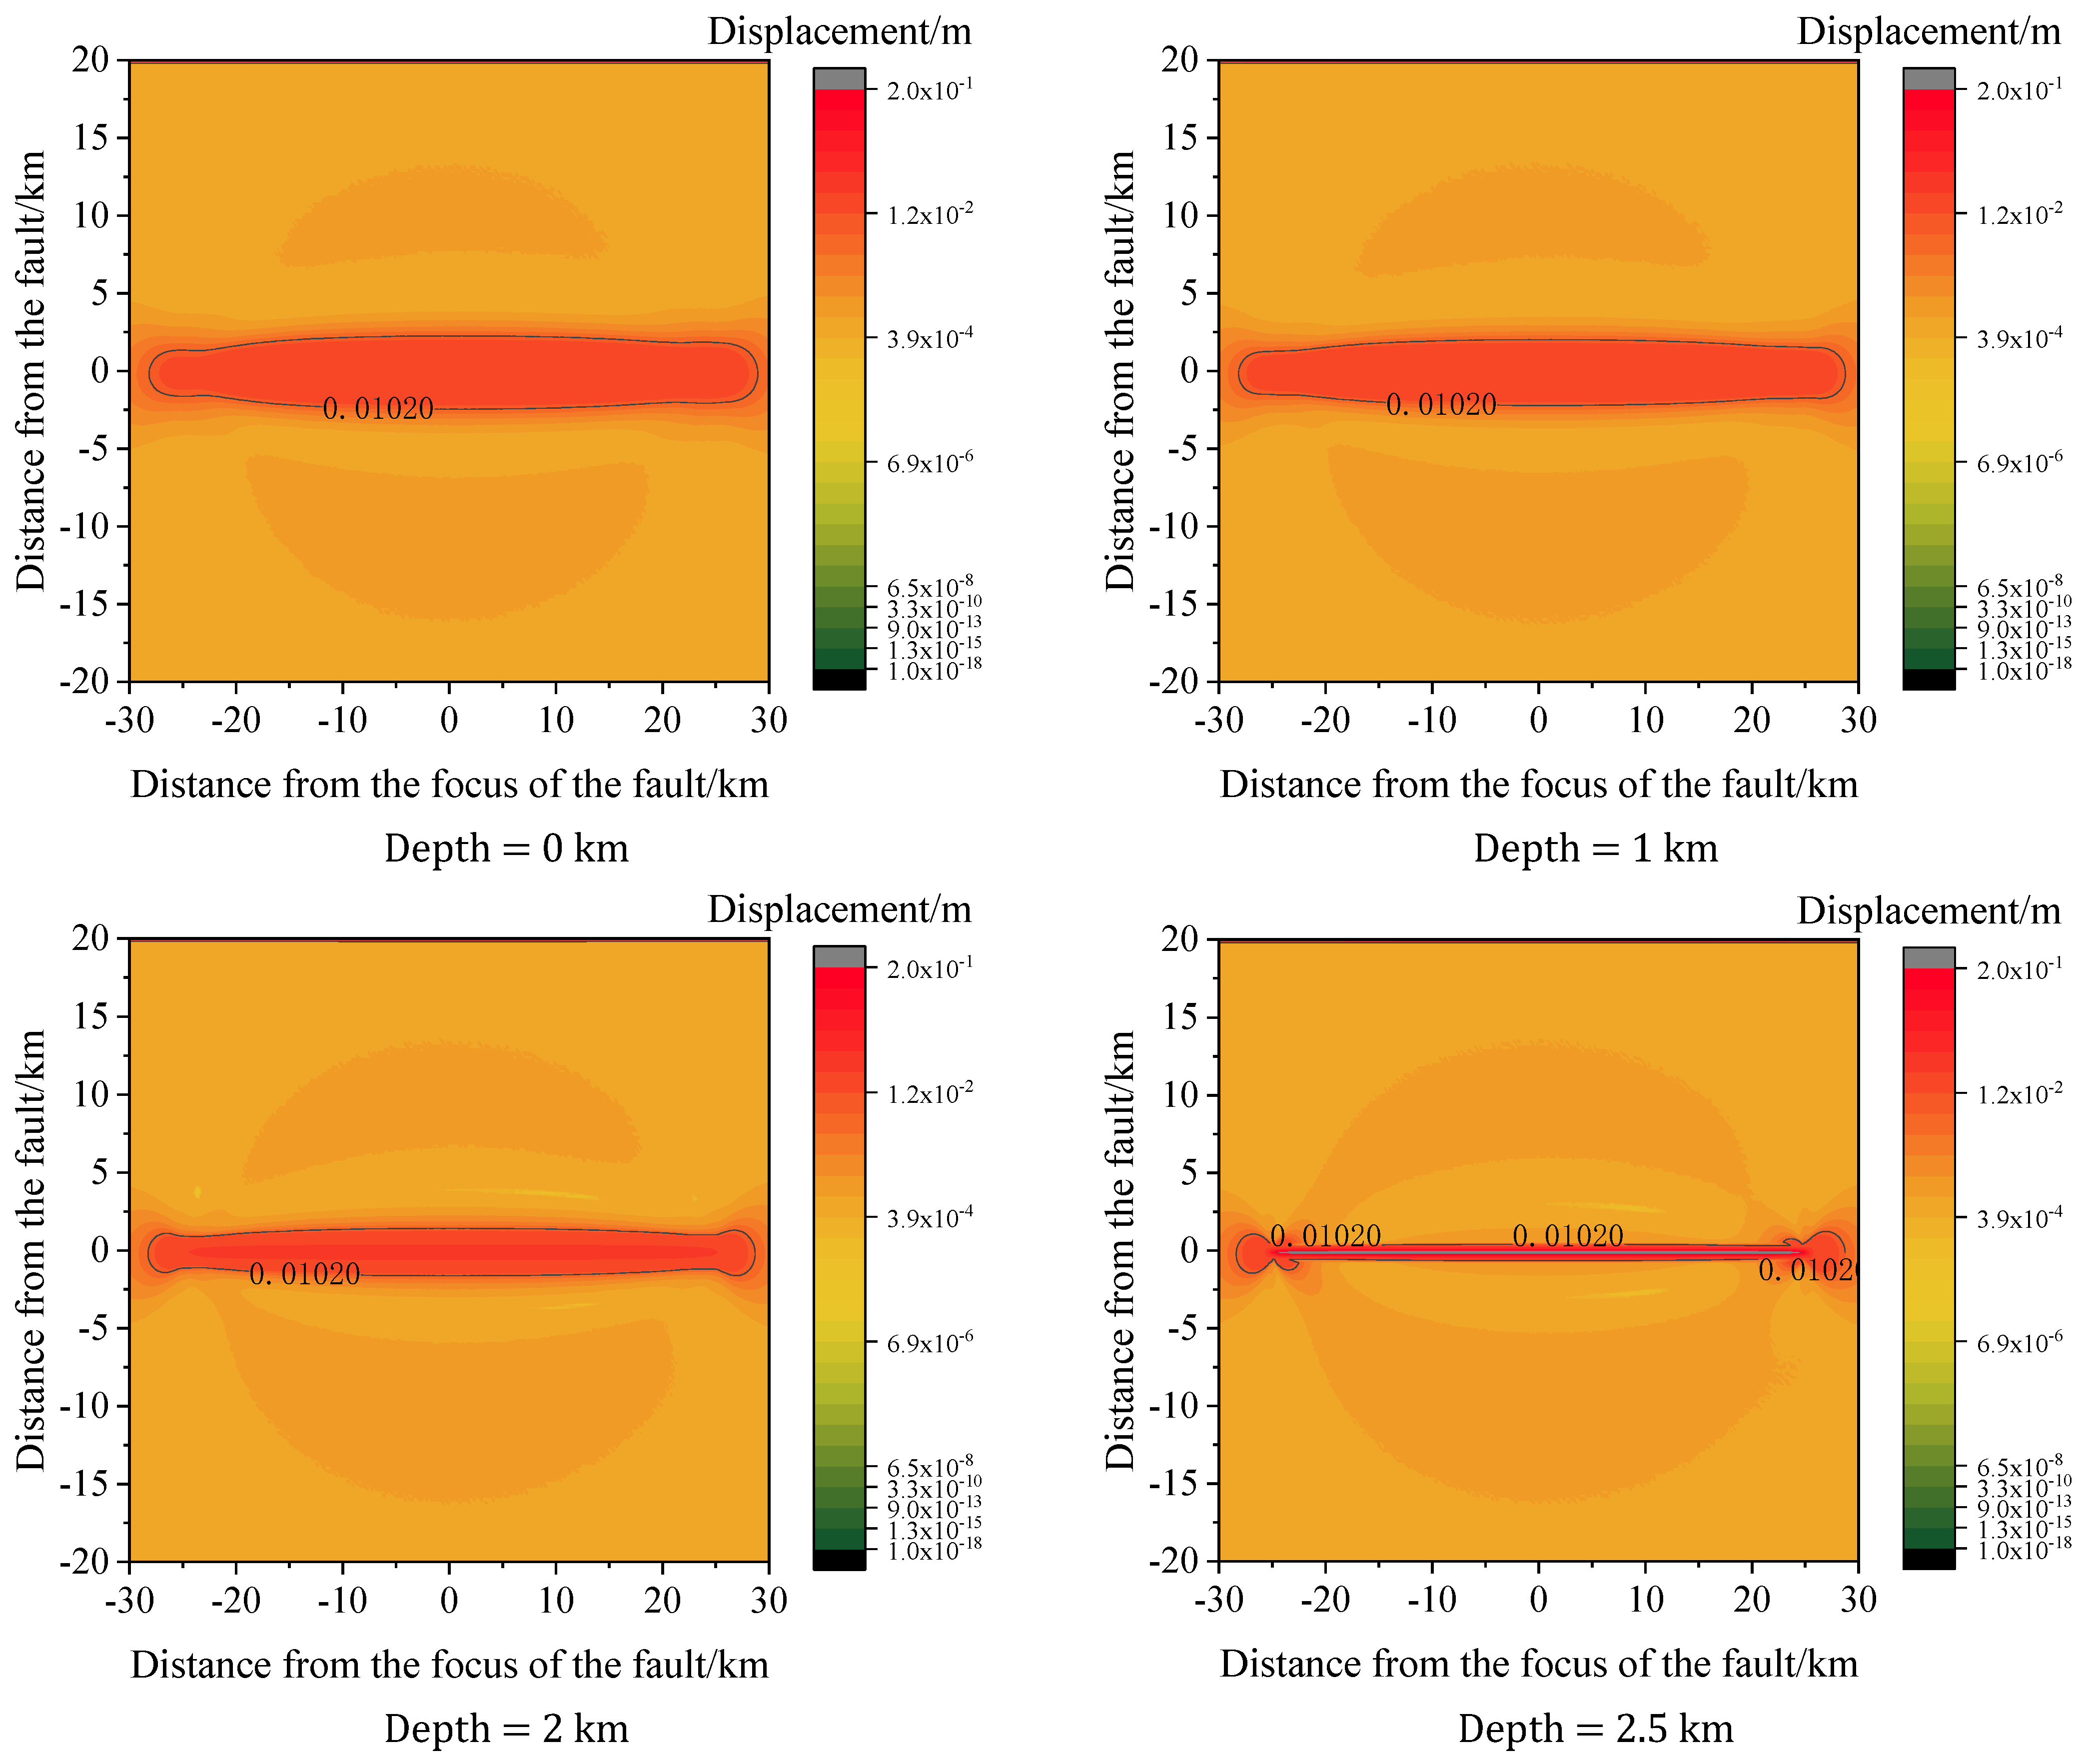
Based on the Yushu fault and stratigraphic parameters, the amount of stratigraphic deformation and its distribution at different depths on the surface and within the strata are calculated, and the results are shown in
Figure 2.
To verify the accuracy of the calculation results, previous observations of the Yushu earthquake in the post-earthquake period were collected. Ma Y.S. [
30] found that the surface rupture in the south-central section was around 30 cm in the observation of the surface deformation of the Yushu earthquake. Xun Wang [
31] observed the deformation of the surface isoseismic displacement map generated by InSAR to be around 0.3 m, with the maximum deformation occurring in the upper disk, which is close to the simulation results. Zhou H.F. [
32] also concluded that the surface deformation was around 30 cm. After comparison, it is found that the surface deformation calculated by the dislocation model is close to the results obtained from the surface observation, which verifies the feasibility of calculating the surface coseismic deformation by this method.
It can be seen from
Figure 2 that the deformation on both sides of the stratum is smaller near the fault center because the coordinates are established at the origin. The stratigraphy on both sides of the fault is asymmetrically distributed about the upper edge of the fault, with a slight upper plate effect. From the comparison of the deformation field at different depths, it can be seen that the deformation volume increases with the increase of burial depth, while the deformation influence range decreases. The morphology of the overall deformation field is funnel-shaped.
2.3. Analysis of Coseismic Deformation Field of Sichuan–Tibet Strata
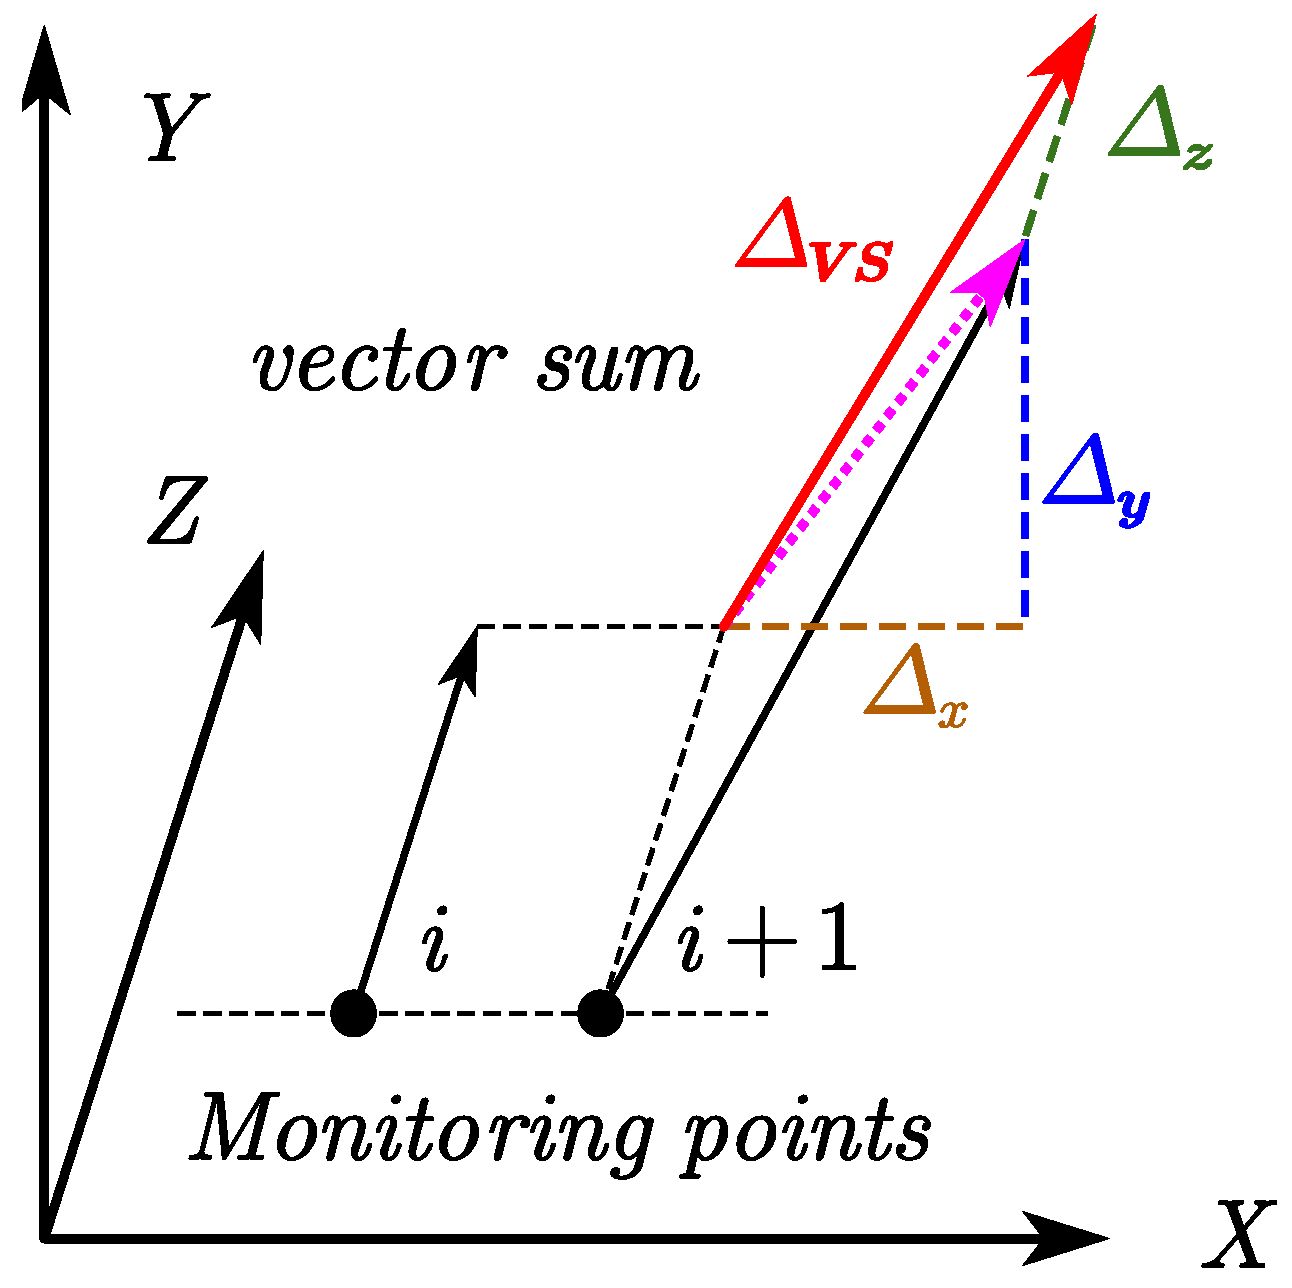
The amount of coseismic deformation of surface strata is an intuitive indicator for observing seismic deformation, while in the internal regions of strata, structures are affected by stratigraphic dislocation deformation. To accurately describe the affected degree of different regions within the stratum, the indicator of relative stratigraphic dislocation deformation is introduced. The deformation degree of the stratum is defined as the relative deformation between different points of the stratum in the three-dimensional deformation field, taking two adjacent points
i and
i + 1 inside the stratum, and the deformation difference is defined in
Figure 3.
Using the deformation indexes defined in
Figure 3, the deformation difference cloud maps for different depth strata are calculated and the general shape of the subsurface deformation intensity field distribution is obtained. To better show the misalignment in the middle region of the results, logarithmic coordinates are used to display the deformation cloud map, see
Figure 4.
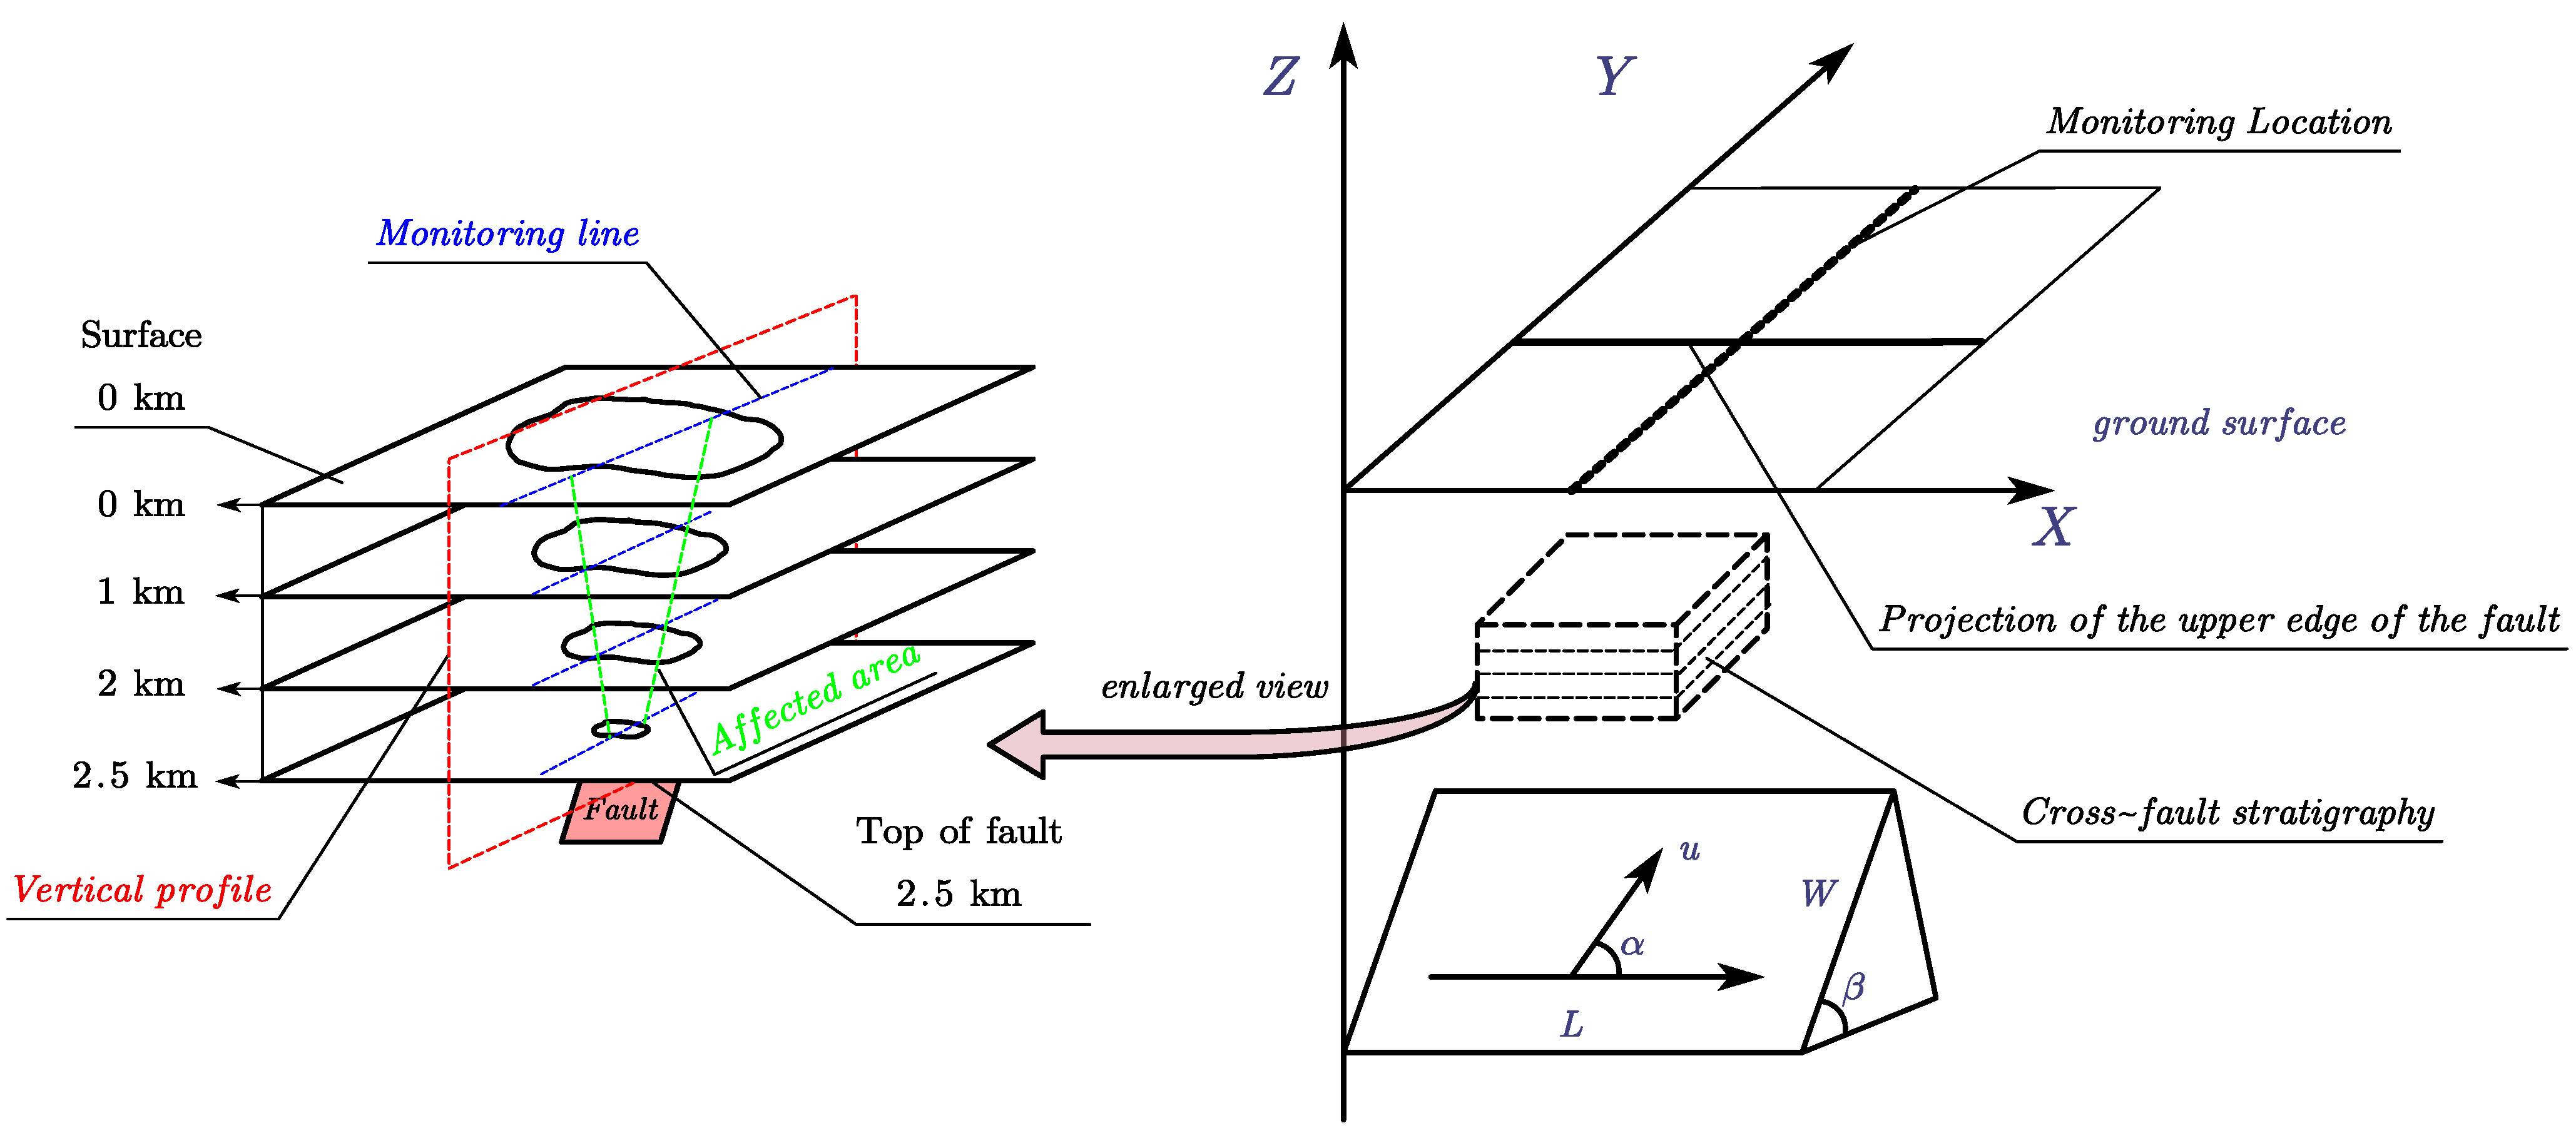
Compared with surface deformation, the distribution of subsurface deformation is not easy to observe and has an important impact on the seismic protection of structures in this area. The ground deformation caused by the fault is mainly concentrated in the middle of the fault, and the displacement at the two ends of the fault is almost zero. From the most unfavorable situation, the monitoring profile is set to the vertical tangent of the fault. It can be observed from
Figure 4 that the width range of deformation influence decreases gradually from shallow to deep, and the change rate is non-uniform. In addition, the variation of deformation intensity along the fault strike direction is small and almost uniformly distributed. Therefore, for simplification, we are mainly concerned with the variation of the deformation degree of the strata along the vertical and fault strike direction and depth direction, ignoring the variation of the deformation field along the fault strike direction, and simplifying the three-dimensional deformation field to two dimensional. The horizontal range of the study is limited to the near-field engineering scale within 60 km on both sides of the fault, and the depth range is limited to the stratigraphic region between the upper edge of the fault and the ground surface. The deformation characteristics of the stratigraphic deformation field are clarified through the analysis of the typical Yushu earthquake in the Sichuan–Tibet region. To further analyze the law of stratigraphic deformation in depth, monitoring profiles are established through the stratigraphic deformation characteristics clarified above, as shown in
Figure 5.
Based on the analytical laws obtained in the Yushu earthquake, parametric modeling is performed by combining the range of parameters collected in the Sichuan–Tibet region. Using the basic stratigraphic model, fault parameters, and dislocation modeling methods, the coseismic deformation field of the strata at the time of the earthquake is calculated, and the index of the deformation degree of the coseismic deformation field is used to estimate the intra-stratigraphic deformation intensity. A sensitivity analysis of the parameters is also carried out to obtain general patterns in the Sichuan–Tibet region. The current and more accurate global stratigraphic model Crust1.0 [
33] is selected, which has a high degree of confidence and applicability. This results in a more general stratigraphic model of formation, as shown in
Table 3.
Based on the Yushu earthquake, the magnitude was kept the same as that of the Yushu earthquake, and the study was carried out according to the magnitude seven earthquakes. To further determine the characteristics of stratigraphic deformation at different stratigraphic depths, a typical depth of 2000 m is selected for parametric sensitivity analysis of fault parameters. A single variable was controlled to analyze the effects of the sliding angle, dip angle, and stratigraphic depth on stratigraphic deformation perpendicular to the fault strike direction. In a survey of faults in the Sichuan–Tibet region, it was found that strike-slip faults account for 40% of the seismogenic faults in the Sichuan–Tibet region [
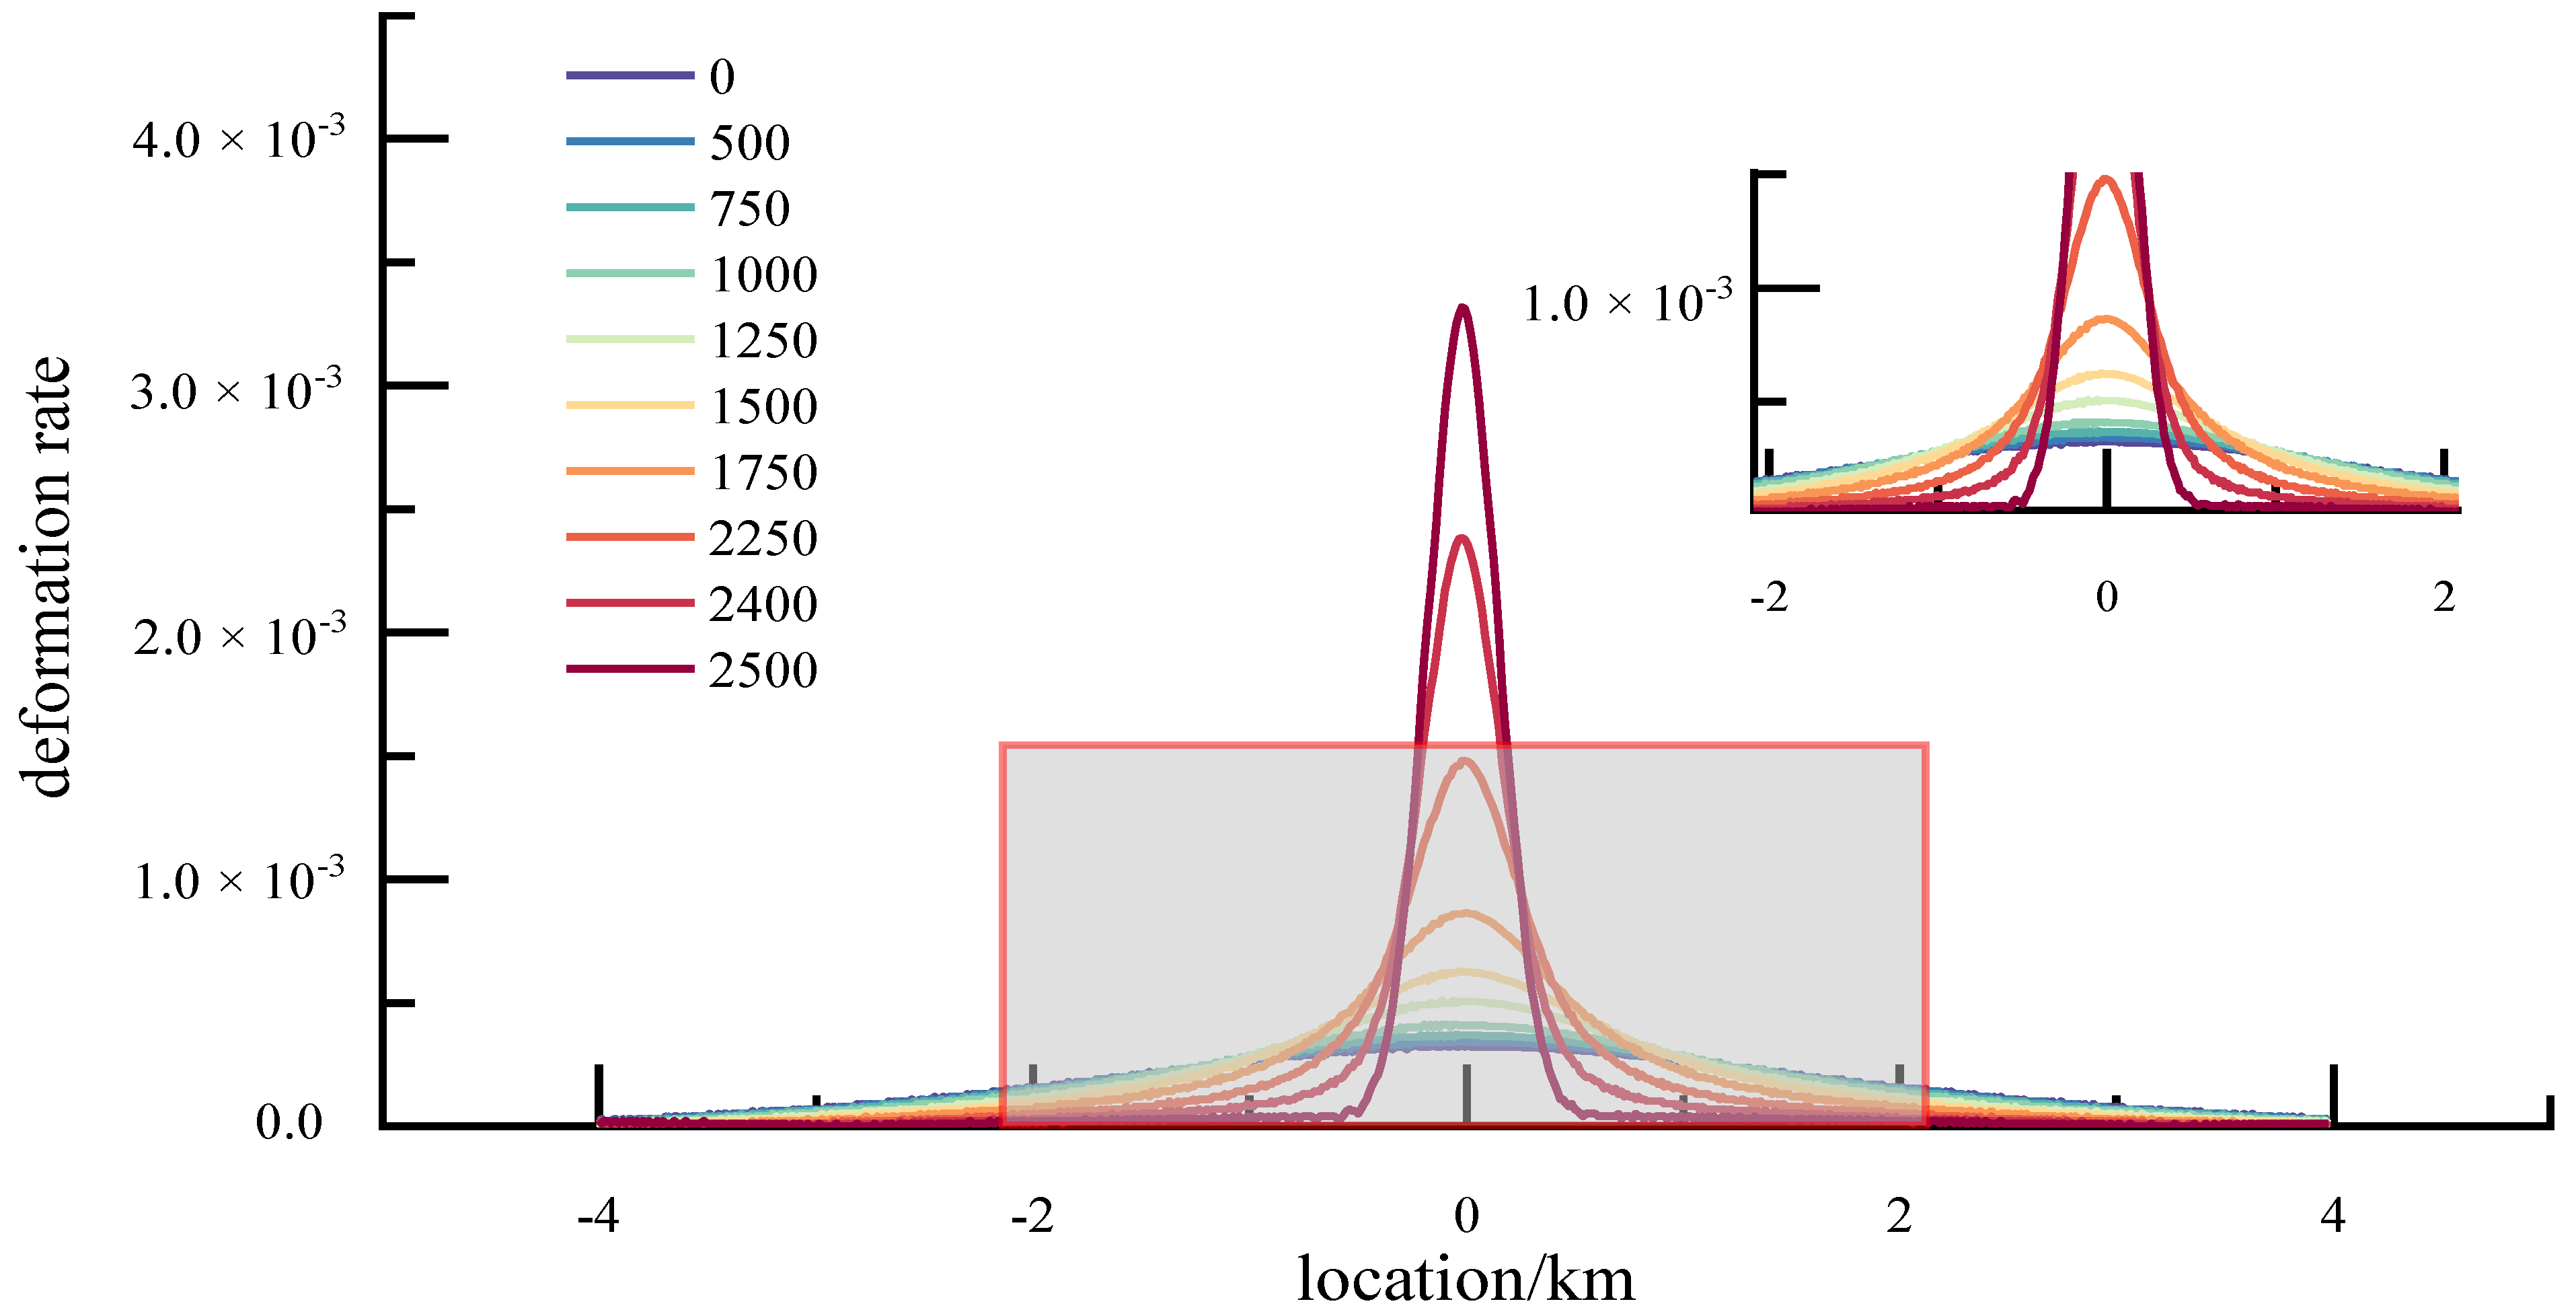
34]. Therefore, taking the strike-slip fault as an example for illustration, the deformation rates of strata at different depths under a magnitude 7 earthquake were analyzed, and the calculated results are shown in
Figure 6.
It can be seen from
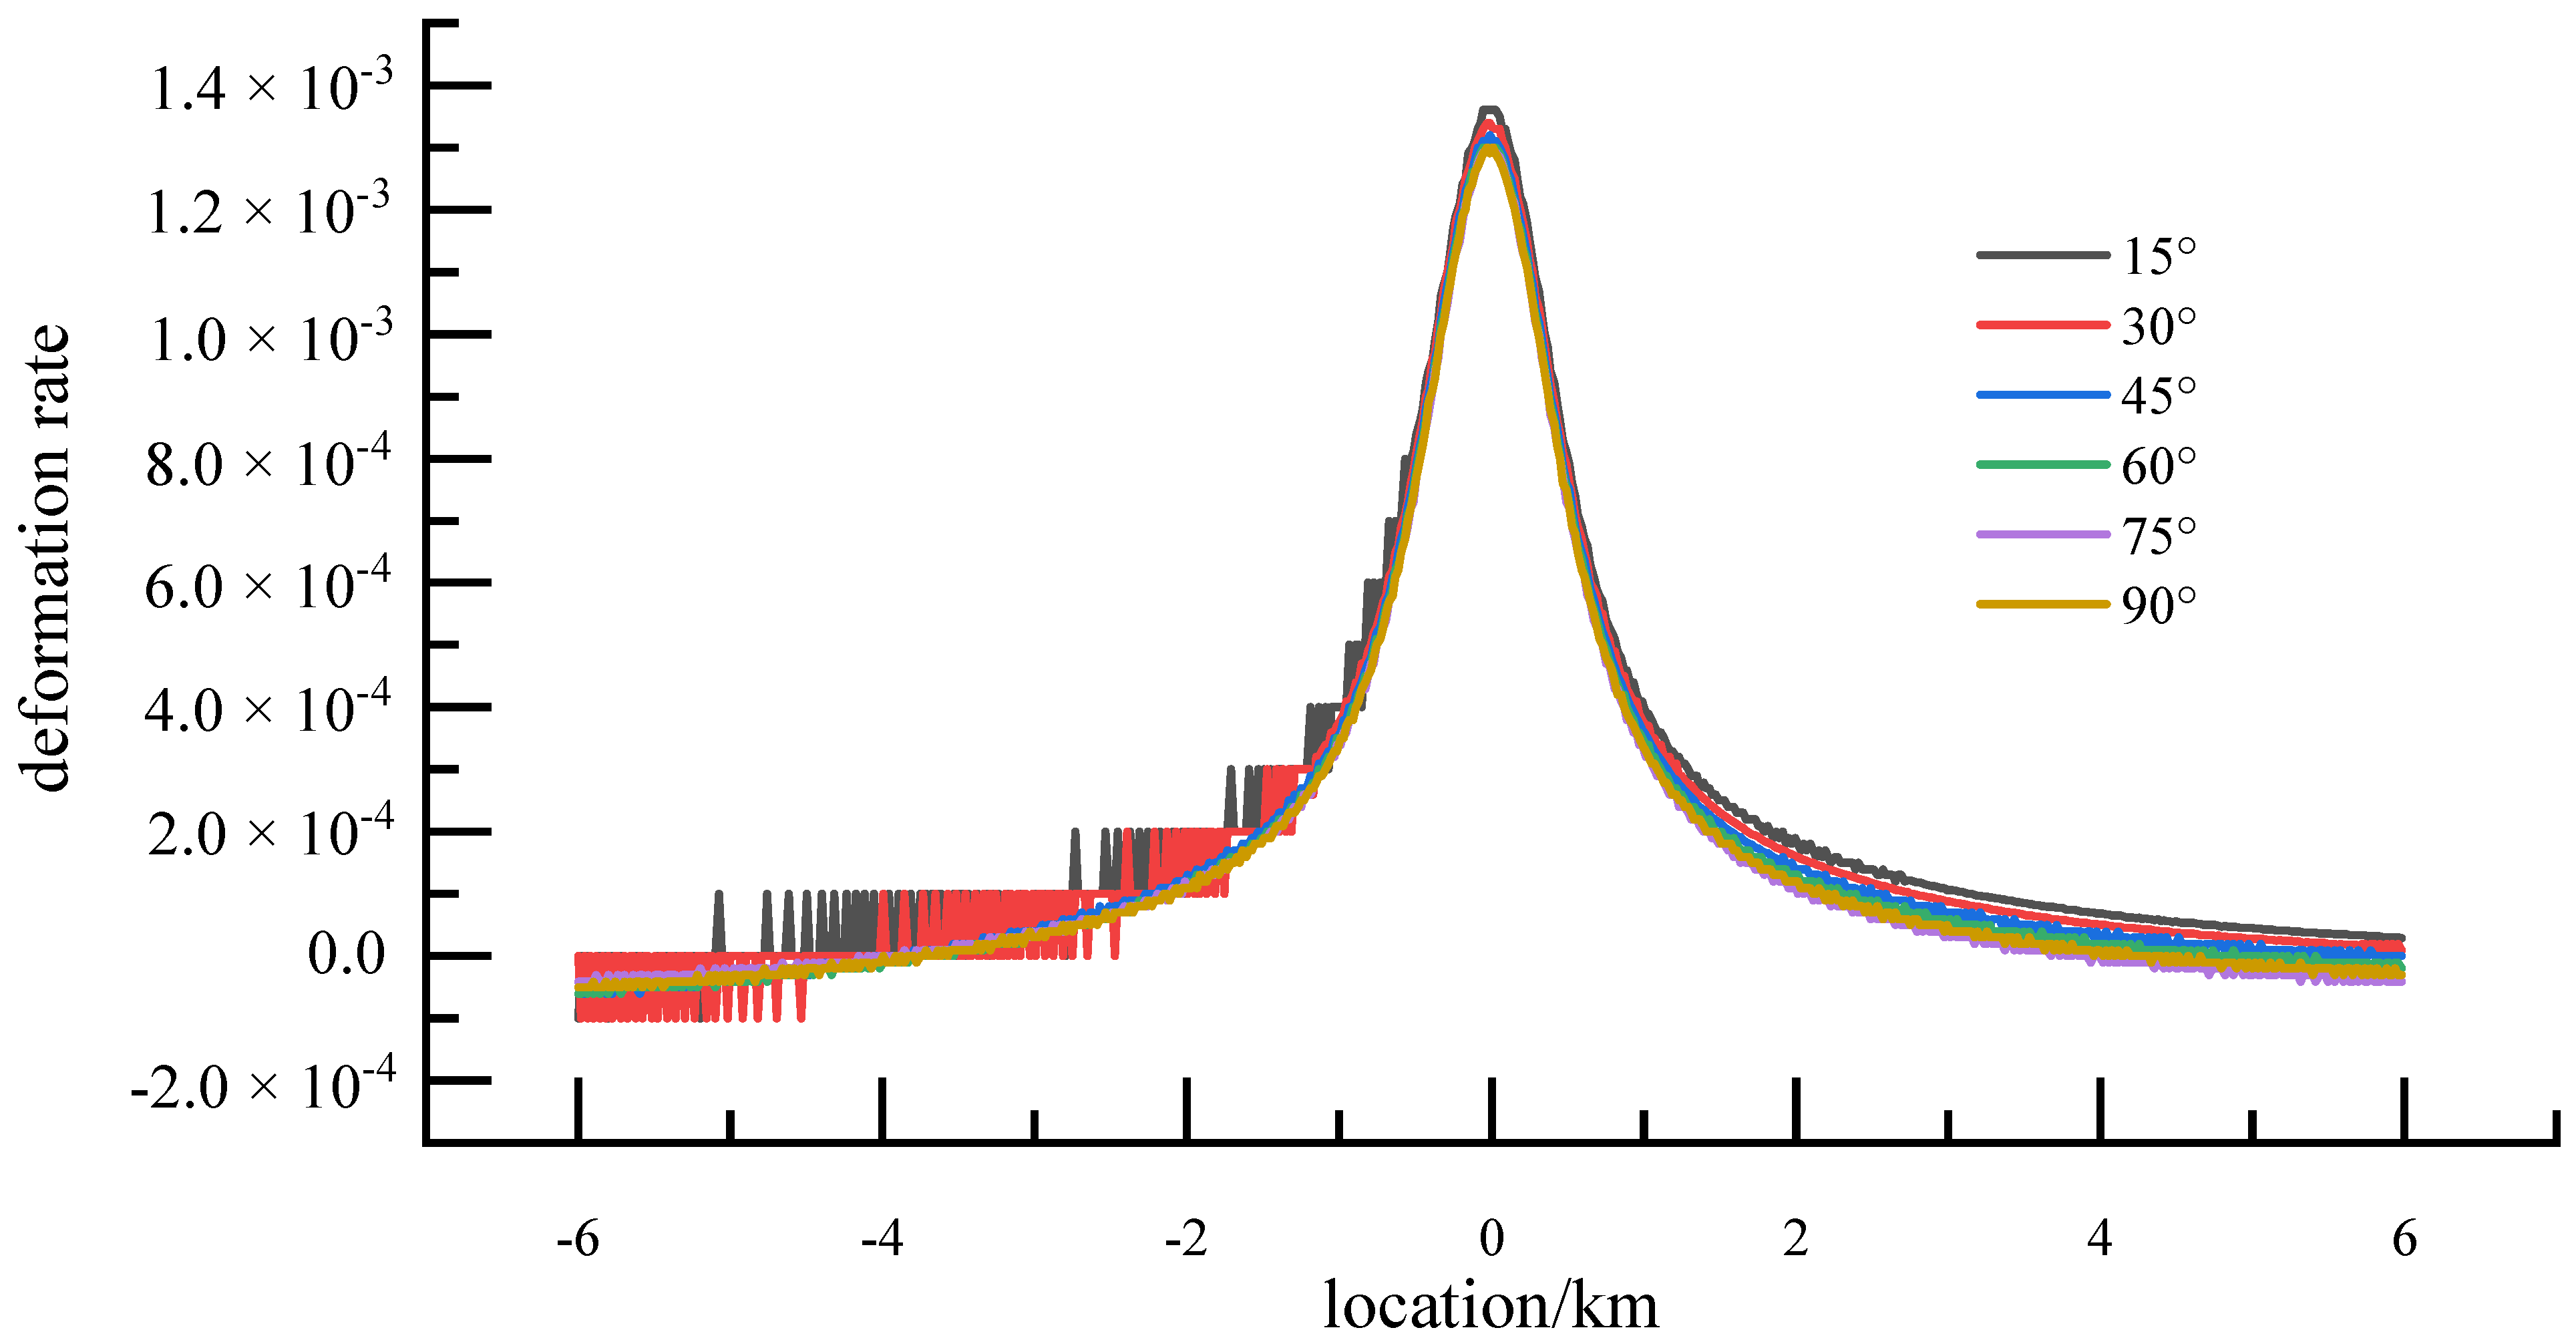
Figure 6 that the effect of stratigraphic depth on the fault deformation is more significant, and therefore the stratigraphic depth is listed as the main consideration. Based on previous analytical experience, it is known that the dip angle of the fault produces a hanging wall effect, which affects the degree of symmetry of the distribution of deformation. Further analysis of the influence on the degree of stratigraphic deformation when the dip angle of the strike-slip fault varies from 15° to 90° is shown in
Figure 7.
It can be observed from
Figure 7 that there is a slight hanging wall effect of stratigraphic deformation, as manifested by the instability of the values near the hanging wall because the dip angle of the Yushu earthquake fault is 80°. From the deformation rate of the deeply buried strata, the influence range and deformation values of the strata deformation under different dip angles do not differ much. Therefore, for the sake of simplification, the dip angle of the fault is not lowered as the main consideration for the distribution of the intensity of stratigraphic deformation in the further analysis of stratigraphic deformation.
3. Study of the Distribution Law of Deformation Field
Through the previous analysis, how to predict the possible dislocation deformation of faults before the occurrence of earthquakes and delineate the “intensity” of stratigraphic deformation within the strata is an important guideline for the seismic protection of underground structures in near-fault areas. Among the fault parameters, the amount of sliding is, therefore, the main influencing factor of stratigraphic dislocation deformation. To carry out the ground deformation analysis, it is necessary to clarify the relationship between the earthquake level and the fault sliding amount first. According to Aki K. and Richards P.G. [
35], the relationship between the average sliding volume
on the fault surface and the seismic moment
is obtained statistically as in Equation (2)
where
is the shear modulus, and A is the rupture area of the fault. The relationship between seismic moment
and moment magnitude
, obtained statistically by Hanks T.C. and Kanamori H. [
36], is given in Equation (3)
The unit of seismic moment
in Equation (3) is N-m, and the relationship between the average slip on the fault surface and the matrix level is obtained as in Equation (4)
The average sliding volume of the fault surface can be obtained from the rupture area by the determined matrix level. Wells and Coppersmith [
1] gave an empirical relationship among the rupture area, rupture length, and matrix level as in Equations (5) and (6)
Through the above analysis and derivation, the relationship between the amount of fault sliding and the seismic level is given in
Table 4.
In this section, the amount of dislocation deformation is taken as the main influencing factor of fault dislocation under different earthquake levels, and the influence of fault dislocation on stratigraphic deformation is analyzed, and the variation law of stratigraphic deformation along with depth and the variation law of the influence range of different deformation intensities under different earthquake levels are further quantified.
3.1. Equation of Maximum Displacement of the Same Seismic Deformation Field
The maximum deformation of the coseismic deformation field is an important reference indicator for analyzing the influence of stratigraphic deformation on the cross-fault structure. For the attenuation of stratigraphic deformation when crossing the fault directly, only the strata on both sides of the fault as well as the surface rupture values are considered, in fact, there is a large number of faults that are hidden within the strata and do not even form ruptures at the surface [
37]. In this case, the attenuation of stratigraphic deformation occurs not only in the horizontal direction perpendicular to the fault strike but also in the depth direction of the strata. At the same time, the existing statistical formulas for stratigraphic deformation mainly consider the earthquake magnitude and count only the maximum displacement deformation at the surface. From the analysis in the previous section, it is clear that the burial depth of the fault is an important influencing factor among the influencing factors regarding the ground deformation. Guo Yao [
38] proposed the concept of the burial depth of the earthquake source relative to the thickness of the earth’s crust in the analysis of ground stress. Since both the burial depth of the fault and the depth of the stratum in which the project is located influence the degree of deformation of the strata here, in this study, the two are considered together, and the concept of relative fault burial depth is proposed, namely.
In Equation (7), H indicates the burial depth of the upper edge of the fault, and h indicates the burial depth of the structure. When the relative burial depth is 0, it is the surface; when the relative burial depth is 1, it is the depth of burial of the fault. The study area is defined as the stratum between the upper edge of the fault and the surface, so.
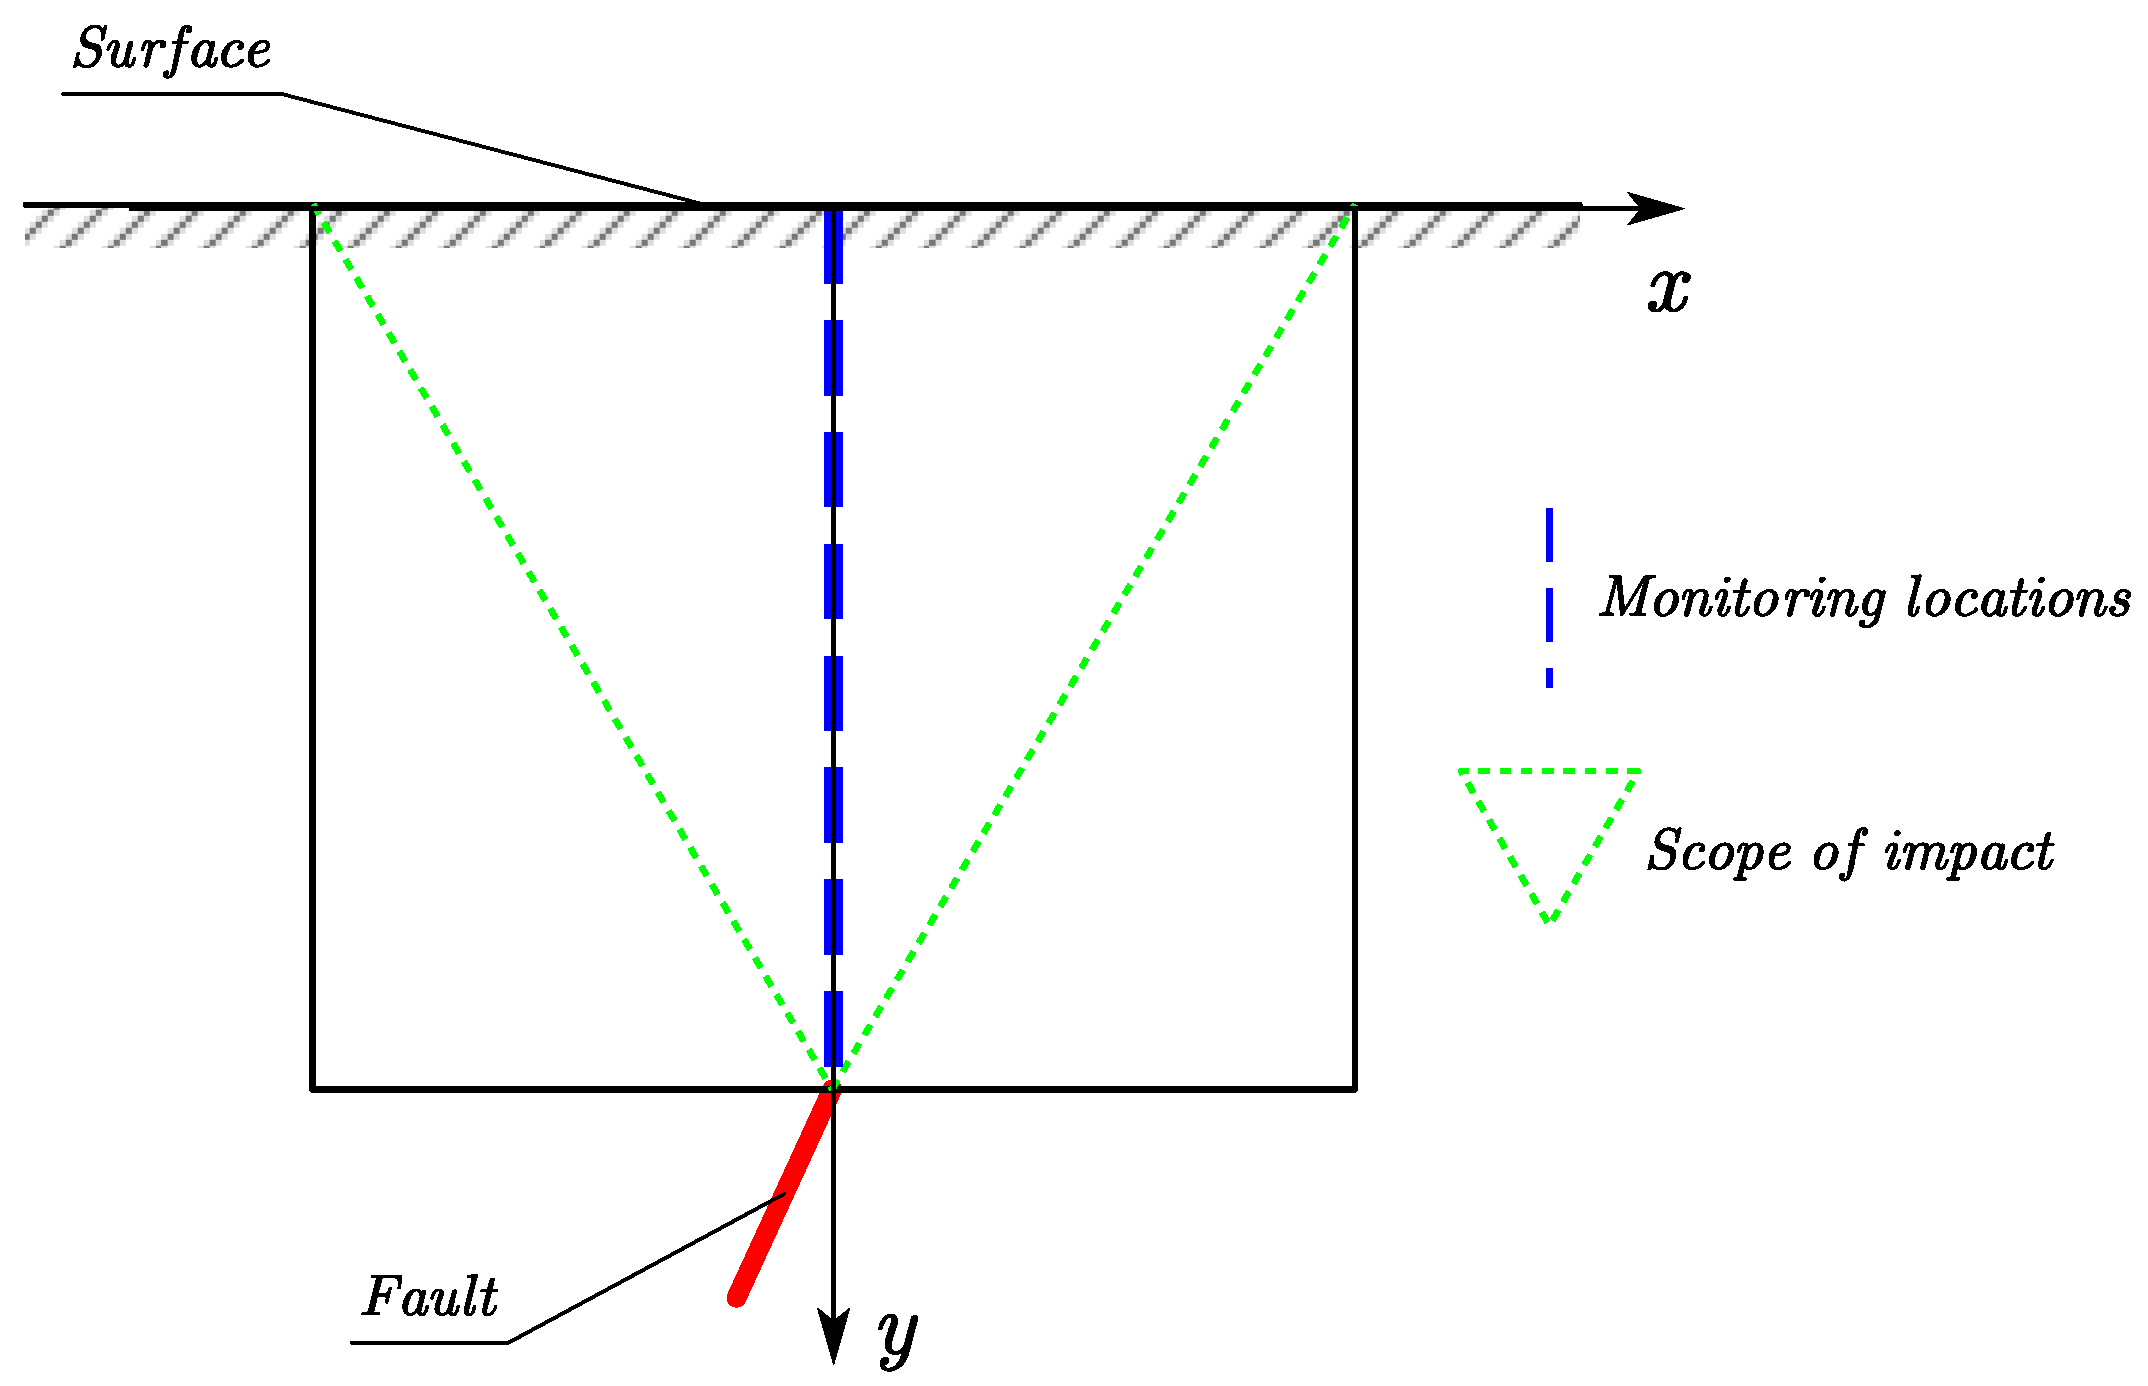
In the analysis of the previous section, the parameters of the fault itself are also important influencing factors of the ground deformation. For simplicity, the fault misalignment is considered as the main factor by sensitivity analysis. The projection of the fault midpoint on the surface is used as the origin to establish the coordinate axis. The
X-axis is perpendicular to the fault strike direction, and the
Y-axis is along the depth direction. The maximum stratigraphic deformation at different depths of the epicenter is collected for each relative burial position under different fault misalignment amounts, and the misalignment deformation of the monitored strata is regressed with the relative burial depth and the change of misalignment amount to form an empirical formula. The ground deformation within 4 km from the fault is taken care of to establish a zoning for the degree of ground deformation. The monitoring location and the shape of the deformation field are shown schematically in
Figure 8.
The maximum dislocations and rupture zone widths caused by the slip fault at different depths for different earthquake levels
= 7.0~8.5 are shown in
Table 5. From the data in the table, it can be seen that the maximum dislocation of the ground surface increases with increasing depth at the same seismic level.
A multiple regression analysis of the calculated results in
Table 5 is fitted to obtain the equation of the relationship between the maximum dislocation of the surface under the action of the strike-slip fault and the earthquake magnitude and the burial depth of the fault, which is shown in Equation (8)
where
D is the maximum dislocation of the formation
is the moment magnitude, and
is the relative burial depth of the formation. The correlation coefficient is 0.984, which indicates that the formula is a good fit for this law.
From the above analysis, the fault sliding volume and the relative burial depth of strata are selected as the main influencing factors, and the study is set to the cross-fault area of the occult fault. The maximum deformation of strata with different relative burial depths under different earthquake levels was monitored, and the data within this region were statistically obtained from the regression equation. After calculation, it is found that the difference of maximum deformation between surface and deeply buried strata is 10^0.04 ≈ 110% at the fault burial depth of 2.5 km; i.e., the maximum deformation increases by 10% with increasing depth, which is on the dangerous side. Comparing the maximum deformation at different depths proves the necessity of considering the depth.
3.2. Deformation Field Intensity Zoning
Underground structures located within the near-fault region need to consider the attenuation and distribution of the deformation intensity in addition to the influence of the maximum deformation of the strata. In a study by Zhang Y. [
39], it was found that the distribution characteristics of the coseismic deformation field of the Wenchuan earthquake were highly consistent with the characteristics of the intensity distribution of that earthquake, and the coseismic deformation could respond to the seismic intensity to some extent. In this section, based on the concept of intensity, a theoretical calculation method is adopted to study the distribution of the degree of stratigraphic deformation. By defining the stratigraphic intensity thresholds and establishing the relationship with the deformation intensity according to the characteristics of the coseismic deformation field, different deformation degrees in different regions within the strata are classified.
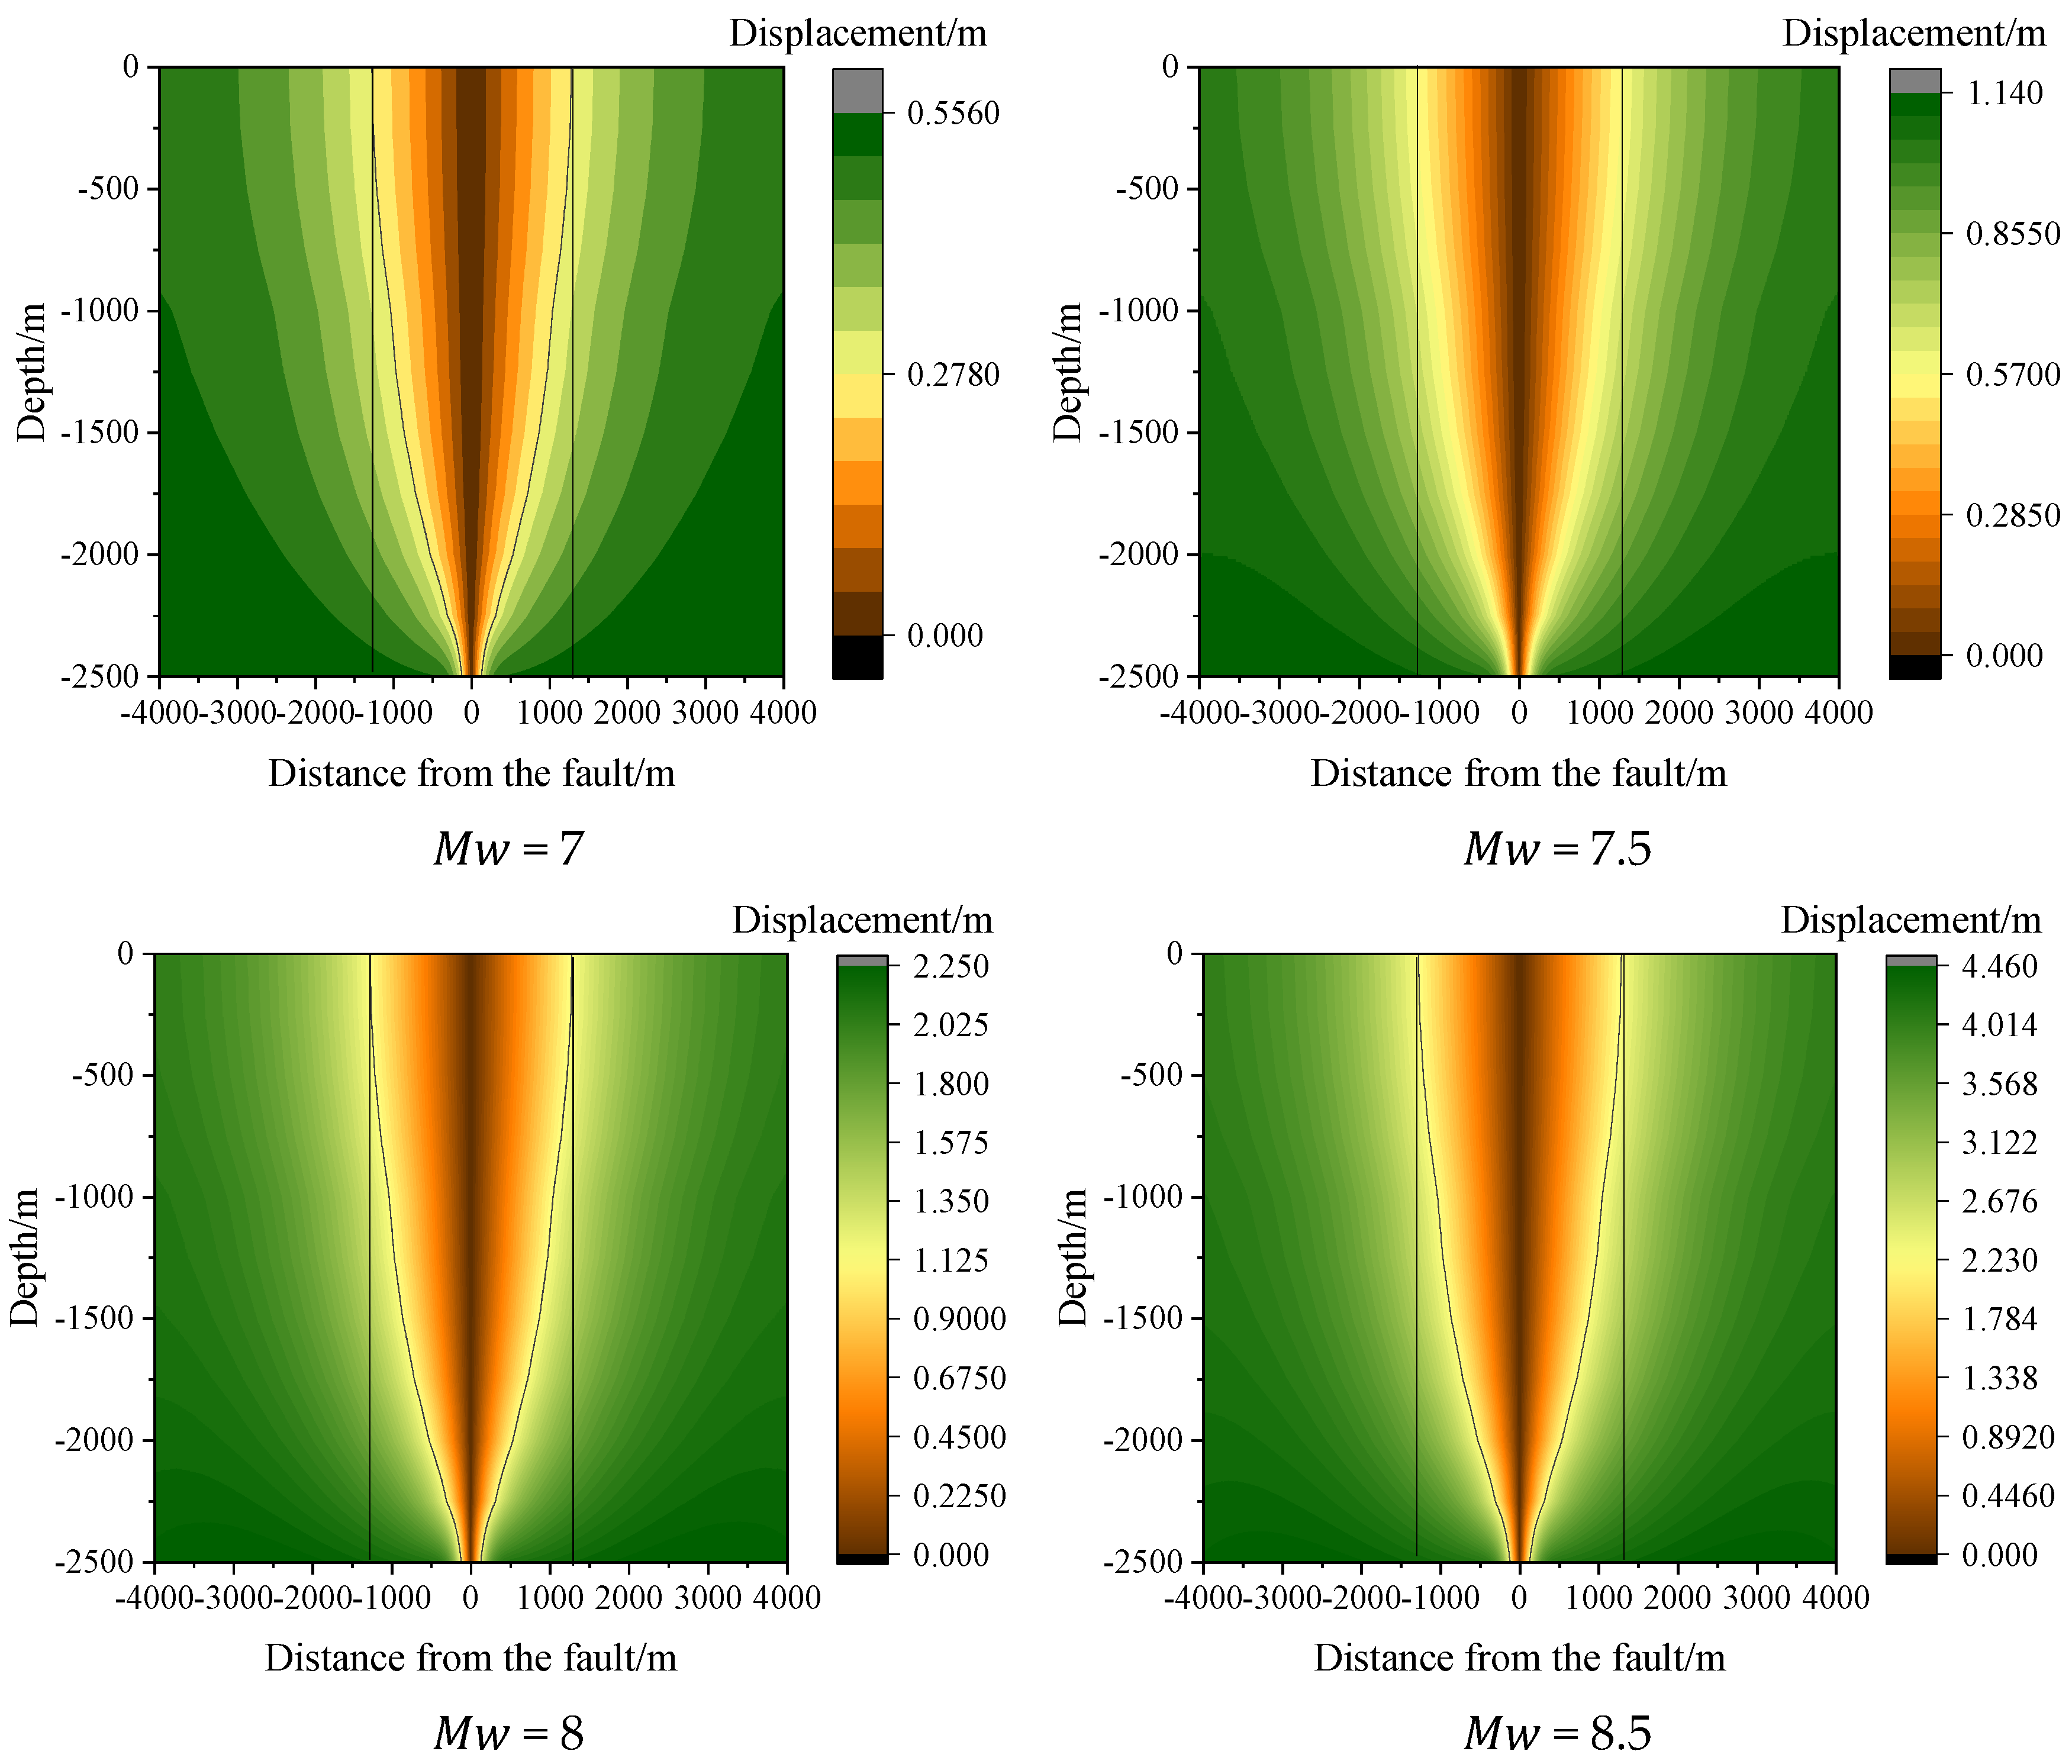
For the study of deformation within the strata, there are three directional components, namely the depth direction, the strike of the fault, and the direction perpendicular to the strike of the fault. Here, the three-dimensional deformation field is simplified to a two-dimensional plane deformation field for consideration based on the principle of two dimensions with relatively large change gradients, and the soil displacement field under different earthquake levels, see
Figure 9.
As can be seen from
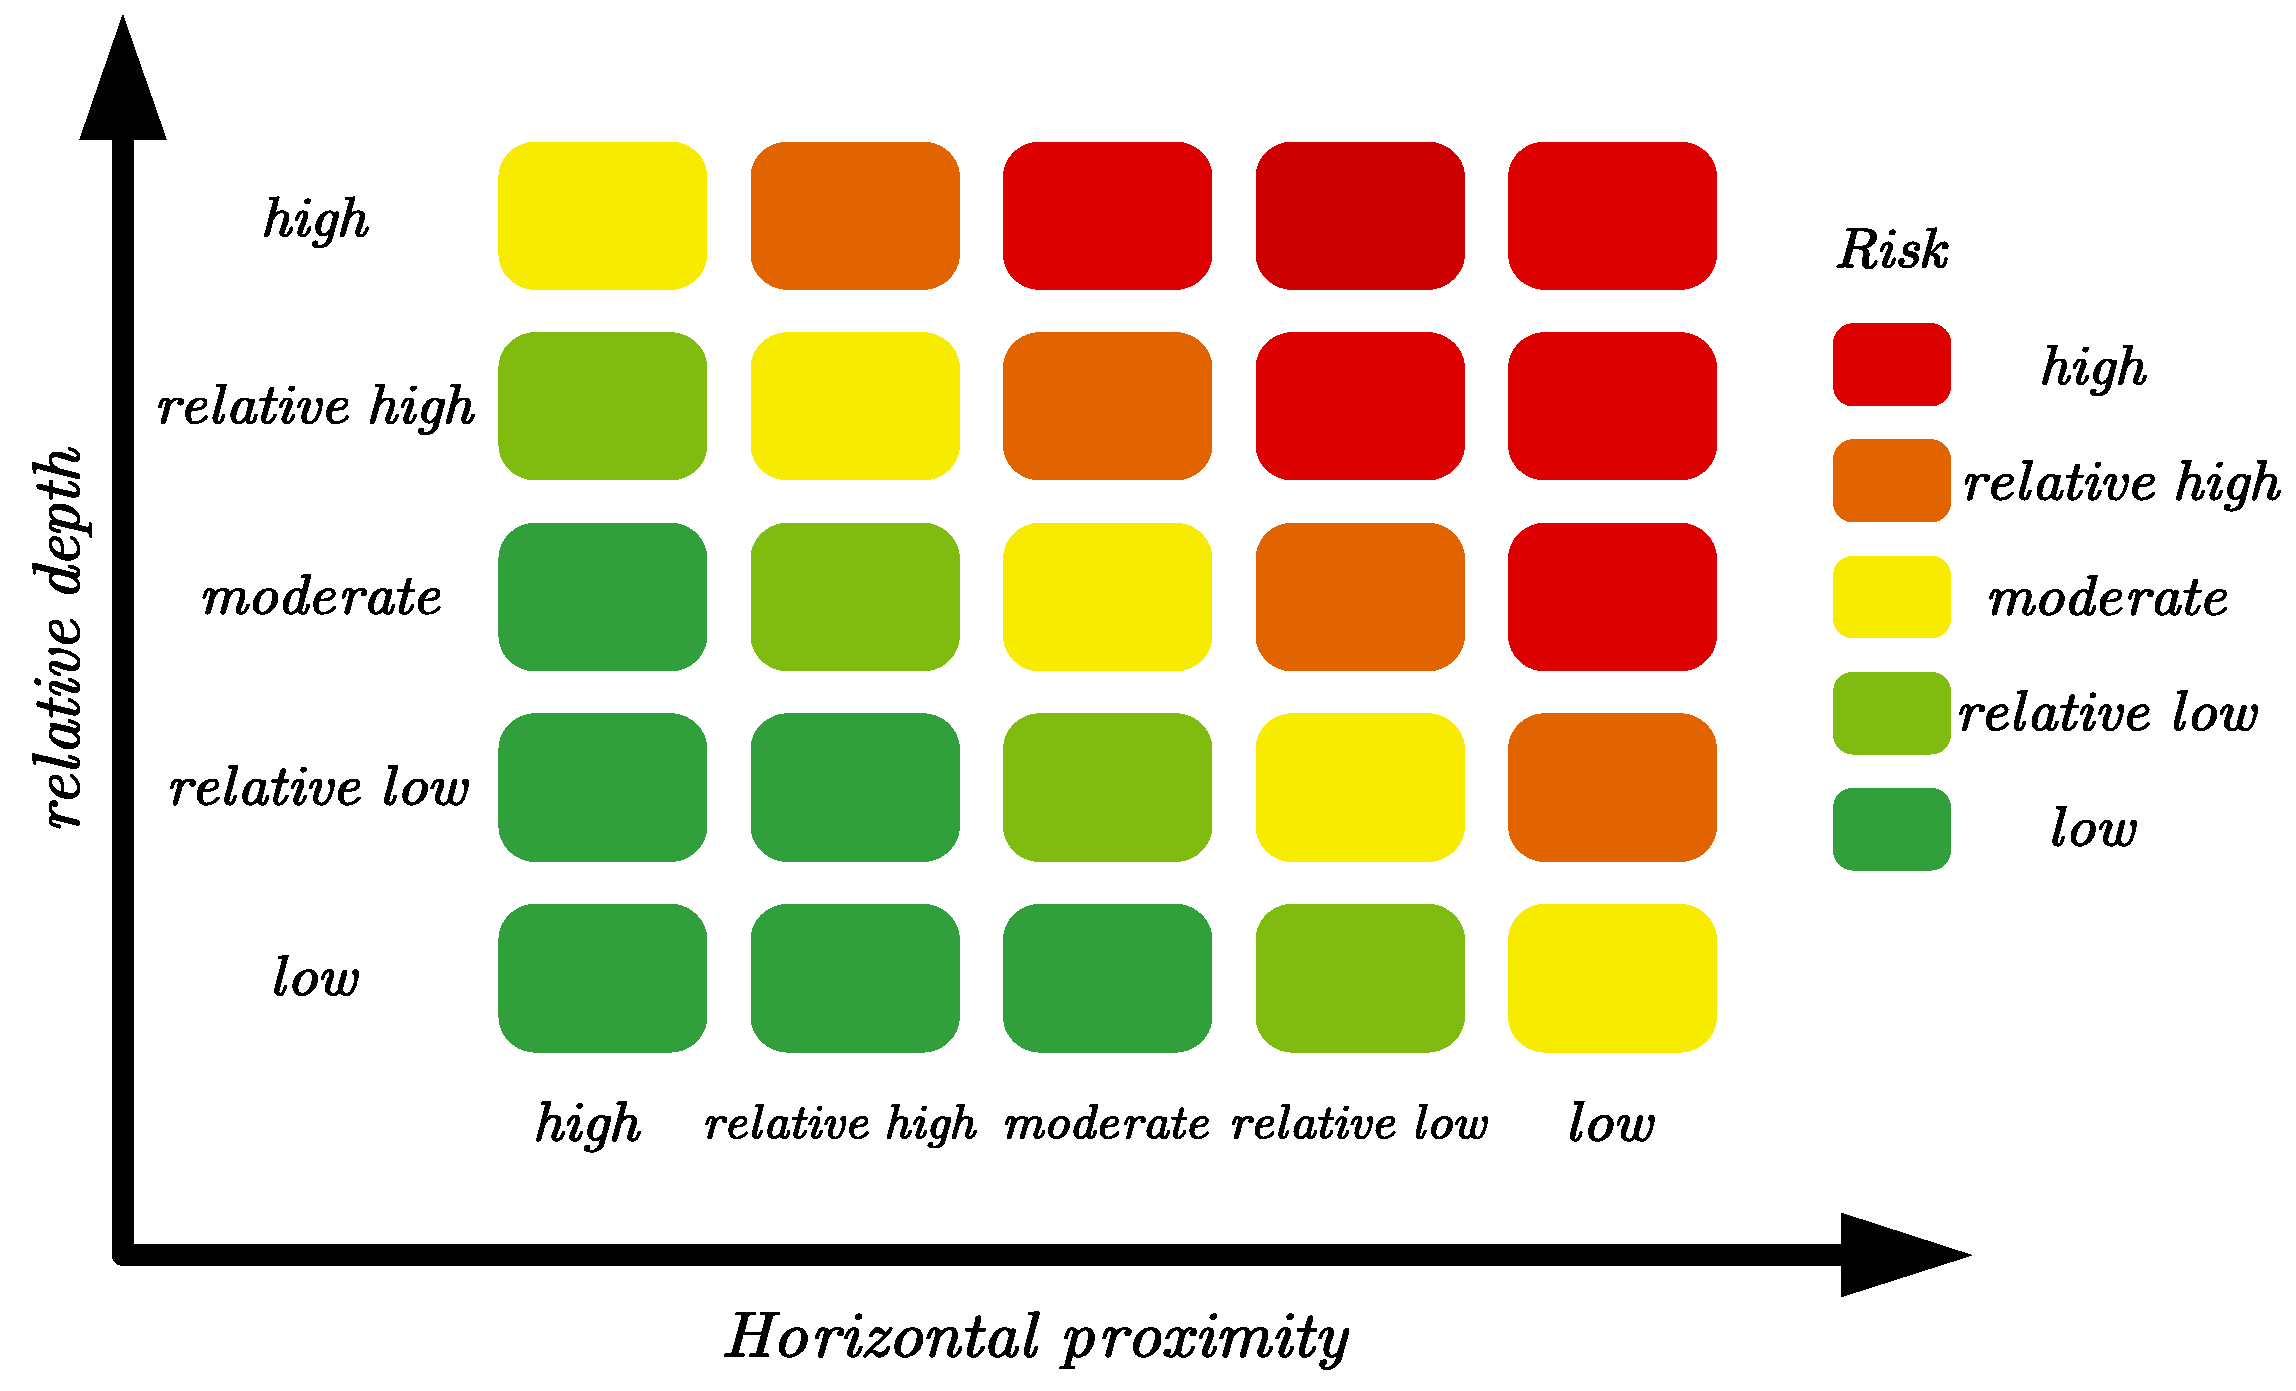
Figure 9, the main deformation occurred within 1.5 km of the upper edge of the fault and its projection on the surface. Therefore, after the earthquake, the main affected area of the earthquake can be quickly identified. The deformation distribution map obtained from the Yushu earthquake parameter calculation shows that the displacement deformation field is close to a funnel-shaped Symmetric distribution. By observing the deformation cloud map, it can be found that the degree of stratigraphic deformation intensifies as the horizontal center and burial depth of the fault are approached, so the two dimensions of depth and epicenter distance are taken as the main considerations for stratigraphic zoning, and the influence law of both on stratigraphic deformation is shown in
Figure 10.
The deformation cloud diagram shows that the intensity of deformation gradually increases within the stratum in the process of approaching the fault. The stratum deformation will have an important influence on the structural deformation force as the displacement boundary of structural deformation, and the reference index of stratum deformation intensity is established concerning the limit value of structural deformation in the Code for Seismic Design of Buildings [
40]. Combined with the range of displacement difference obtained from the calculation, the deformation difference is graded to form the intensity grading standard, and the ground deformation field is defined into three grades according to the deformation difference: no influence, weak influence, and strong influence. The intensity grades of stratigraphic deformation and the corresponding thresholds of stratigraphic deformation indicators are shown in
Table 6.
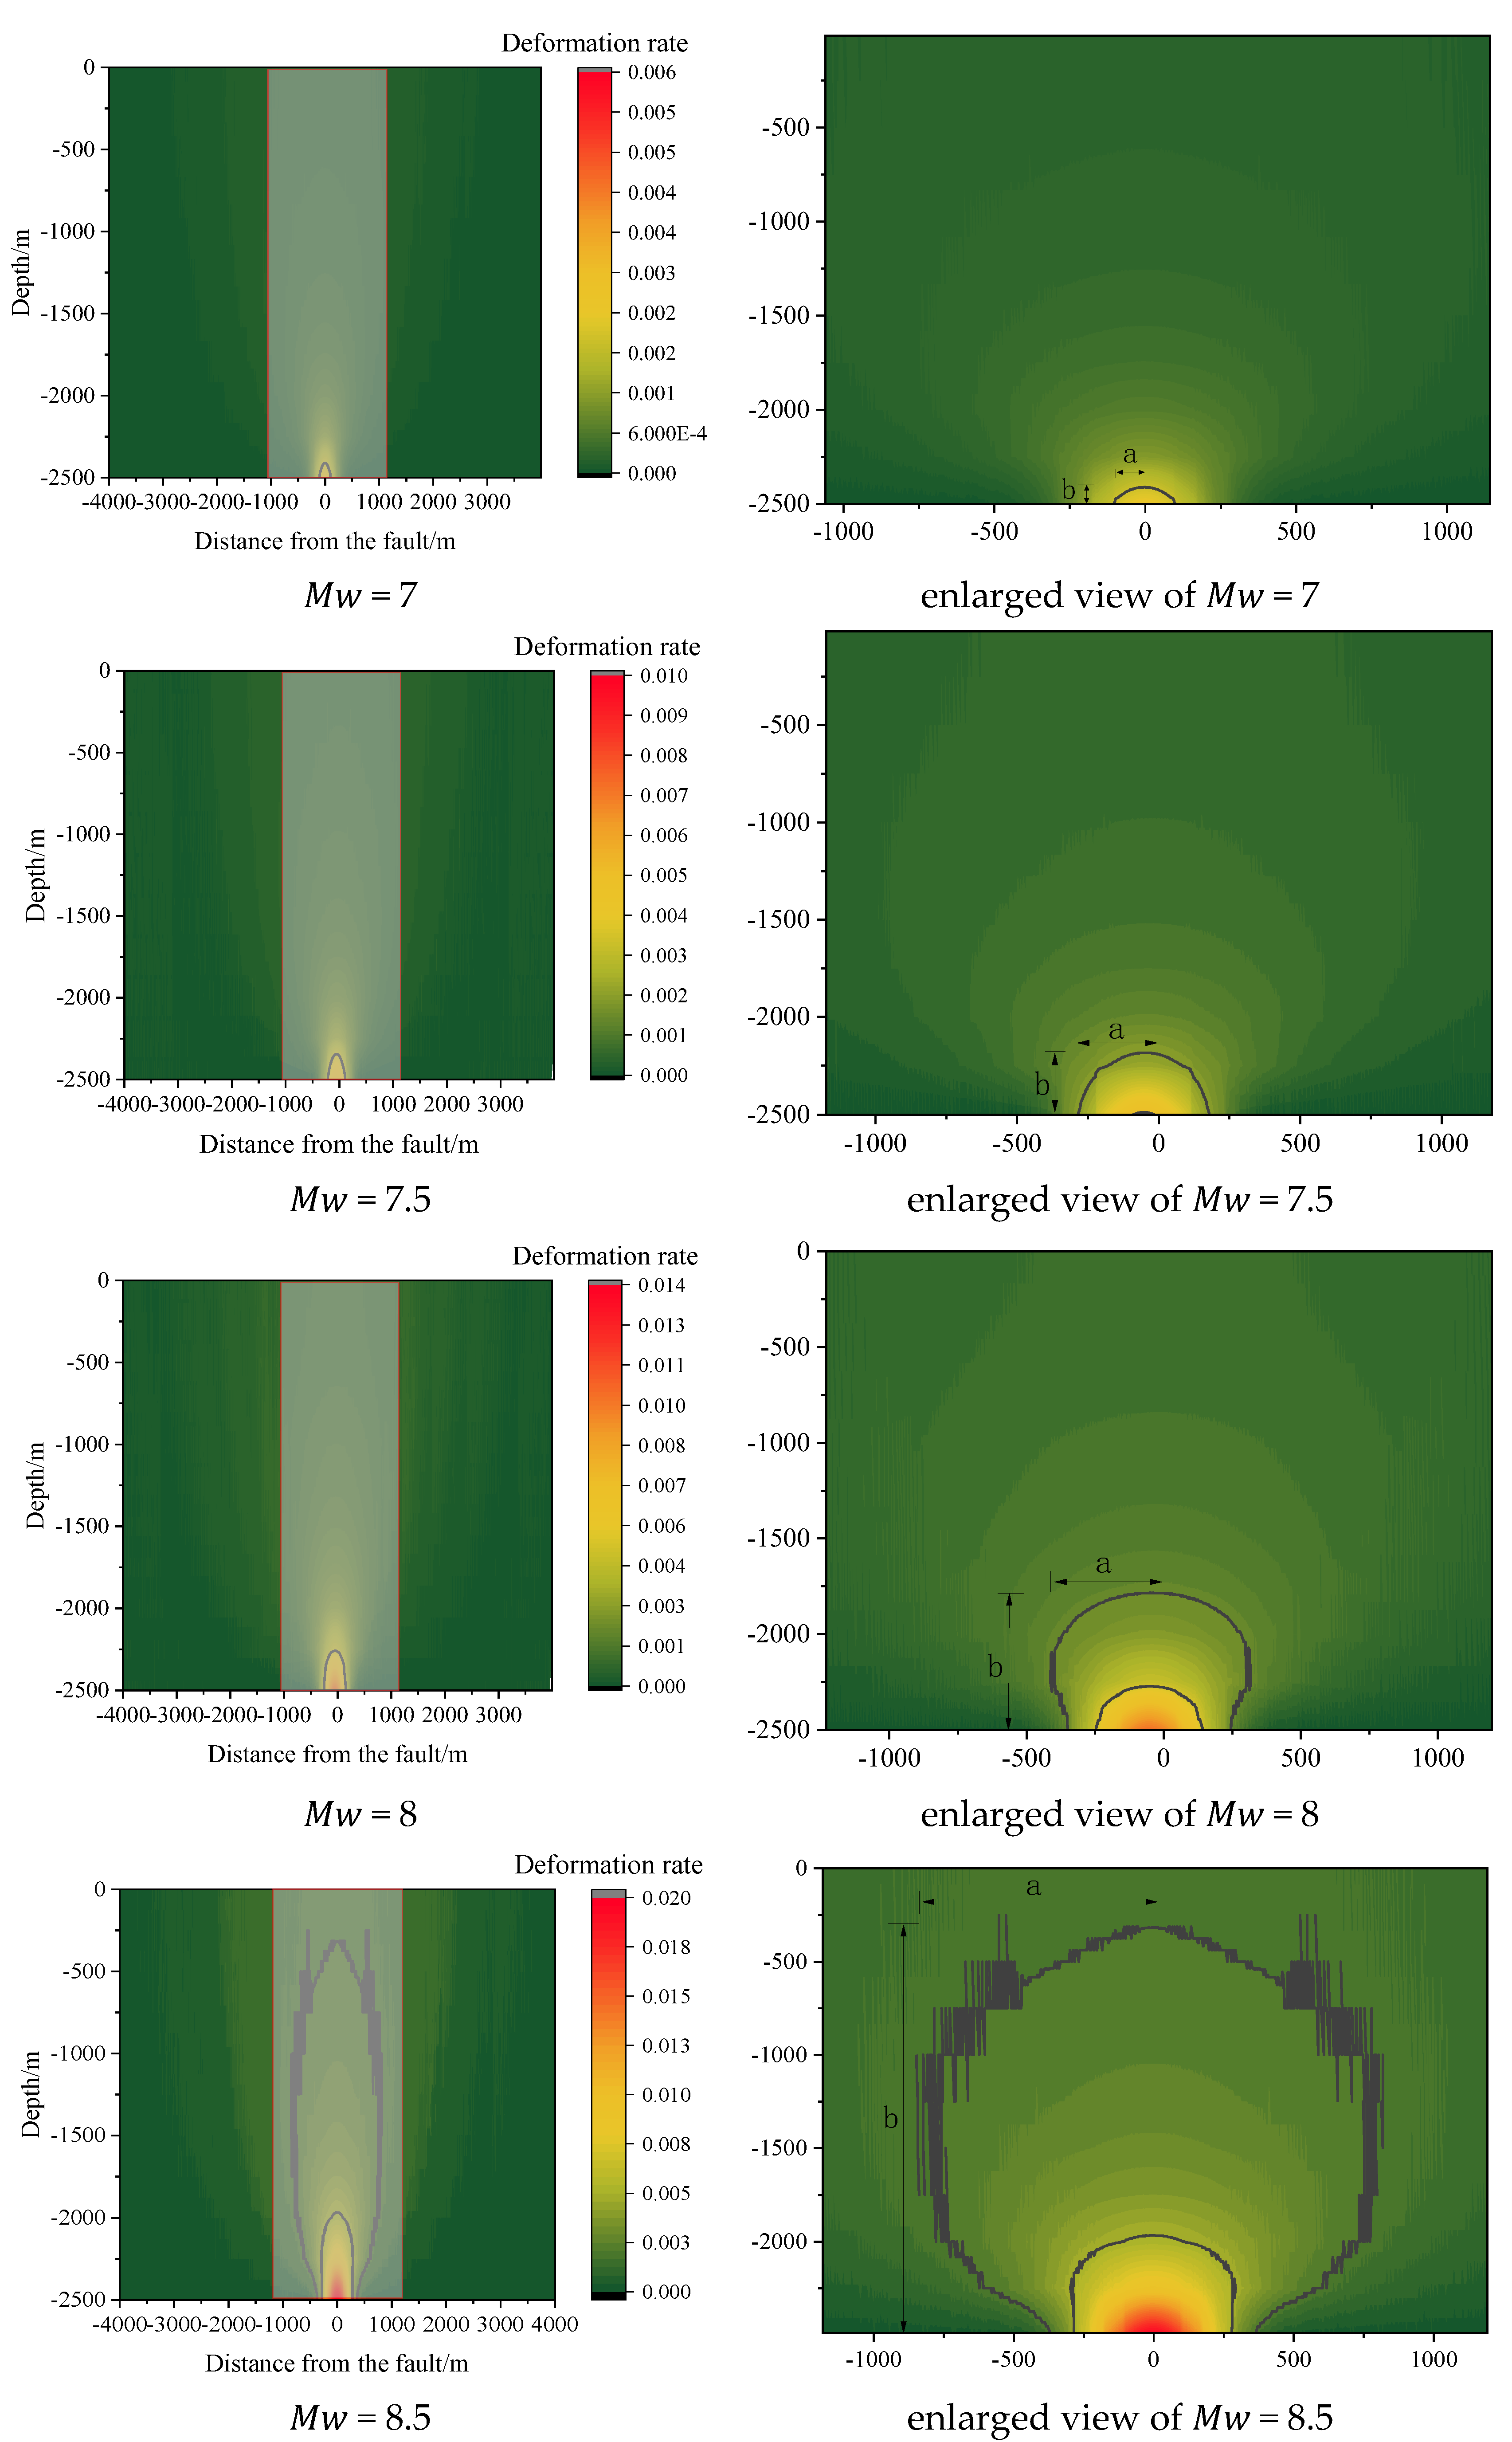
The maximum value of stratigraphic deformation doubles with the doubling of the fault dislocation. The distribution trends are the same. To further clarify the deformation difference within the soil layer, the overall deformation difference cloud diagram and local enlargement diagram of the soil body under different earthquake levels are made, which are shown in
Figure 11.
As can be seen in
Figure 11, the overall distribution pattern on the deformation difference distribution pattern is close to that of a funnel-shaped distribution from the fault to the surface. In addition, with the increase in earthquake magnitude, the influence range expands. At the same earthquake magnitude, the intensity of stratigraphic deformation increases with the proximity to the fault. Specifically, at the same horizontal position, the intensity of deformation increases with the increase in stratigraphic depth. At the same depth position, the intensity of deformation increases with the proximity to the epicenter.
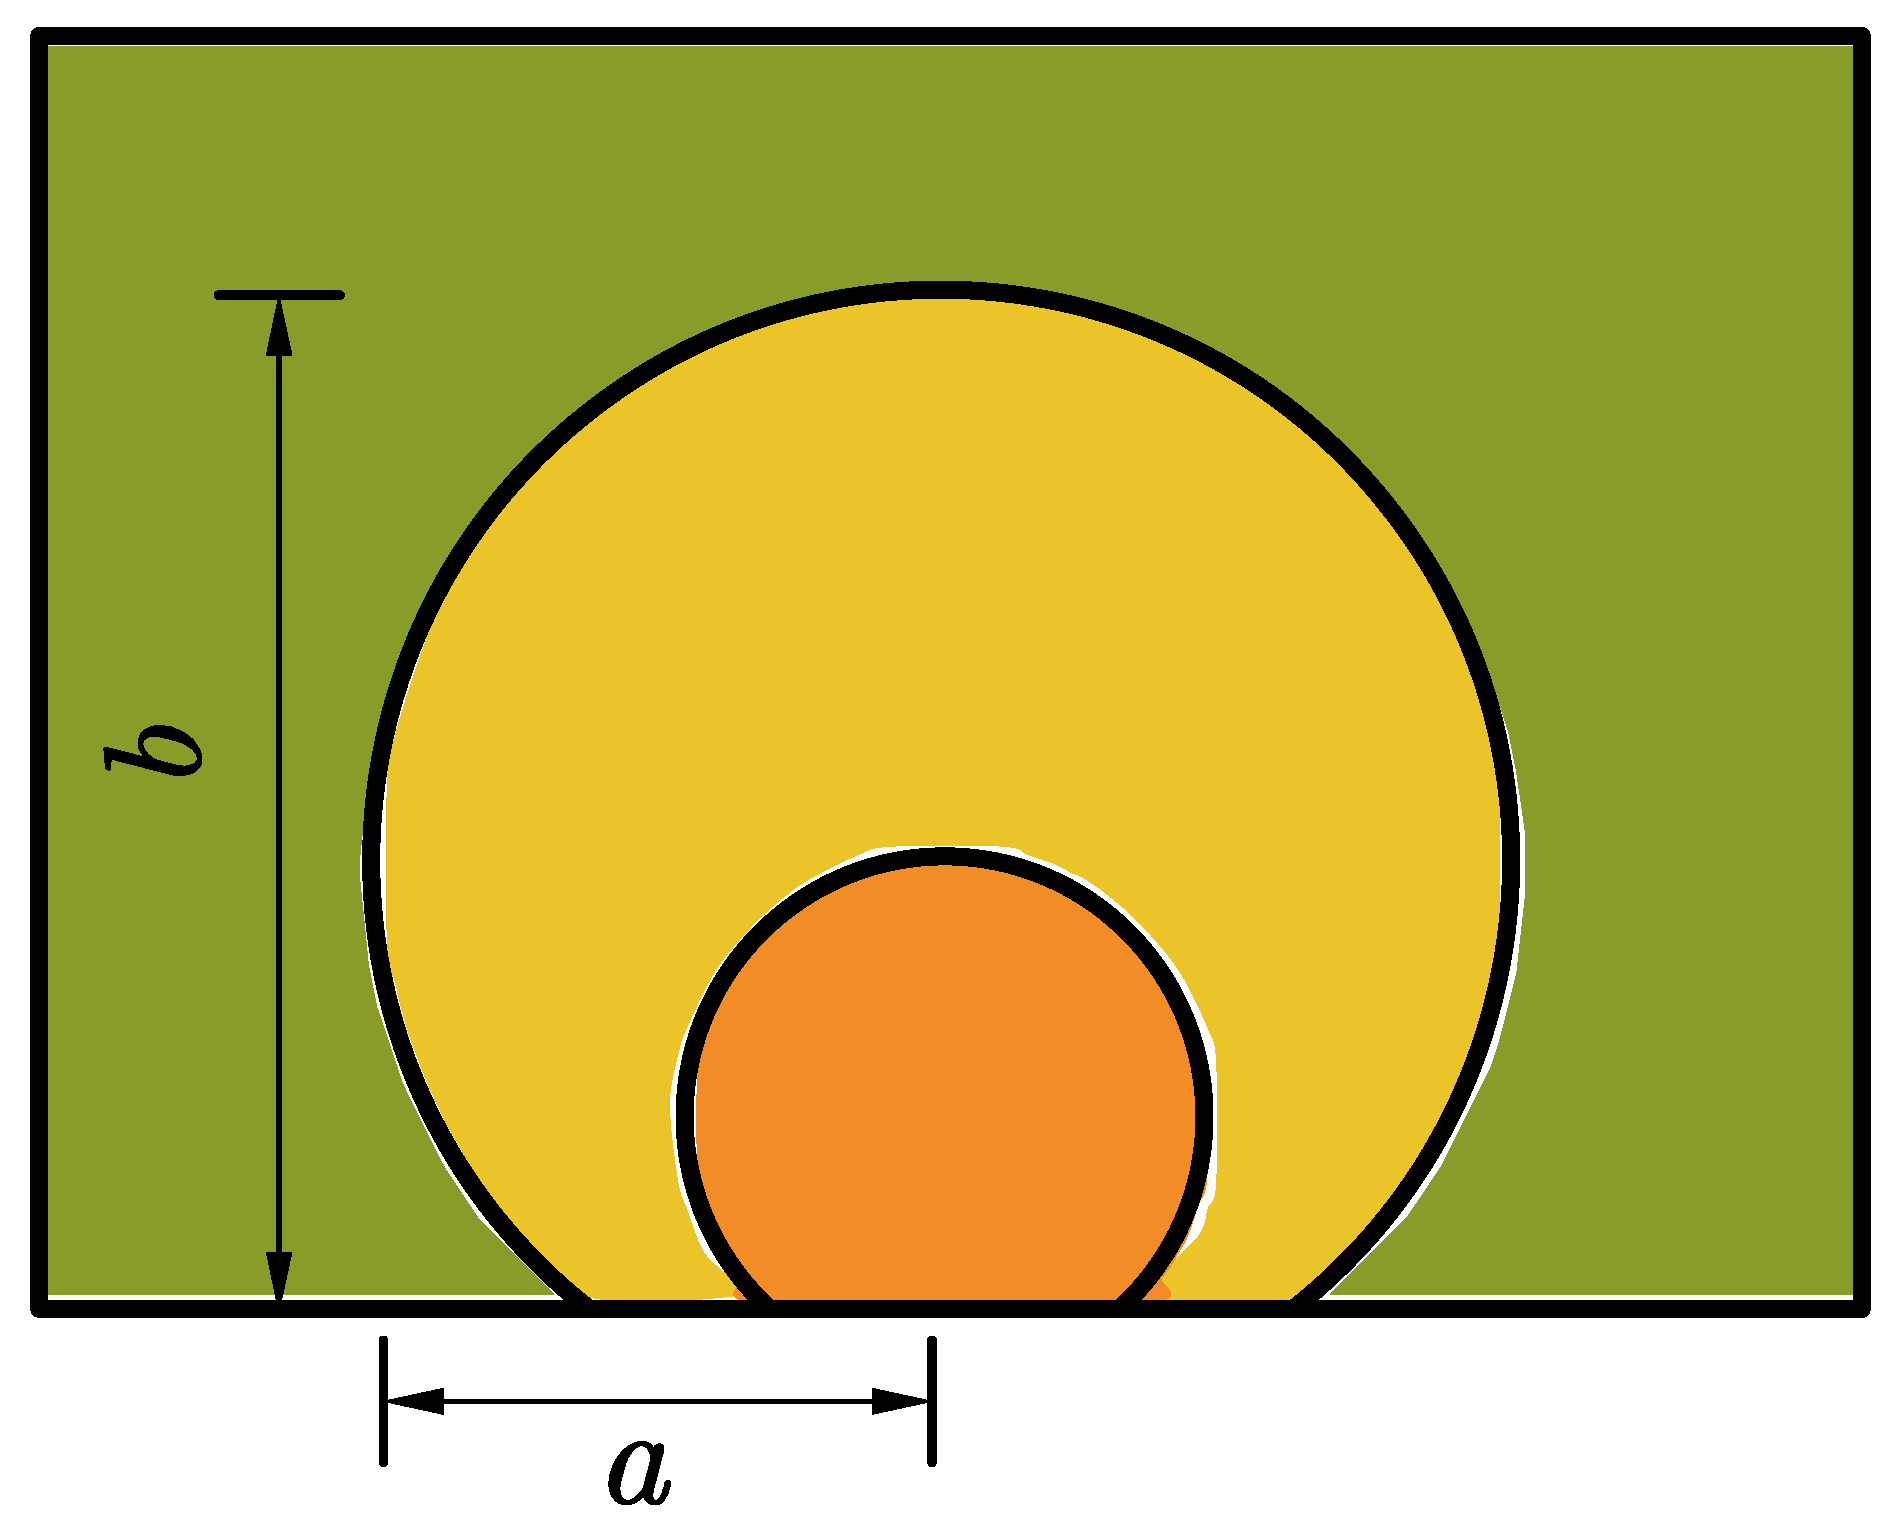
In order to further quantify the description of the impact area of different deformation degrees, this paper introduces quantitative index parameters to describe the distribution of the deformation intensity field. The shape of the deformation field is approximated by an ellipse, where the range of intensity field in the vertical direction is defined as b, and the range of intensity field in the horizontal direction is defined as a. The specific location relationship is shown in
Figure 12. In this fix, the intensity distribution parameters of the deformation field under different earthquake levels are statistically described in
Table 7.
4. Discussion
Aiming at the objective of qualitative and quantitative research on the degree of deformation and deformation distribution of the coseismic deformation field in the near-fault region, this paper establishes a model of stratigraphic deformation in the Sichuan–Tibet region based on the stratigraphic and fault parameters and uses dislocation model theory to calculate the degree of deformation of the stratigraphic deformation field around the fault after an earthquake. By introducing depth-related parameters, a more refined consideration of the coseismic displacement field is achieved. The calculated deformation law is fitted by multiple regression to form a formula, which extends the analysis field to within the burial depth scale of underground engineering compared with the existing formula. The applicability of statistical formulas in deeply buried strata is improved.
In the depth dimension within the engineering scale, the seismic intensity gradually decays from the location of the source depth to the surface, and the magnitude of the decay is first fast and then slow, showing a nonlinear change characteristic. The concept of “relative depth of burial” is proposed by considering the comprehensive influence of faults and depth of burial on deformation intensity. Under the same earthquake level and different burial depths, the closer the stratigraphic position is to the fault, the higher the intensity; the further away from the fault, the lower the intensity. The influence range of deformation is a funnel-shaped symmetric distribution. The influence range of the stratigraphic deformation field caused by fault dislocation gradually expands with the depth away from the fault, and the displacement maximum is far from the fault location, and the stratigraphic deformation is mainly bending deformation. As it is closer to the fault, the influence range is concentrated, and the ground deformation is mainly shear deformation. Both the range of stratigraphic deformation and the degree of deformation are closely related to the depth.
The model is based on the elasticity theory for the study and has good applicability at the location of deeply buried rock. As the depth of the formation becomes shallower, the mechanical properties of the formation show plasticity. Therefore, the correspondence of the calculated results of formation deformation in the surface area is poorer than that of the deeply buried strata. In addition, since the multiple influencing factors of formation deformation are not independent of each other, there is a coupling effect. In this paper, we ignore the influence of the fault sliding direction, fault dip angle, sliding surface sliding distribution, and other factors on the distribution of the ground deformation field and only consider the fault misalignment under the upright slip fault and the depth of the strata relative to the fault as two main factors and consider the fault as a uniform sliding on a rectangular plane so that the ground deformation profile is symmetrically distributed. The amount of misalignment corresponds to the energy released by the actual seismic magnitude, while in practice there is inhomogeneity in the fault surface sliding. There are some methods to consider the inhomogeneity and analyze the effect of this inhomogeneity, and in further research, more abundant factors are considered to improve the existing model.
5. Conclusions
In this paper, according to the crustal stratification model of the Sichuan–Tibet region, the distribution pattern of the stratigraphic deformation field in the vicinity of the fault is obtained by combining theoretical analysis and surface survey data, using multiple data joint inversion to obtain fault information and combining with stratigraphic parameter orthorectification calculation. Compared with previous studies, it makes up for the lack of description of the deformation degree within the strata. The effects of various factors are considered, and their parameter influence laws are analyzed separately and targeted for simplification in the subsequent quantitative analysis. For the first time, the concept of intensity is introduced to describe the degree of stratigraphic dislocation deformation, and the research scope is extended from the surface to the scale where the burial depth of underground works is located, and the results of the study can make a preliminary estimation of the degree of stratigraphic deformation after the occurrence of earthquakes. Finally, formulas are fitted to the maximum displacement based on the main influencing factors, and a practical partitioning of the deformation influence range is carried out.
Synthesizing the above work, the main conclusions obtained are as follows.
- (1)
The stratigraphic deformation field is significantly different in terms of deformation volume and deformation range within a certain depth at the surface and underground. When analyzing the seismic intensity, it is necessary to consider the distribution of the intensity of the ground deformation field at different locations within the stratum under two factors: the burial depth of the fault and the burial depth of the structure.
- (2)
The application range of the existing surface rupture formula is extended to a certain depth below the ground surface, and after considering the relative burial depth factor, the formula is fitted with the ground deformation law to facilitate the preliminary estimation of the maximum displacement of the strata under different earthquake levels and depths.
- (3)
Based on the concept of seismic intensity, the deformation intensity index is introduced to describe the deformation degree and distribution in different areas of the subsurface deformation field, and the practical zoning is carried out according to the ground deformation law, which provides a useful reference for structural deformation prevention and post-earthquake damage prediction at different depths and ranges in the near-fault area under the corresponding seismic magnitude.
Author Contributions
Conceptualization, B.Z. and K.G.; validation, K.G.; formal analysis, K.G.; investigation, K.G.; resources, B.Z.; data curation, K.G.; writing—original draft preparation, K.G.; writing—review and editing, B.Z.; visualization, K.G.; supervision, B.Z.; project administration, B.Z.; funding acquisition, B.Z. All authors have read and agreed to the published version of the manuscript.
Funding
This research was funded by the National Natural Science Foundation of China, (Grant Nos. 51778046, 51808035, U1434210), the Research Grants from the National Institute of Natural Hazards, Ministry of Emergency Management of China (Grant No. ZDJ2020-14).
Institutional Review Board Statement
Not applicable.
Informed Consent Statement
Not applicable.
Data Availability Statement
Not applicable.
Acknowledgments
The authors are deeply thankful to the reviewers and editor for their valuable suggestions to improve the quality of the paper.
Conflicts of Interest
The authors declare no conflict of interest.
References
- Wells, D.L.; Coppersmith, K.J. New Empirical Relationships among Magnitude, Rupture Length, Rupture Width, Rupture Area, and Surface Displacement. Bull. Seismol. Soc. Am. 1994, 84, 974–1002. [Google Scholar]
- Cheng, J.; Rong, Y.; Magistrale, H.; Chen, G.; Xu, X. Earthquake Rupture Scaling Relations for Mainland China. Seismol. Res. Lett. 2020, 91, 248–261. [Google Scholar] [CrossRef]
- Ran, H. Empirical relationship between seismic rupture parameters and magnitude for strike-slip active ruptures in western China. Earthq. Geol. 2011, 33, 577–585. (In Chinese) [Google Scholar]
- Qi, J.; Zhao, X.; Wang, C.; Hao, W. Three-dimensional numerical simulation of the rupture process of the overlying soil triggered by the fault movement of a hidden positive fault. J. Seismol. 2019, 41, 124–137. (In Chinese) [Google Scholar]
- Callisto, L.; Ricci, C. Interpretation and Back-Analysis of the Damage Observed in a Deep Tunnel after the 2016 Norcia Earthquake in Italy. Tunn. Undergr. Space Technol. 2019, 89, 238–248. [Google Scholar] [CrossRef]
- Yu, H.; Chen, J.; Bobet, A.; Yuan, Y. Damage Observation and Assessment of the Longxi Tunnel during the Wenchuan Earthquake. Tunn. Undergr. Space Technol. 2016, 54, 102–116. [Google Scholar] [CrossRef]
- Zhang, X.; Jiang, Y.; Sugimoto, S. Seismic Damage Assessment of Mountain Tunnel: A Case Study on the Tawarayama Tunnel Due to the 2016 Kumamoto Earthquake. Tunn. Undergr. Space Technol. 2018, 71, 138–148. [Google Scholar] [CrossRef] [Green Version]
- Huang, L.-Y.; Wang, C.-H.; Yang, S.-X. Seismic design of tunnels based on coseismic displacement and its engineering applications. J. Earthq. Eng. 2019, 41, 29–35. (In Chinese) [Google Scholar]
- Ma, K.; Feng, B.; Zhuang, D.Y.; Guo, X.F.; Gao, Q. Distance Effects of the Fault on the Surrounding Rock Mass Stability of the Main Powerhouse at the Huanggou Pumped-Storage Power Station. Tunn. Undergr. Space Technol. 2020, 106, 103568. [Google Scholar] [CrossRef]
- Rajyaswori, S.; Li, X.; Luo, Y.; Kumar, M.A.; Xu, K. The Effect of Overburden Depth on the Damage of Underground Structure during Earthquake. IOP Conf. Ser. Earth Environ. Sci. 2020, 455, 012067. [Google Scholar] [CrossRef]
- Anastasopoulos, I.; Gerolymos, N.; Drosos, V.; Georgarakos, T.; Kourkoulis, R.; Gazetas, G. Behaviour of Deep Immersed Tunnel under Combined Normal Fault Rupture Deformation and Subsequent Seismic Shaking. Bull. Earthq. Eng. 2008, 6, 213–239. [Google Scholar] [CrossRef]
- Ashtiani, M.; Ghalandarzadeh, A.; Towhata, I. Centrifuge Modeling of Shallow Embedded Foundations Subjected to Reverse Fault Rupture. Can. Geotech. J. 2016, 53, 505–520. [Google Scholar] [CrossRef]
- Loukidis, D.N.; Bouckovalas, G. Numerical Simulation of Active Fault Rupture Propagation Through Dry Soil. In Proceedings of the 4th International Conference on Recent Advances in Geotechnical Earthquake Engineering and Soil Dynamics, San Diego, CA, USA, 26–31 March 2001. [Google Scholar]
- Baziar, M.H.; Nabizadeh, A.; Mehrabi, R.; Lee, C.J.; Hung, W.Y. Evaluation of Underground Tunnel Response to Reverse Fault Rupture Using Numerical Approach. Soil Dyn. Earthq. Eng. 2016, 83, 1–17. [Google Scholar] [CrossRef]
- Li, H.; Deng, C.F.; Chen, L.W.; Zhou, Q.; Ran, H.L.; Xing, C.K. Numerical simulation study of factors influencing the distribution of earthquake surface rupture zones on strike-slip faults—An example of the 1973 Furho M_S7.6 earthquake. J. Geophys. 2019, 62, 2871–2884. (In Chinese) [Google Scholar]
- Zhang, C.; Li, W.; Li, D.; Hou, Y.; Chen, H. A discussion on the calculation of seismic intensity distribution from coseismic deformation theory. Earthquake 2011, 31, 98–100, 102–106. (In Chinese) [Google Scholar]
- Bryant, W.A. History of the Alquist-Priolo Earthquake Fault Zoning Act, California, USA. Environ. Eng. Geosci. 2010, 16, 7–18. [Google Scholar] [CrossRef]
- Steketee, J.A. On Volterra’s Dislocations in a Semi-Infinite Elastic Medium. Can. J. Phys. 1958, 36, 192–205. [Google Scholar] [CrossRef]
- Okada, Y. Surface Deformation Due to Shear and Tensile Faults in a Half-Space. Bull. Seismol. Soc. Am. 1985, 75, 1135–1154. [Google Scholar] [CrossRef]
- Okada, Y. Internal Deformation Due to Shear and Tensile Faults in a Half-Space. Bull. Seismol. Soc. Am. 1992, 82, 1018–1040. [Google Scholar] [CrossRef]
- Hashima, A.; Fukahata, Y.; Hashimoto, C.; Matsu’ura, M. Quasi-Static Strain and Stress Fields Due to a Moment Tensor in Elastic–Viscoelastic Layered Half-Space. Pure Appl. Geophys. 2014, 171, 1669–1693. [Google Scholar] [CrossRef]
- Wang, R. A Simple Orthonormalization Method for Stable and Efficient Computation of Green’s Functions. Bull. Seismol. Soc. Am. 1999, 89, 733–741. [Google Scholar]
- Wang, R.; Martín, F.L.; Roth, F. Computation of Deformation Induced by Earthquakes in a Multi-Layered Elastic Crust—FORTRAN Programs EDGRN/EDCMP. Comput. Geosci. 2003, 29, 195–207. [Google Scholar] [CrossRef]
- Zhou, J.; Pan, E.; Bevis, M. A Point Dislocation in a Layered, Transversely Isotropic and Self-Gravitating Earth—Part III: Internal Deformation. Geophys. J. Int. 2020, 223, 420–443. [Google Scholar] [CrossRef]
- Dong, J.; Sun, W.; Zhou, X.; Wang, R. Effects of Earth’s Layered Structure, Gravity and Curvature on Coseismic Deformation. Geophys. J. Int. 2014, 199, 1442–1451. [Google Scholar] [CrossRef] [Green Version]
- Wang, Q.; Wang, Z.; Zhang, J.; Li, J.; Chen, Z. Fault structure of the April 2010 Yushu M_S7.3 earthquake sequence. J. Geophys. 2015, 58, 1931–1940. (In Chinese) [Google Scholar]
- Shan, B.; Xiong, X.; Zheng, Y.; Wei, S.; Wen, Y.; Jin, B.; Ge, C. The Coseismic Coulomb Stress Change and Expected Seismicity Rate Caused by 14 April 2010 Ms=7.1 Yushu, China, Earthquake. Tectonophysics 2011, 510, 345–353. [Google Scholar] [CrossRef]
- Li, Z.; Elliott, J.R.; Feng, W.; Jackson, J.A.; Parsons, B.E.; Walters, R.J. The 2010 MW 6.8 Yushu (Qinghai, China) Earthquake: Constraints Provided by InSAR and Body Wave Seismology. J. Geophys. Res. Solid Earth 2011, 116. [Google Scholar] [CrossRef] [Green Version]
- Wu, J.P.; Ming, Y.H.; Wang, C.Y. Regional seismic waveform inversion study of velocity structure in Sichuan and Yunnan. J. Geophys. 2006, 49, 1369–1376. (In Chinese) [Google Scholar]
- Ma, Y.; Zhang, Y.; Hu, D.; Yang, N.; Long, C.; Hou, C.; Yan, P.; Wu, Z.; Yang, Z.; Lei, W.; et al. Surface rupture and macroscopic epicenter of the Yushu earthquake. J. Geomech. 2010, 16, 115–128. (In Chinese) [Google Scholar]
- Wang, X.; Zhou, Y.; Sun, M.; Wang, W. Rupture process of the Mw6.9 magnitude earthquake in Yushu, Qinghai. Geol. Bull. 2014, 33, 517–523. (In Chinese) [Google Scholar]
- Zhou, H.; Zhang, J.; Hu, L.; Luo, Y. Simulation and parametric inversion analysis of coseismic deformation fields from InSAR data of the Yushu earthquake in Qinghai. J. Geoinf. Sci. 2011, 13, 418–423. (In Chinese) [Google Scholar]
- Laske, G.; Masters, G.; Ma, Z.; Pasyanos, M. Update on CRUST1. 0—A 1-Degree Global Model of Earth’s Crust. Geophys. Res. Abstr. 2013, 15, 2658. [Google Scholar]
- Tie, R.; Wang, J.; Jia, L.J.; Guo, M.Z. Study on seismic data statistics of strong earthquakes and their surface rupture characteristics. World Earthq. Eng. 2016, 32, 112–116. (In Chinese) [Google Scholar]
- Richards, P.G.; Aki Keiiti, A. Quantitative Seismology: Theory and Methods; Freeman: New York, NY, USA, 1980; Volume 859. [Google Scholar]
- Hanks, T.C.; Kanamori, H. A Moment Magnitude Scale. J. Geophys. Res. Solid Earth 1979, 84, 2348–2350. [Google Scholar] [CrossRef]
- Marchandon, M.; Hollingsworth, J.; Radiguet, M. Origin of the Shallow Slip Deficit on a Strike Slip Fault: Influence of Elastic Structure, Topography, Data Coverage, and Noise. Earth Planet. Sci. Lett. 2021, 554, 116696. [Google Scholar] [CrossRef]
- Guo, Y.; Yao, L.; Chen, S. Research on the method of ground stress assessment considering relative source depth. Adv. Geophys. 2018, 33, 2108–2112. (In Chinese) [Google Scholar]
- Zhang, Y.; Feng, W.P.; Xu, L.S.; Zhou, C.H.; Chen, Y.T. Spatial and temporal rupture processes of the 2008 Wenchuan earthquake. Sci. China Ser. D Earth Sci. 2009, 52, 145–154. [Google Scholar] [CrossRef]
- Ministry of Housing and Urban-Rural Development of the People’s Republic of China; National Standard of the People’s Republic of China. Seismic Design Code for Buildings. In National Standard of the People’s Republic of China. Code for Seismic Design of Buildings; China Architecture & Building Press: Beijing, China, 2010. [Google Scholar]
Figure 1.
Flow chart of stratigraphic deformation zoning calculation.
Figure 1.
Flow chart of stratigraphic deformation zoning calculation.
Figure 2.
Deformation fields of strata at different depths of the Yushu earthquake.
Figure 2.
Deformation fields of strata at different depths of the Yushu earthquake.
Figure 3.
The difference in stratigraphic deformation at adjacent points.
Figure 3.
The difference in stratigraphic deformation at adjacent points.
Figure 4.
The difference in stratigraphic deformation under different depth.
Figure 4.
The difference in stratigraphic deformation under different depth.
Figure 5.
Schematic location of stratigraphic coseismic displacement field monitoring.
Figure 5.
Schematic location of stratigraphic coseismic displacement field monitoring.
Figure 6.
Deformation degree of strata at different depths.
Figure 6.
Deformation degree of strata at different depths.
Figure 7.
Distribution of stratigraphic deformation at different dip angles.
Figure 7.
Distribution of stratigraphic deformation at different dip angles.
Figure 8.
Monitoring profile of the degree of stratigraphic deformation.
Figure 8.
Monitoring profile of the degree of stratigraphic deformation.
Figure 9.
Distribution of stratigraphic deformation.
Figure 9.
Distribution of stratigraphic deformation.
Figure 10.
Factors influencing 2D partitioning.
Figure 10.
Factors influencing 2D partitioning.
Figure 11.
Distribution of the degree of stratigraphic deformation.
Figure 11.
Distribution of the degree of stratigraphic deformation.
Figure 12.
Schematic diagram of the influence range of the intensity of stratigraphic deformation.
Figure 12.
Schematic diagram of the influence range of the intensity of stratigraphic deformation.
Table 1.
Source parameters of the 2010 Yushu earthquake.
Table 1.
Source parameters of the 2010 Yushu earthquake.
| Fault Type | Mw | Strike (°) | Dip (°) | Slip (°) | Length (km) | Width (km) |
|---|
| Slip | 6.5 | 155 | 80 | −10 | 25 | 10 |
Table 2.
Crustal stratification model used in the Yushu earthquake.
Table 2.
Crustal stratification model used in the Yushu earthquake.
| No. | Depth (km) | (103 km/s)
| | | (GPa)
| (GPa)
|
|---|
| 1 | 0–2 | 2.10 | 4.11 | 2.40 | 11.28 | 12.10 |
| 2 | 2–5 | 2.67 | 5.31 | 3.06 | 25.28 | 25.00 |
| 3 | 5–10 | 2.78 | 5.97 | 3.44 | 33.29 | 32.90 |
| 4 | 10–20 | 2.82 | 6.25 | 3.61 | 36.66 | 36.75 |
| 5 | 20–42 | 2.90 | 6.40 | 3.70 | 39.38 | 39.70 |
| 6 | 42–∞ | 3.20 | 7.70 | 4.45 | 62.99 | 63.37 |
Table 3.
Crustal structure model of Jiuzhaigou earthquake area.
Table 3.
Crustal structure model of Jiuzhaigou earthquake area.
| Layer Number | Expansion Wave Velocity Vp (km/s) | Shear Wave Speed Vs (km/s) | Density ρ (103 kg/m3) | Thickness (km) | Depth (km) |
|---|
| 1 | 6.1 | 3.55 | 2.75 | 22 | 0 |
| 2 | 6.3 | 3.65 | 2.80 | 20 | 22 |
| 3 | - | - | - | - | 42 |
Table 4.
Seismic fault parameters of different magnitudes.
Table 4.
Seismic fault parameters of different magnitudes.
| The Magnitude of Earthquake (MW) | Fault Length L (km) | Fault Width (km) | Average Dislocation Amount (m) |
|---|
| 7 | 50 | 15 | 2.0 |
| 7.5 | 100 | 22 | 4.1 |
| 8 | 190 | 32 | 8.0 |
| 8.5 | 375 | 48 | 16.0 |
Table 5.
Maximum surface dislocation and rupture zone width caused by strike-slip faults at different magnitudes and burial depths (m).
Table 5.
Maximum surface dislocation and rupture zone width caused by strike-slip faults at different magnitudes and burial depths (m).
| Relative Burial Depth
|
|---|
| 0 | 0.1 | 0.2 | 0.3 | 0.4 | 0.5 | 0.6 | 0.7 | 0.8 | 0.9 | 1 |
|---|
| 7.0 | 0.498 | 0.499 | 0.502 | 0.506 | 0.512 | 0.515 | 0.520 | 0.526 | 0.533 | 0.542 | 0.556 |
| 7.5 | 1.182 | 1.184 | 1.190 | 1.198 | 1.210 | 1.217 | 1.227 | 1.239 | 1.254 | 1.271 | 1.289 |
| 8.0 | 2.515 | 2.518 | 2.529 | 2.547 | 2.571 | 2.584 | 2.604 | 2.629 | 2.658 | 2.692 | 2.729 |
| 8.5 | 3.984 | 3.991 | 4.012 | 4.047 | 4.093 | 4.121 | 4.158 | 4.206 | 4.264 | 4.339 | 4.445 |
Table 6.
Comparison table of stratigraphic deformation rate and intensity.
Table 6.
Comparison table of stratigraphic deformation rate and intensity.
| Stratigraphic Deformation Rate | Intensity |
|---|
| 0–0.002 | Little Impact |
| 0.002–0.005 | Weak Impact |
| >0.005 | Strong Impact |
Table 7.
Stratigraphic zoning parameters at each seismic level.
Table 7.
Stratigraphic zoning parameters at each seismic level.
| Scope Parameters | | | | |
|---|
| a | b | a | b | a | b | a | b |
|---|
| Little Impact/m | >100 | >110 | >260 | >350 | >740 | >400 | >760 | >2000 |
| Weak Impact/m | [0, 100] | [0, 110] | [20, 260] | [10, 350] | [210, 740] | [220, 400] | [350, 760] | [500, 2000] |
| Strong Impact/m | / | <20 | <10 | <210 | <220 | <350 | <500 |
| Publisher’s Note: MDPI stays neutral with regard to jurisdictional claims in published maps and institutional affiliations. |
© 2022 by the authors. Licensee MDPI, Basel, Switzerland. This article is an open access article distributed under the terms and conditions of the Creative Commons Attribution (CC BY) license (https://creativecommons.org/licenses/by/4.0/).


