
Social Bots Detection via Fusing BERT and Graph Convolutional Networks


Abstract
:1. Introduction
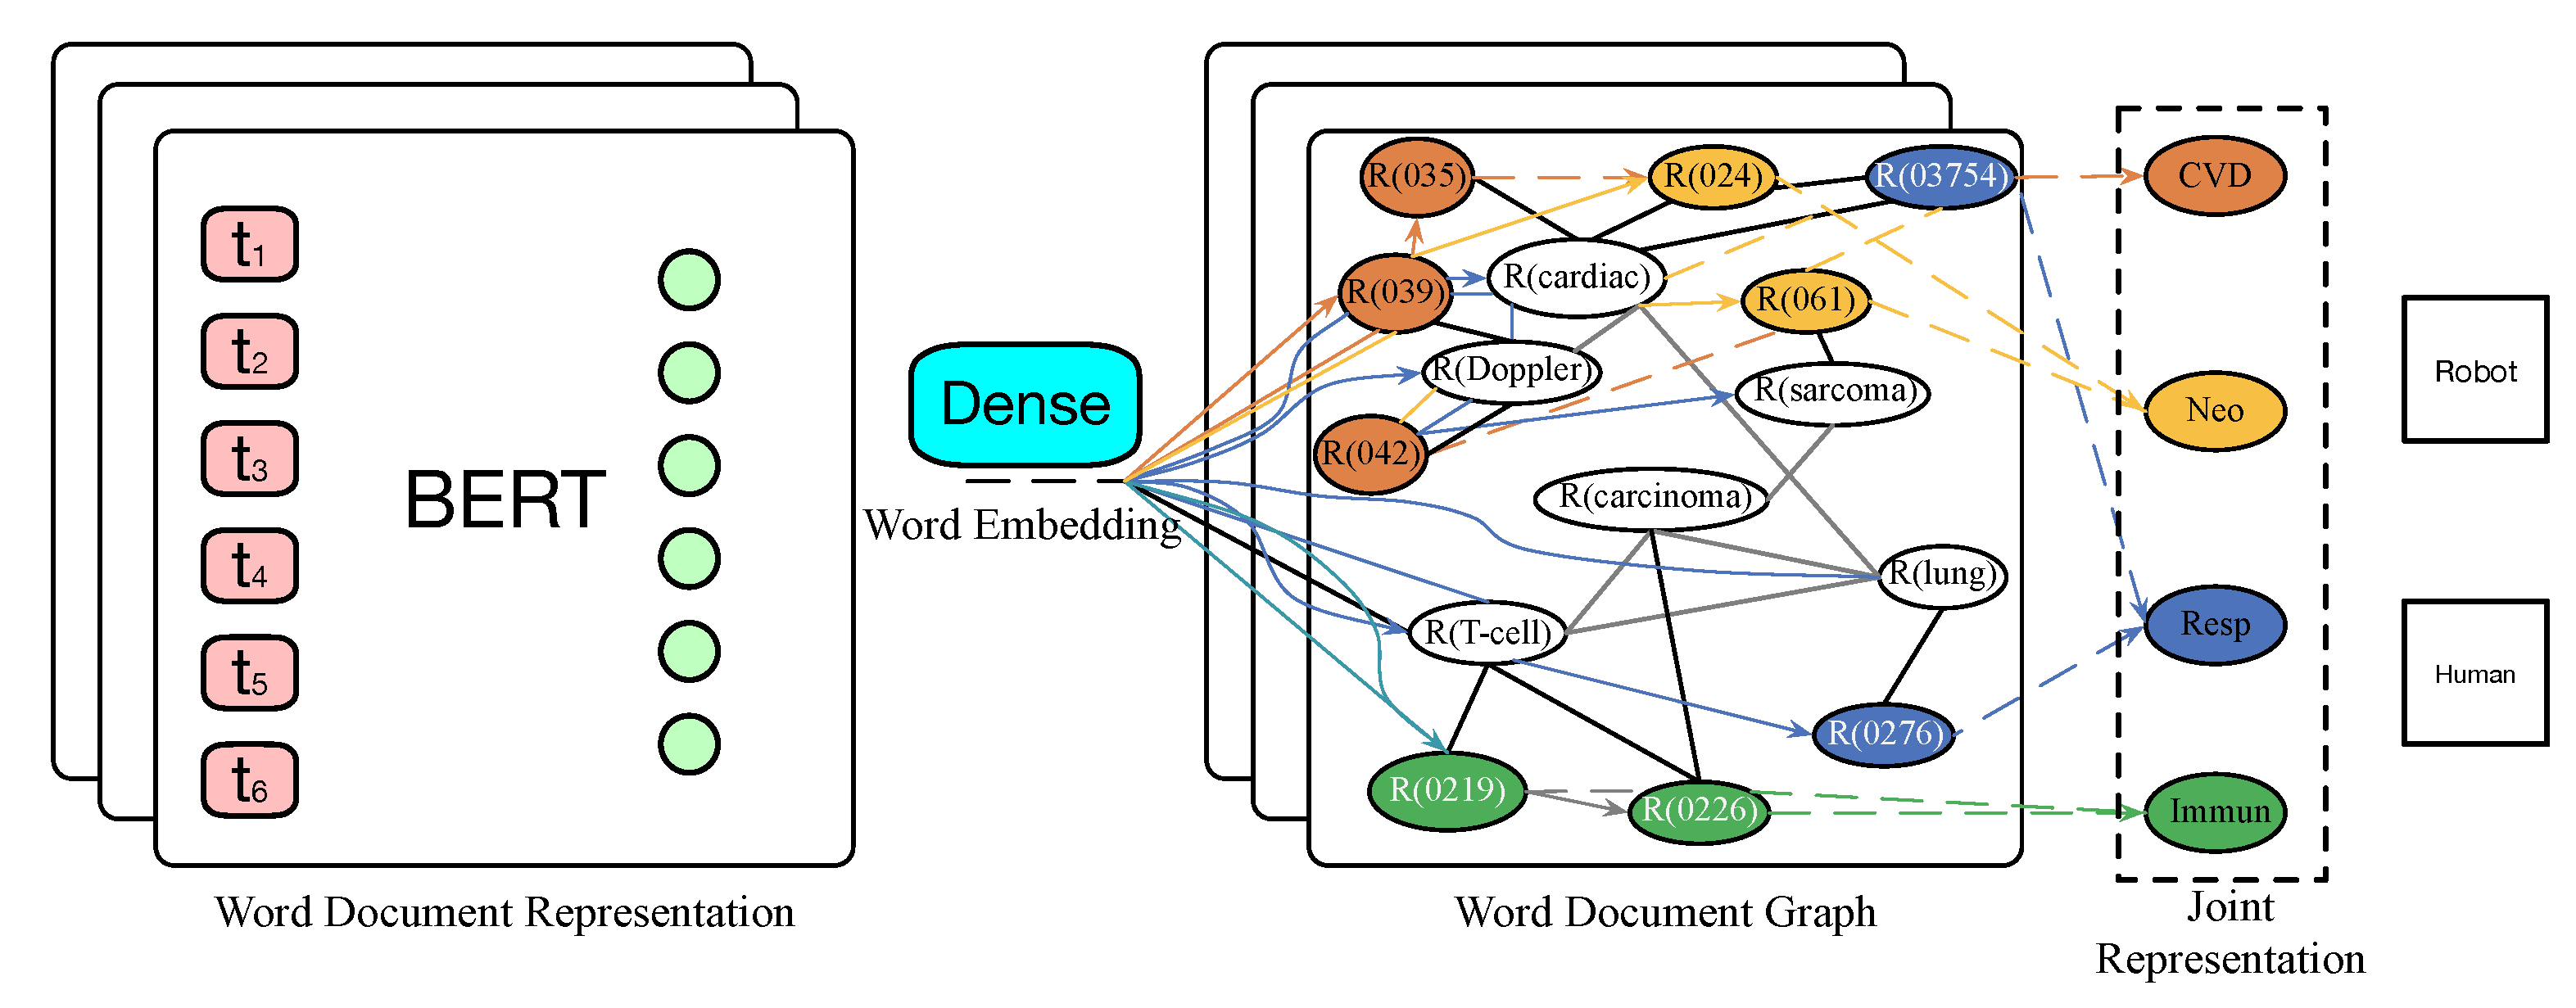
- We combine pre-trained language model BERT and Graph Convolutional Networks to detect social bots;
- We can fuse semantic information by applying BERT multi-head attention, and a better-integrated representation can be generated by each text;
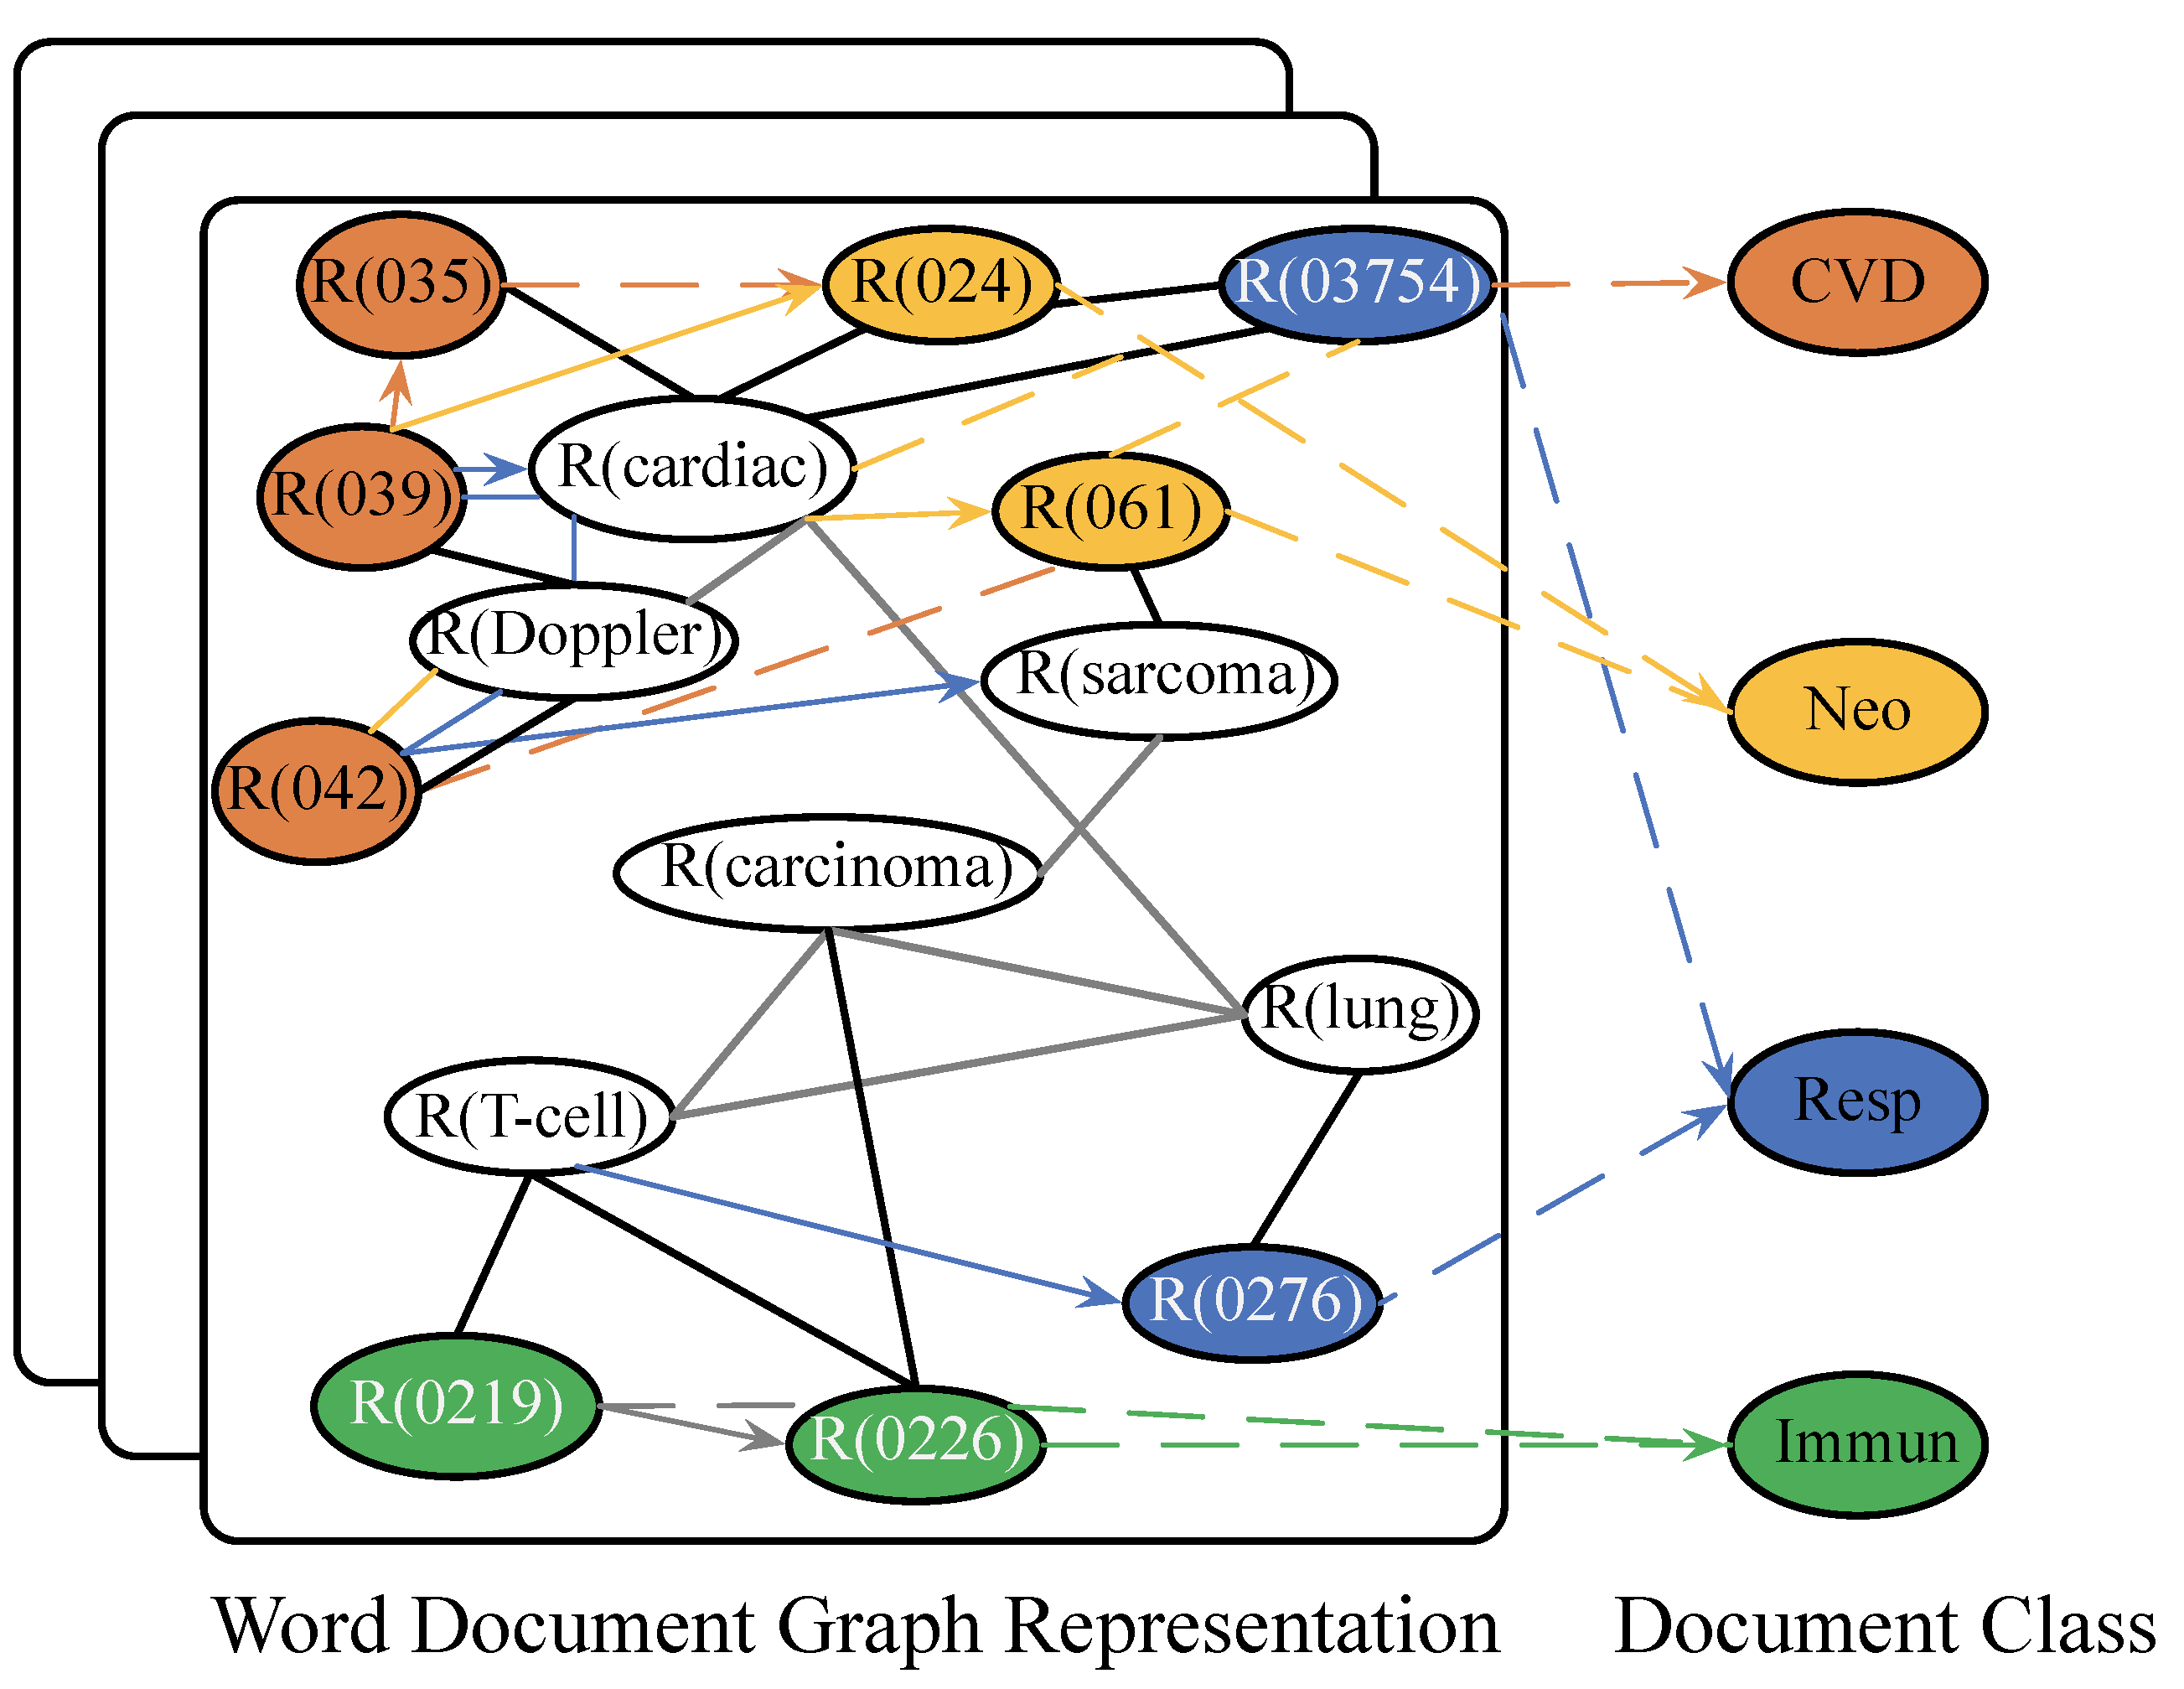
- We adopt a novel graph neural network method to detect social robots. This is research on embedding a heterogeneous graph and graph neural network to learn words and documents through the whole corpus modelling.
2. Related Works
2.1. Crowdsourcing Social Machine Account Detection Platform
2.2. Detection Technology Based on Machine Learning
2.3. Detection Technology Based on Deep Learning
2.4. Detection Technology Based on Social Graph
3. Methods
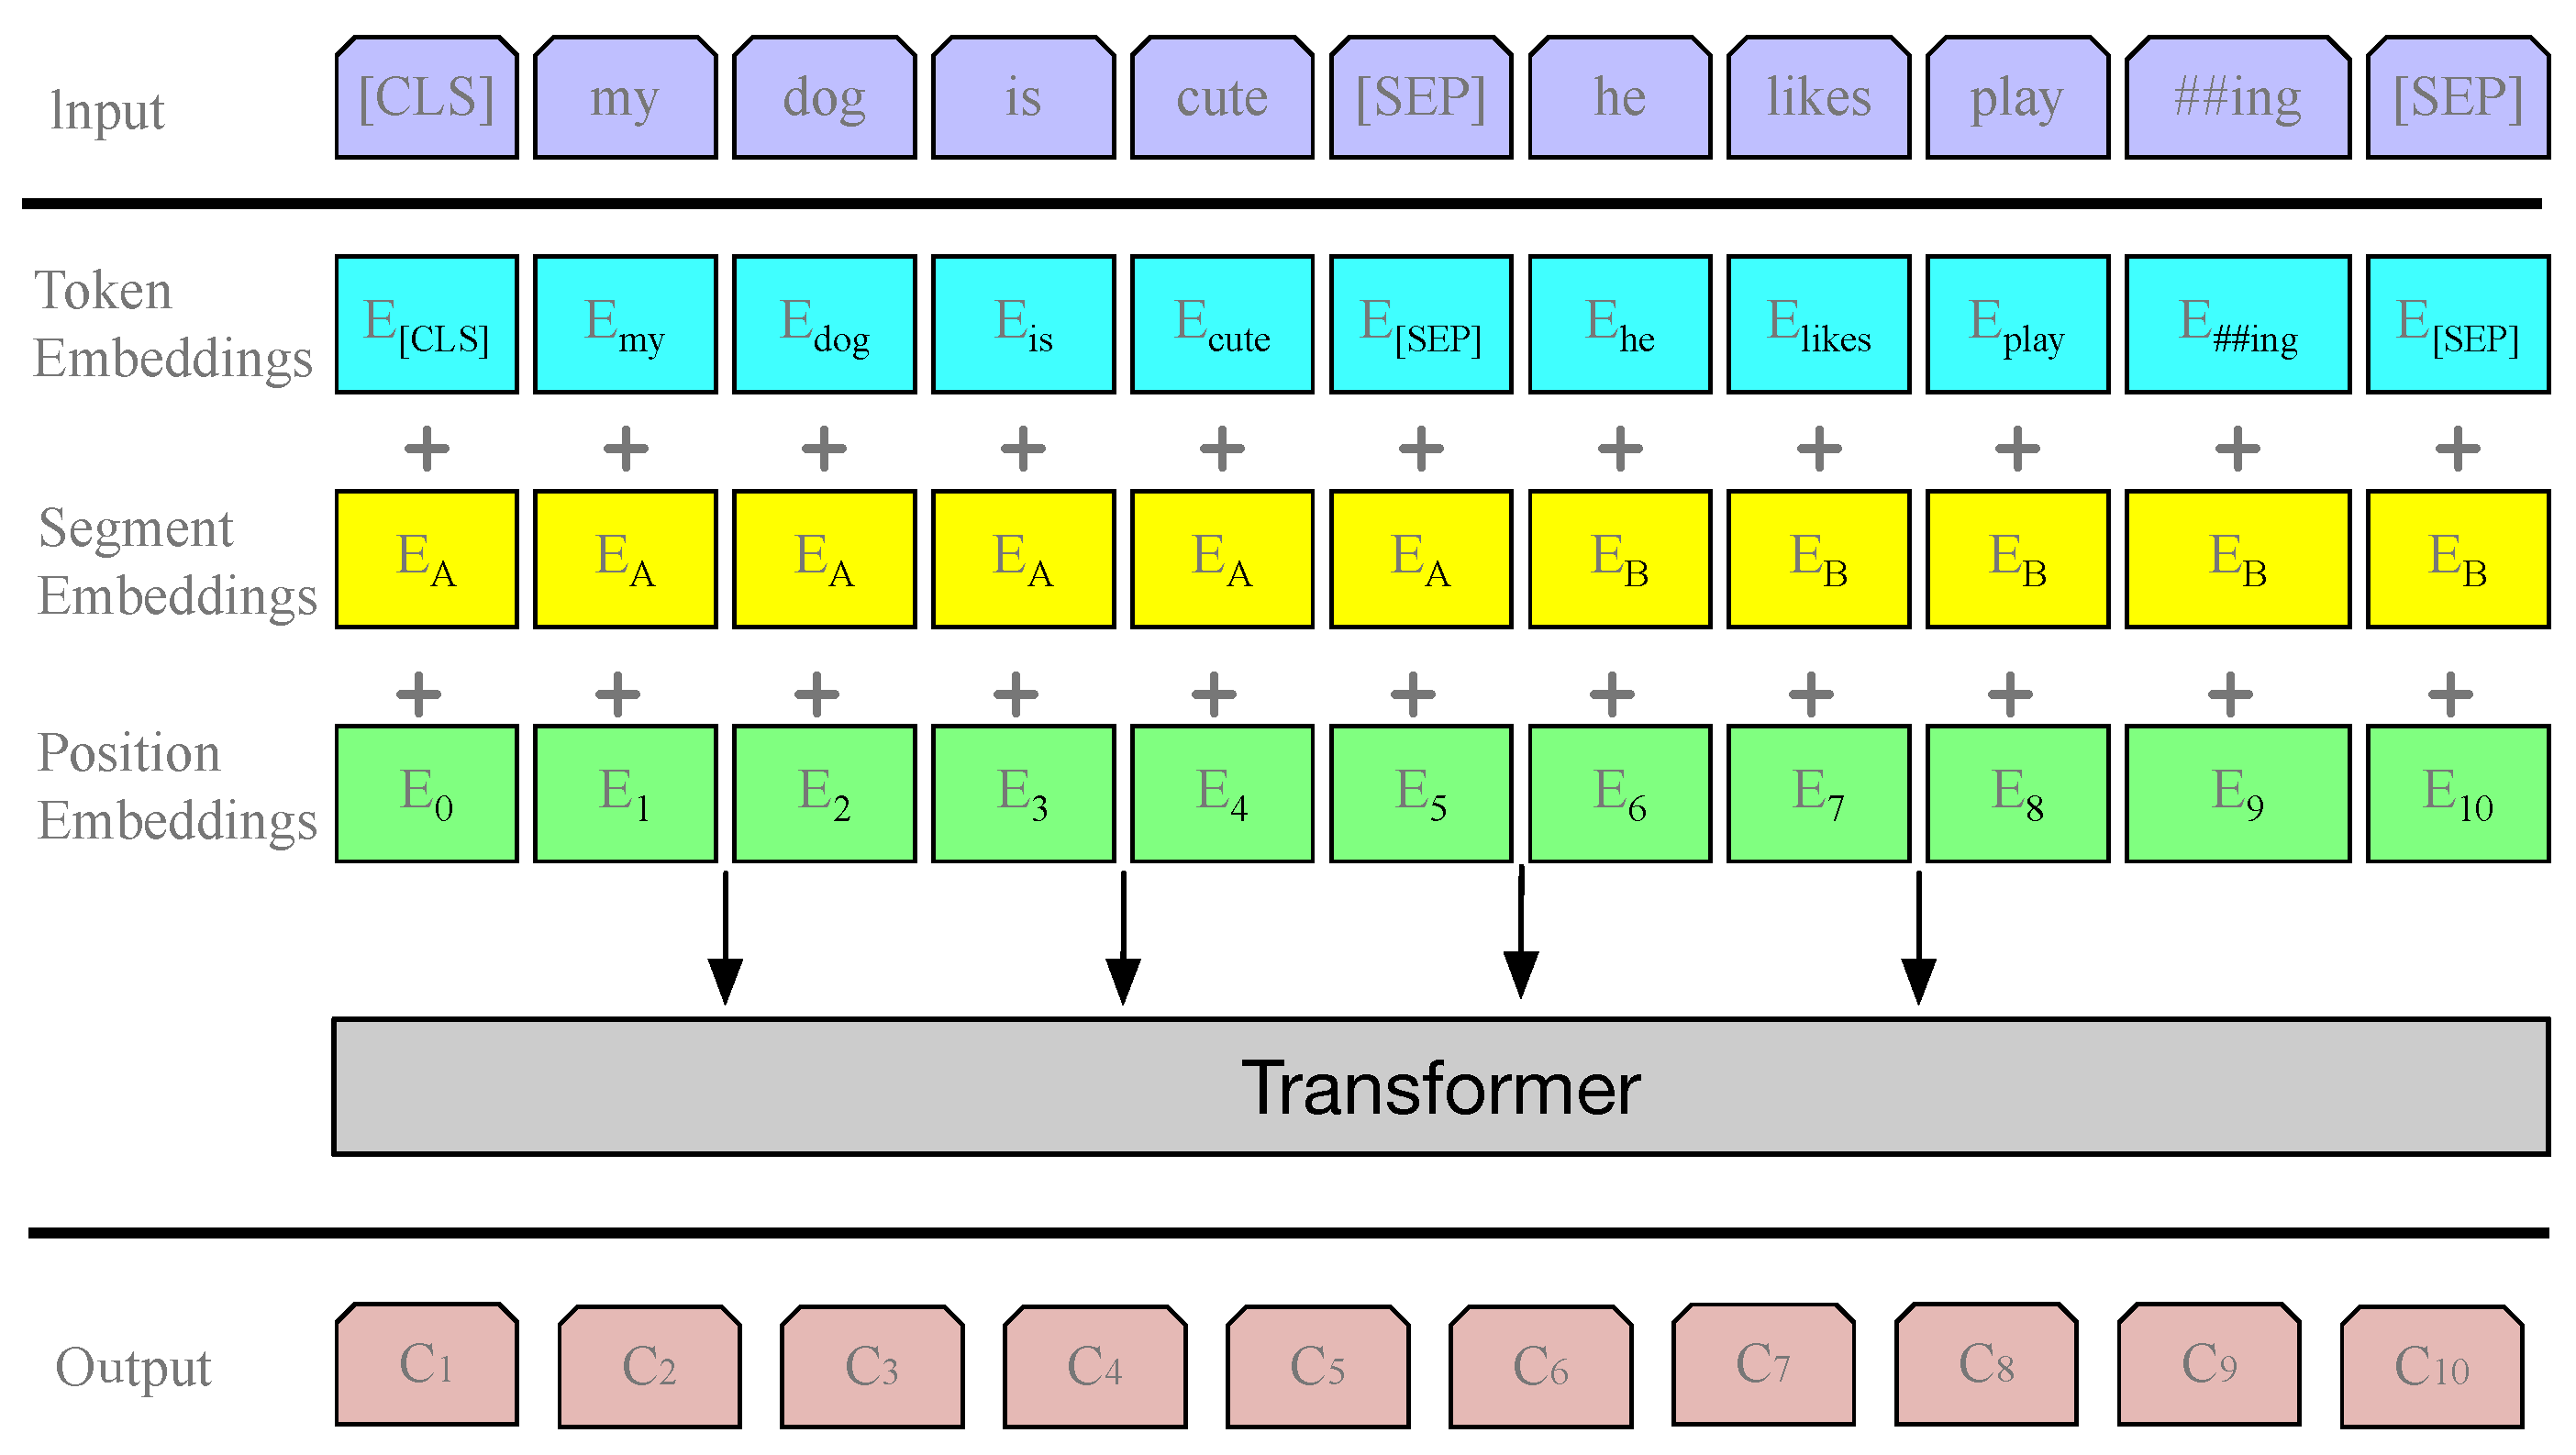
3.1. Textual Representation via BERT
3.2. TextGCN
3.3. Interpolating BERT and GCN Predictions
4. Experiments
4.1. Datasets
4.2. Baselines
4.3. Experimental Setup
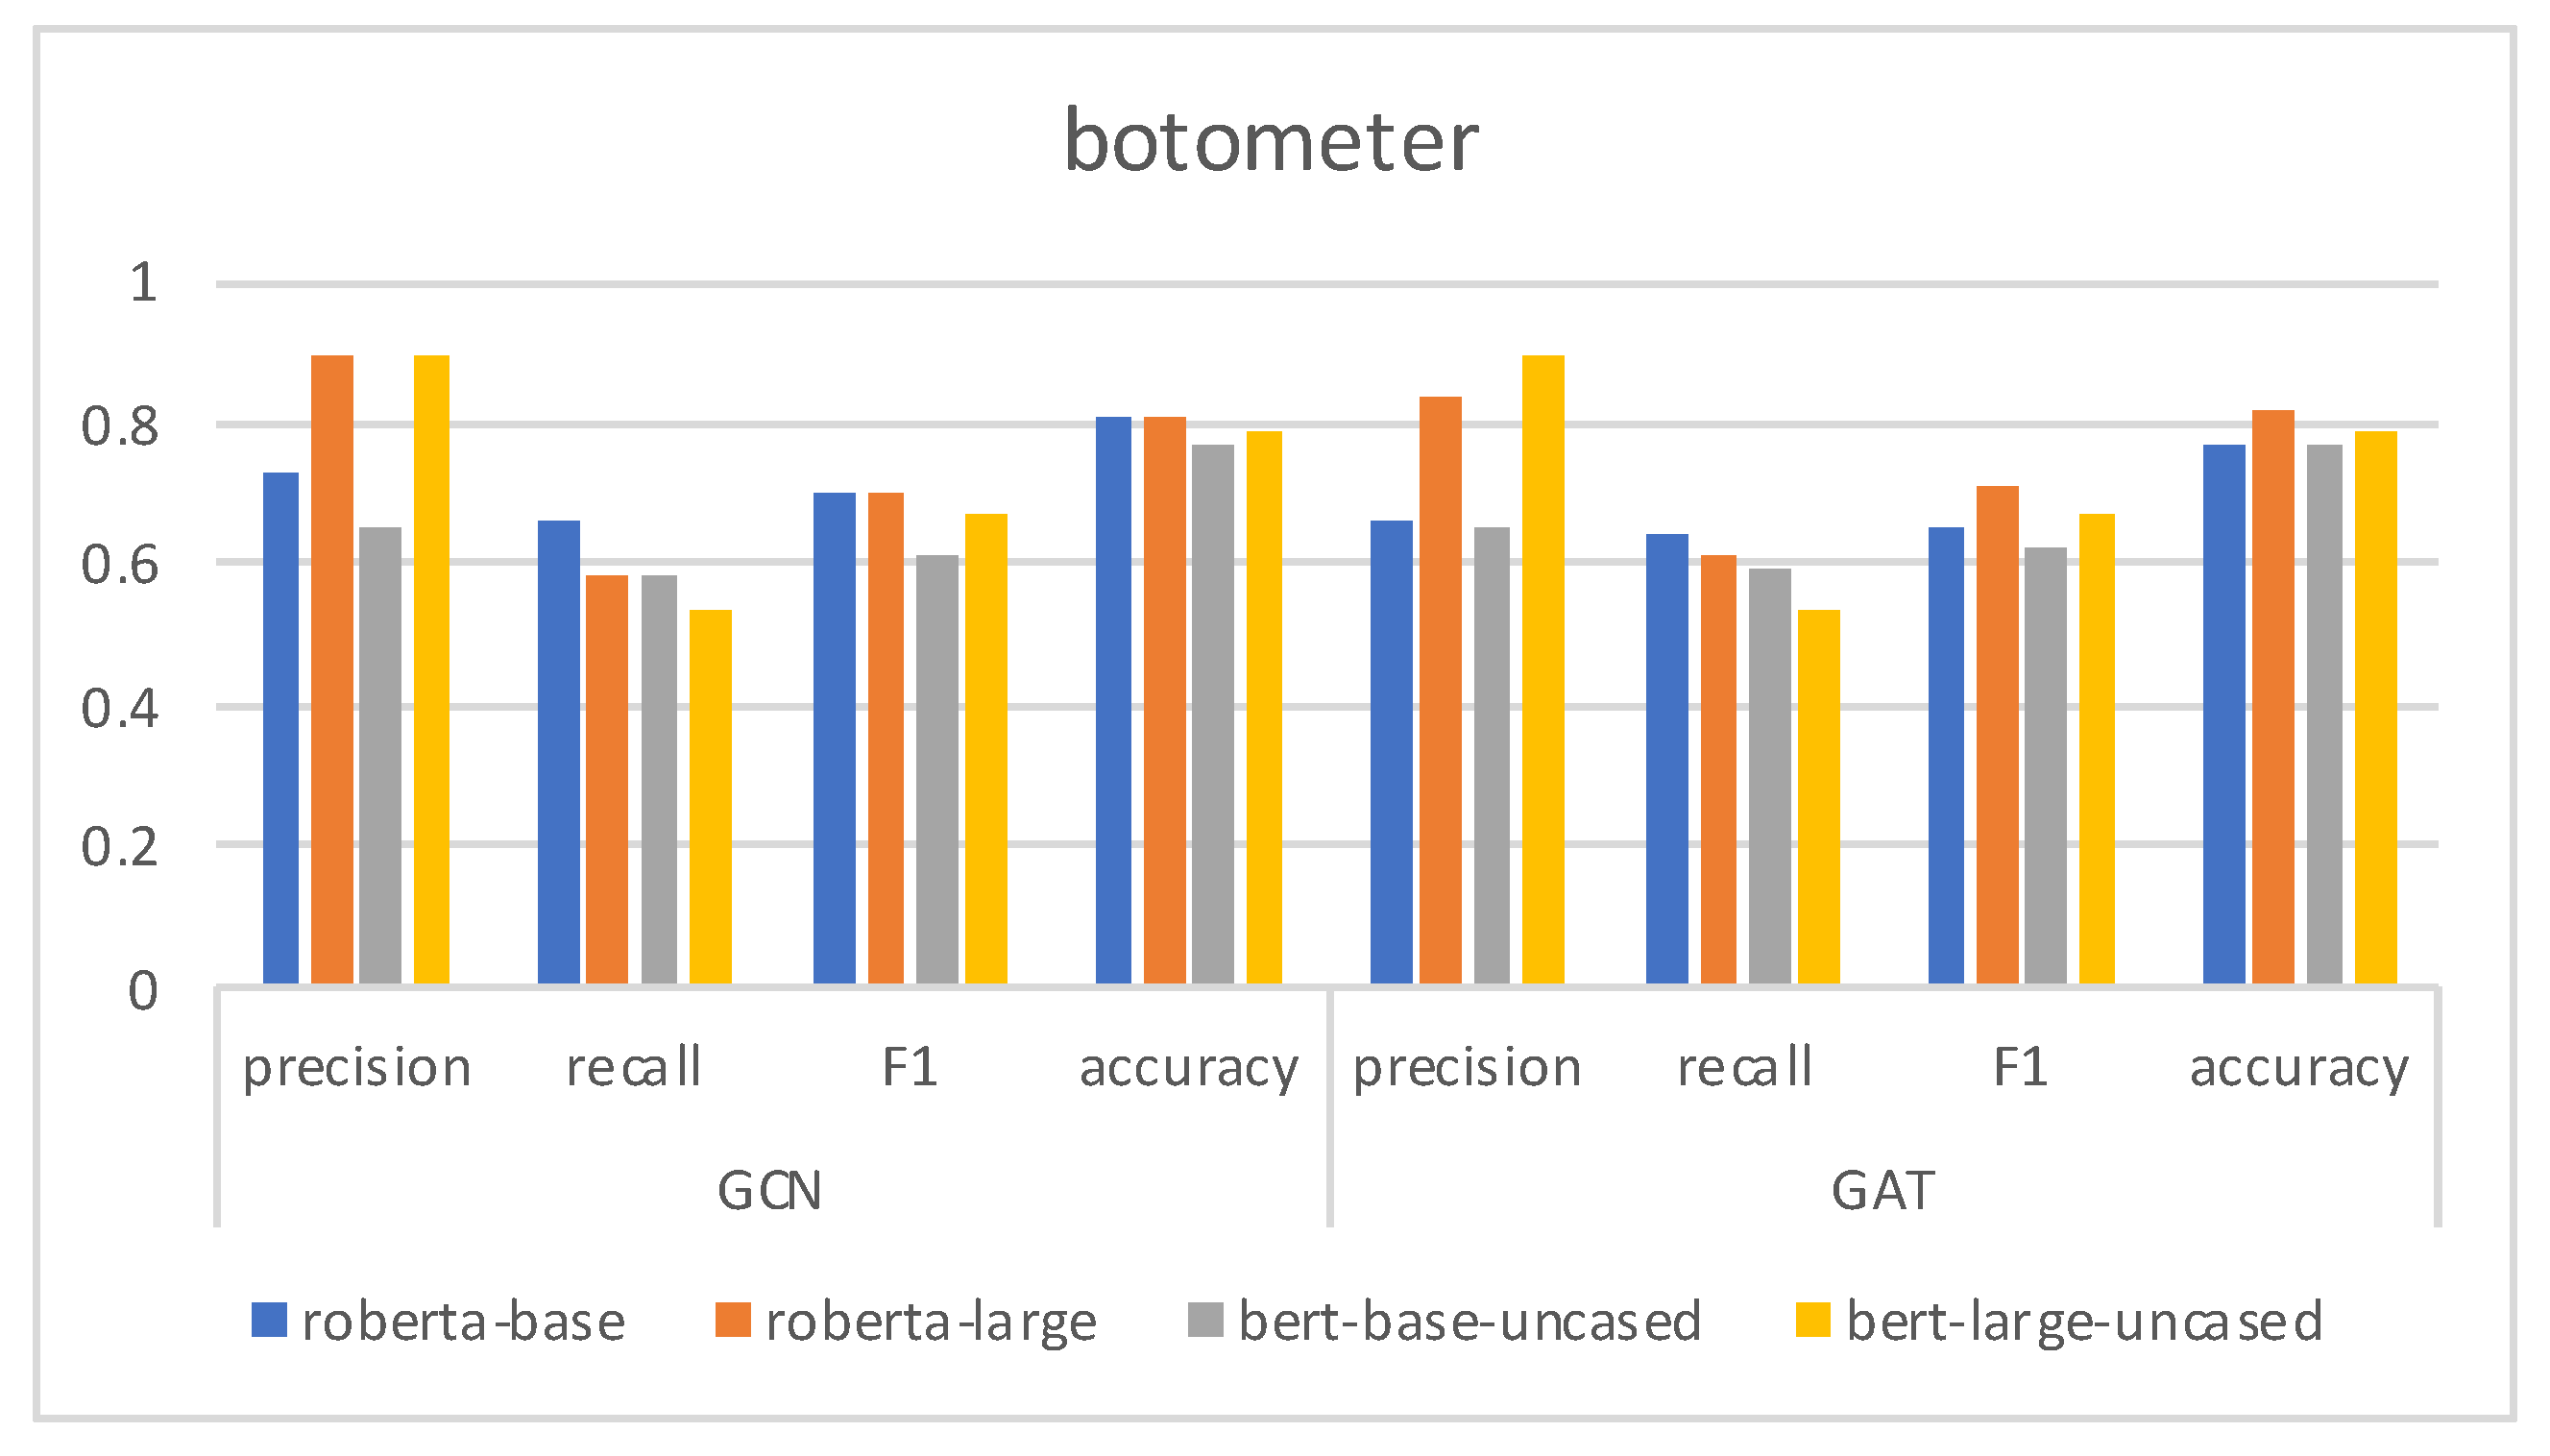
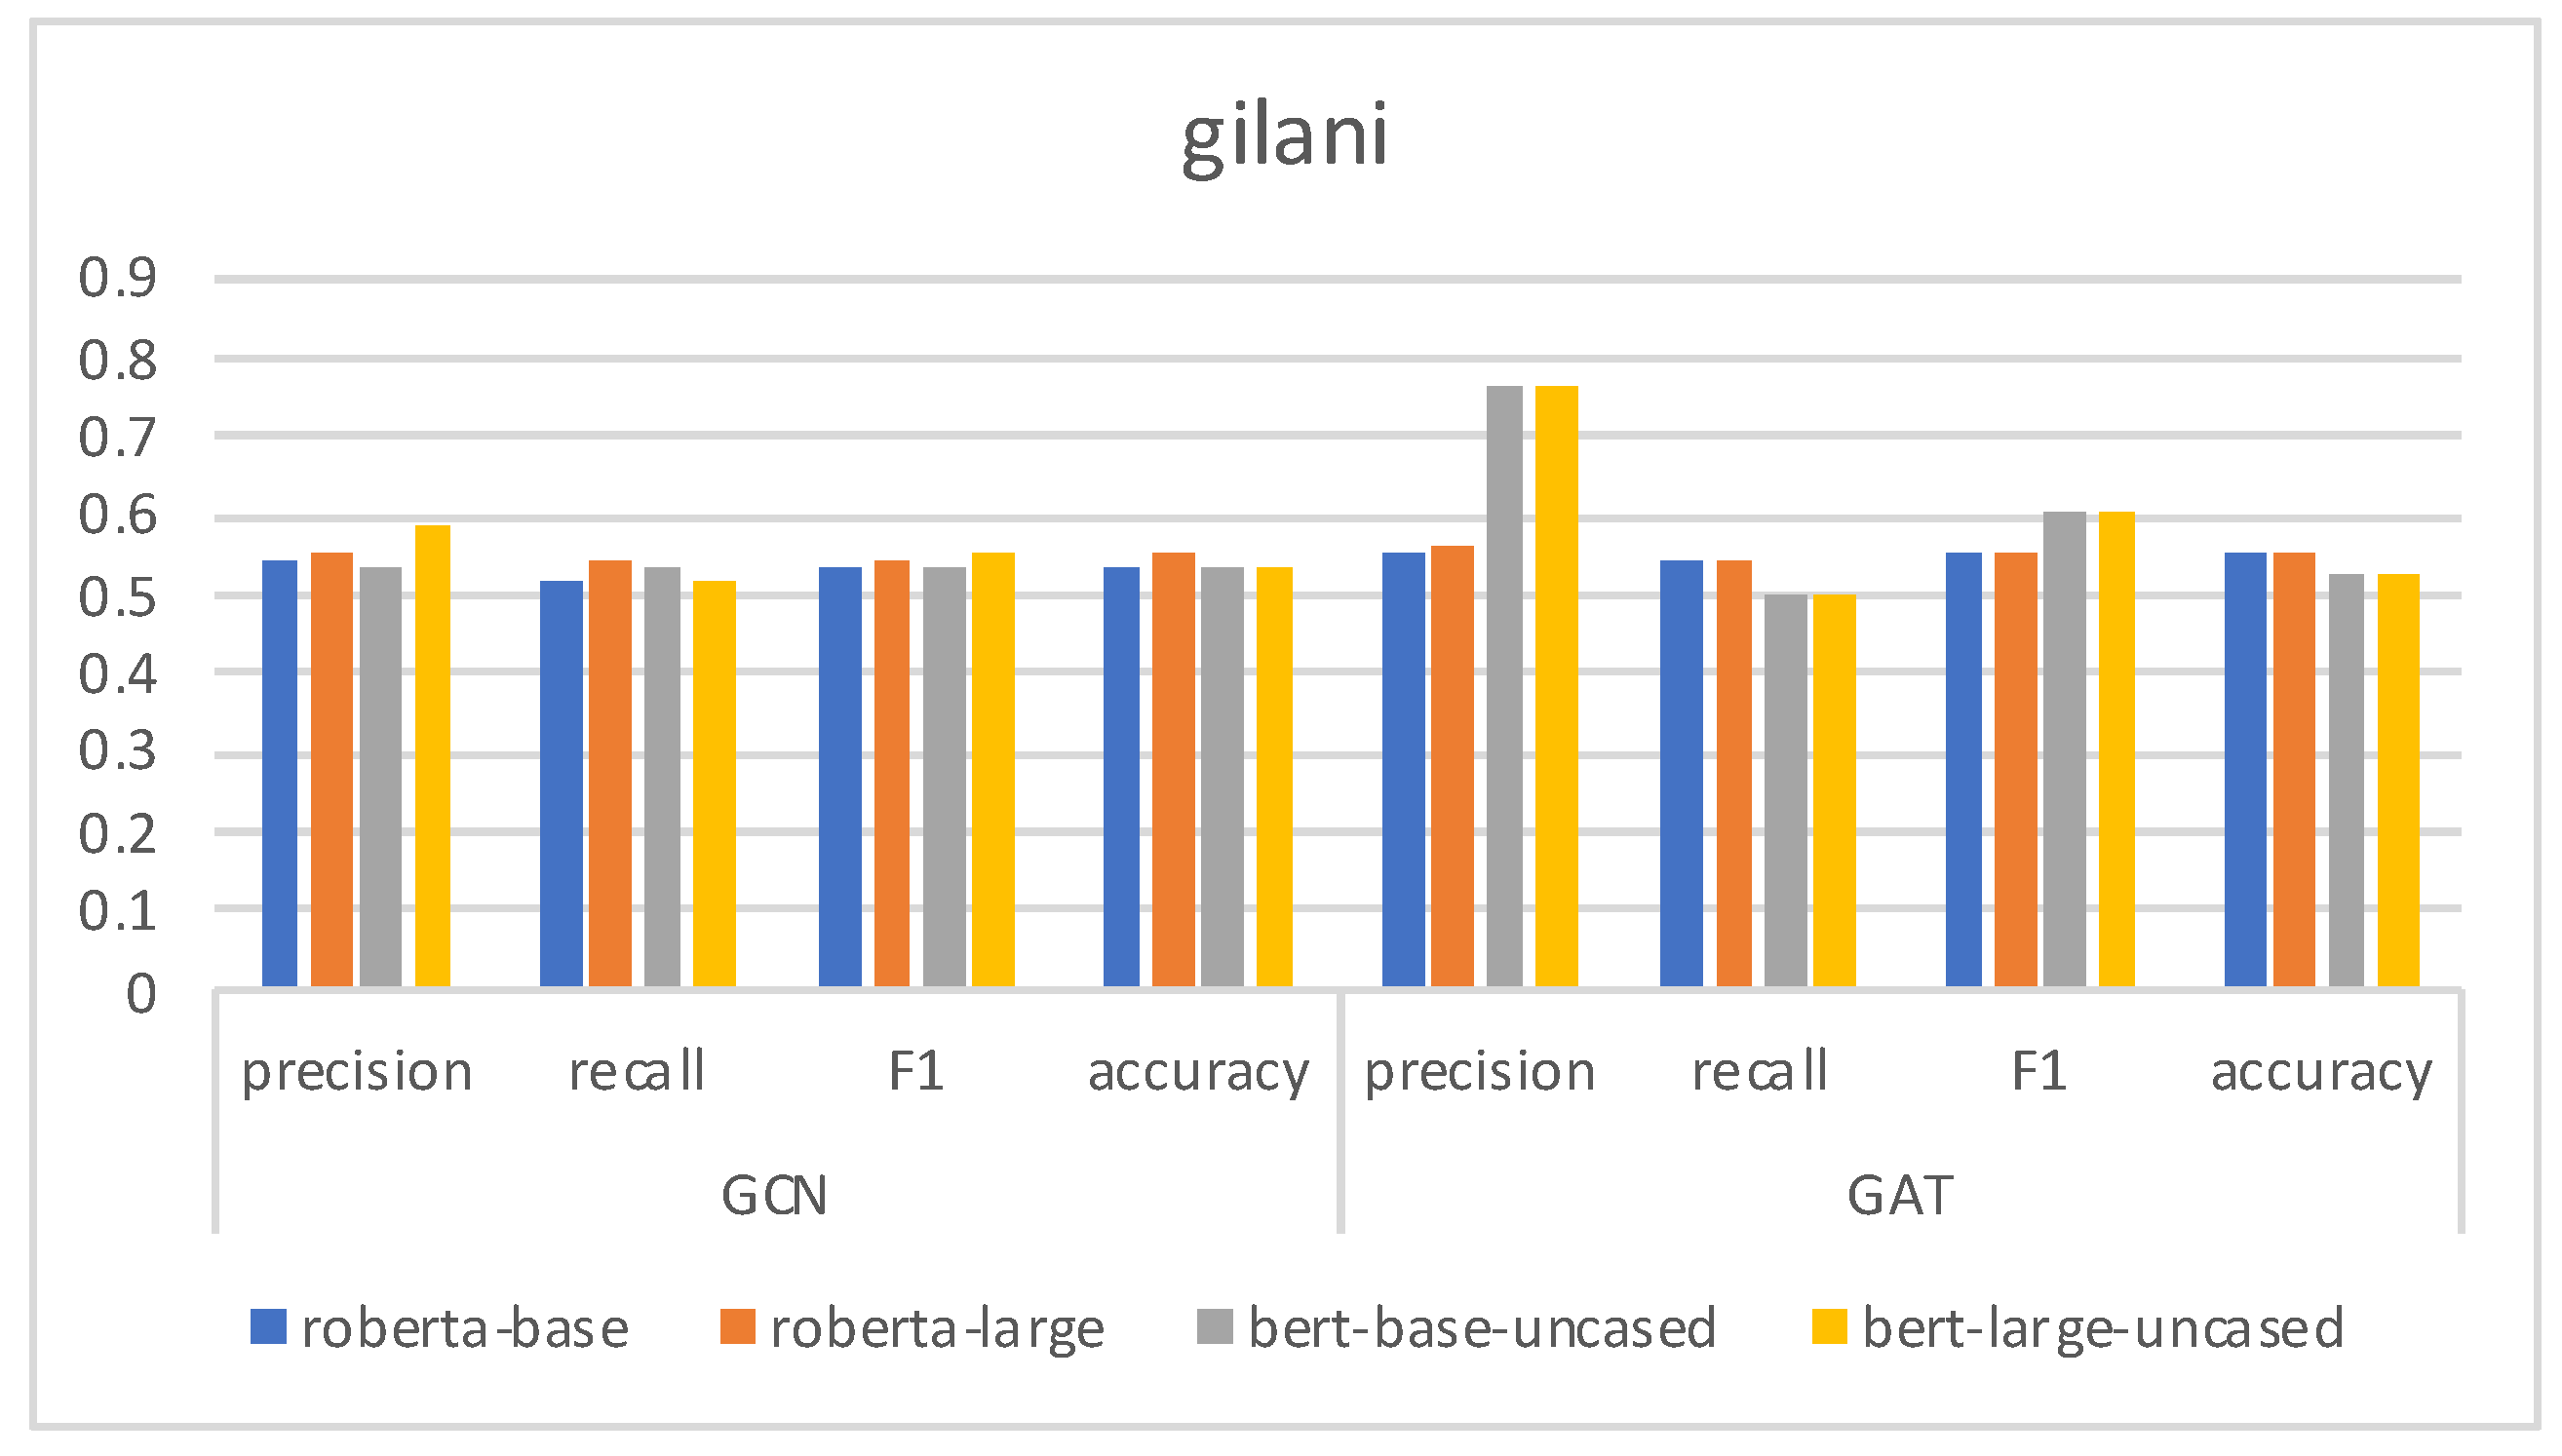
4.4. Results and Analysis
4.5. Ablation Study
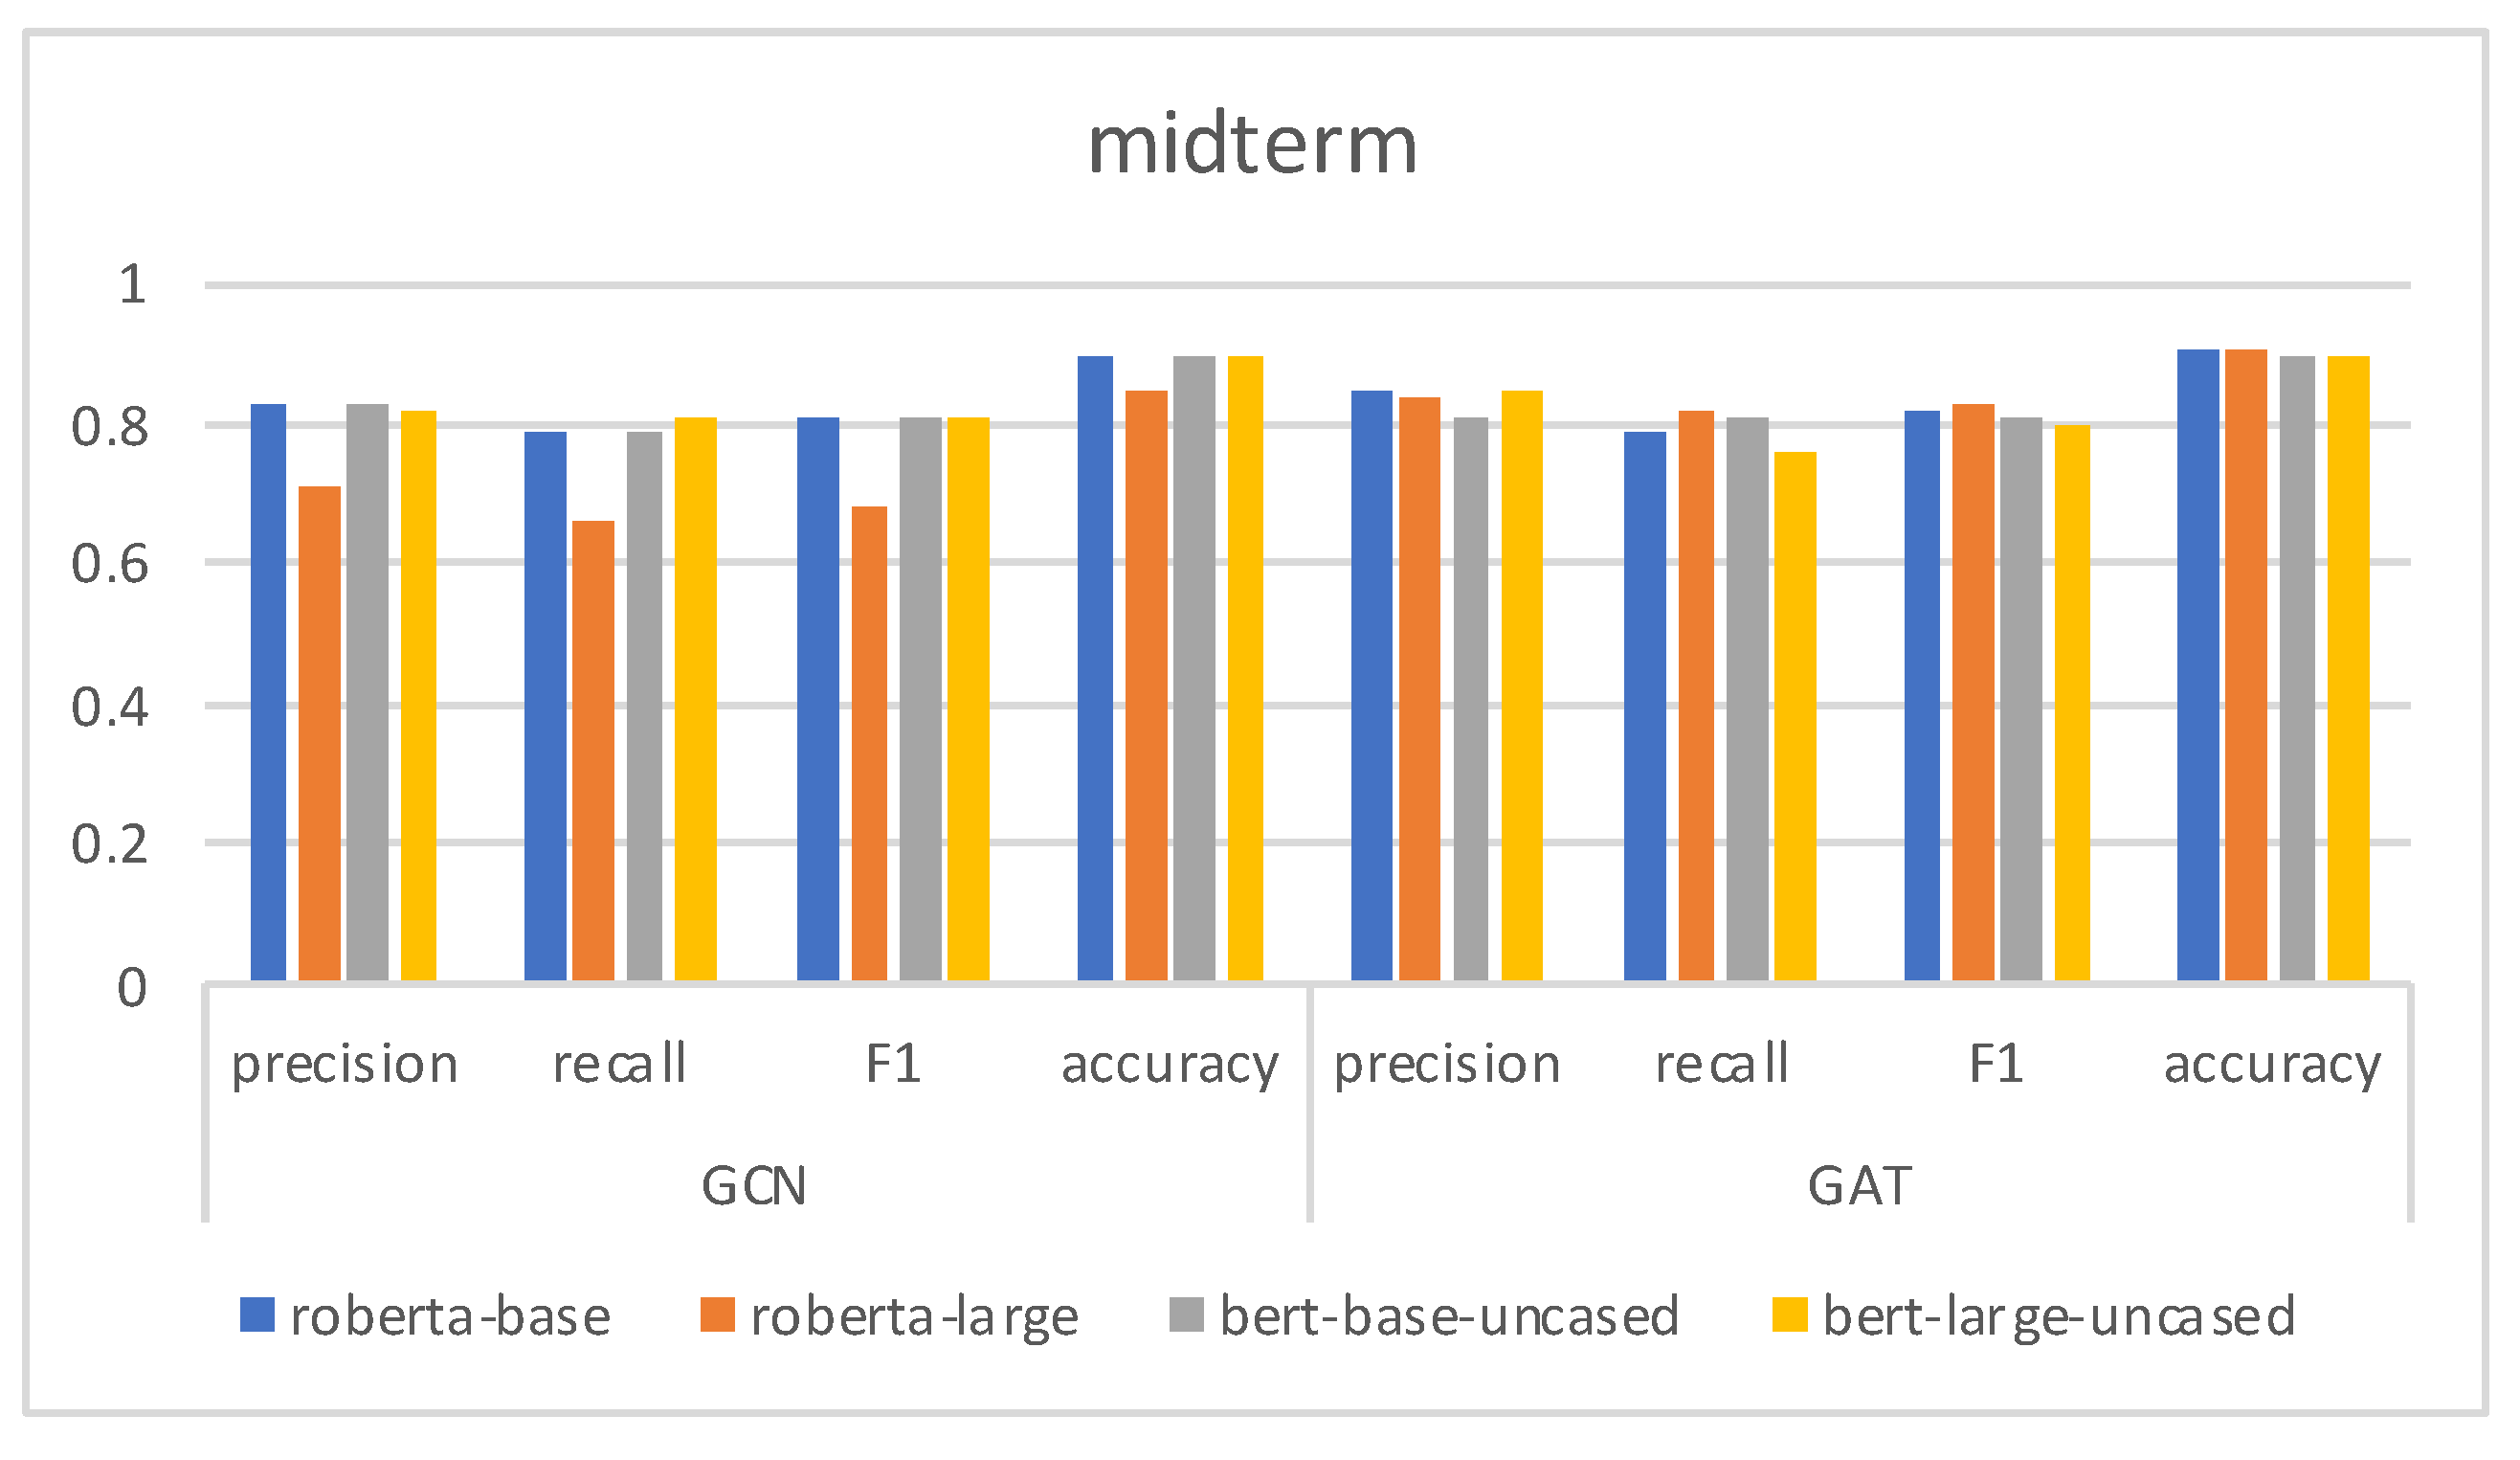
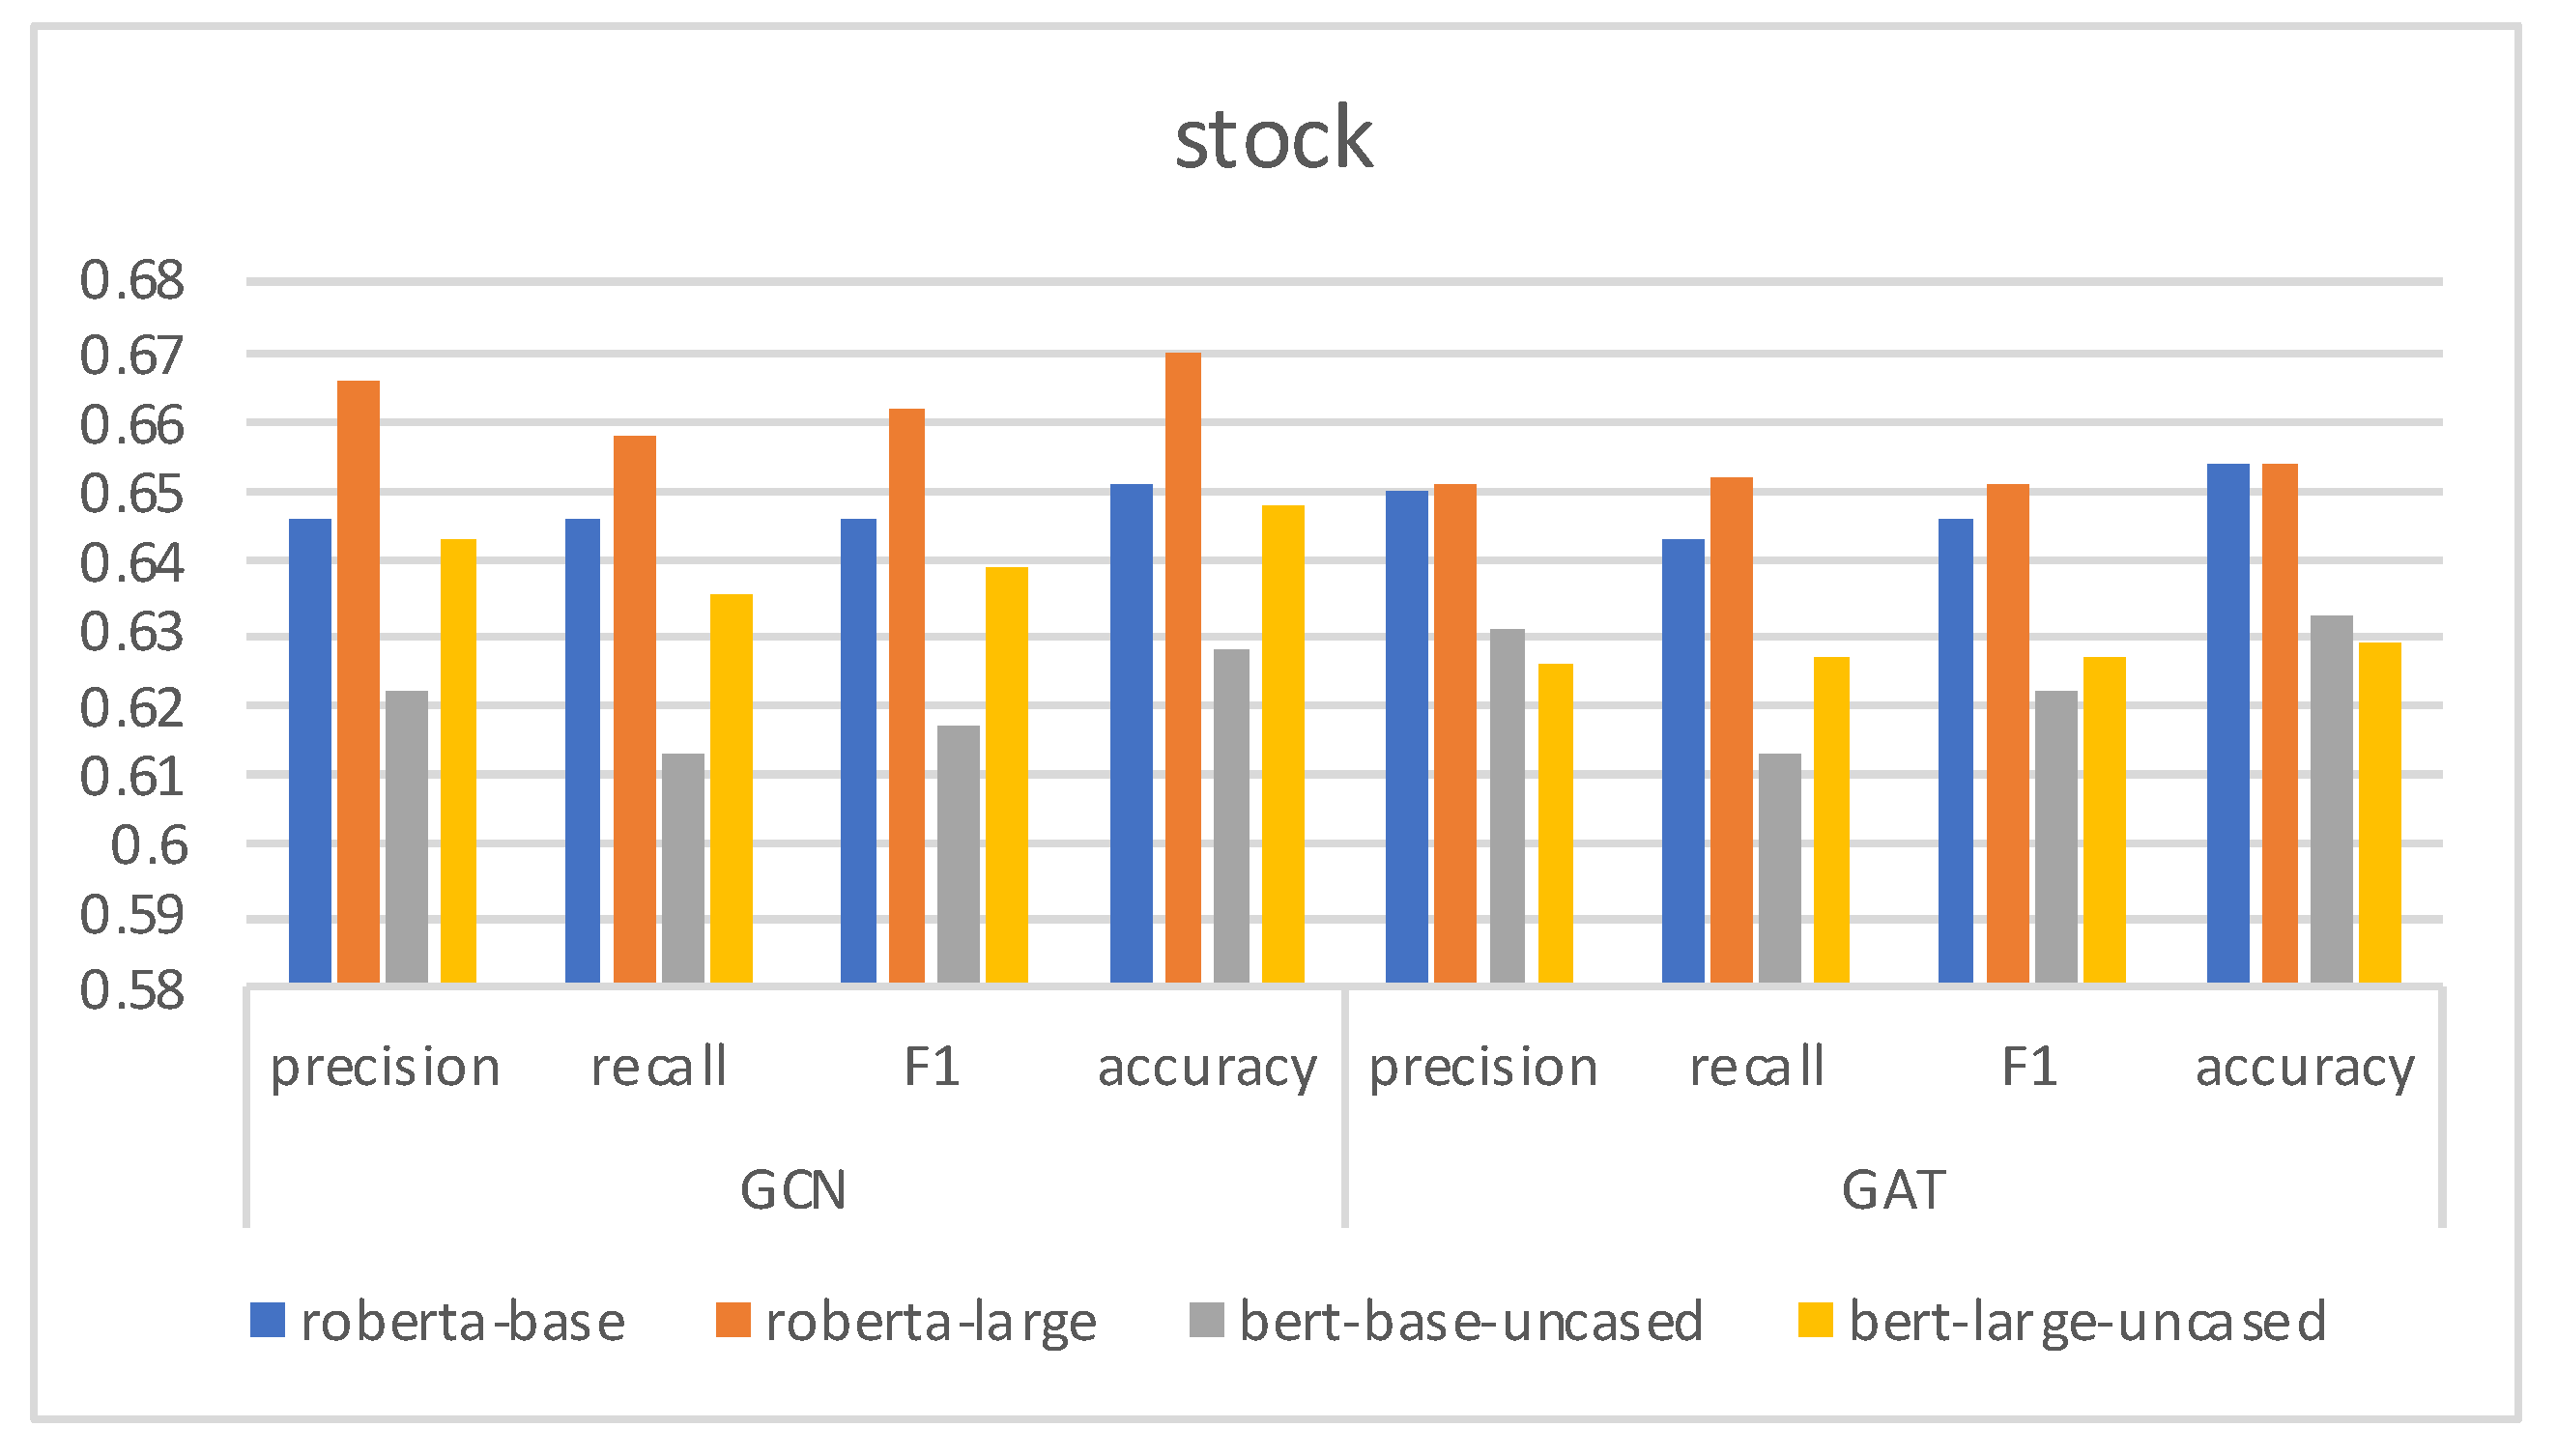
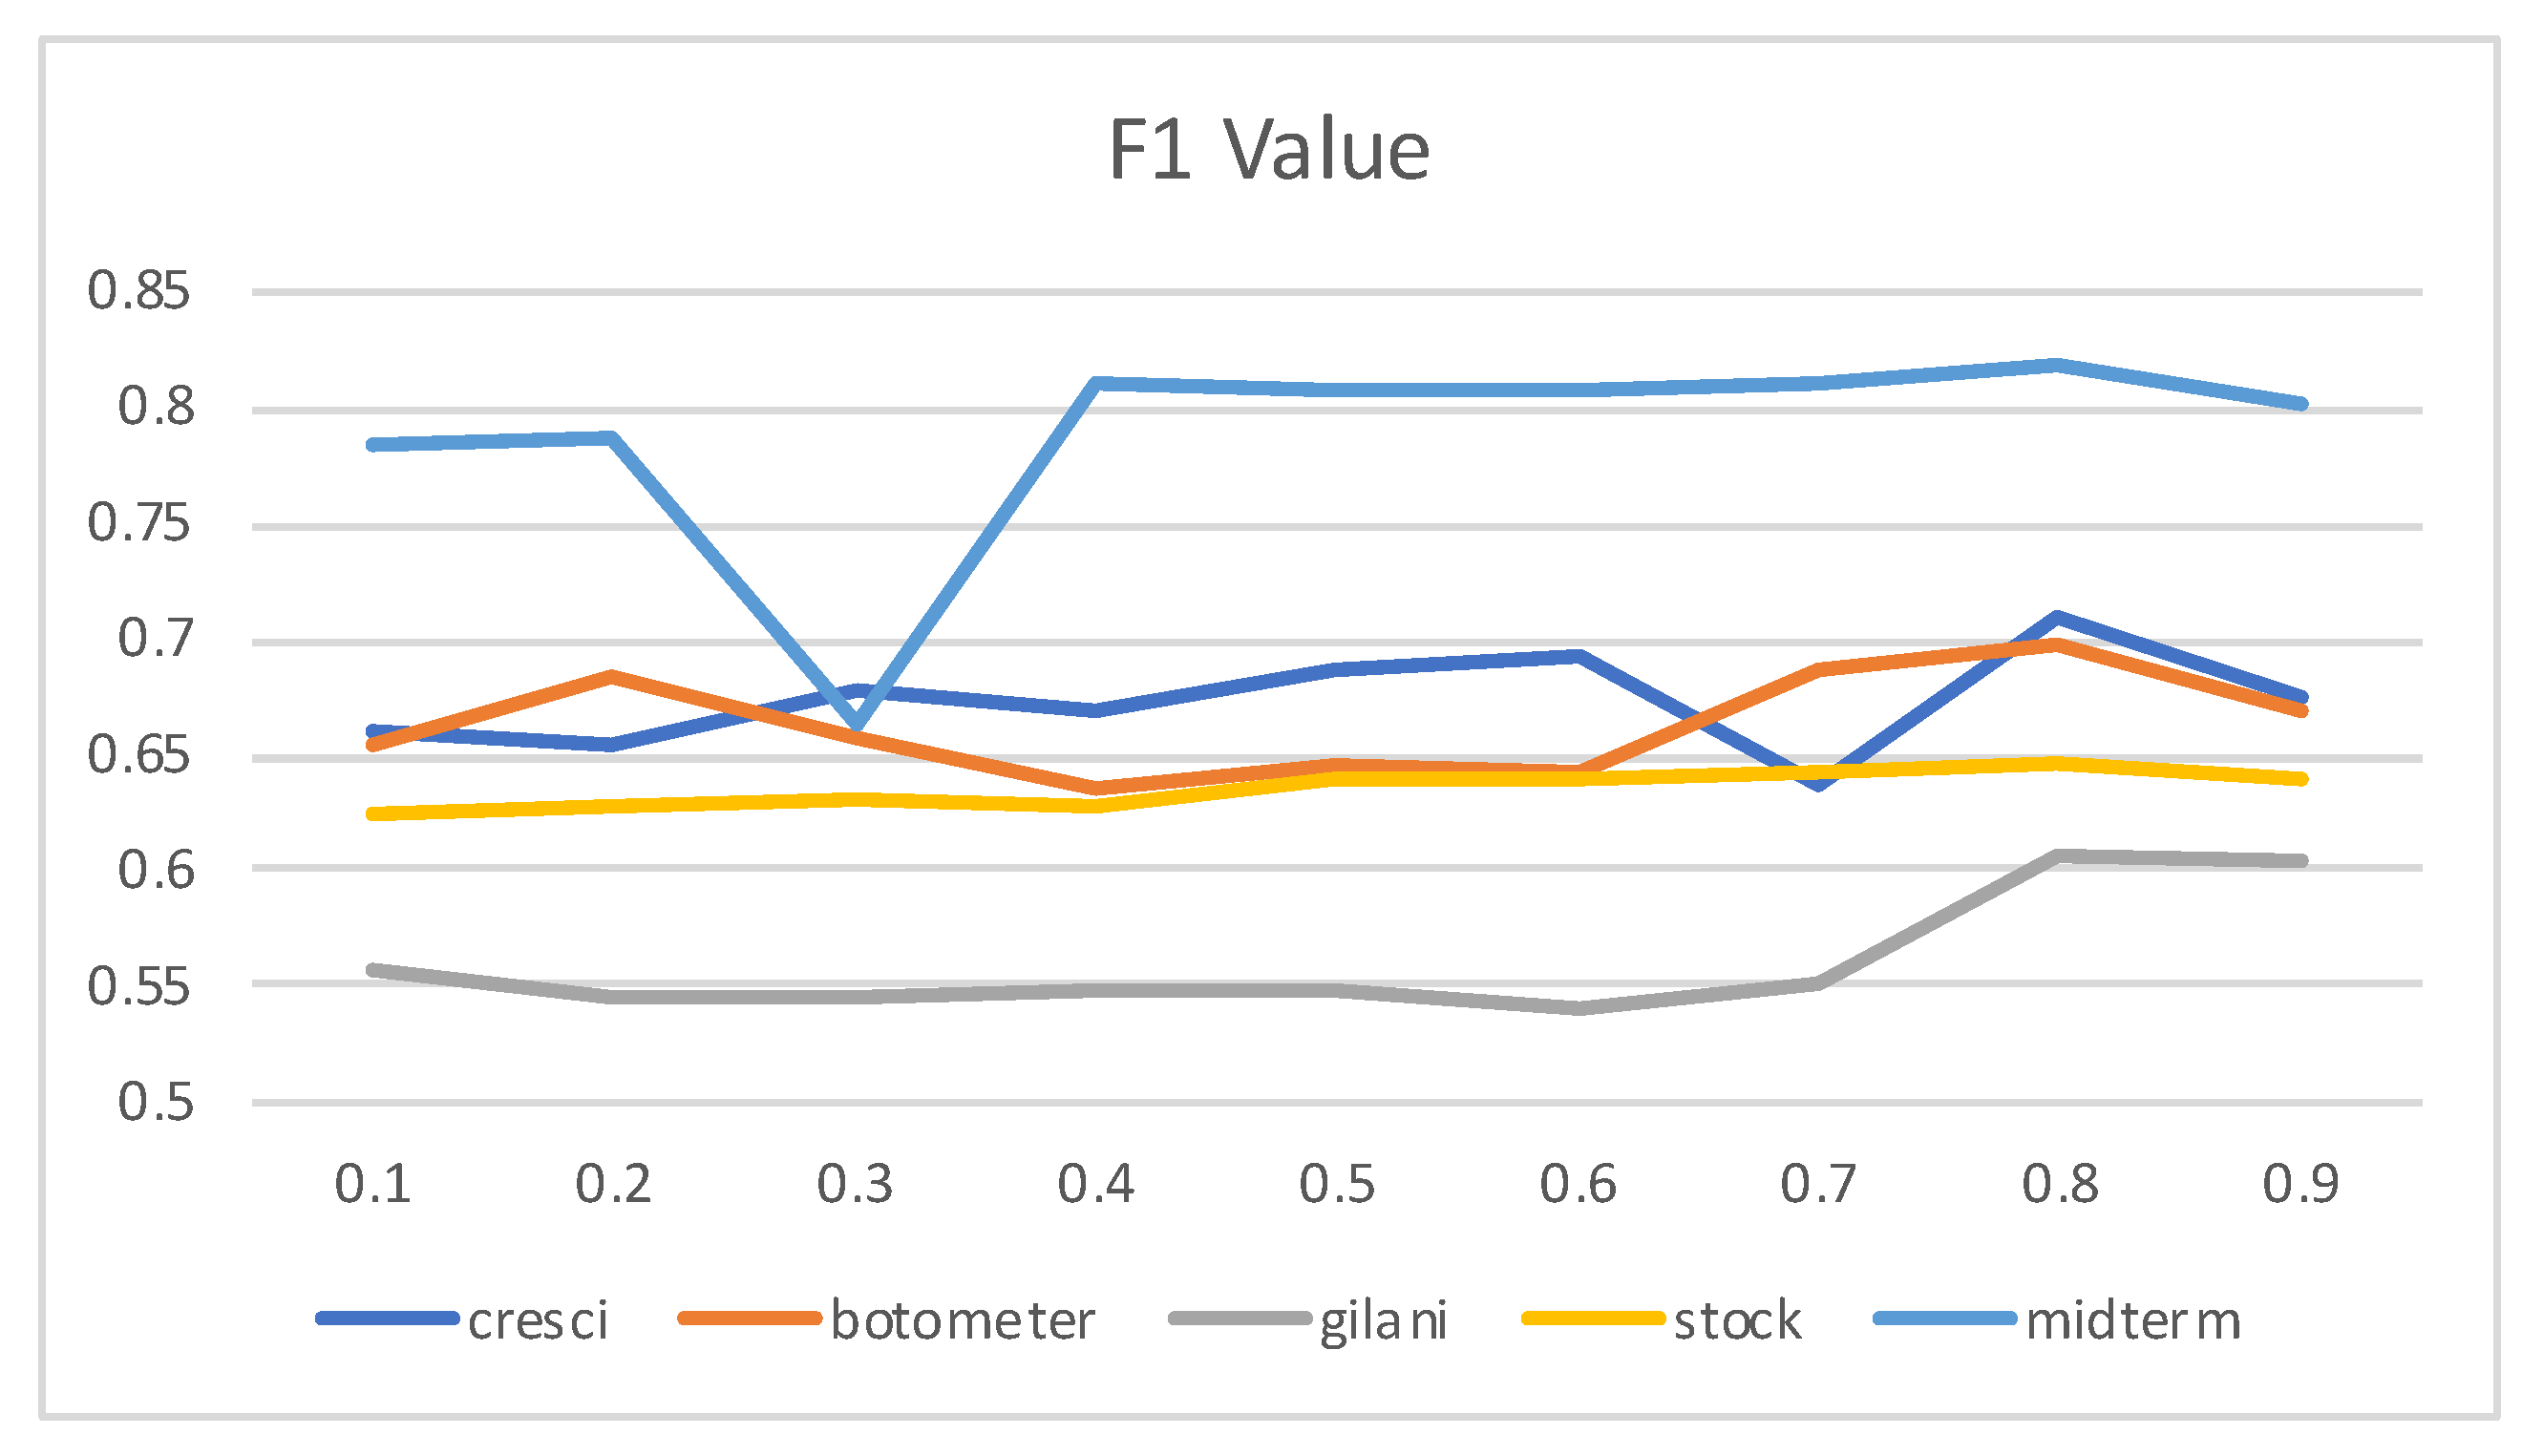
4.6. The Effect of
4.7. Discussion
5. Conclusions and Future Work
Author Contributions
Funding
Institutional Review Board Statement
Informed Consent Statement
Data Availability Statement
Acknowledgments
Conflicts of Interest
References
- Granik, M.; Mesyura, V. Fake news detection using naive Bayes classifier. In Proceedings of the 2017 IEEE first Ukraine Conference on Electrical and Computer Engineering (UKRCON), Kyiv, Ukraine, 29 May–2 June 2017; pp. 900–903. [Google Scholar]
- Cassa, C.A.; Chunara, R.; Mandl, K.; Brownstein, J.S. Twitter as a sentinel in emergency situations: Lessons from the Boston marathon explosions. PLoS Curr. 2013, 5. [Google Scholar] [CrossRef] [PubMed]
- Conover, M.D.; Ratkiewicz, J.; Francisco, M.; Gonçalves, B.; Menczer, F.; Flammini, A. Political polarization on twitter. In Proceedings of the Fifth International AAAI Conference on Weblogs and Social Media, Barcelona, Spain, 17–21 July 2011. [Google Scholar]
- Fu, Q.; Feng, B.; Guo, D.; Li, Q. Combating the evolving spammers in online social networks. Comput. Secur. 2018, 72, 60–73. [Google Scholar] [CrossRef]
- Pan, J.; Liu, Y.; Liu, X.; Hu, H. Discriminating bot accounts based solely on temporal features of microblog behavior. Phys. A Stat. Mech. Appl. 2016, 450, 193–204. [Google Scholar] [CrossRef]
- Chen, H.; Liu, J.; Lv, Y.; Li, M.H.; Liu, M.; Zheng, Q. Semi-supervised clue fusion for spammer detection in Sina Weibo. Inf. Fusion 2018, 44, 22–32. [Google Scholar] [CrossRef]
- Wu, F.; Shu, J.; Huang, Y.; Yuan, Z. Co-detecting social spammers and spam messages in microblogging via exploiting social contexts. Neurocomputing 2016, 201, 51–65. [Google Scholar] [CrossRef]
- Zheng, X.; Zhang, X.; Yu, Y.; Kechadi, T.; Rong, C. ELM-based spammer detection in social networks. J. Supercomput. 2016, 72, 2991–3005. [Google Scholar] [CrossRef]
- Fu, H.; Xie, X.; Rui, Y. Leveraging careful microblog users for spammer detection. In Proceedings of the 24th International Conference on World Wide Web, Florence, Italy, 18–22 May 2015; pp. 419–429. [Google Scholar]
- Ferrara, E.; Varol, O.; Davis, C.; Menczer, F.; Flammini, A. The rise of social bots. Commun. ACM 2016, 59, 96–104. [Google Scholar] [CrossRef] [Green Version]
- Wang, G.A.; Mohanlal, M.; Wilson, C.; Wang, X.; Metzger, M.; Zheng, H.; Zhao, B.Y. Social Turing Tests: Crowdsourcing Sybil Detection. In Proceedings of the NDSS Symposium 2013, San Diego, CA, USA, 24–27 February 2013. [Google Scholar]
- Twitter Inc. Q1 2019 Letter to Shareholders; Twitter Inc.: San Francisco, CA, USA, 2019. [Google Scholar]
- Ahmad, J.; Farman, H.; Jan, Z. Deep learning methods and applications. In Deep Learning: Convergence to Big Data Analytics; Springer: New York, NY, USA, 2019; pp. 31–42. [Google Scholar]
- Song, H.A.; Lee, S.Y. Hierarchical representation using NMF. In International Conference on Neural Information Processing; Springer: New York, NY, USA, 2013; pp. 466–473. [Google Scholar]
- Hochreiter, S.; Schmidhuber, J. Long short-term memory. Neural Comput. 1997, 9, 1735–1780. [Google Scholar] [CrossRef] [PubMed]
- Ping, H.; Qin, S. A social bots detection model based on deep learning algorithm. In Proceedings of the 2018 IEEE 18th International Conference on Communication Technology (ICCT), Chongqing, China, 8–11 October 2018; pp. 1435–1439. [Google Scholar]
- Kudugunta, S.; Ferrara, E. Deep neural networks for bot detection. Inf. Sci. 2018, 467, 312–322. [Google Scholar] [CrossRef] [Green Version]
- Wei, F.; Nguyen, U.T. Twitter bot detection using bidirectional long short-term memory neural networks and word embeddings. In Proceedings of the 2019 First IEEE International Conference on Trust, Privacy and Security in Intelligent Systems and Applications (TPS-ISA), Los Angeles, CA, USA, 12–14 December 2019; pp. 101–109. [Google Scholar]
- Abou Daya, A.; Salahuddin, M.A.; Limam, N.; Boutaba, R. A graph-based machine learning approach for bot detection. In Proceedings of the 2019 IFIP/IEEE Symposium on Integrated Network and Service Management (IM), Arlington, VA, USA, 8–12 April 2019; pp. 144–152. [Google Scholar]
- Abou Daya, A.; Salahuddin, M.A.; Limam, N.; Boutaba, R. Botchase: Graph-based bot detection using machine learning. IEEE Trans. Netw. Serv. Manag. 2020, 17, 15–29. [Google Scholar] [CrossRef] [Green Version]
- Cao, Q.; Sirivianos, M.; Yang, X.; Pregueiro, T. Aiding the detection of fake accounts in large scale social online services. In Proceedings of the 9th USENIX Symposium on Networked Systems Design and Implementation (NSDI 12), San Jose, CA, USA, 25–27 April 2012; pp. 197–210. [Google Scholar]
- Jia, J.; Wang, B.; Gong, N.Z. Random walk based fake account detection in online social networks. In Proceedings of the 2017 47th Annual IEEE/IFIP International Conference on Dependable Systems and Networks (DSN), Denver, CO, USA, 26–29 June 2017; pp. 273–284. [Google Scholar]
- Wang, B.; Gong, N.Z.; Fu, H. GANG: Detecting fraudulent users in online social networks via guilt-by-association on directed graphs. In Proceedings of the 2017 IEEE International Conference on Data Mining (ICDM), New Orleans, LA, USA, 18–21 November 2017; pp. 465–474. [Google Scholar]
- Wang, B.; Jia, J.; Zhang, L.; Gong, N.Z. Structure-based sybil detection in social networks via local rule-based propagation. IEEE Trans. Netw. Sci. Eng. 2018, 6, 523–537. [Google Scholar] [CrossRef] [Green Version]
- Gao, P.; Wang, B.; Gong, N.Z.; Kulkarni, S.R.; Thomas, K.; Mittal, P. Sybilfuse: Combining local attributes with global structure to perform robust sybil detection. In Proceedings of the 2018 IEEE Conference on Communications and Network Security (CNS), Beijing, China, 30 May–1 June 2018; pp. 1–9. [Google Scholar]
- Devlin, J.; Chang, M.W.; Lee, K.; Toutanova, K. Bert: Pre-training of deep bidirectional transformers for language understanding. arXiv 2018, arXiv:1810.04805. [Google Scholar]
- Kipf, T.N.; Welling, M. Semi-supervised classification with graph convolutional networks. arXiv 2016, arXiv:1609.02907. [Google Scholar]
- Yao, L.; Mao, C.; Luo, Y. Graph convolutional networks for text classification. In Proceedings of the AAAI Conference on Artificial Intelligence, Hilton Hawalian Village, Honolulu, HI, USA, 27 January–1 February 2019; Volume 33, pp. 7370–7377. [Google Scholar]
- Li, Q.; Han, Z.; Wu, X.M. Deeper Insights Into Graph Convolutional Networks for Semi-Supervised Learning. In Proceedings of the AAAI, New Orleans, LA, USA, 2–7 February 2018. [Google Scholar]
- Mazza, M.; Cresci, S.; Avvenuti, M.; Quattrociocchi, W.; Tesconi, M. Rtbust: Exploiting temporal patterns for botnet detection on twitter. In Proceedings of the 10th ACM Conference on Web Science, Boston, MA, USA, 30 June–3 July 2019; pp. 183–192. [Google Scholar]
- Yang, K.C.; Varol, O.; Davis, C.A.; Ferrara, E.; Flammini, A.; Menczer, F. Arming the public with artificial intelligence to counter social bots. Hum. Behav. Emerg. Technol. 2019, 1, 48–61. [Google Scholar] [CrossRef] [Green Version]
- Gilani, Z.; Farahbakhsh, R.; Tyson, G.; Wang, L.; Crowcroft, J. Of bots and humans (on twitter). In Proceedings of the 2017 IEEE/ACM International Conference on Advances in Social Networks Analysis and Mining 2017, Sydney, Australia, 31 July–3 August 2017; pp. 349–354. [Google Scholar]
- Cresci, S.; Lillo, F.; Regoli, D.; Tardelli, S.; Tesconi, M. $FAKE: Evidence of spam and bot activity in stock microblogs on Twitter. In Proceedings of the Twelfth International AAAI Conference on Web and Social Media, New Orleans, LA, USA, 25–28 June 2018. [Google Scholar]
- Cresci, S.; Lillo, F.; Regoli, D.; Tardelli, S.; Tesconi, M. Cashtag piggybacking: Uncovering spam and bot activity in stock microblogs on Twitter. ACM Trans. Web (TWEB) 2019, 13, 1–27. [Google Scholar] [CrossRef]
- Yang, K.C.; Varol, O.; Hui, P.M.; Menczer, F. Scalable and generalizable social bot detection through data selection. In Proceedings of the AAAI Conference on Artificial Intelligence, New York, NY, USA, 7–12 February 2020; Volume 34, pp. 1096–1103. [Google Scholar]
- Gilani, Z.; Wang, L.; Crowcroft, J.; Almeida, M.; Farahbakhsh, R. Stweeler: A framework for twitter bot analysis. In Proceedings of the 25th International Conference Companion on World Wide Web, Montreal, QC, Canada, 11–15 April 2016; pp. 37–38. [Google Scholar]
- Antenore, M.; Camacho-Rodriguez, J.M.; Panizzi, E. A comparative study of Bot Detection techniques methods with an application related to COVID-19 discourse on Twitter. arXiv 2021, arXiv:2102.01148. [Google Scholar]
- Veličković, P.; Cucurull, G.; Casanova, A.; Romero, A.; Lio, P.; Bengio, Y. Graph attention networks. arXiv 2017, arXiv:1710.10903. [Google Scholar]


| Dataset | Year | Machine Account | Normal Users |
|---|---|---|---|
| cresci-rtbust [30] | 2019 | 332 | 322 |
| botometer-feedback [31] | 2019 | 139 | 375 |
| gilani [32] | 2017 | 1090 | 1413 |
| cresci-stock-2018 [33,34] | 2019 | 6907 | 5992 |
| midterm [35] | 2018 | 41,395 | 7790 |
| Model | Precision | Recall | F1 | Accuracy |
|---|---|---|---|---|
| Botometer | 0.6951 | 0.3098 | 0.4286 | 0.5830 |
| HoloScope | 0.2857 | 0.0049 | 0.0096 | 0.4908 |
| Social fingerprinting | 0.6562 | 0.8978 | 0.7582 | 0.7114 |
| RTbust (handcrafted features) | 0.5284 | 0.7707 | 0.6270 | 0.5364 |
| RTbust (PCA) | 0.5111 | 0.9512 | 0.6649 | 0.5154 |
| BGSRD | 0.8842 | 0.5926 | 0.7096 | 0.78 |
| Model | Precision | Recall | F1 | Accuracy |
|---|---|---|---|---|
| Botometer-feedback [31] | 0.6951 | 0.3098 | 0.4286 | 0.5830 |
| BGSRD | 0.7336 | 0.6651 | 0.6977 | 0.8108 |
| Model | Precision | Recall | F1 | Accuracy |
|---|---|---|---|---|
| Light [37] | 0.681 | 0.172 | 0.274 | 0.615 |
| D [37] | 0.726 | 0.390 | 0.508 | 0.670 |
| Botometer [37] | 0.687 | 0.341 | 0.456 | 0.644 |
| BGSRD | 0.7621 | 0.5036 | 0.6065 | 0.5259 |
| Model | Precision | Recall | F1 | Accuracy |
|---|---|---|---|---|
| Light [37] | 0.548 | 0.285 | 0.375 | 0.495 |
| D [37] | 0.714 | 0.960 | 0.819 | 0.495 |
| Botometer [37] | 0.673 | 0.927 | 0.780 | 0.719 |
| Cresci-stock [33,34] | 0.5284 | 0.7707 | 0.6270 | 0.5364 |
| BGSRD | 0.666 | 0.6584 | 0.6622 | 0.6698 |
| Model | Precision | Recall | F1 | Accuracy |
|---|---|---|---|---|
| Light [37] | 0.099 | 0.794 | 0.176 | 0.964 |
| D [37] | 0.027 | 0.875 | 0.051 | 0.859 |
| Botometer [37] | 0.054 | 0.905 | 0.101 | 0.912 |
| BGSRD | 0.8304 | 0.7884 | 0.8089 | 0.9026 |
Publisher’s Note: MDPI stays neutral with regard to jurisdictional claims in published maps and institutional affiliations. |
© 2021 by the authors. Licensee MDPI, Basel, Switzerland. This article is an open access article distributed under the terms and conditions of the Creative Commons Attribution (CC BY) license (https://creativecommons.org/licenses/by/4.0/).
Share and Cite
Guo, Q.; Xie, H.; Li, Y.; Ma, W.; Zhang, C. Social Bots Detection via Fusing BERT and Graph Convolutional Networks. Symmetry 2022, 14, 30. https://doi.org/10.3390/sym14010030
Guo Q, Xie H, Li Y, Ma W, Zhang C. Social Bots Detection via Fusing BERT and Graph Convolutional Networks. Symmetry. 2022; 14(1):30. https://doi.org/10.3390/sym14010030
Chicago/Turabian StyleGuo, Qinglang, Haiyong Xie, Yangyang Li, Wen Ma, and Chao Zhang. 2022. "Social Bots Detection via Fusing BERT and Graph Convolutional Networks" Symmetry 14, no. 1: 30. https://doi.org/10.3390/sym14010030
APA StyleGuo, Q., Xie, H., Li, Y., Ma, W., & Zhang, C. (2022). Social Bots Detection via Fusing BERT and Graph Convolutional Networks. Symmetry, 14(1), 30. https://doi.org/10.3390/sym14010030