Article

The Use of a Game Theory Model to Explore the Emergence of Core/Periphery Structure in Networks and Its Symmetry

Department of Applied Mathematics and Informatics, Faculty of Economics, University of South Bohemia, 37005 Ceske Budejovice, Czech Republic
*
Author to whom correspondence should be addressed.
Symmetry 2021, 13(7), 1214; https://doi.org/10.3390/sym13071214
Submission received: 27 May 2021 / Revised: 1 July 2021 / Accepted: 3 July 2021 / Published: 6 July 2021
(This article belongs to the Special Issue Complex Systems and Its Applications)

Abstract

:
In network systems characterized by complex interactions of various types, core-periphery structures can be found. In this paper, we deal with such questions as what processes can lead to the emergence of core-periphery formation, whether this structure is symmetric, and to what extent. Namely, the question of symmetry in a complex network is still the subject of intense research interest. Symmetry can relate to network topology, network relationships, and other processes on networks. To answer these questions, we modified the model of the classic social dilemma called the repeated prisoner’s dilemma (or repeated PD game) by adding the cost of maintaining relationships between the pairs of players (partners) and especially by adding the possibility of ending some relationships. We present the results of simulations that suggest that the players’ network strategy (i.e., partner selection or termination of relationships with some partners) is the driving force behind the emergence of a core-periphery structure in networks rather than the player’s strategy in PD. Our results also suggest that the formed core is symmetric, and this symmetry is a result of the symmetric interactions of core players. Our outcomes can help understand various economic or social questions related to creating centers or peripheries, including their symmetry in different network systems.

1. Introduction

Systems consisting of different objects with many interconnections and interactions can be modeled using various network models. They provide insight into the structure, topology, interrelationships, and functions, including insight into relevant dynamic processes [1,2,3] and symmetry. Symmetry substantially affects functions and some characteristics of complex networks, e.g., robustness or vulnerability [4,5,6,7], and others. In real networks, the behavior of agents on networks (represented by nodes) and the dynamics of mutual interactions affect not only the results of processes taking place in these networks, but also their topology.

1.1. Related Works

In terms of topology, network models can be described using a combination of local, global, and intermediate (mesoscale) views. Most publications deal with local topological properties, such as node degrees, node centrality, clustering coefficient, and more. However, attention is also paid to mesoscale structures in networks. It is mainly research and the identification of community structures in networks. The community structure can be described as closely interconnected nodes in the same group, while different communities (groups) in a network are only loosely interlinked [8,9,10,11,12,13,14,15,16,17]. The analysis of communities in complex networks has found its place, for example, in the study of mobile telephone networks [18], biological networks [19], political sciences [20], and others [21,22], the end often in economics [23,24,25,26,27]. Another examined mesoscale structure is denoted as the core-periphery structure. This structure has a central and densely interconnected set of nodes forming the core. The periphery consists of nodes that are sparsely interconnected between themselves but have some links to the core [28]. It is possible to find more definitions of the core-periphery structure. However, all reports state that all core nodes tend to be “central” (e.g., in terms of the shortest paths), unlike peripheral nodes. Among the research papers dealing with the core-periphery structure, mention is made, for example, Holme [29] or Rombach et al. [30]. In their reports, these authors deal with the analysis and identification of the core-periphery structures. They present suggested methods on several real networks. Csermely et al. [28], in their extensive paper, describe in detail the concepts and definitions of basic core-periphery structures and their functions in different types of networks. The article of Tang et al. [31] focuses on the description of methods for the detection of core-periphery structures in networks. Alternative detection methods also can be found [32,33].
One of the fundamental questions of network science is what mechanisms lead to the emergence of some specific network structure—in our case, to the evolution of community structures or core-periphery structures. For example, Yang and Leskovec, in their paper [34], prove that the core-periphery form is a consequence of the development of overlapping communities. Gample et al. [35] describe the emergence of core-periphery structures as due to the dominance of some nodes in the network. Verma et al. [36] describe the development of a core-periphery system in airline networks. The model of the core-periphery structure in the presence of an intermediary is examined in [37]. Experiments with the participation of students are performed within the research of Sohn et al. [38] or Zhang et al. [39]. Their experiments suggest that the possibility of ending relationships influences the evolution of the core-periphery structure in social networks.
The basic topologic concept of symmetry in networks is based on automorphism. It is characterized by the invariance of the adjacency with the transformation operation on a set of nodes. Automorphism can be considered a permutation of graph nodes that preserve nodes’ adjacency [40]. This concept of symmetry in networks is discussed, for example, in [41,42,43,44,45,46,47,48,49,50,51]. The authors in [52] deal with social networks. They state that influential members (the elite) form the core, and other members create the periphery. The structure of the resulting social network is core-periphery. The authors state that there is a particular form of symmetry in a given social network. It means that the power of the periphery corresponds to the power of the elite. In other words, as society evolves, the “natural” division of the core-periphery maintains a balance between the two groups. Holding a central position (position in the core) allows the timely acquisition of various information and the possibility of influencing other entities in network systems [53,54]. Thus, in social networks, the core-periphery structure may characterize the unequal position of social network participants [55,56].
The authors in [54] point out that various complex networks have a rich degree of symmetry. For real networks, the origin of symmetry may have, for example, a similar bond pattern [56], which means that nodes with similar properties, such as a node degree, tend to form edges to nodes that have a similar degree. Additionally, for example, in evolutionary games on a network, experiments and calculations suggest the existence of symmetric relationships between nodes (players). Similarly, in a friendship network, it is generally believed that people with similar characteristics are likely to be friends with each other. In real networks, these symmetric interactions are also reflected in their topology [41].
Symmetry (or asymmetry) can therefore be observed in network systems from different perspectives. It may be a chosen local characteristic, such as an uneven distribution of the local degree [57]. For example, the author in [57] states that some agents benefit from many neighbors in core-peripheral networks, while other agents are associated with a small number of neighbors. More authors analyze the symmetry of the social network from the point of view of social relationships; see, for example, [52]. However, no authors addressed the issue of symmetry of the core-periphery structure.

1.2. Contribution

This paper focuses on understanding the emergence of the core-periphery structure and its properties with particular stress on symmetry. We suggest a simulation model for this purpose. We assume a dynamic network, where relationships among (nodes or players) can be characterized as cooperation or, conversely, as a defection. In our model, we use a schema of a repeated PD game. However, unlike the classic repeated PD game, in our model, each player can unilaterally terminate interaction with a partner according to their own will (this strategy is called “Out-For-Tat,” or OFT [58,59]). We also introduce another mechanism into our model, which is the price for maintaining relationships among players. These mechanisms correspond better to our social world, where most personal and formal relationships usually have some room for mobility [60,61,62,63,64,65], and maintaining relationships between partners always comes with certain costs. The results obtained by the simulation experiments show that the possibilities to select partners or terminate a relationship with partners (i.e., the network strategies in our model) are the driving force behind the emergence of core-peripheral structures in networks rather than choosing some strategy in the PD game. We also show that a core is formed over several rounds of repeated PD game. This core acquires a symmetric structure. It is due to the symmetric strategy of the pairs of core players in the repeated PD game. This core is relatively stable over time, both in its size and in the many structural properties resulting from the core-periphery dichotomy.

1.3. Paper Structure

The rest of the paper is arranged as follows. In Section 2, we describe the principles of our model in detail, which simulates the emergence of the core-periphery structure in the network when applying the spatial game with the addition of a network strategy. Then, the results and analyses are provided in Section 3. First, we deal with the emergence of the core-periphery structure and then with the question of possible symmetry in this structure. Finally, we will conclude the paper with a few observations in Section 4.

2. Materials and Methods

We consider a population of players, each of whom repeatedly participates in a game of prisoners’ dilemmas with a group of several players (partners) selected in each round from the entire population of players. A graph describes the structure of this population, and each player occupies a node in this graph. Edges between the nodes represent interactions (relationships) between the players in a particular round. In each round, each player decides their strategy in the PD game: cooperation or defection. In doing so, they can decide whether to play (interact) with some partners cooperatively but oppositely against others. In addition, each player knows the history of their games with other players from the last round. Based on this knowledge, players also decide whom the game relationship will continue with, who will be terminated, or with whom a new game relationship will be established in the next round. We assume the standard PD game with simultaneous actions. We do not consider the asynchronous actions of players (when not everyone updates their actions simultaneously as described, e.g., Huberman and Glance [66]).

2.1. PD Game

The player interacts in each time round with k other players chosen from all N players (nodes) in a network. They can choose either cooperation C or defection D. The player’s total payoff in a certain round is the sum of all their interactions that correspond to the different game situations. These situations can be expressed by the payoff matrix [67,68], see Table 1 (the values of R, S, T, and P are given in Table A1 in Appendix A):
We denote the i player’s payoff using strategy ai, if the strategy of the partner j is aj, as πi(ai, aj). Thus, for example, π(C, D) = S. A player can apply different game strategies, C or D, in games with various partners. Our model also assumes that players have an inevitable cost of maintaining relationships γ(k), corresponding to real social networks. The total net payoff (from now on also mentioned only as payoff) for the player i obtained in round t is then the following:
Π i t = j Ω i , t π a i t ,   a j t γ k i t ,  
where Ωi represents the set of partners with which the player i interacts in the round t, (t = 1, 2, 3 …), ki(t) is the number of partners of the player i in the round t. The cost of maintaining the relationship between the player i and ki(t) partners in a particular round t can be expressed by the following Equation (2) [69,70]:
γ k i t = α k i t 1 β   k i t 1 0   k i t = 0 .  
Based on the function of the cost on maintaining relationships and the results of the PD games in individual rounds, the optimal number of connections (i.e., edges in network structure) with other players can be determined. Achieving such an optimal number of relationships is the goal of all players for maximizing their earnings. Parameters α 0 α P and β  β 1 in Equation (2) affect the level of costs of maintaining relationships in each round, thereby limiting the number of partners (number of relationships, network density) that players can maintain if their earnings are to be positive. We choose the values of α and β (see Table A1 in Appendix A) so that the number of players has the number of relationships up to about 18 relationships, as is common in social networks [70,71,72,73].
If all players interact with each other (all for all), then the strategy defect will always generate a higher payoff. In this case, players will inevitably “learn to defect.” Thus, for cooperative behavior to exist in our model, the interaction must be local. It means that players only need to interact with a small subset of the population. Interactions should also promote assortative agreement between cooperators [74]. This assortative agreement allows cooperators to benefit from each other, while limiting the ability of defectors to misuse them.

2.2. The Evaluation of Relationships from the Last Round

Based on the result of the previous round, player i decides whether to play the game with a partner j also in the new round t + 1, or whether to terminate the game with this player (we denote these network strategies as S (Stay) or L (Leave)). This decision is based on comparing the (expected) payoffs and the costs of making the change. Player i decides to terminate the relationship with partner j if the benefit of termination of this relationship in the new round is greater than the loss [70]:
γ k i γ k i 1 > π a i t , a j t ,  
where the term γ k i γ k i 1 is a benefit due to reducing the cost of the relationship (interaction) when the player i will have one partner less. Term π a i t , a j t is the expected loss from the termination of the interaction with player j. A player follows a simple rule: if a partner cooperates, the player will want to keep them in the next round. However, if the partner is a defector, the player will not want to play with them in the next game. When a player decides to terminate interaction with some partners, this is reflected in the network. Thus, the edge between them disappears. However, in subsequent rounds, player i may start an interaction (to start playing) with partner j, a defector in some previous rounds (see Equation (7)).

2.3. Creating a New Relationship

In each subsequent round, player i must also consider how many partners they will address. Each player i optimizes their payout (see Equation (1)), which also affects the number of newly approached partners, because if the new partner j defects, then the marginal price of a new relationship becomes a net cost, namely, the payout from the PD game is zero ( π a i t + 1 ,   a j t + 1 , where a i t + 1 = C , and a j t + 1 = D )). Suppose that player i expects mixed results of the new game. In that case, the optimal number of newly addressed partners depends on what distribution of cooperating and non-cooperating partners player i expects.
If player i knows who the defectors and cooperators are, they would connect with those players who would guarantee them higher payoffs. They would add more partners if the marginal net profit remained above zero. Therefore, the strategy that maximizes the payout depends on how others play the game. The player can only predict the probability, based on their own gaming experience, of the newly approached partner using a particular game strategy, and then estimate the expected net benefits [69]:
E ( Π i t ) = τ i t · π a i t ,   C + 1 τ i t · π a i t ,   D γ i k + 1 γ i k ,  
where term τ i t is the probability that player i assumes that potential partner j will employ a cooperative strategy in the t round of the game. This assumption of player i is based on their experience from previous rounds [70]:
τ i t = ω · τ i t 1 + 1 ω · R i t 1 ,
where ω is the weighting factor (we choose 0.5), and R i t is the fraction of cooperators from all partners (interactions) that player i has in the (t − 1) round. We choose the parameter R i t in Equation (5) to be small at the beginning so that the probability that cooperators will approach a defective partner will be lower in the first few rounds. However, in the beginning, the cost from connections, when cooperative player i is looking for other cooperating partners, may be small, compared to the cost when player i starts a game with strategy D. The total expected earnings of player i after the m-th round can then be expressed as follows:
E Π i m = l = 1 m t = 1 n τ l t · π a l t ,   C + 1 τ l t · π a l t ,   D γ l k + 1 γ l k ,  
where when calculating the expected payoff E π a i , t , a j , t , players must predict the future action of their potential partner (see Equation (5)). They aim to optimize their total income (Equation (1)). This goal affects the number of partners that they newly address in each round.

2.4. The Change of the Strategy

It also follows from Equation (6) that the probability of maintaining a connection with the defector for several consecutive rounds will decrease. However, we also assume that players sometimes can change their strategy. For example, they can address a defector in a specific round. We can imagine this strategy as “irrational” behavior when players “hope” to build a new CC relationship by transferring this defector to a cooperating partner. Thus, with a sure probability pc, player i will create a relationship with partner j, who played with strategy D in the last round, in the new round t + 1. We express this “irrationality” using the Fermi equation [71]:
p c = 1 1 + e x p π a i t ,   D γ i k y i k 1   μ ,  
where μ is a factor that characterizes a certain irrationality of the player.
All parameters in our model and their associated ranges are summarized in Table 1.

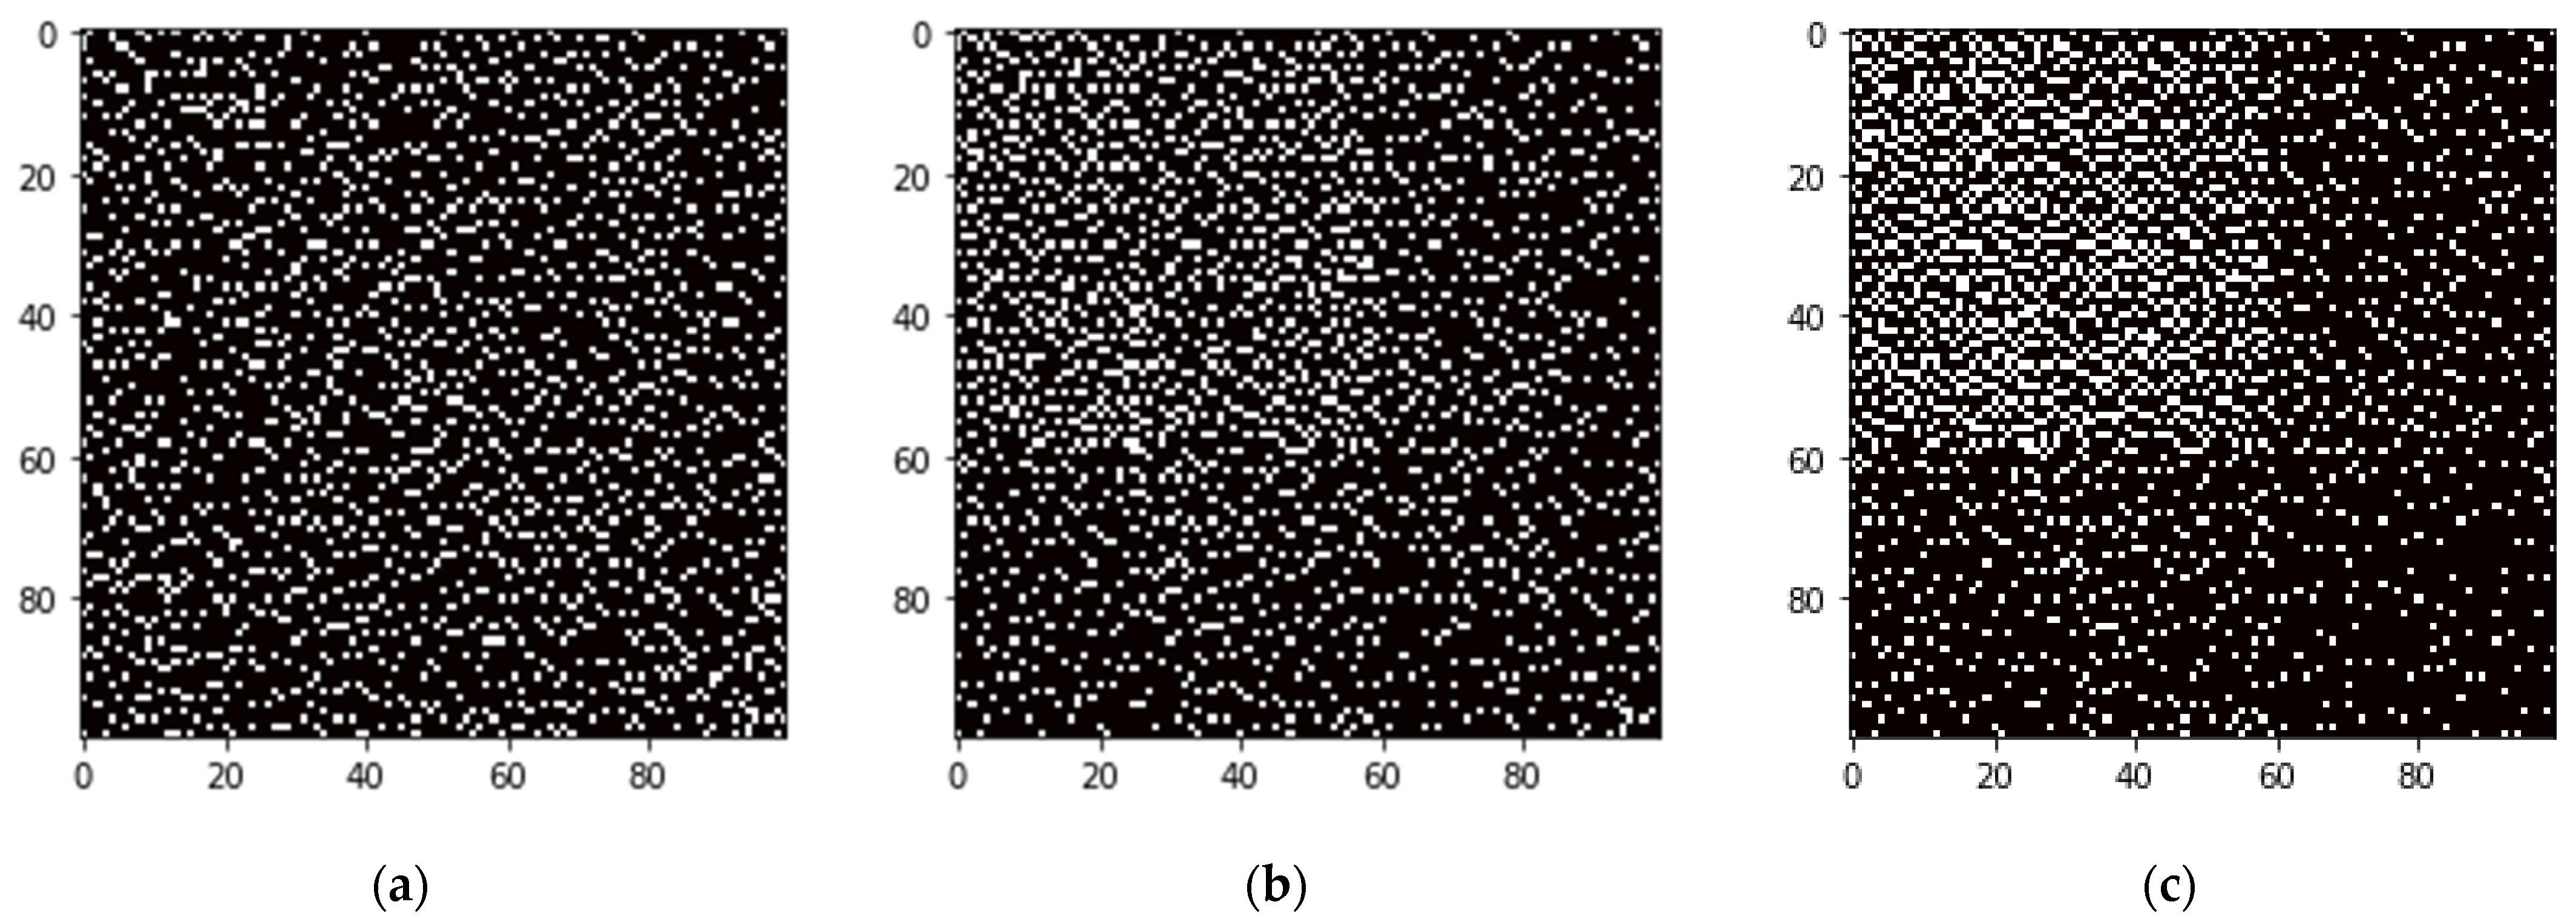
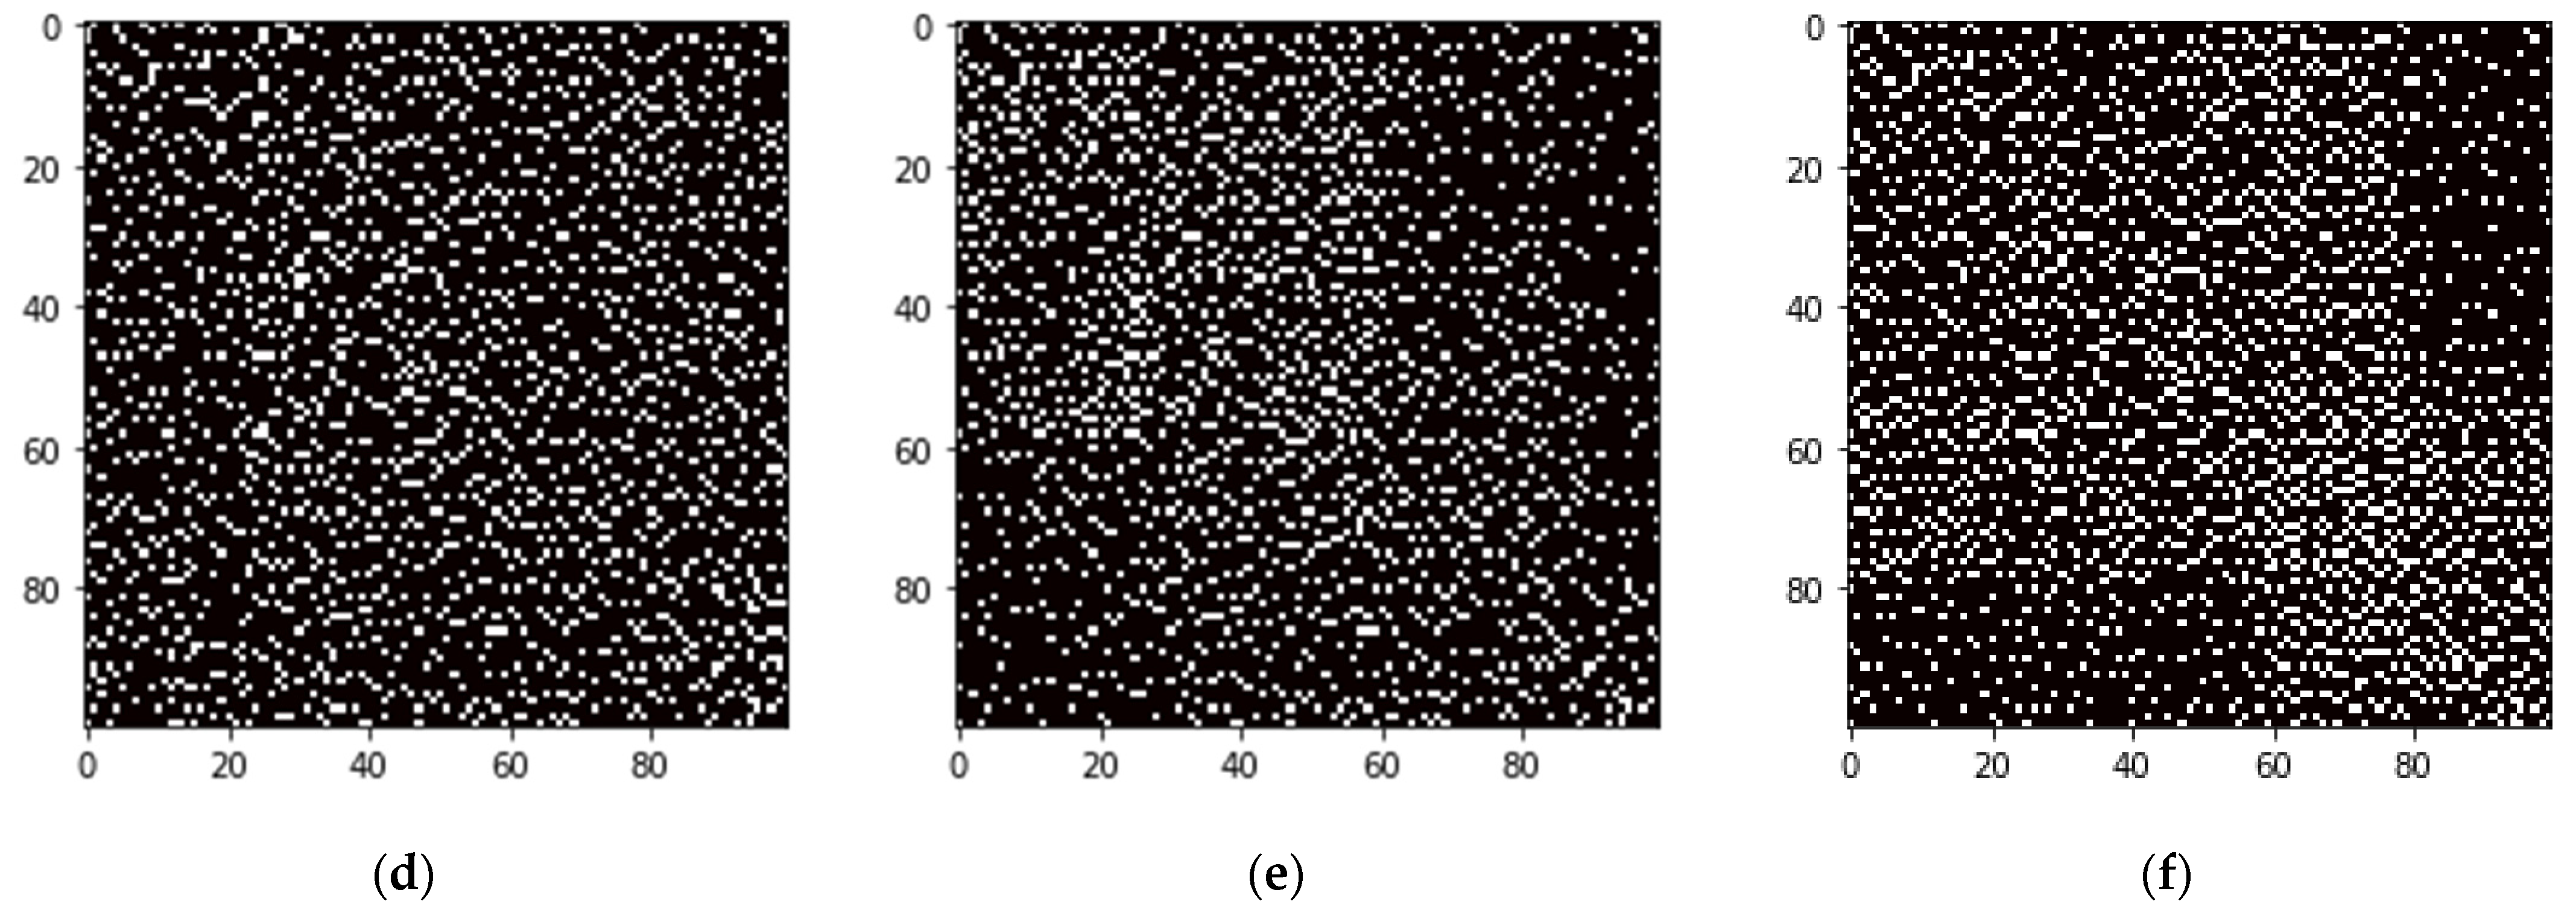
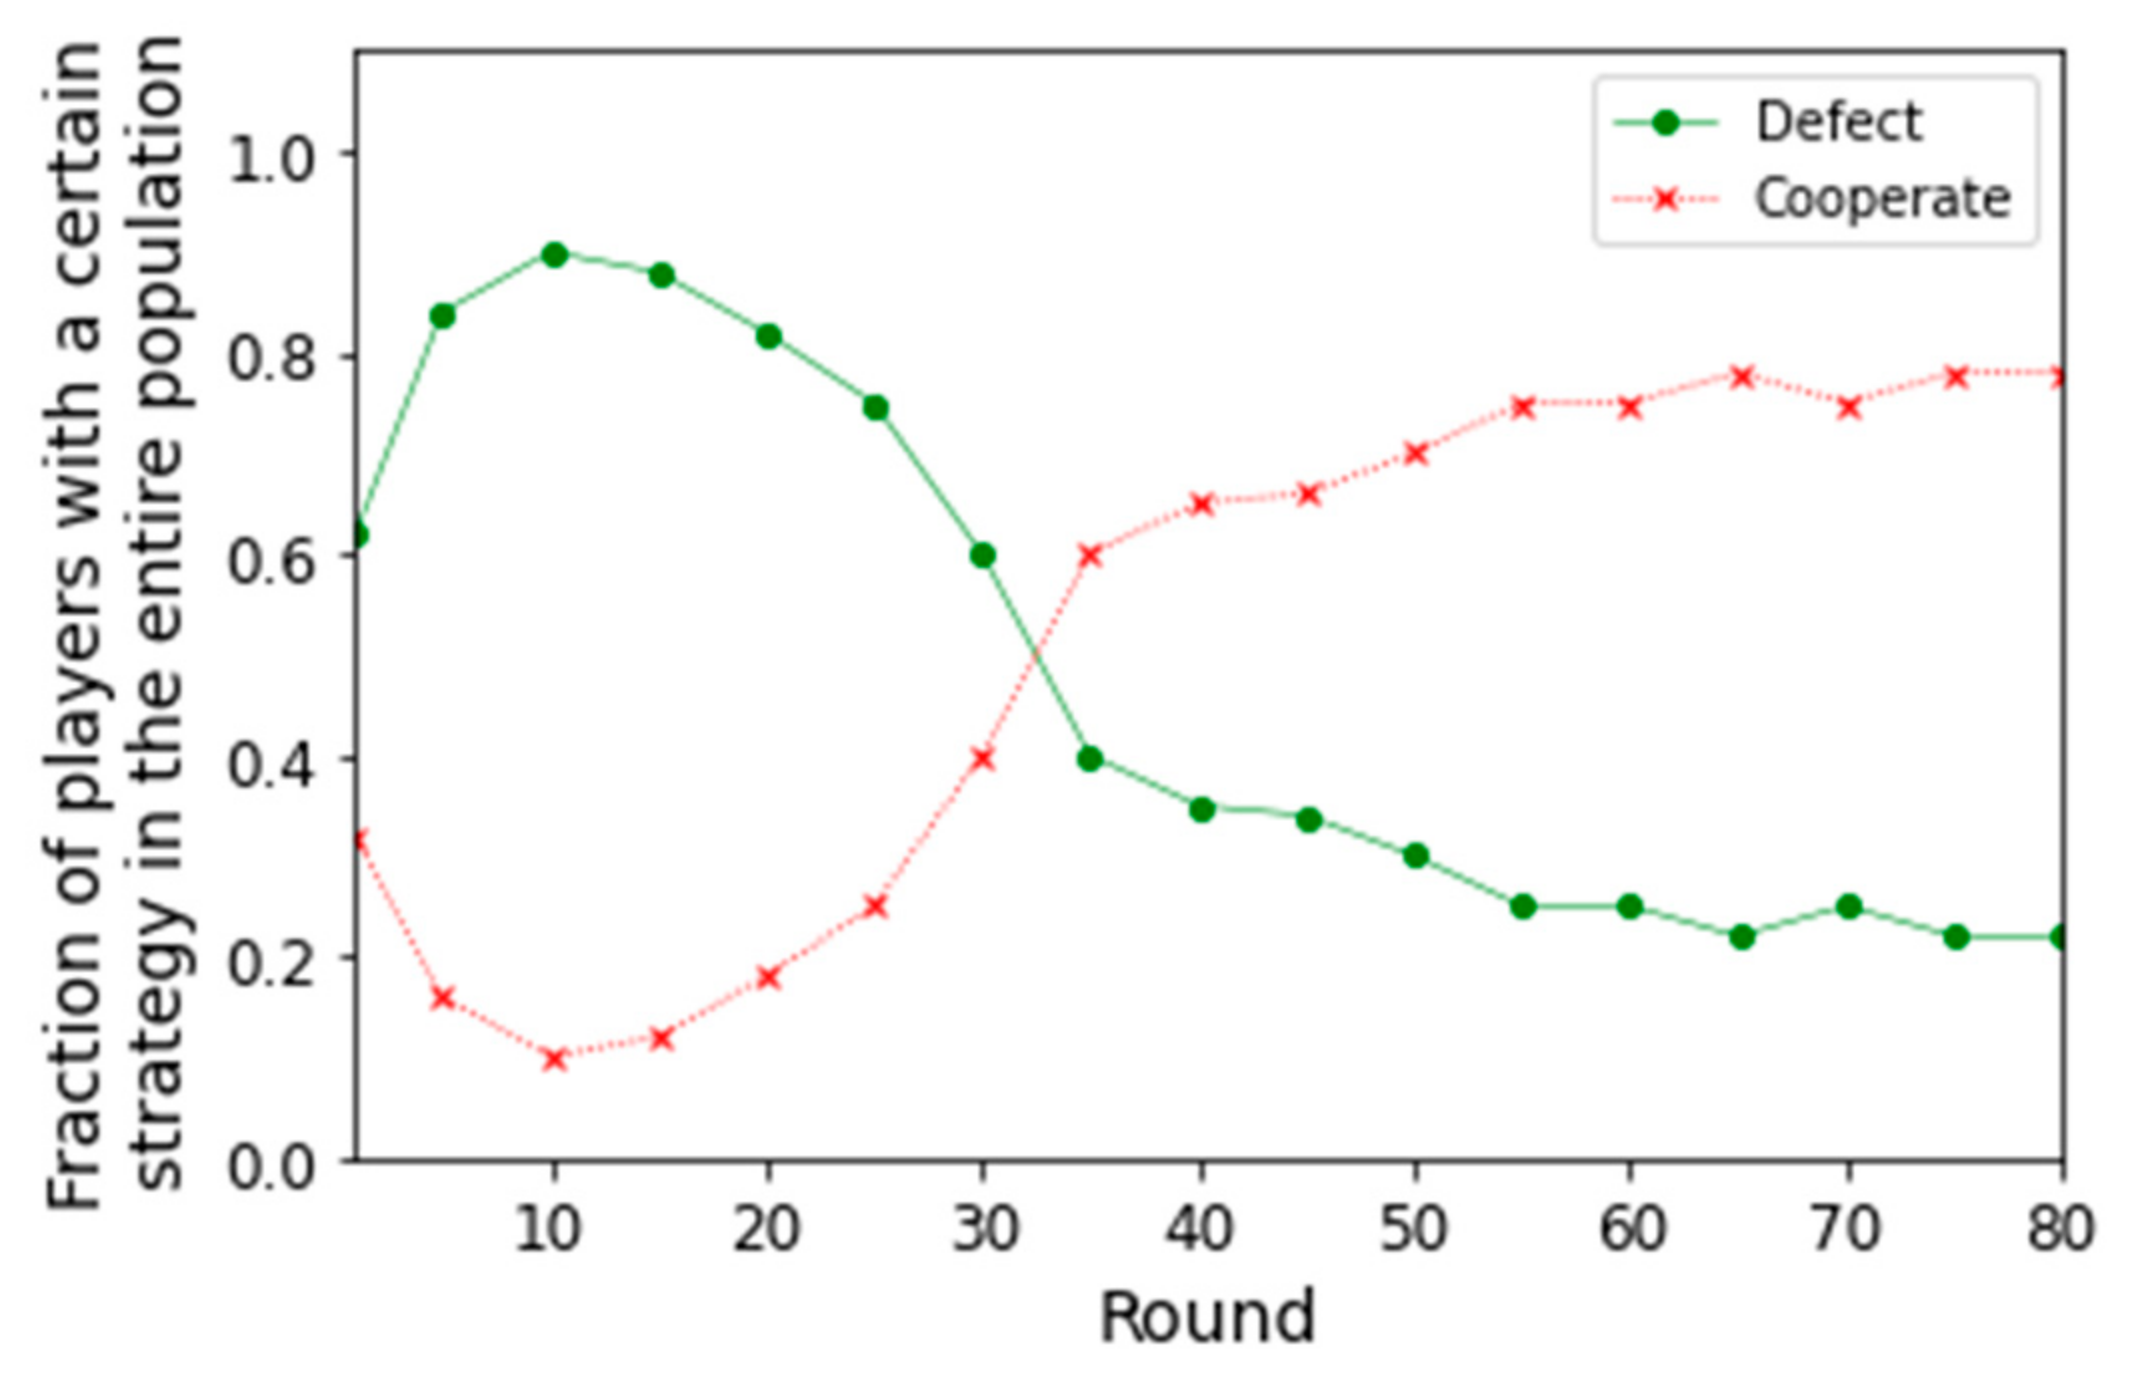
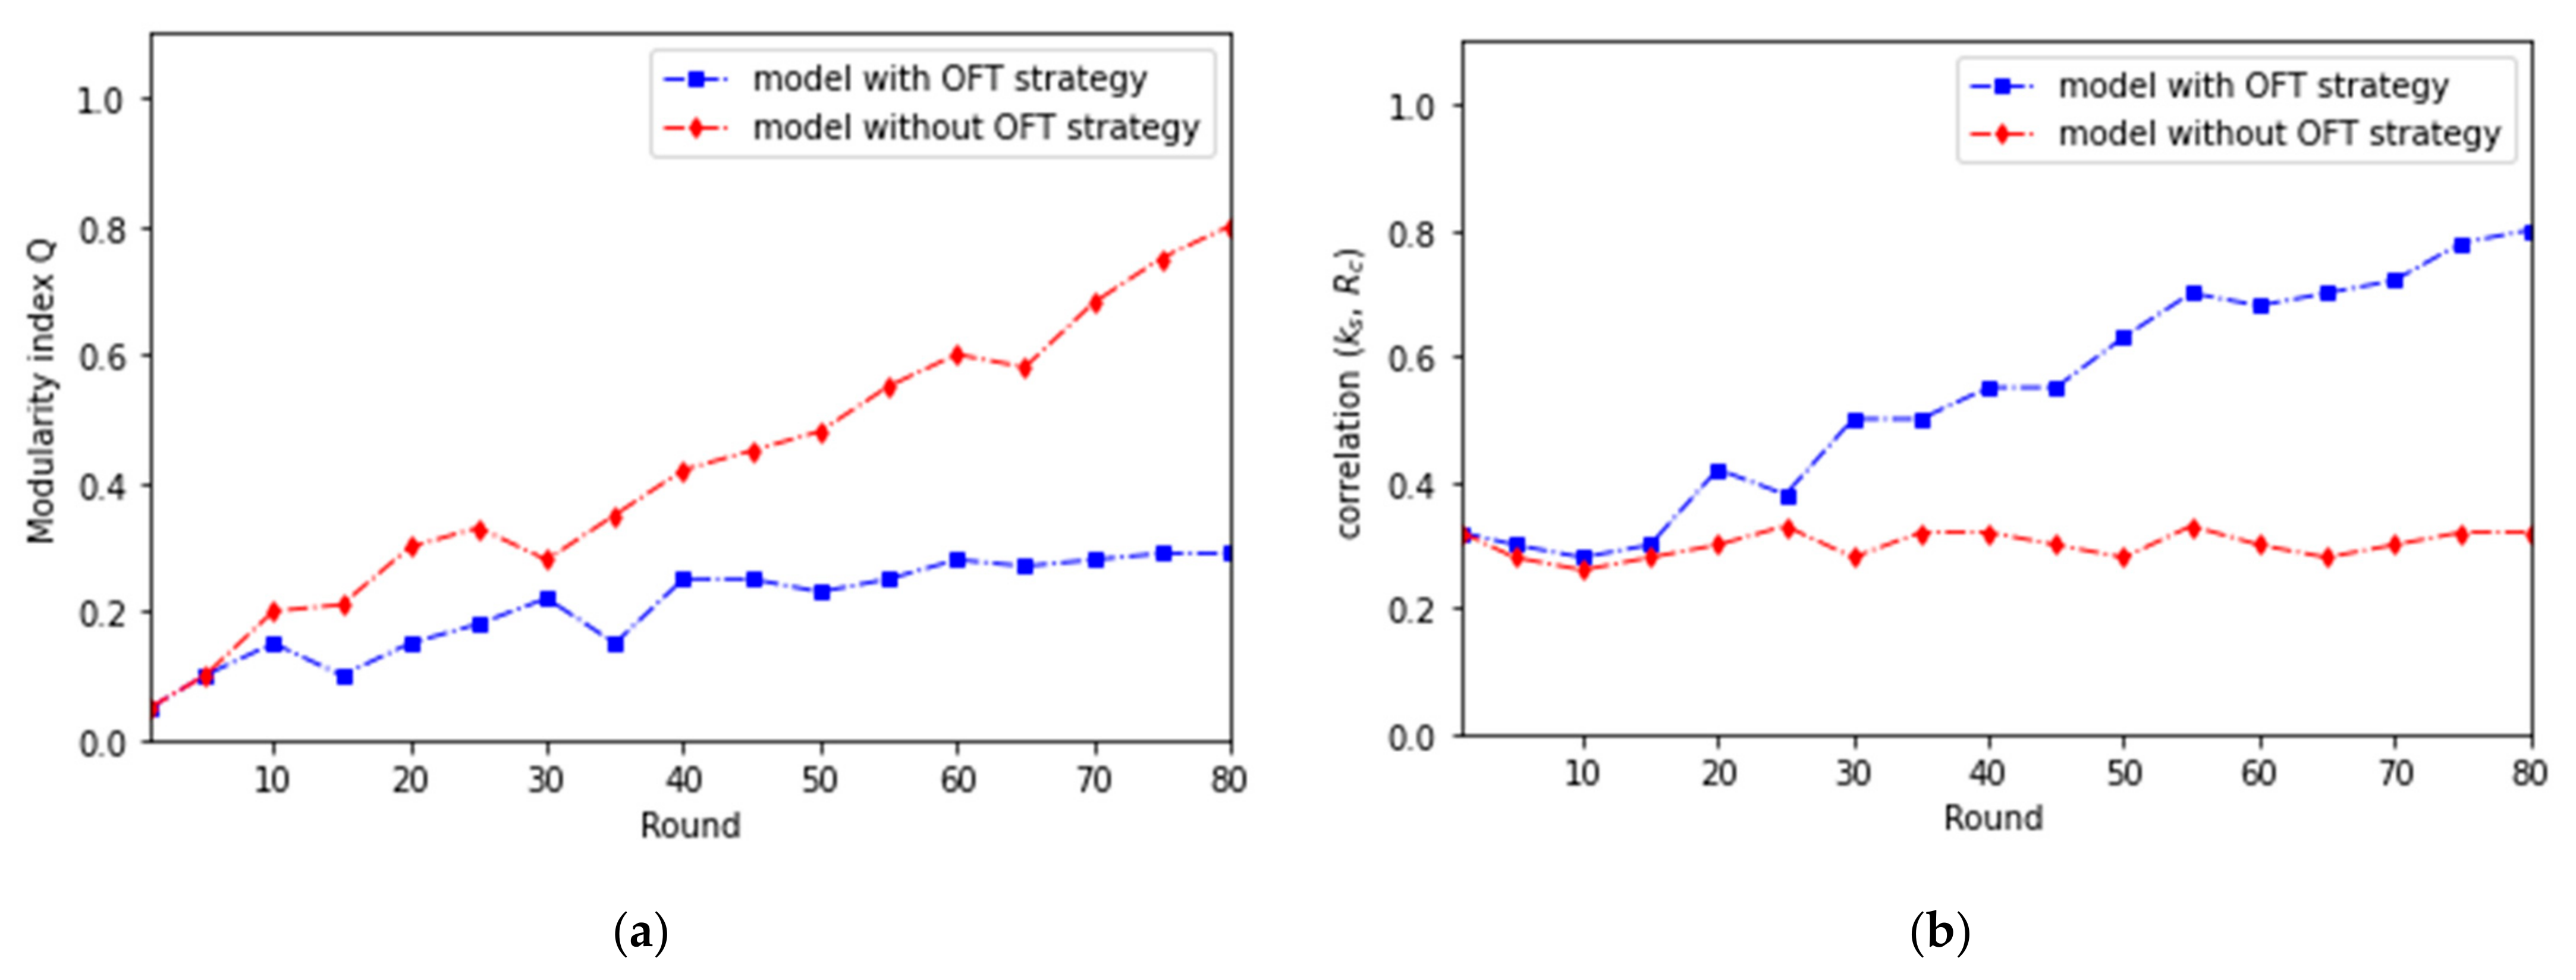
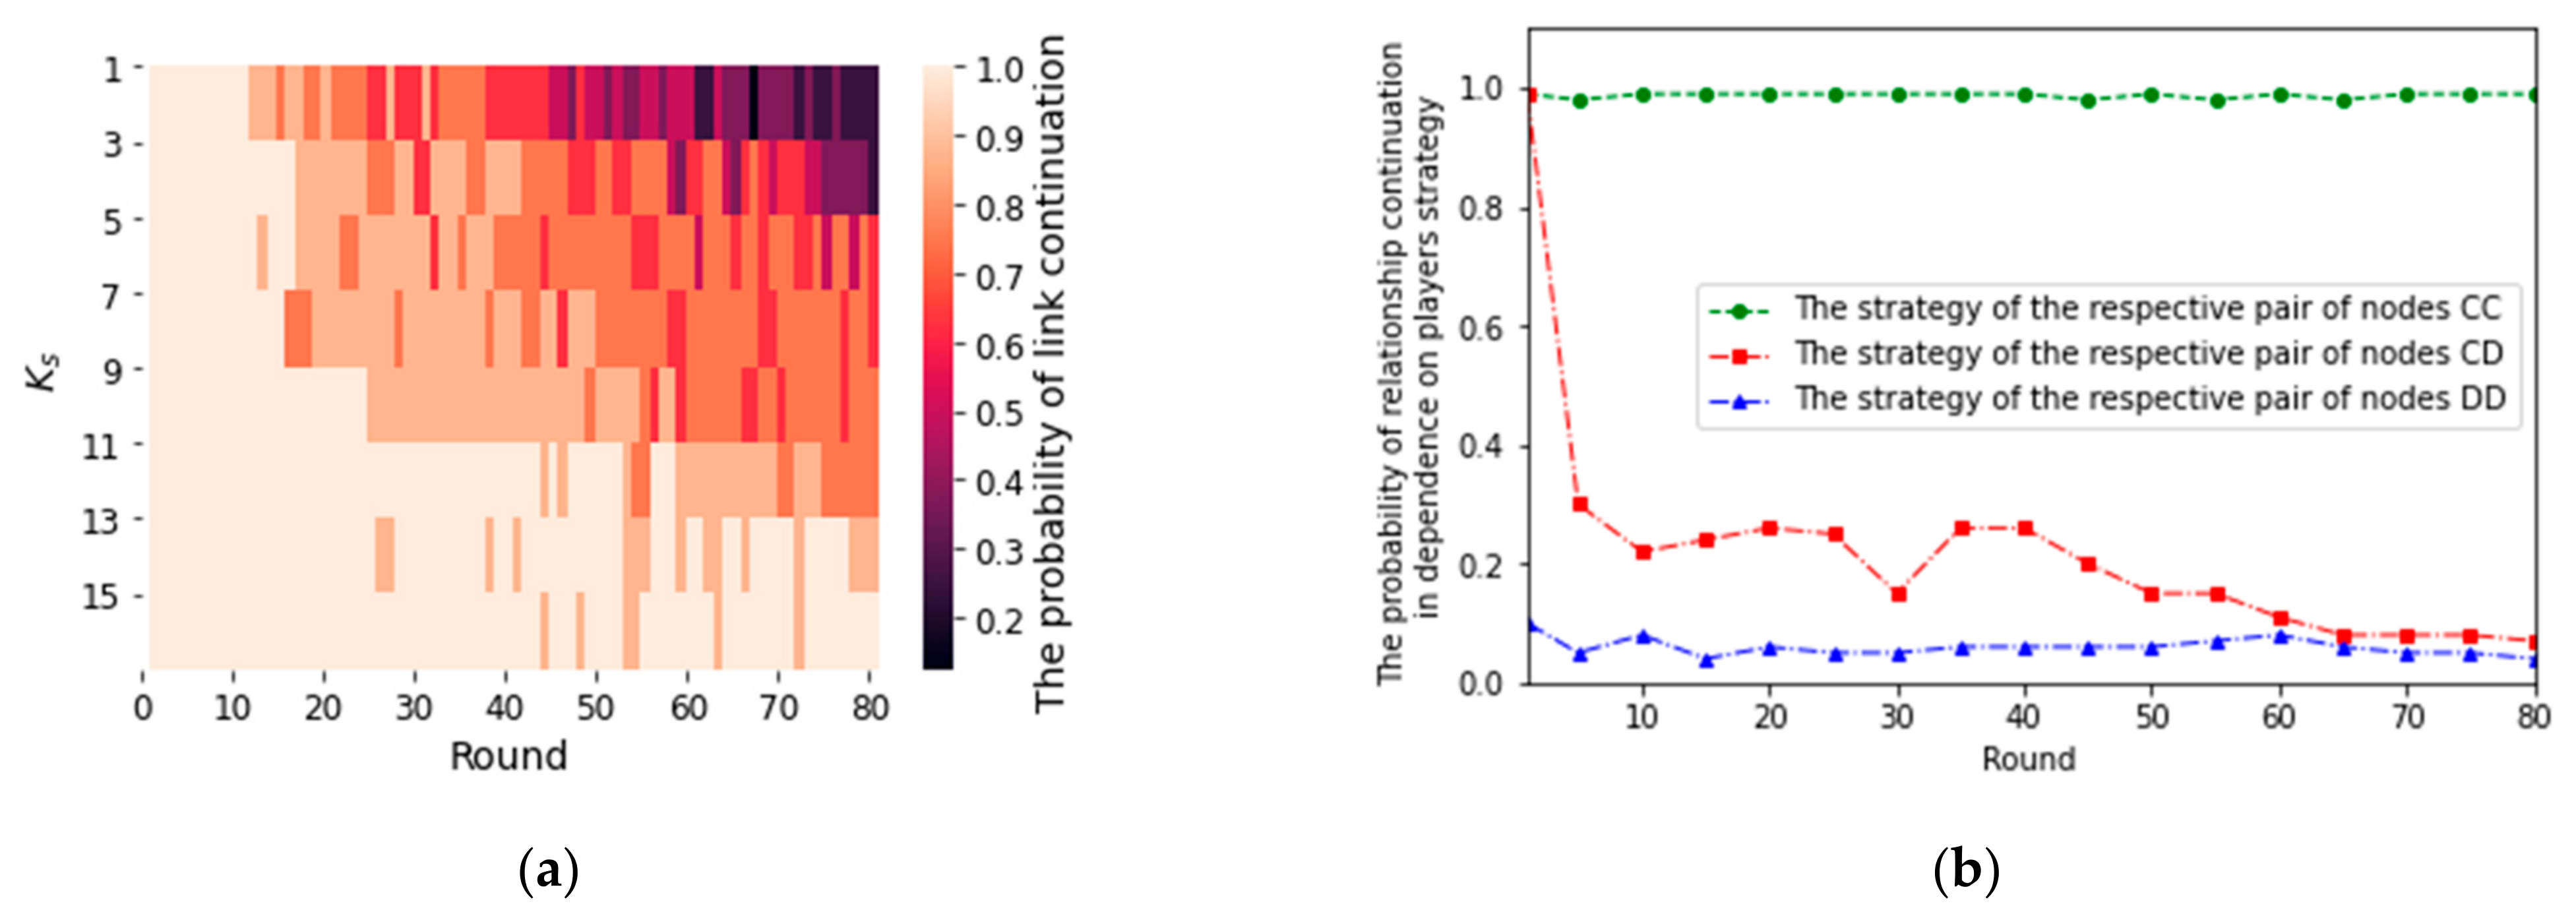
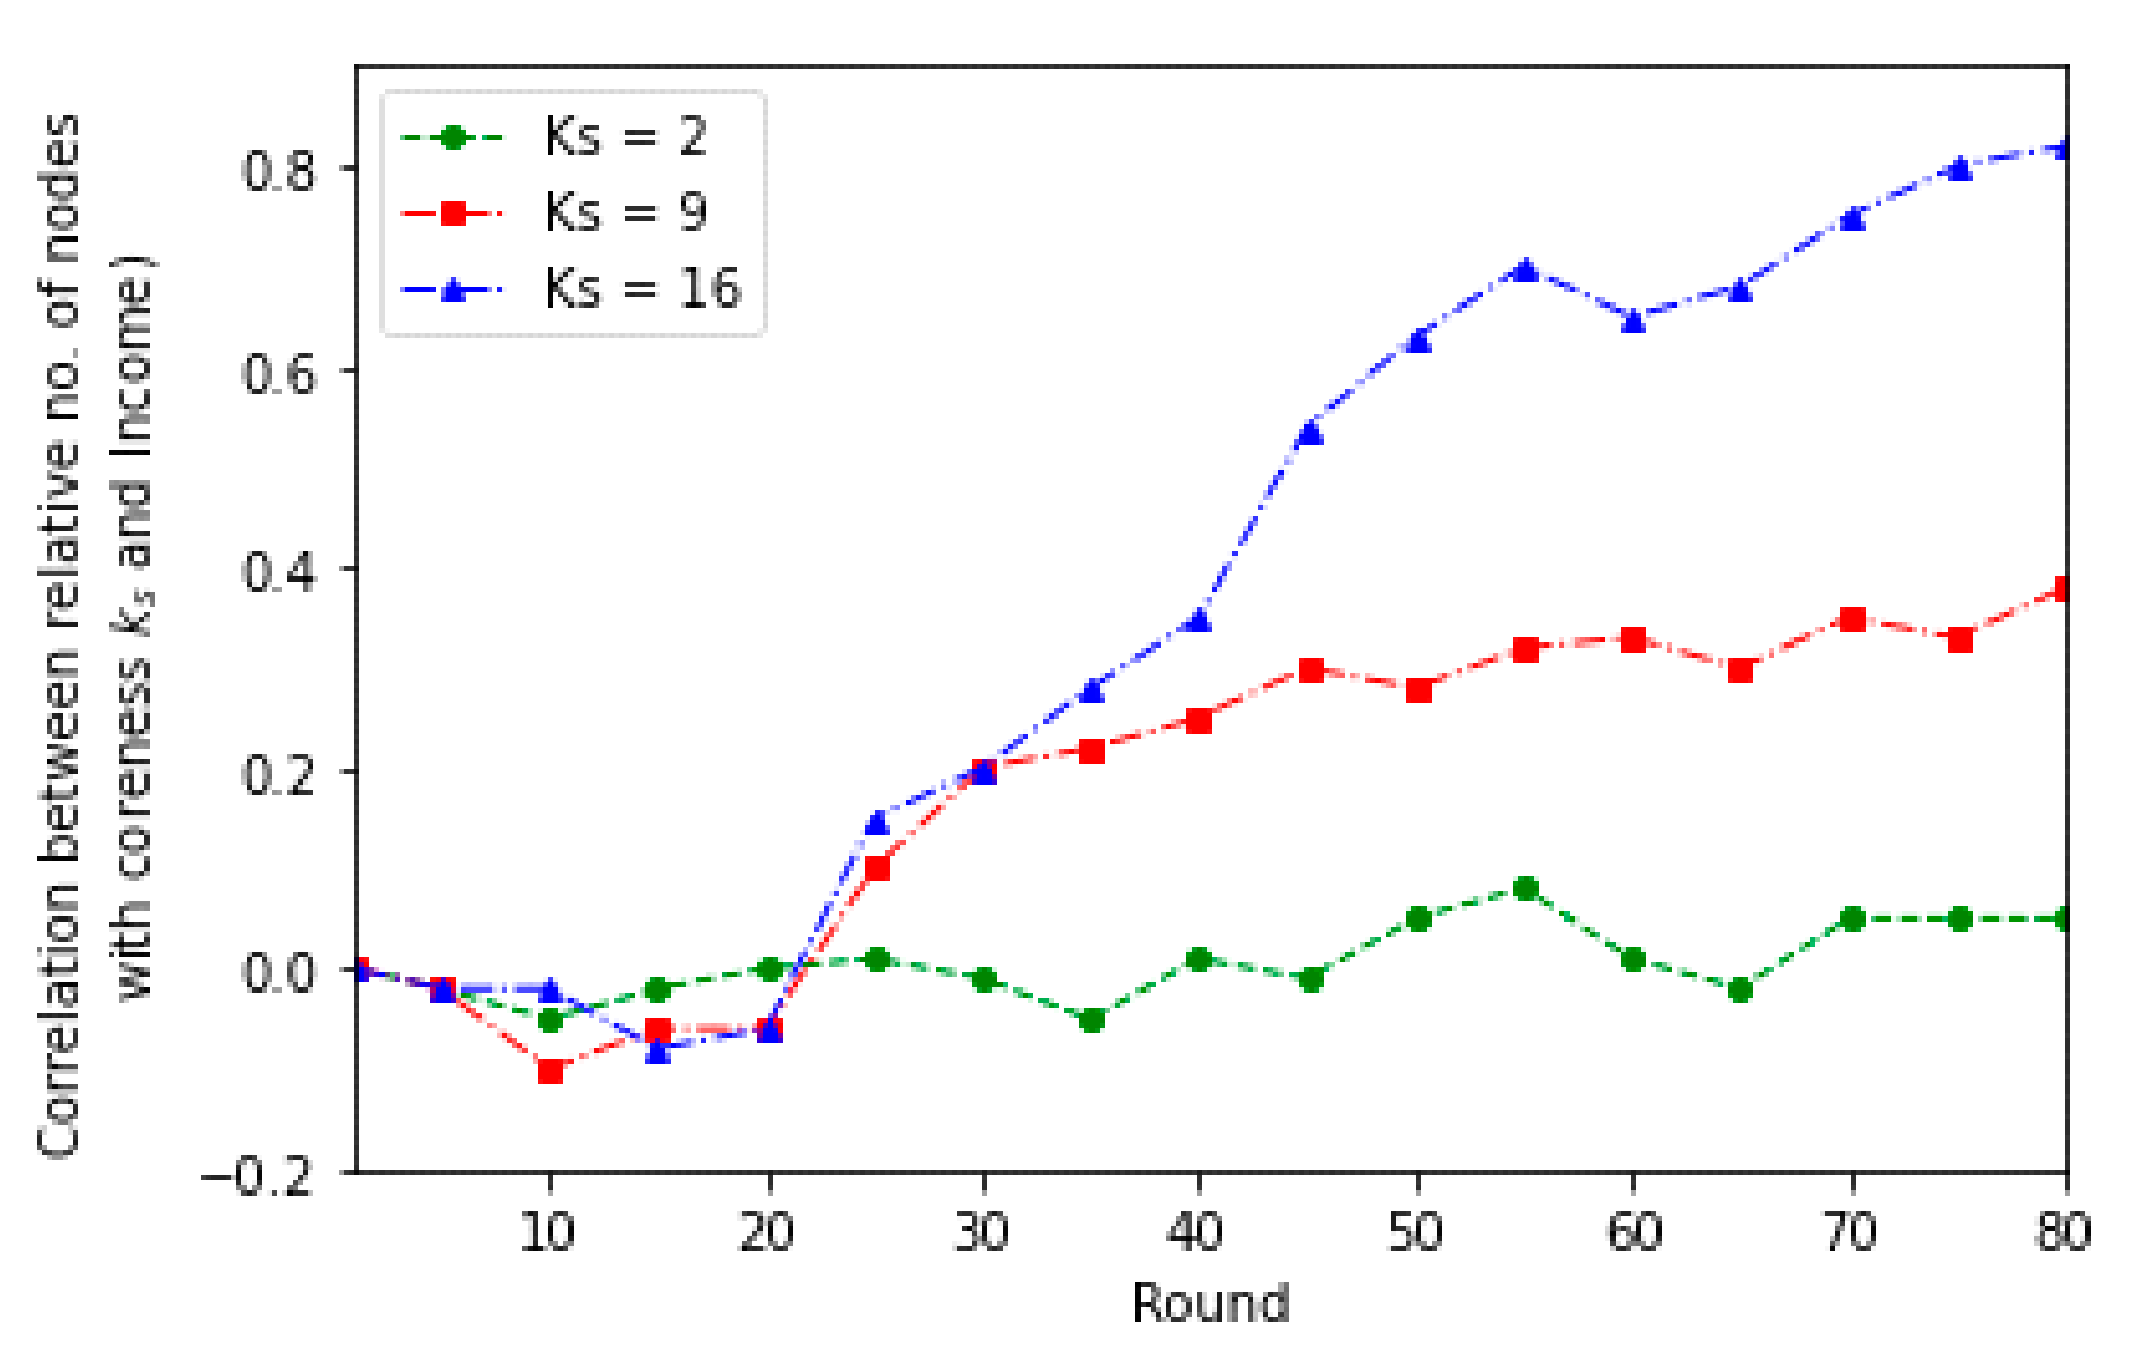
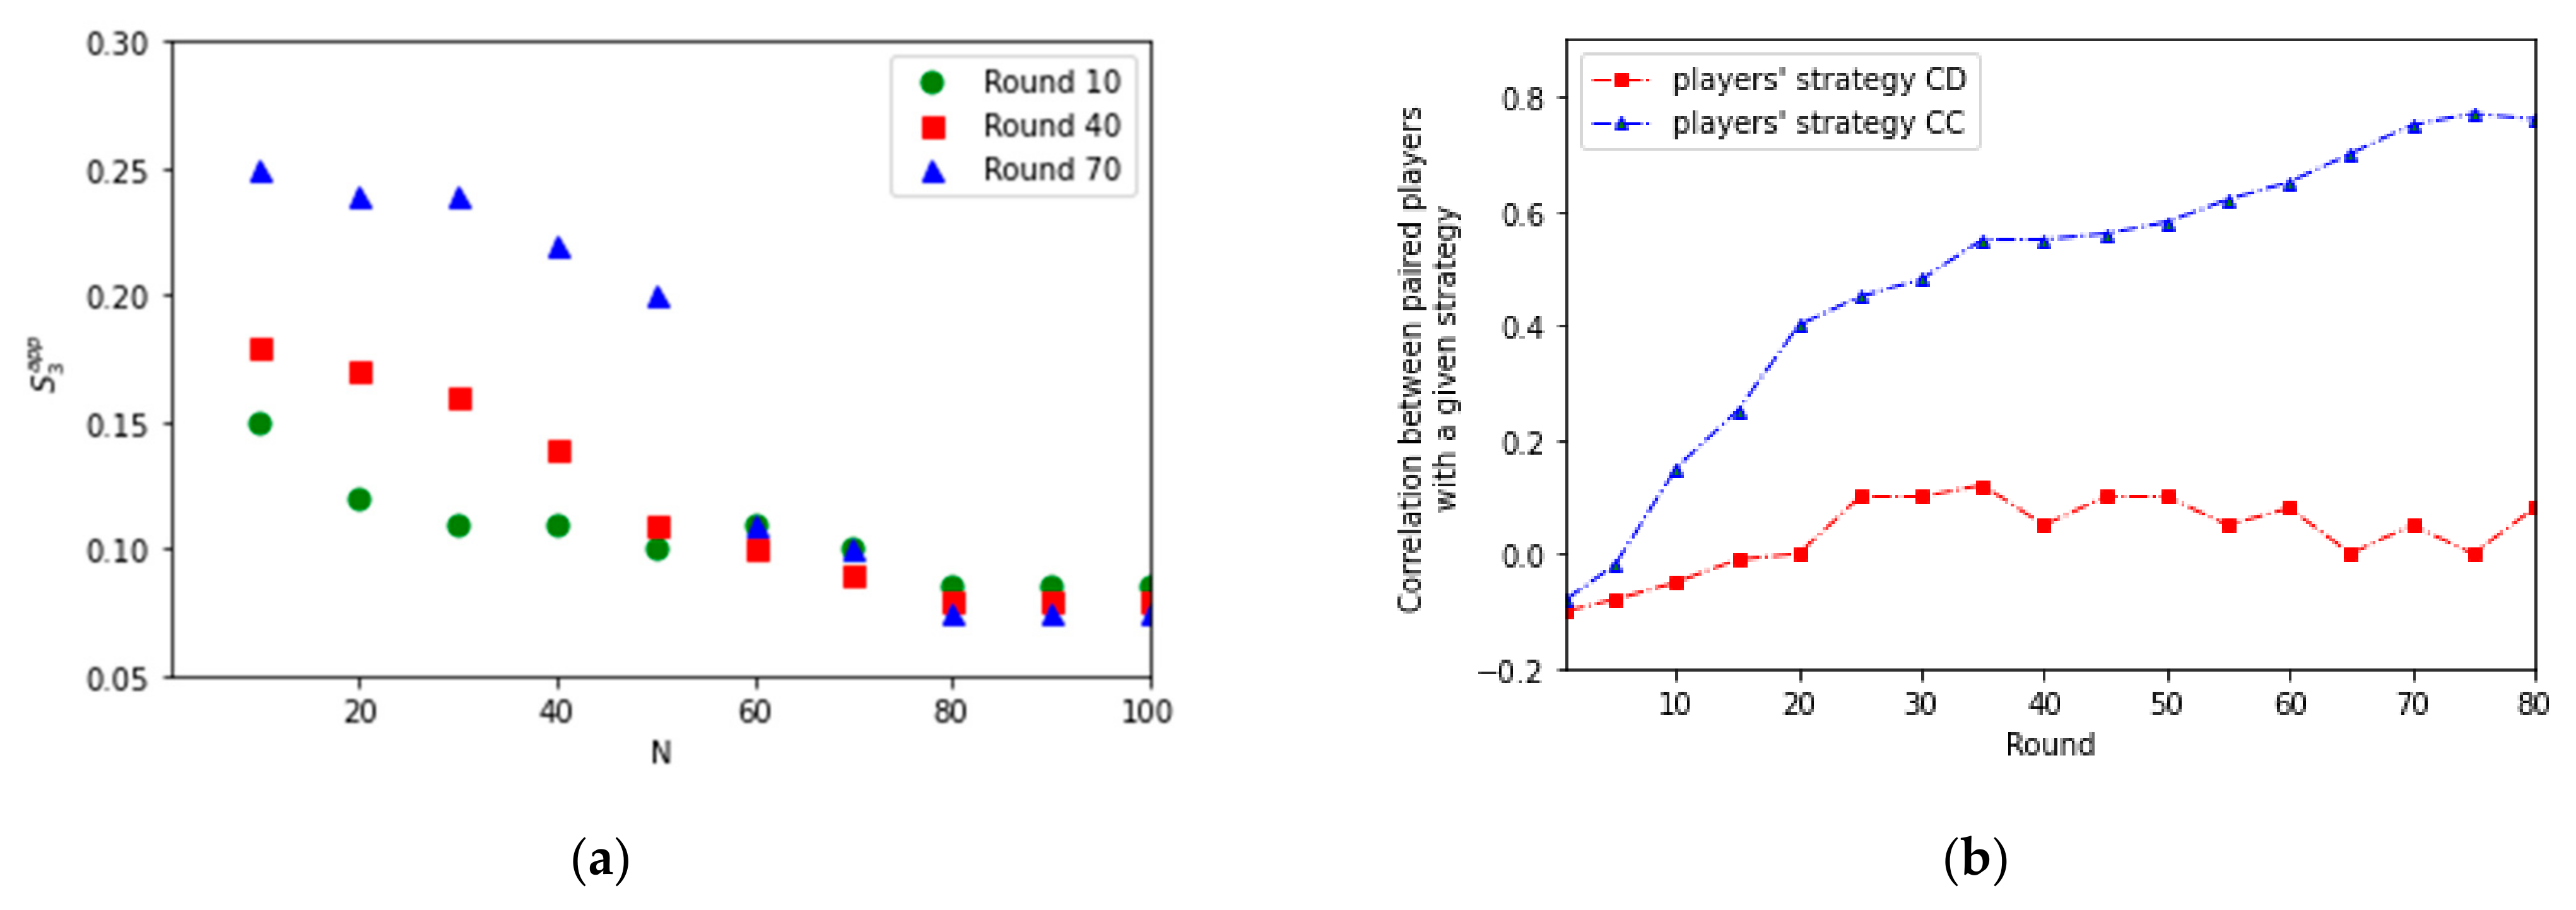
3. Results and Discussion on Simulation Experiment

The main goal of our research was to examine the influence of evolutionary dynamics that also includes the possibility of the selection and termination of cooperation with other players on the structure of the resulting network, including analysis of possible symmetry. The game was iterated forward following the Monte Carlo simulation procedure [64]. The evolutionary process was controlled by repeating the rounds described by the equations in the previous chapter.
The results in the following paragraphs are demonstrated for the following values: The initial graph is a discrete graph with N = 100 nodes. The number of rounds performed for this network is 80. Player i constantly interacts with several other players. This player’s strategy in the game can be C with some players and D with others. We assume that the distribution of strategies is random for each player at the beginning. Overall, we consider the following division at the beginning: the ratio of players with strategy C to the total number of players RC = 0.5. The percentage of players with strategy D is RD = 0.5. We also perform, using our model, another series of experiments with different numbers of nodes and with different values of parameters to monitor the evolution of the network structure of the network. The results of these additional experiments are similar to those reported herein. The ranges of values of parameters are listed in Appendix A in Table A1.
The subject of our study is the structure of the network. Therefore, we first analyzed the results of simulation experiments in the form of a matrix representation of the network. Figure 1a–c (display of an adjacency matrix in rounds 10, 40, and 70) show the difference in the structure if we allow within the simulation model to terminate the relationship with the player who defects (OFT strategy) and to optimize the number of newly addressed players. Figure 1d–f represents the situation when we do not allow the simulation model to terminate the relationship with the player who defects (players adopt TFT strategy here). It can be seen from the graphical representation that in the first case (Figure 1a–c), a core-peripheral stricture is evolving. Figure 1d–f then instead indicates the development of the community in the respective network.
Thus, we can see the development of a core-periphery structure in Figure 1a–c. At the same time, we examined the development of nodes distribution in the corresponding parts of the network. Figure 2 shows this development in the rounds corresponding to Figure 1a–c.
Because defection is the dominant strategy (T > R and P > S), defection is better than collaboration in the initial phase. This strategy defection also initially passes on to players with the original cooperation strategy. However, suppose that the game is repeated and the costs of maintaining relationships are added into traditional gaming. In that case, those factors begin to act as motivation to cooperate because cooperation leads to a higher payoff when a game is repeated. The downward trend of the fraction of cooperation in the initial phase is stopped (Figure 3), and the cluster of cooperators begins to expand (later, this cluster forms a core), leading to a relatively high level of cooperation in the end. We also establish a threshold value, the point (round) at which cooperation starts to dominate the defection (both in expected payoff and related probability of the choice). We find out the size of this threshold, namely 38.
To confirm the hypothesis that the core-periphery structure is a consequence of the players’ network strategy (i.e., leaving and selecting partners) rather than their choice of strategy in a PD game, we perform further calculations. We also use the approach presented by Newman and colleagues [9,11,13,75] to characterize the core-periphery structure in various rounds. They proposed a quantitative measure called modularity, which quantifies the degree of discretion of these modules in a network. The modularity index, Q, measures the fraction of edges in communities, compared to the expected ratio when all edges are placed randomly [13]. We use the modularity Q as defined in [75,76,77,78,79] for the comparison. We also compare calculated modularity values with the degree of positive assortment in our interaction network in the individual rounds of the simulation model. A higher positive assortment and a low degree of modularity is an appropriate indication of the core-periphery structure, where nodes in the core are densely connected [80]. On the other hand, a network with the construction of core and periphery, where strongly interconnected nodes form the core and peripheral nodes are interconnected sparsely, is in a certain way asymmetric. Consequently, the modularity values of such networks are significantly lower than the values of the corresponding randomly generated networks.
The modularity in the case of the simulation modeling without the OFT strategy gains, conversely, gradually more significant values in the later rounds as indicated in Figure 4a. Together with the higher positive assortment which we also calculate, it suggests the evolution of the community structures in our network.
In simulation experiments with the possibility of the OFT strategy, the modularity values are low. We compare the calculated modularity values with the degree of positive assortment in our interaction network in the individual rounds of the simulation model. We conclude that the result of our simulation experiments with the possibility of the OFT strategy is a network with the structure of core and periphery, where the core is formed by collaborators connected densely, with those of peripheral nodes to a slight extent.
We also use the k-shell decomposition method to evaluate the evolution of the network structure in separate rounds. The k-shell decomposition method is used to capture the differentiation of structural roles of nodes. The resulting metric, coreness (ks), is used, for example, to reveal the positions of nodes on the internet or in other networks [81,82,83]. This metric allows a complete specification of nodes in the global network topology. It also means that even a node with a high clustering factor can be marked as peripheral if it has the most connections with the nodes that belong to the periphery. In each round, we find out the value of coreness for individual nodes. By successive pruning, we obtain the coreness values for nodes in the periphery that were sparsely interconnected and the coreness values for nodes in the core that were densely interconnected [81,82,83].
Figure 3b shows the correlation between the coreness of players and the fraction of cooperative players among all players RC. The figure shows, in the case that the simulation model includes the OFT strategy, an increase in the value of the Pearson correlation coefficient between RC and ks nodes in later rounds. Players with a dominant collaboration strategy gradually create the core of the network. It means a higher correlation coefficient between ks and RC. For a game variant without the ability to end a relationship, the value of correlation between the coreness of players and the degree of cooperation between players RC does not change much. Here, the core, consisting mainly of cooperating players, is not being created. The nodes remain interconnected due to the TFT strategy. The network here acquires an instead community structure (Figure 1f).
The dependence of the probability of the continuation of the relationship between the pair of players to the following round for players with values of ks achieved in the past rounds is presented in Figure 5a,b. In our simulations, the value of ks that players achieved ranged from about 1 to 16 (as shown in Figure 5a). Figure 5a shows that the probability of maintaining relationships between players with low values of ks has a decreasing value. Relationships of players with a low value of coreness ks do not remain stable, unlike with high values ks. The situation is shown in Figure 5b. A core of cooperating players is evolved in the network. Players with lower values of ks create unstable relationships. These players on the periphery with a predominant strategy D—defect—have the problem of making a relationship with other players. Figure 6 shows the correlation between a relative number of players (nodes) with a specific coreness (ks) and their income (see Equation (1)). Strategy D (defect) thrives at the beginning. Players rather expect a defective strategy from others. However, in the following rounds, players must consider what and how many partners to contact to optimize their income. The marginal payoff from other CC relationships is lower, but if a new partner defects, the payment from this relationship becomes the net cost because the payout from the PD game is zero. Gradually, a core of cooperating players who maximize their income is evolved.
As already mentioned, the development of the core-periphery structure in networks is associated with changes in structural properties. Symmetry is one of these essential properties. The presence of symmetry provides an opportunity to use various effective tools to understand further the network’s structure and function. Therefore, a better understanding of the evolution of symmetry and possibly other structural properties is vital for understanding the functional role of the core and the impact on the overall behavior of the network [52]. We observe the development of symmetry in the network in individual rounds of repeated PD game. We use the approximative local vertex symmetry measure to characterize network symmetry, defined in [84]:
s l a p p i = s ˜ l i S l i Λ S l i 1 k 2 k k 2 p k 3
Figure 7a shows that a cluster of nodes is formed in the network, structurally and functionally equivalent. This cluster corresponds to a gradually developed core that exhibits a symmetry property. This fact is also presented in Figure 1a–c. It corresponds to the development of the distribution of stages shown in Figure 2 in selected rounds of repeated PD games. Nodes in the formed core (Figure 2 on the right) are densely connected and have similarly high degrees. The evolution of the core is a consequence of both the network strategy (OFT strategy) and the strategy in the PD game. Nodes with strategy C prefer to cooperate with nodes with the same strategy and terminate relationships with nodes with strategy D. Nodes in the core prefer a symmetric cooperation relationship (CC) that remains the only stable type of relationship.
On the contrary, the asymmetric relationships CD are unstable. It can also be seen in Figure 7b. Nodes with a higher degree of cooperation are more likely to interact with each other (CC strategy). Pairs of players with CD game strategies have a low probability of stable interactions.
Primarily, Figure 2, Figure 6a and Figure 7b provide specific evidence of the relationship between the strategy of the nodes in the network and the resulting network structure. The core of the network is created from the nodes preferring cooperation (symmetric strategy CC). These cooperative nodes ended relationships with nodes with strategy D (using the Quit-for-Tat network strategy [85,86,87]). Conversely, the defectors used a roving approach [88]. They often left the current player and looked for new partners, even though the original partners were collaborators. However, this strategy, though successful at the beginning of the repeated PD game, eventually meant that they remained on the periphery.

4. Conclusions

In a repeated PD game, one of the fundamental assumptions is that the interaction between a pair of individuals will be repeated for several rounds. No players in the game will stop interacting with their opponents [5,11,12,13]. Based on the payout from the PD game, both cooperators and defectors prefer an opponent who cooperates. If players cannot terminate a relationship with a defective partner, they will use the TFT strategy. However, the edge in relevant interaction networks remains. In terms of topology, the result of such a game is instead a community structure (see Figure 1).
Based on our simulations, it turns out that the network strategies of players (S or L) are the driving force of the emergence of the core-periphery network structure. This means the possibility of termination of the relationship with a defective player. This option acts as a kind of penalty for such a defective player. If players can unilaterally terminate interactions with their opponents, they follow a simple rule: I want to keep my partner if they cooperate. However, if my partner defects, I will stop interacting with them. In the next round, I will look for a new partner instead. Gradually, this approach can create a core-peripheral network structure, where the core comprises cooperating players and periphery players with the predominant strategy D—defect. For cooperating players located in the network’s core, their position also ensures maximum earnings in a repeated PD game with the OFT strategy.
The result of symmetric players’ strategies is the evolution of symmetric core on the network. Conversely, players using roving (asymmetric) strategy [88] became part of the periphery. The frequency of players’ interactions gradually increased in the core, whereas it remained the same or even decreased in the periphery. Our experiments clearly show that symmetrical behavior can lead to developing a specific symmetrical structure within the network. Our results show that to understand the origin of a particular form, including symmetry, it is necessary to consider the existing interactions in a network and the individual strategies of the agents. The proposed model shows how complex social topologies can result from simple social dynamic processes based solely on local assumptions. It would be necessary to consider other aspects further that the core-periphery structure causes in the entire network in real social networks. Namely, the asymmetry between the core and the periphery can deepen, bringing fairness problems between both groups of nodes (see Figure 7).
Our results of simulation experiments depend on specific parameters of the model, for example, on the cost of maintaining relationships, the payoff values of the PD game, the parameters μ and ω, and others. Our future work will focus on further research of core-periphery structures and the structural stratification of player communities based on cooperative game theory.

Author Contributions

Conceptualization, L.B.; methodology, L.B.; software, R.R.; formal analysis, L.B.; writing—original draft preparation, L.B.; writing—review and editing, R.R. All authors have read and agreed to the published version of the manuscript.

Funding

This research received no external funding.

Institutional Review Board Statement

Not applicable.

Informed Consent Statement

Not applicable.

Data Availability Statement

Not applicable.

Conflicts of Interest

The authors declare no conflict of interest.

Appendix A

Table A1. Summary of the main parameters of the model together with the range of values in our experiments.
ParameterDescriptionRange of Values
RReward3
PPunishment1
TTemptation to defect4
SSucker’s payoff0
αLevel of costs0.15
βEdge density parameter2
τThe initial probability of player’s assumption about partners’ strategy0.1
ωWeighting factor0.5
RiThe initial portion of cooperators among partners of a player i0.25
μIrrationality factor0.05

References

  1. Zufiria, P.J.; Barriales-Valbuena, I. Analysis of Basic Features in Dynamic Network Models. Entropy 2018, 20, 681. [Google Scholar] [CrossRef] [Green Version]
  2. Šiljak, D.D. Dynamic graphs. Nonlinear Anal. Hybrid Syst. 2008, 2, 544–567. [Google Scholar] [CrossRef]
  3. Beranek, L.; Remes, R. Distribution of Node Characteristics in Evolving Tripartite Network. Entropy 2020, 22, 263. [Google Scholar] [CrossRef] [Green Version]
  4. Otsuka, M.; Tsugawa, S. Robustness of network attack strategies against node sampling and link errors. PLoS ONE 2019, 14, e0221885. [Google Scholar] [CrossRef] [PubMed]
  5. Naylor, L.; Brady, U.; Quinn, T.; Brown, K.; Anderies, J.M. A multiscale analysis of social-ecological system robustness and vulnerability in Cornwall, UK. Reg. Environ. Chang. 2019, 19, 1835–1848. [Google Scholar] [CrossRef] [Green Version]
  6. De Lellis, P.; DiMeglio, A.; Garofalo, F.; Iudice, F.L. The evolving cobweb of relations among partially rational investors. PLoS ONE 2017, 12, e0171891. [Google Scholar]
  7. Zhou, C.; Kurths, J. Dynamical Weights and Enhanced Synchronization in Adaptive Complex Networks. Phys. Rev. Lett. 2006, 96, 164102. [Google Scholar] [CrossRef] [PubMed] [Green Version]
  8. Fortunato, S. Community detection in graphs. Phys. Rep. 2010, 486, 75–174. [Google Scholar] [CrossRef] [Green Version]
  9. Newman, M.E.J.; Girvan, M. Finding and evaluating community structure in networks. Phys. Rev. E 2004, 69, 026113. [Google Scholar]
  10. Ahn, Y.Y.; Bagrow, J.P.; Lehmann, S. Link communities reveal multiscale complexity in networks. Nature 2010, 466, 761–764. [Google Scholar] [CrossRef] [Green Version]
  11. Ball, B.; Karrer, B.; Newman, M.E.J. An efficient and principled method for detecting communities in networks. Phys. Rev. E 2011, 84, 036103. [Google Scholar] [CrossRef] [Green Version]
  12. Dorogovtsev, S.N.; Goltsev, A.V.; Mendes, J.F.F. k-Core Organization of Complex Networks. Phys. Rev. 2006, 96, 040601. [Google Scholar]
  13. Girvan, M.; Newman, M.E.J. Community structure in social and biological networks. Proc. Natl. Acad. Sci. USA 2002, 99, 7821–7826. [Google Scholar] [CrossRef] [PubMed] [Green Version]
  14. Yang, J.; Zhang, M.; Shen, K.; Ju, X.; Guo, X. Structural correlation between communities and core-periphery structures in social networks: Evidence from Twitter data. Expert Syst. Appl. 2018, 111, 91–99. [Google Scholar] [CrossRef]
  15. Porter, A.; Onnela, J.P.; Mucha, P.J. Communities in networks. Notices Am. Math. Soc. 2009, 56, 1082–1097. [Google Scholar]
  16. Miyauchi, A.; Kawase, Y. Z-Score-Based Modularity for Community Detection in Networks. PLoS ONE 2016, 11, e0147805. [Google Scholar] [CrossRef] [PubMed] [Green Version]
  17. Palla, G.; Derenyi, I.; Farkas, I.; Vicsek, T. Uncovering the overlapping community structure of complex networks in nature and society. Nature 2005, 435, 814–818. [Google Scholar] [CrossRef] [PubMed] [Green Version]
  18. Onnela, J.P.; Saramaki, J.; Hyvonen, J.; Szabó, J.; Lazer, D.; Kaski, K.; Kertész, J.; Barabási, A.L. Structure and tie strengths in mobile communication networks. Proc. Natl. Acad. Sci. USA 2007, 104, 7332–7336. [Google Scholar] [CrossRef] [Green Version]
  19. Lewis, A.C.F.; Jones, N.S.; Porter, M.A.; Deane, C.M. The function of communities in protein interaction networks at multiple scales. BMC Syst. Biol. 2010, 4, 100. [Google Scholar] [CrossRef] [PubMed] [Green Version]
  20. Mucha, P.J.; Richardson, T.; Macon, K.; Porter, M.A.; Onnela, J.P. Community structure in time-dependent, multiscale, and multiplex networks. Science 2010, 328, 876–878. [Google Scholar] [CrossRef]
  21. Ma, H.W.; Zeng, A.P. The connectivity structure, giant strong component and centrality of metabolic networks. Bioinformatics 2003, 19, 1423–1430. [Google Scholar] [CrossRef] [Green Version]
  22. Tieri, P.; Grignolio, A.; Zaikin, A.; Mishto, M.; Remondini, D.; Castellani, G.C.; Franceschi, C. Network, degeneracy and bow tie. Integrating paradigms and architectures to grasp the complexity of the immune system. Theor. Biol. Med. Model. 2010, 7, 32. [Google Scholar] [CrossRef] [Green Version]
  23. Fagiolo, G.; Reyes, J.; Schiavo, S. The World-Trade Web: Topological Properties, Dynamics, and Evolution. Phys. Rev. E 2008, 79, 036115. [Google Scholar] [CrossRef] [Green Version]
  24. Kostelić, K.; Turk, M. Topology of the World Tourism Web. Appl. Sci. 2021, 11, 2253. [Google Scholar] [CrossRef]
  25. Seok, H.; Barnett, G.A.; Nam, Y. A social network analysis of international tourism flow. Qual. Quant. 2021, 55, 419–439. [Google Scholar] [CrossRef]
  26. Serrano, M.A.; Boguñá, M. Topology of the world trade web. Phys. Rev. E Stat. Nonlin. Soft Matter Phys. 2003, 68, 015101. [Google Scholar] [CrossRef] [PubMed] [Green Version]
  27. Schweitzer, F.; Fagiolo, G.; Sornette, D.; Vega-Redondo, F.; White, D.R. Economic Networks: What Do We Know and What Do We Need to Know? Adv. Complex Syst. 2009, 12, 407–422. [Google Scholar] [CrossRef] [Green Version]
  28. Csermely, P.; London, A.; Ling-Yun, W.; Uzzi, B. Structure and dynamics of core/periphery networks. J. Complex Netw. 2013, 1, 93–123. [Google Scholar] [CrossRef] [Green Version]
  29. Holme, P. Core-periphery organization of complex networks. Phys. Rev. E 2005, 72, 046111. [Google Scholar] [CrossRef] [Green Version]
  30. Rombach, M.P.; Porter, M.A.; Fowler, J.H.; Mucha, P.J. Core-periphery structure in networks. SIAM J. Appl. Math. 2014, 74, 167–190. [Google Scholar] [CrossRef] [Green Version]
  31. Tang, W.; Zhao, L.; Liu, W.; Yan, B. Recent advance on detecting core-periphery structure: A survey. CCF Trans. Pervasive Comp. Interact. 2019, 1, 175–189. [Google Scholar] [CrossRef] [Green Version]
  32. Chakraborty, T.; Park, N.; Agarwal, A.; Subrahmanian, V.S. Ensemble Detection and Analysis of Communities in Complex Networks. ACM/IMS Trans. Data Sci. 2020, 1, 1–34. [Google Scholar] [CrossRef]
  33. Skorpil, V.; Stastny, J. Comparison of Learning Algorithms. In Proceedings of the 24th Biennial Symposium on Communications, Kingston, ON, Canada, 24–26 June 2008; IEEE: Piscataway, NJ, USA, 2008; pp. 231–234. [Google Scholar] [CrossRef]
  34. Yang, J.; Leskovec, J. Overlapping Communities Explain Core–Periphery Organization of Networks. Proc. IEEE 2014, 102, 1892–1902. [Google Scholar] [CrossRef]
  35. Gamble, J.; Chintakunta, H.; Krim, H. Emergence of core-periphery structure from local node dominance in social networks. In Proceedings of the 23rd European Signal Processing Conference (EUSIPCO), Nice, France, 31 August–4 September 2015; IEEE: Piscataway, NJ, USA, 2015; pp. 1910–1914. [Google Scholar] [CrossRef] [Green Version]
  36. Verma, T.; Russmann, F.; Araújo, N. Emergence of core–peripheries in networks. Nat. Commun. 2016, 7, 10441. [Google Scholar] [CrossRef] [PubMed]
  37. Yan, B.; Liu, Y.; Liu, J.; Cai, Y.; Su, H.; Zheng, H. From the Periphery to the Center: Information Brokerage in an Evolving Network. In Proceedings of the Twenty-Seventh International Joint Conference on Artificial Intelligence (IJCAI-18), Stockholm, Sweden, 13–19 June 2018; AAAI Press: Palo Alto, CA, USA, 2018; pp. 3912–3918. Available online: https://www.ijcai.org/Proceedings/2018/0544.pdf (accessed on 15 February 2021).
  38. Sohn, Y.; Choi, J.K.; Ahn, T.K. Core–periphery segregation in evolving prisoner’s dilemma networks. J. Complex Netw. 2020, 8, cnz021. [Google Scholar] [CrossRef]
  39. Zhang, B.; Fan, S.J.; Li, C.; Zheng, X.D.; Bao, J.Z.; Cressman, R.; Tao, Y. Opting out against defection leads to stable coexistence with cooperation. Sci. Rep. 2016, 6, 35902. [Google Scholar] [CrossRef] [Green Version]
  40. Godsil, C.; Royle, G. Algebraic Graph Theory. In Graduate Texts in Mathematics; Springer: Berlin/Heidelberg, Germany, 2001; Volume 207. [Google Scholar]
  41. Chen, Y.; Zhao, Y.; Han, X. Characterization of Symmetry of Complex Networks. Symmetry 2019, 11, 692. [Google Scholar] [CrossRef] [Green Version]
  42. Garrido, A. Symmetry in Complex Networks. Symmetry 2011, 3, 1. [Google Scholar] [CrossRef] [Green Version]
  43. Xiao, Y.; Xiong, M.; Wang, W.; Wang, H. Emergence of symmetry in complex networks. Phys. Rev. 2008, 77, 6. [Google Scholar] [CrossRef] [Green Version]
  44. Sánchez-García, R.J. Exploiting symmetry in network analysis. Commun. Phys. 2020, 3, 87. [Google Scholar] [CrossRef]
  45. MacArthur, B.D.; Sánchez-García, R.J.; Anderson, J.W. Symmetry in complex networks. Discret. Appl. Math. 2008, 156, 3525–3531. [Google Scholar] [CrossRef] [Green Version]
  46. Fasino, D.; Rinaldi, F. A Fast and Exact Greedy Algorithm for the Core–Periphery Problem. Symmetry 2020, 12, 94. [Google Scholar] [CrossRef] [Green Version]
  47. Boyd, J.P.; Fitzgerald, W.J.; Mahutga, M.C.; Smith, D.A. Computing continuous core/periphery structures for social relations data with MINRES/SVD. Soc. Netw. 2010, 32, 125–137. [Google Scholar] [CrossRef]
  48. Smith, D.; Webb, B. Hidden symmetries in real and theoretical networks. Phys. A 2019, 514, 855–867. [Google Scholar] [CrossRef] [Green Version]
  49. Dehmer, M. Information Theory of Networks. Symmetry 2011, 3, 767–779. [Google Scholar] [CrossRef] [Green Version]
  50. MacArthur, B.; Anderson, J. Symmetry and Self-Organization in Complex Systems. arXiv 2008, arXiv:cond-mat/0609274v1. Available online: https://arxiv.org/abs/cond-mat/0609274 (accessed on 25 May 2021).
  51. Ruzzenenti, F.; Garlaschelli, D.; Basosi, R. Complex Networks and Symmetry II: Reciprocity and Evolution of World Trade. Symmetry 2010, 2, 1710–1744. [Google Scholar] [CrossRef] [Green Version]
  52. Avin, C.; Lotker, Z.; Peleg, D.; Pignolet, Y.A.; Turkel, I. Core-Periphery in Networks: An Axiomatic Approach. arXiv 2014, arXiv:1411.2242. Available online: https://arxiv.org/abs/1411.2242 (accessed on 25 May 2021).
  53. Fraiberger, S.P.; Sinatra, R.; Resch, M.; Riedl, C.; Barabási, A.L. Quantifying reputation and success in art. Science 2018, 362, 825–829. [Google Scholar] [CrossRef] [PubMed] [Green Version]
  54. Clauset, A.; Arbesman, S.; Larremore, D.B. Systematic inequality and hierarchy in faculty hiring networks. Sci. Adv. 2015, 1, e1400005. [Google Scholar] [CrossRef] [Green Version]
  55. Wang, Z.; Szolnoki, A.; Perc, M. Evolution of public cooperation on interdependent networks: The impact of biased utility functions. Europhys. Lett. 2012, 97, 48001. [Google Scholar] [CrossRef] [Green Version]
  56. McAuley, J.; Costa, L.; Caetano, T. Rich-club phenomenon across complex network hierarchies. Appl. Phys. Lett. 2007, 91, 084103. [Google Scholar] [CrossRef] [Green Version]
  57. Eungik, L. Strategic Interactions on Networks: An Experimental Approach; Working Paper Series No. 95; Institute of Economic Research, Seoul National University: Seoul, Korea, 2017. [Google Scholar]
  58. Izquierdo, L.R.; Izquierdo, S.; Vega-Redondo, F. Leave and let leave: A sufficient condition to explain the evolutionary emergence of cooperation. J. Econ. Dyn. Control. 2014, 46, 91–113. [Google Scholar] [CrossRef] [Green Version]
  59. Hayashi, N. From TIT-for-TAT to OUT-for-TAT. Soc. Theory Methods 1993, 8, 19–32. [Google Scholar]
  60. Hauk, E. Multiple prisoner’s dilemma games with (out) an outside option: An experimental study. Theory Decis. 2003, 54, 207–229. [Google Scholar] [CrossRef]
  61. Aktipis, C.A. Know when to walk away: Contingent movement and the evolution of cooperation. J. Theor. Biol. 2004, 231, 249–260. [Google Scholar] [CrossRef] [PubMed]
  62. Izquierdo, S.S.; Izquierdo, L.R.; Vega-Redondo, F. The option to leave: Conditional dissociation in the evolution of cooperation. J. Theor. Biol. 2010, 267, 76–84. [Google Scholar] [CrossRef] [PubMed] [Green Version]
  63. Barabási, A.L.; Albert, R. Emergence of scaling in random networks. Science 1999, 286, 509–512. [Google Scholar] [CrossRef] [PubMed] [Green Version]
  64. Santos, F.C.; Pacheco, J.M.; Lenaerts, T. Cooperation prevails when individuals adjust their social ties. PLoS Comput. Biol. 2006, 2, e140. [Google Scholar] [CrossRef]
  65. Skyrms, B.; Pemantle, R. A dynamic model of social network formation. Proc. Natl. Acad. Sci. USA 2000, 97, 9340–9346. [Google Scholar] [CrossRef] [PubMed] [Green Version]
  66. Huberman, B.A.; Glance, N.S. Evolutionary games and computer simulations. Proc. Natl. Acad. Sci. USA 1993, 90, 7716–7718. [Google Scholar] [CrossRef] [PubMed] [Green Version]
  67. Nowak, M.A. Five rules for the evolution of cooperation. Science 2006, 314, 1560–1563. [Google Scholar] [CrossRef] [Green Version]
  68. Sachs, J.; Mueller, U.; Wilcox, T.; Bull, J. The evolution of cooperation. Q. Rev. Biol. 2004, 79, 135–160. [Google Scholar] [CrossRef]
  69. Wu, J.; Zhao, C. Better immigration: Prisoner’s dilemma game with population change on dynamic network. Phys. A Stat. Mech. Appl. 2020, 556, 124692. [Google Scholar] [CrossRef]
  70. Hanaki, N.; Peterhansl, A.; Dodds, P.; Watts, D.J. Cooperation in evolving social networks. Manag. Sci. 2007, 53, 1036–1050. [Google Scholar] [CrossRef]
  71. Szabó, G.; Toke, C. Evolutionary prisoners dilemma game on a square lattice. Phys Rev E 1998, 58, 69. [Google Scholar] [CrossRef] [Green Version]
  72. Emily, M.; Michelle, G.; Newman, M. Structure of growing social networks. Phys. Rev. E 2001, 64, 046132. [Google Scholar]
  73. Bergstrom, T.C. Evolution of social behavior: Individual and group selection. J. Econ. Perspect. 2002, 16, 67–88. [Google Scholar] [CrossRef] [Green Version]
  74. Jiang, L.L.; Li, W.J.; Wang, Z. Multiple effects of social influence on cooperation in interdependent network games. Sci. Rep. 2015, 5, 14657. [Google Scholar] [CrossRef] [Green Version]
  75. Newman, M. Communities, modules and large-scale structure in networks. Nat. Phys. 2012, 8, 25–31. [Google Scholar] [CrossRef]
  76. Guimera, R.; Sales-Pardo, M.; Amaral, L.A.N. Modularity from fluctuations in random graphs and complex networks. Phys. Rev. E 2004, 70, 025101. [Google Scholar] [CrossRef] [PubMed] [Green Version]
  77. Blondel, V.D.; Guillaume, J.L.; Lambiotte, R.; Lefebvre, E. Fast unfolding of communities in large networks. J. Stat. Mech. Theory Exp. 2008, P10008. [Google Scholar] [CrossRef] [Green Version]
  78. Vieira, V.D.; Xavier, C.R.; Evsukoff, A.G. A comparative study of overlapping community detection methods from the perspective of the structural properties. Appl. Netw. Sci. 2020, 5, 51. [Google Scholar] [CrossRef]
  79. Fonseca, V.D.; Xavier, C.R.; Ebecken, N.F.F.; Evsukoff, A.G. Performance Evaluation of Modularity Based Community Detection Algorithms in Large Scale Networks. Math. Probl. Eng. 2014. [Google Scholar] [CrossRef]
  80. Borgatti, S.P.; Everett, M.G. Models of core/periphery structures. Soc. Netw. 2000, 21, 375–395. [Google Scholar] [CrossRef]
  81. Kitsak, M.; Gallos, L.; Havlin, S. Identification of influential spreaders in complex networks. Nat. Phys. 2010, 6, 888–893. [Google Scholar] [CrossRef] [Green Version]
  82. Carmi, S.; Havlin, S.; Kirkpatrick, S.; Shavitt, Y.; Shir, E. A model of Internet topology using k-shell decomposition. Proc. Natl. Acad. Sci. USA 2007, 104, 11150–11154. [Google Scholar] [CrossRef] [Green Version]
  83. Alvarez-Hamelin, J.I.; Dallásta, L.; Barrat, A.; Vespignani, A. Large scale networks fingerprinting and visualization using the k-core decomposition. Adv. Neural Inform. Process. Syst. 2006, 18, 41–51. [Google Scholar]
  84. Holme, P. Detecting degree symmetries in networks. Phys. Rev. E Stat. Nonlin. Soft Matter Phys. 2006, 74, 036107. [Google Scholar] [CrossRef] [Green Version]
  85. Nowak, M.A.; Sigmund, K. A strategy of win-stay, lose-shift that outperforms tit-for-tat in the prisoner’s dilemma game. Nature 1993, 364, 56. [Google Scholar] [CrossRef]
  86. Hayashi, N.; Yamagishi, T. Selective play: Choosing partners in an uncertain world. Pers. Soc. Psychol. Rev. 1998, 2, 276–289. [Google Scholar] [CrossRef] [PubMed]
  87. Moresi, S.; Salop, S. A few righteous men: Imperfect information, quit-for-tat, and critical mass in the dynamics of cooperation. In Economics for an Imperfect World: Essays in Honor of Joseph E. Stiglitz; Arnott, R., Greenwald, B., Kanbur, R., Nalebuff, B., Eds.; MIT Press: Cambridge, MA, USA, 2003. [Google Scholar]
  88. Dugatkin, L.A.; Wilson, D.S. Rover: A strategy for exploiting cooperators in a patchy environment. Am. Nat. 1991, 138, 687–701. [Google Scholar] [CrossRef]
Figure 1. Graphical representation of the structure (adjacency matrix) of the network in three selected rounds. (ac) shows a case of the development of the relationship structure among the players in a network. The simulation model allows players to terminate a relationship with another player who defects and optimizes the number of newly addressed players. (df) shows the case of the structure’s development when the simulation model does not include ending the relationship with a player who defects.
Symmetry 13 01214 g001aSymmetry 13 01214 g001b
Figure 2. Core-periphery subgraphs degree distributions (in rounds of the repeated PD game: 10 (rounds), 40 (middle) and 70 (right)). The evolution of the node degrees corresponds to Figure 1a–c.
Symmetry 13 01214 g002
Figure 3. Fraction of players with a specific strategy in the entire population in individual rounds.
Symmetry 13 01214 g003
Figure 4. (a) Comparison of the development of the modularity index for simulations that include the OFT strategy and do not include the OFT strategy. (b) Correlation between player coreness (ks) and RC (the ratio of players with strategy C) in the case that the simulation model includes the OFT strategy and in the case that the simulation model does not include the OFT strategy.
Symmetry 13 01214 g004
Figure 5. The probability of continuation of the relationship to the next round for players with specific values of ks achieved in the past rounds (a). (b) The probability of the continuation of the relationship between two players as a function of the players’ strategy in the current round (players with the OFT strategy).
Symmetry 13 01214 g005
Figure 6. Correlation between the relative number of nodes with a given coreness (ks) and their income. The relative number of nodes with a given coreness (ks) is provided by the ratio of nodes with a given coreness (ks) to the total number of nodes.
Symmetry 13 01214 g006
Figure 7. (a) The approximative symmetry coefficient for our network in different rounds. (b) The Pearson correlation coefficient between paired players with various strategies.
Symmetry 13 01214 g007
Table 1. The payoff matrix of a 2-player, 2-strategy game.
i/jCD
CR, RS, T
DT, SP, P
Publisher’s Note: MDPI stays neutral with regard to jurisdictional claims in published maps and institutional affiliations.

