
Optimal Placement of Distributed Photovoltaic Systems and Electric Vehicle Charging Stations Using Metaheuristic Optimization Techniques


 , and
, and 
Abstract
:1. Introduction
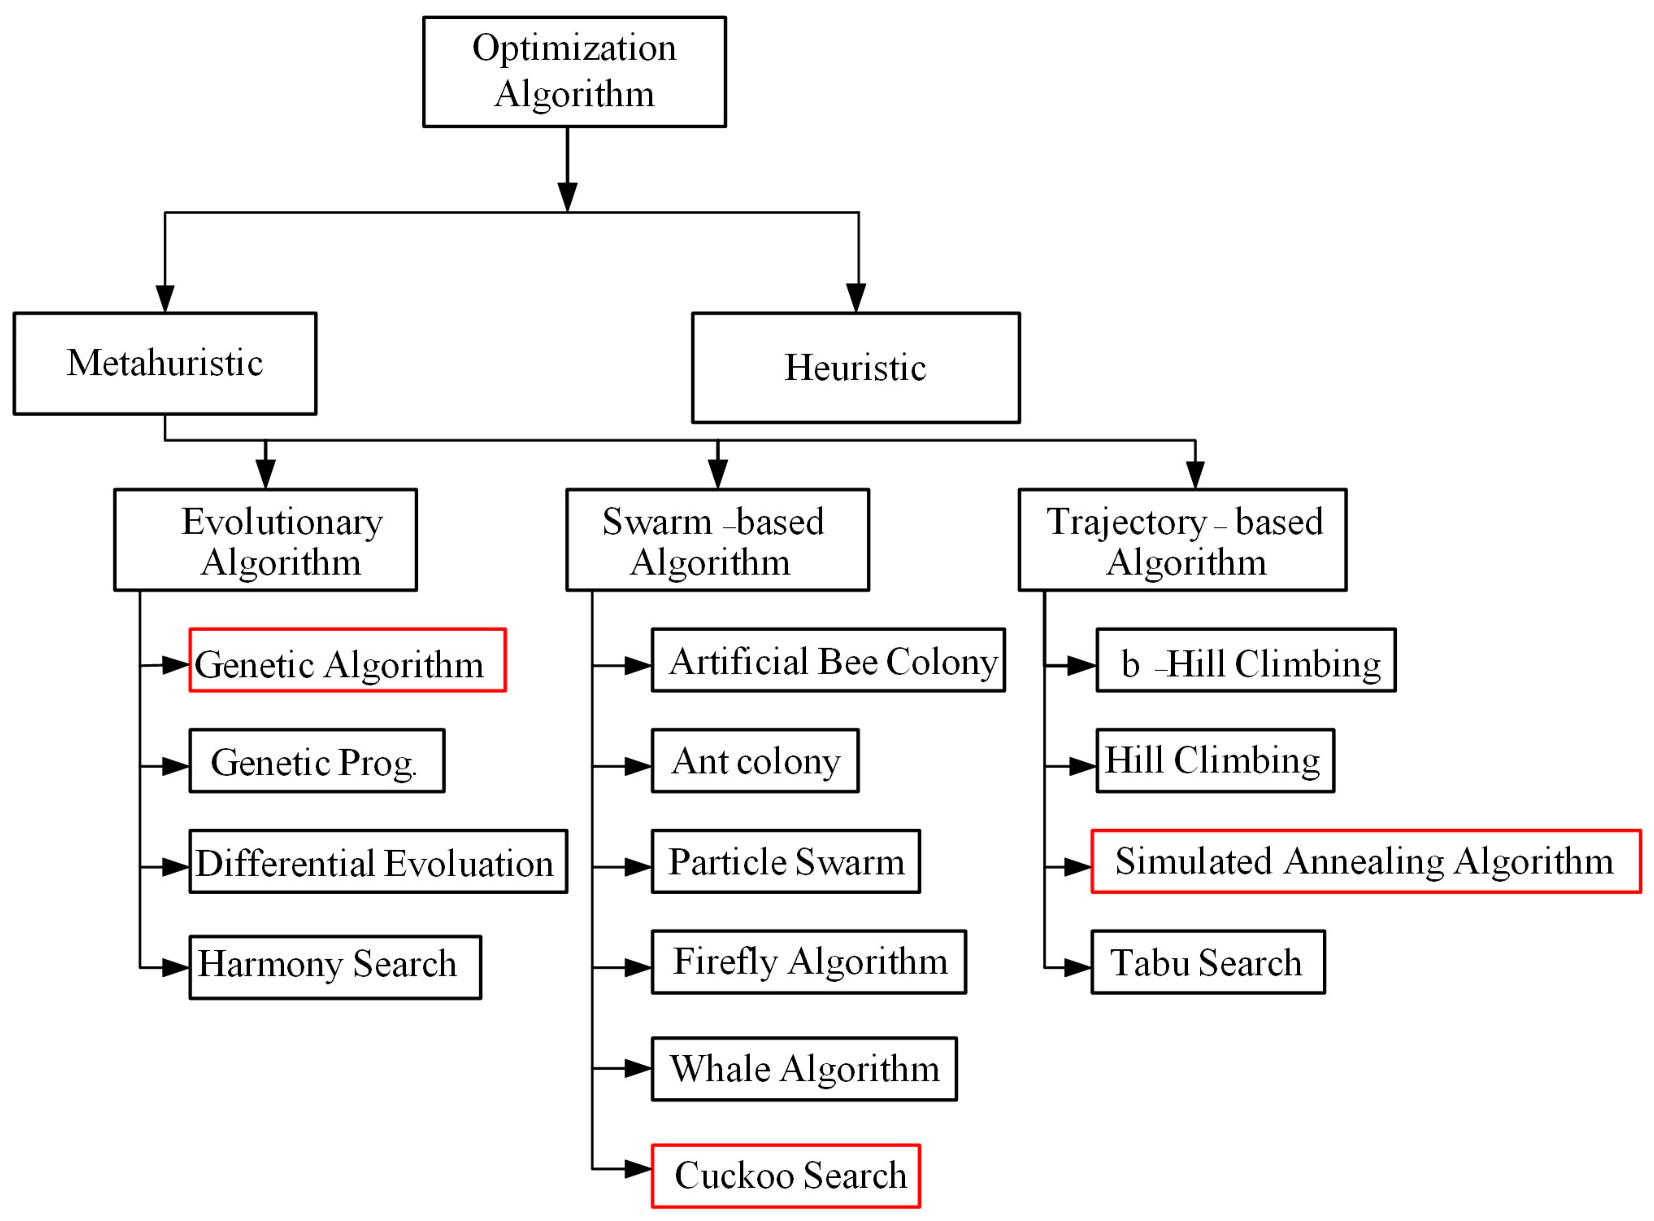
2. Optimization Technique (OT) and Power Flow Analysis of FCSs and PV Placement Formula
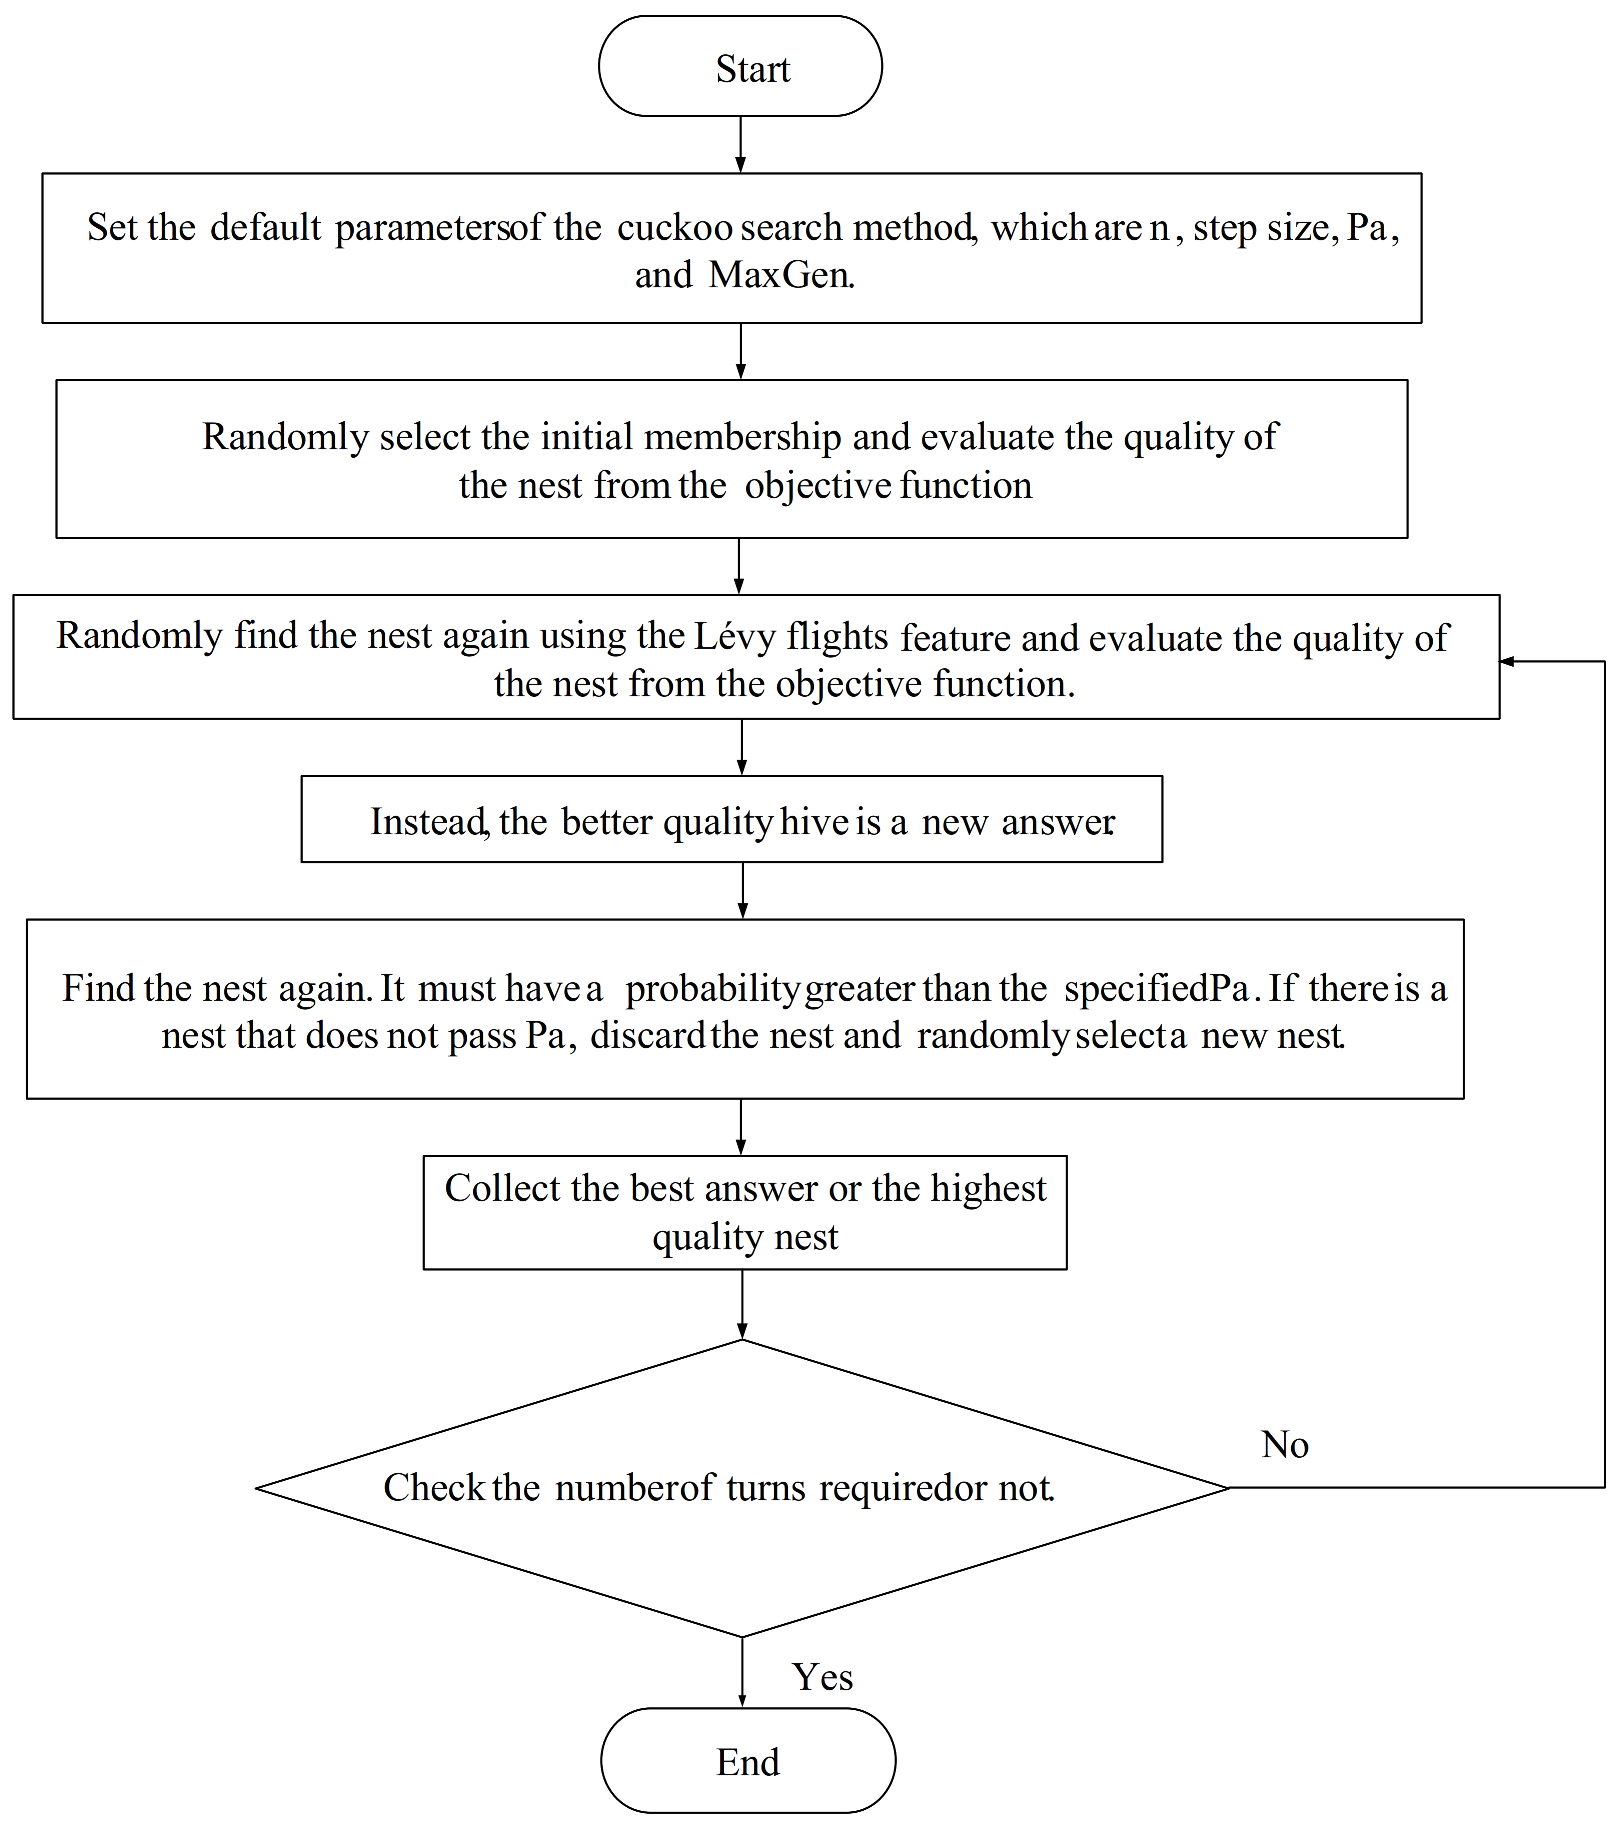
2.1. Cuckoo Search Algorithm (CSA)
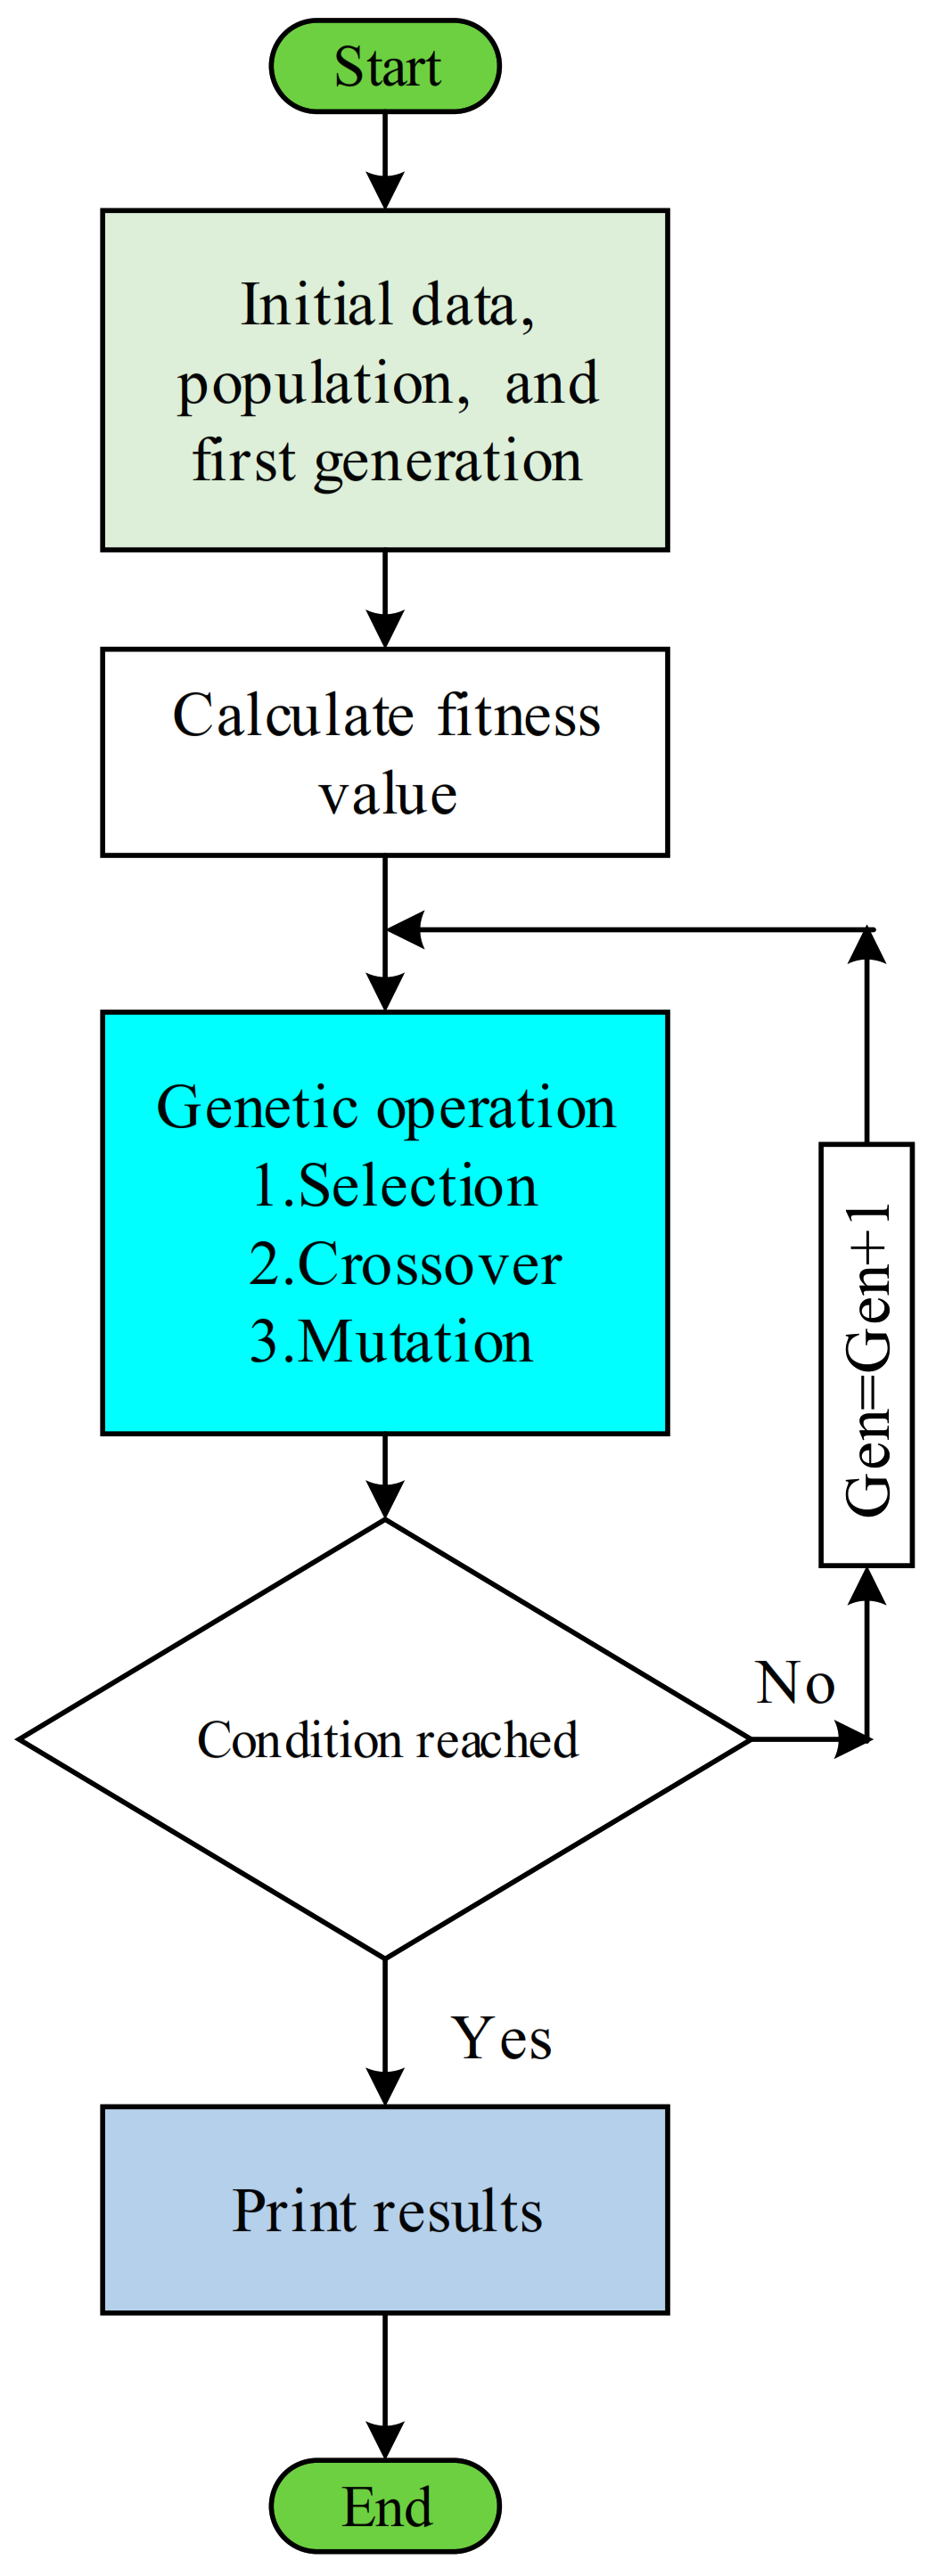
2.2. Genetic Algorithm (GA)
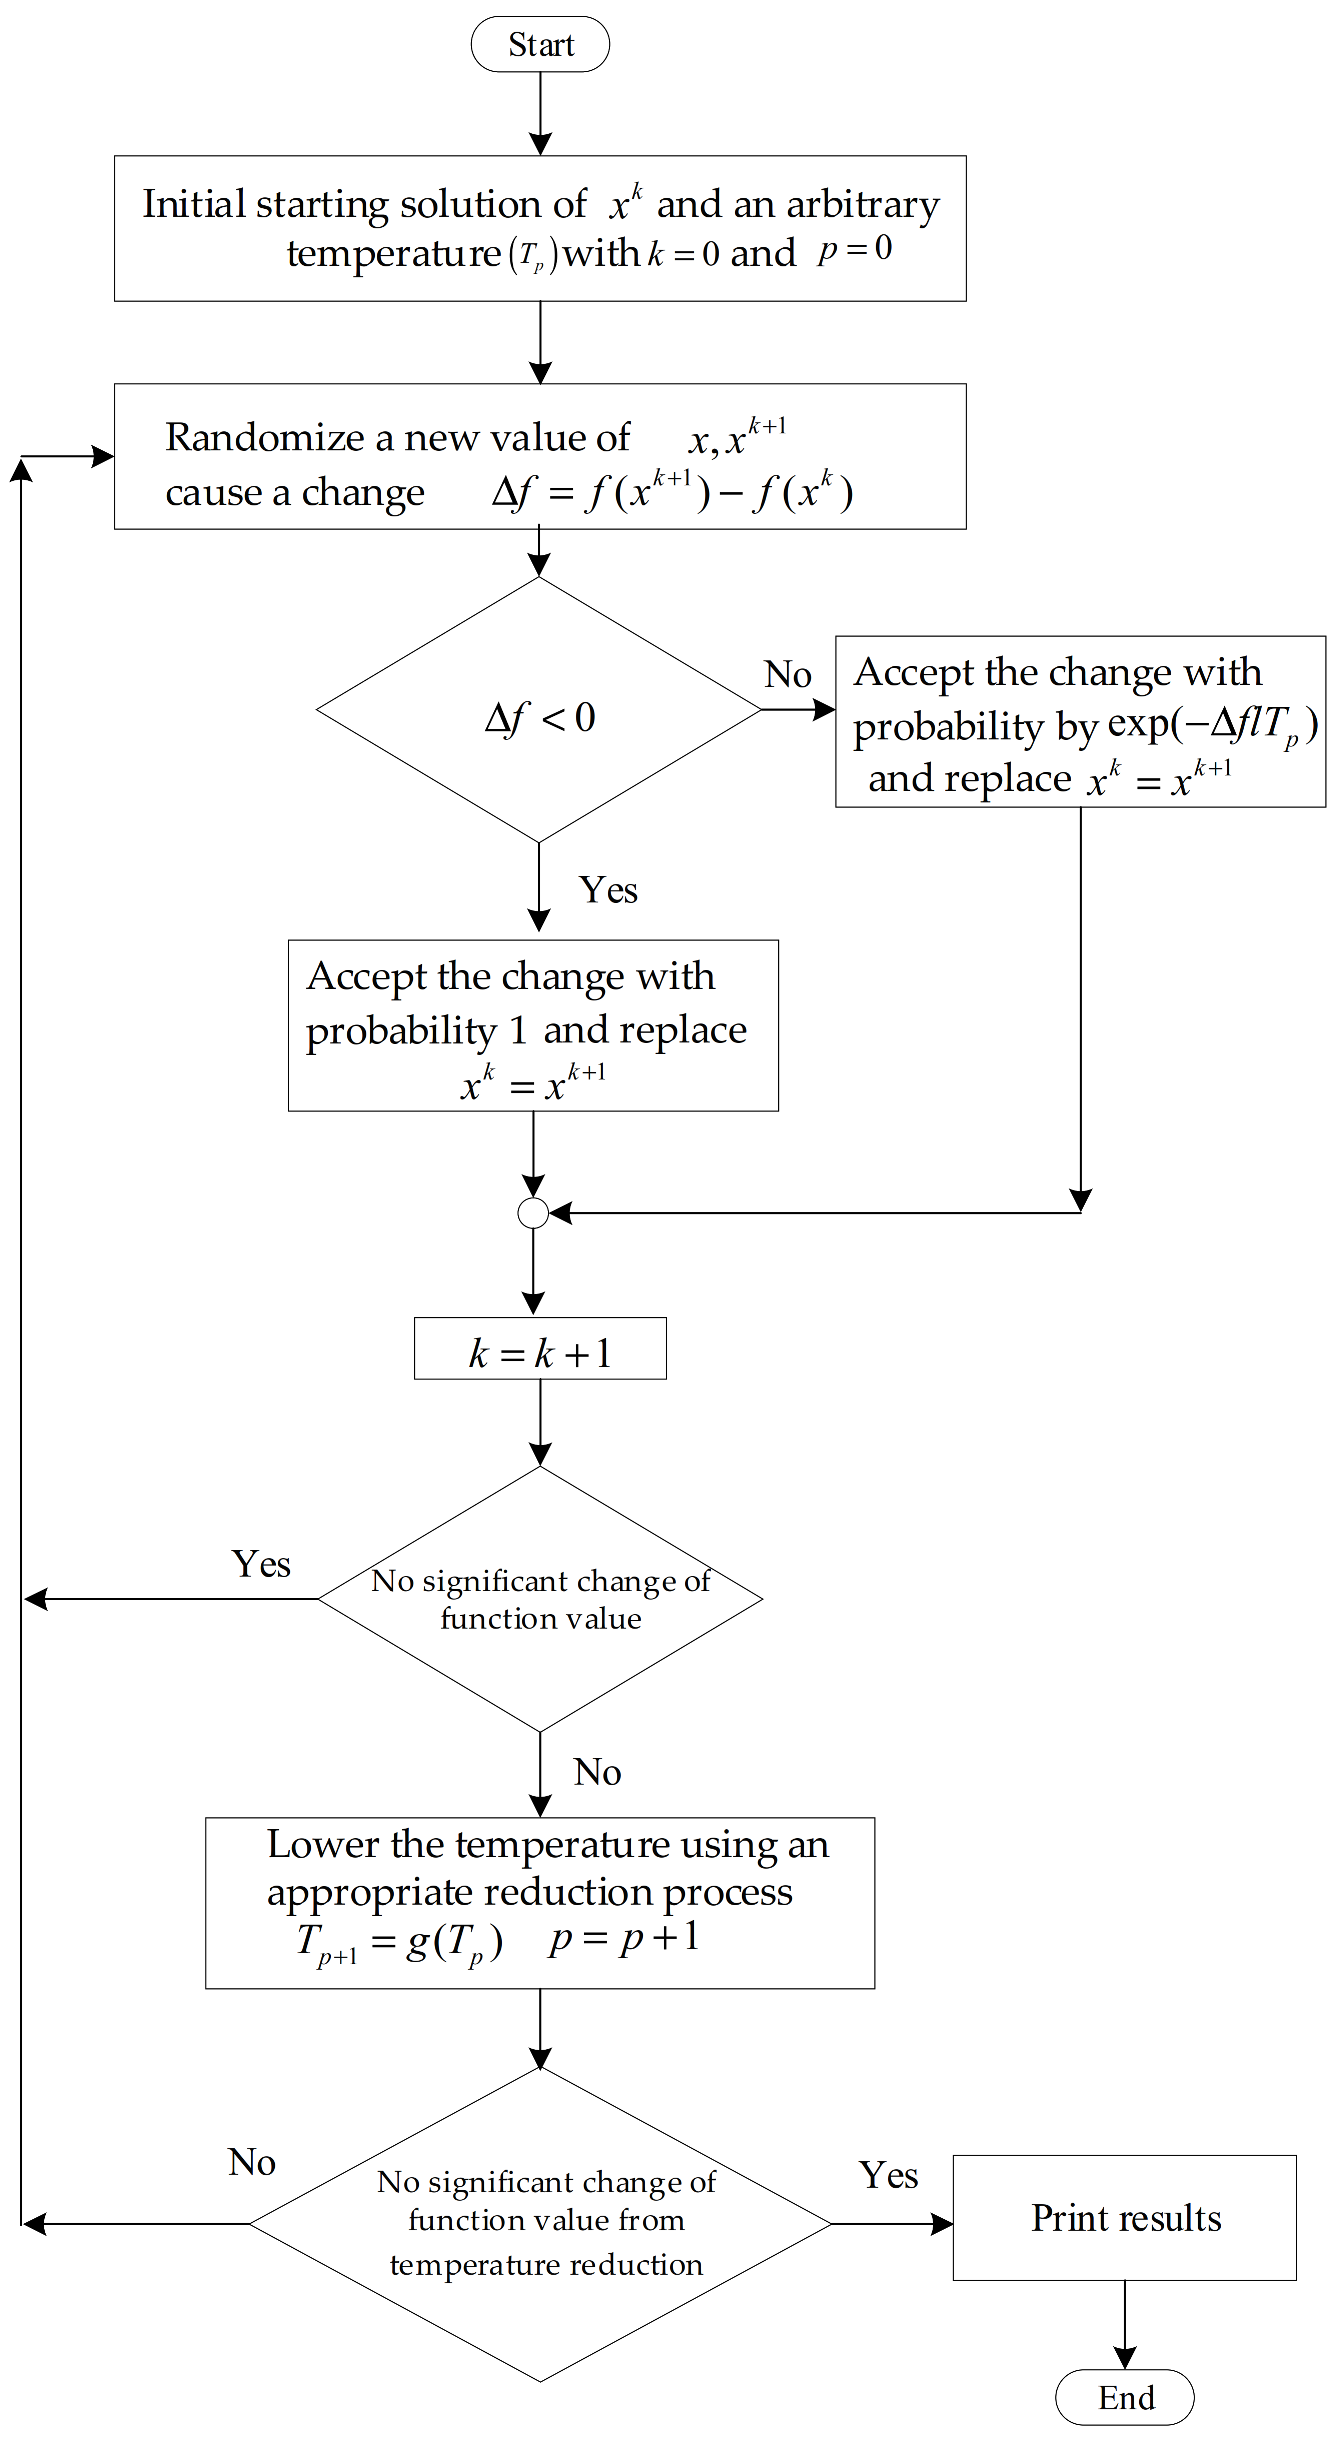
2.3. Simulated Annealing Algorithm (SAA)
2.4. Fast-Charging Station Load (FCS) Modeling
2.5. Load Voltage Deviation (LVD)
2.6. Total Active Power Loss
2.7. Backward/Forward Sweep (BFS) Power Flow Analysis
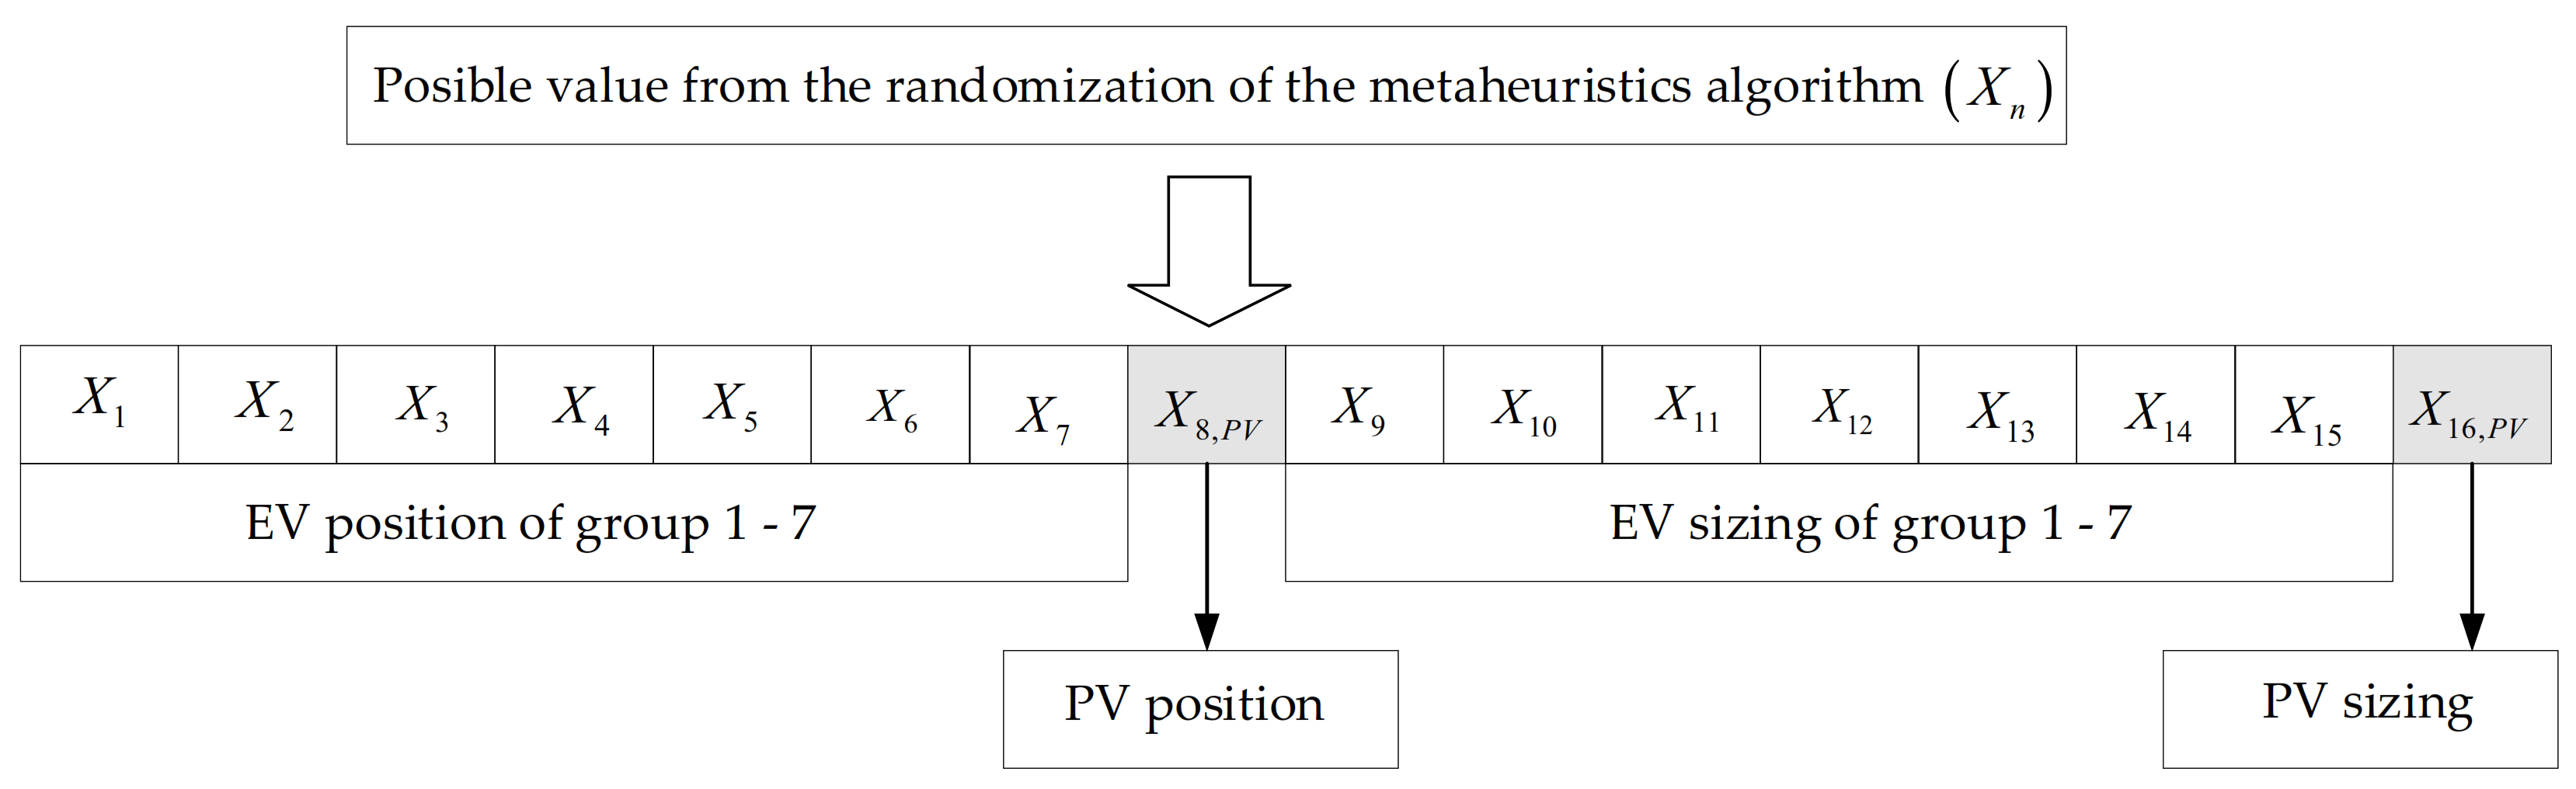
3. Methodology
4. Simulation and Results
5. Conclusions
Author Contributions
Funding
Institutional Review Board Statement
Informed Consent Statement
Data Availability Statement
Conflicts of Interest
References
- Kijewska, A.; Bluszcz, A. Analysis of greenhouse gas emissions in the European Union member states with the use of an agglomeration algorithm. J. Sustain. Min. 2016, 15, 133–142. [Google Scholar] [CrossRef]
- Yong, J.Y.; Ramachandaramurthy, V.K.; Tan, K.M.; Mithulananthan, N. A review on the state-of-the-art technologies of the electric vehicle, its impacts and prospects. Renew. Sustain. Energy Rev. 2015, 49, 365–385. [Google Scholar] [CrossRef]
- Li, Z.; Khajepour, A.; Song, J. A comprehensive review of the key technologies for pure electric vehicles. Energy 2019, 182, 824–839. [Google Scholar] [CrossRef]
- World Energy Council. World Energy Scenarios: Global Transport Scenarios 2050. Available online: https://www.worldenergy.ch/file/Publikationen/Aktuell/Global_Transport_Scenarios_2050.pdf (accessed on 31 October 2021).
- Rubino, L.; Capasso, C.; Veneri, O. Review on plug-in electric vehicle charging architectures integrated with distributed energy sources for sustainable mobility. Appl. Energy 2017, 207, 438–464. [Google Scholar] [CrossRef]
- Shaukat, N.; Khan, B.; Ali, S.M.; Mehmood, C.A.; Khan, J.; Farid, U.; Majid, M.; Anwar, S.M. A survey on electric vehicle transportation within a smart grid system. Renew. Sustain. Energy Rev. 2018, 81, 1329–1349. [Google Scholar] [CrossRef]
- Tomaszewska, A.; Chu, Z.; Feng, X.; O’Kane, S.; Liu, X.; Chen, J.; Ji, C.; Endler, E.; Li, R.; Liu, L.; et al. Lithiumion battery fast charging: A review. Transportation 2019, 1, 100011. [Google Scholar]
- Du, J.; Liu, Y.; Mo, X.; Li, Y.; Li, J.; Wu, X.; Ouyang, M. Impact of high-power charging on the durability and safety of lithium batteries used in long-range battery electric vehicles. Appl. Energy 2019, 255, 113793. [Google Scholar] [CrossRef]
- Lulhe, A.M.; Date, T.N. A technology review paper for drives used in the electrical vehicle (EV) & hybrid electrical vehicles (HEV). In Proceedings of the 2015 International Conference on Control, Instrumentation, Communication and Computational Technologies (ICCICCT), Kumaracoil, India, 18–19 December 2015; pp. 632–636. [Google Scholar]
- Deb, S.; Tammi, K.; Kalita, K.; Mahanta, P. Impact of Electric Vehicle Charging Station Load on Distribution Network. Energies 2018, 11, 178. [Google Scholar] [CrossRef] [Green Version]
- Clement-Nyns, K.; Haesen, E.; Driesen, J. The Impact of Charging Plug-In Hybrid Electric Vehicles on a Residential Distribution Grid. IEEE Trans. Power Syst. 2010, 25, 371–380. [Google Scholar] [CrossRef] [Green Version]
- Dharmakeerthi, C.H.; Mithulananthan, N.; Saha, T.K. Impact of electric vehicle fast-charging on power system voltage stability. Int. J. Electr. Power Energy Syst. 2014, 57, 241–249. [Google Scholar] [CrossRef]
- Farkoush, S.G.; Kim, C.H.; Rhee, S.B. THD Reduction of Distribution System Based on ASRFC and HVC Method for SVC under EV Charger Condition for Power Factor Improvement. Symmetry 2016, 8, 156. [Google Scholar] [CrossRef]
- Kim, M.; Kim, J.; Bae, S. Design of a Sustainable and Efficient Transportation Station (SETS) Based on Renewable Sources and Efficient Electric Drives. Symmetry 2016, 8, 146. [Google Scholar] [CrossRef] [Green Version]
- Prabpal, P.; Kongjeen, Y.; Bhumkittipich, K. Optimal Battery Energy Storage System Based on VAR Control Strategies Using Particle Swarm Optimization for Power Distribution System. Symmetry 2021, 13, 1692. [Google Scholar] [CrossRef]
- Kongjeen, Y.; Bhumkittipich, K.; Mithulananthan, N.; Amiri, I.S.; Yupapin, P. A modified backward and forward sweep method for microgrid load flow analysis under different electric vehicle load mathematical models. Electr. Power Syst. Res. 2019, 168, 46–54. [Google Scholar] [CrossRef]
- Nizam, M.; Wicaksono, F.X.R. Design and Optimization of Solar, Wind, and Distributed Energy Resource (DER) Hybrid Power Plant for Electric Vehicle (EV) Charging Station in Rural Area. In Proceedings of the 5th International Conference on Electric Vehicular Technology (ICEVT), Surakarta, Indonesia, 30–31 October 2018; pp. 41–45. [Google Scholar]
- Ahmadi, L.; Croiset, E.; Elkamel, A.; Douglas, P.; Unbangluang, W.; Entchev, E. Impact of PHEVs Penetration on Ontario’s Electricity Grid and Environmental Considerations. Energies 2012, 5, 5019. [Google Scholar] [CrossRef]
- Shukla, A.; Verma, K.; Kumar, R. Voltage-dependent modeling of fast-charging electric vehicle load considering battery characteristics. IET Electr. Syst. Transp. 2018, 8, 221–230. [Google Scholar] [CrossRef]
- Mohan, B.; Ramesh, M.V. Optimal DG placement under Standard Market Design using GA. In Proceedings of the 2012 International Conference on Emerging Trends in Electrical Engineering and Energy Management (ICETEEEM), Tamil Nadu, India, 13–15 December 2012; pp. 148–153. [Google Scholar]
- Shaheen, A.M.; Spea, S.R.; Farrag, S.M.; Abido, M.A. A review of meta-heuristic algorithms for reactive power planning problem. Ain Shams Eng. J. 2018, 9, 215–231. [Google Scholar] [CrossRef] [Green Version]
- Abdmouleh, Z.; Gastli, A.; Ben-Brahim, L.; Haouari, M.; Al-Emadi, N.A. Review of optimization techniques applied for the integration of distributed generation from renewable energy sources. Renew. Energy 2017, 113, 266–280. [Google Scholar] [CrossRef]
- Zexi, D.; Feidan, H. Cuckoo search algorithm for solving numerical integration. In Proceedings of the IEEE International Conference on Cyber Technology in Automation, Control, and Intelligent Systems (CYBER), Shenyang, China, 8–12 June 2015; pp. 1508–1512. [Google Scholar]
- Wang, X.; Gao, X.; Wang, Z.; Ma, C.; Song, Z. A Combined Model Based on EOBL-CSSA-LSSVM for Power Load Forecasting. Symmetry 2021, 13, 1579. [Google Scholar] [CrossRef]
- El-Naggar, K.M.; AlRashidi, M.R.; AlHajri, M.F.; Al-Othman, A.K. Simulated Annealing algorithm for photovoltaic parameters identification. Solar Energy 2012, 86, 266–274. [Google Scholar] [CrossRef]
- Dharmakeerthi, C.H.; Mithulananthan, N.; Atputharajah, A. Development of dynamic EV load model for power system oscillatory stability studies. In Proceedings of the 2014 Australasian Universities Power Engineering Conference (AUPEC), Perth, Australia, 28 September–1 October 2014; pp. 1–6. [Google Scholar]
- Kongjeen, Y.; Yenchamchalit, K.; Bhumkittipich, K. Optimal Sizing and Placement of Solar Powered Charging Station under EV loads Penetration using Artificial Bee Colony Technique. In Proceedings of the The 2018 International Power Electronics Conference (IPEC2018), TOKI MESSE Niigata Convention Center Japan, Niigata, Japan, 20–24 May 2018. [Google Scholar]
- Kongjeen, Y.; Bhumkittipich, K. Modeling of electric vehicle loads for power flow analysis, based on PSAT. In Proceedings of the 2016 13th International Conference on Electrical Engineering/Electronics, Computer, Telecommunications and Information Technology (ECTI-CON), Mai, Thailand, 28 June–1 July 2016; pp. 1–6. [Google Scholar]


| Device Specification | |
|---|---|
| Processer | Intel® CoreTM i7 8750 CPU @ 2.20 GHz |
| Installed RAM | 16.0 GB |
| Hard disk | 1 TB |
| GPU | GEFORCE GTX1050 Ti |
| Parameters | GA | CSA | SAA |
|---|---|---|---|
| Population size | 100 | 100 | - |
| Generation/iteration | 100 | 100 | 100 |
| Number of variables | 16 | ||
| - | 2, 2 | ||
| Initial temperature | - | - | 0.025 |
| Crossover | 0.8 | - | - |
| Mutation | 0.05 | - | - |
| PV sizing [min, max] (MW) | [1, 2] | ||
| Min. and max. of PV location | 2–33 | ||
| Group of EV possible position | Bus no. | ||
| Group 1 | 2, 4, 6, 9, 12 | ||
| Group 2 | 3, 5, 8, 11 | ||
| Group 3 | 7, 10, 13 | ||
| Group 4 | 14, 16, 18, 20 | ||
| Group 5 | 22, 24, 26, 28 | ||
| Group 6 | 15, 17, 19, 21, 23, 25 | ||
| Group 7 | 27, 29, 30, 31, 32, 33 | ||
| EV sizing for groups [min, max] (kW) | [50, 500] | ||
| Simulated Annealing Algorithm (SAA) | |||||||||||||
|---|---|---|---|---|---|---|---|---|---|---|---|---|---|
| Generation | 1 | 2 | 3 | 4 | 5 | 6 | 7 | 8 | 9 | 10 | Max | Min | Avg. |
| Time (s) | 10.76 | 9.34 | 8.82 | 8.24 | 8.65 | 8.49 | 8.51 | 7.98 | 8.64 | 9.09 | 10.76 | 7.98 | 8.85 |
| Min (LVD) | 0.042 | 0.037 | 0.045 | 0.053 | 0.040 | 0.037 | 0.036 | 0.037 | 0.064 | 0.035 | 0.064 | 0.035 | 0.043 |
| PV site | 4 | 6 | 4 | 9 | 6 | 6 | 6 | 6 | 7 | 6 | - | - | - |
| PV size (MW) | 1.637 | 1.061 | 1.354 | 1.134 | 1.277 | 1.032 | 1.006 | 1.140 | 1.162 | 1.119 | 1.637 | 1.006 | 1.192 |
| Total loss | 258.62 | 265.55 | 262.29 | 274.17 | 259.07 | 278.51 | 253.73 | 272.73 | 259.22 | 251.29 | 278.51 | 251.29 | 263.52 |
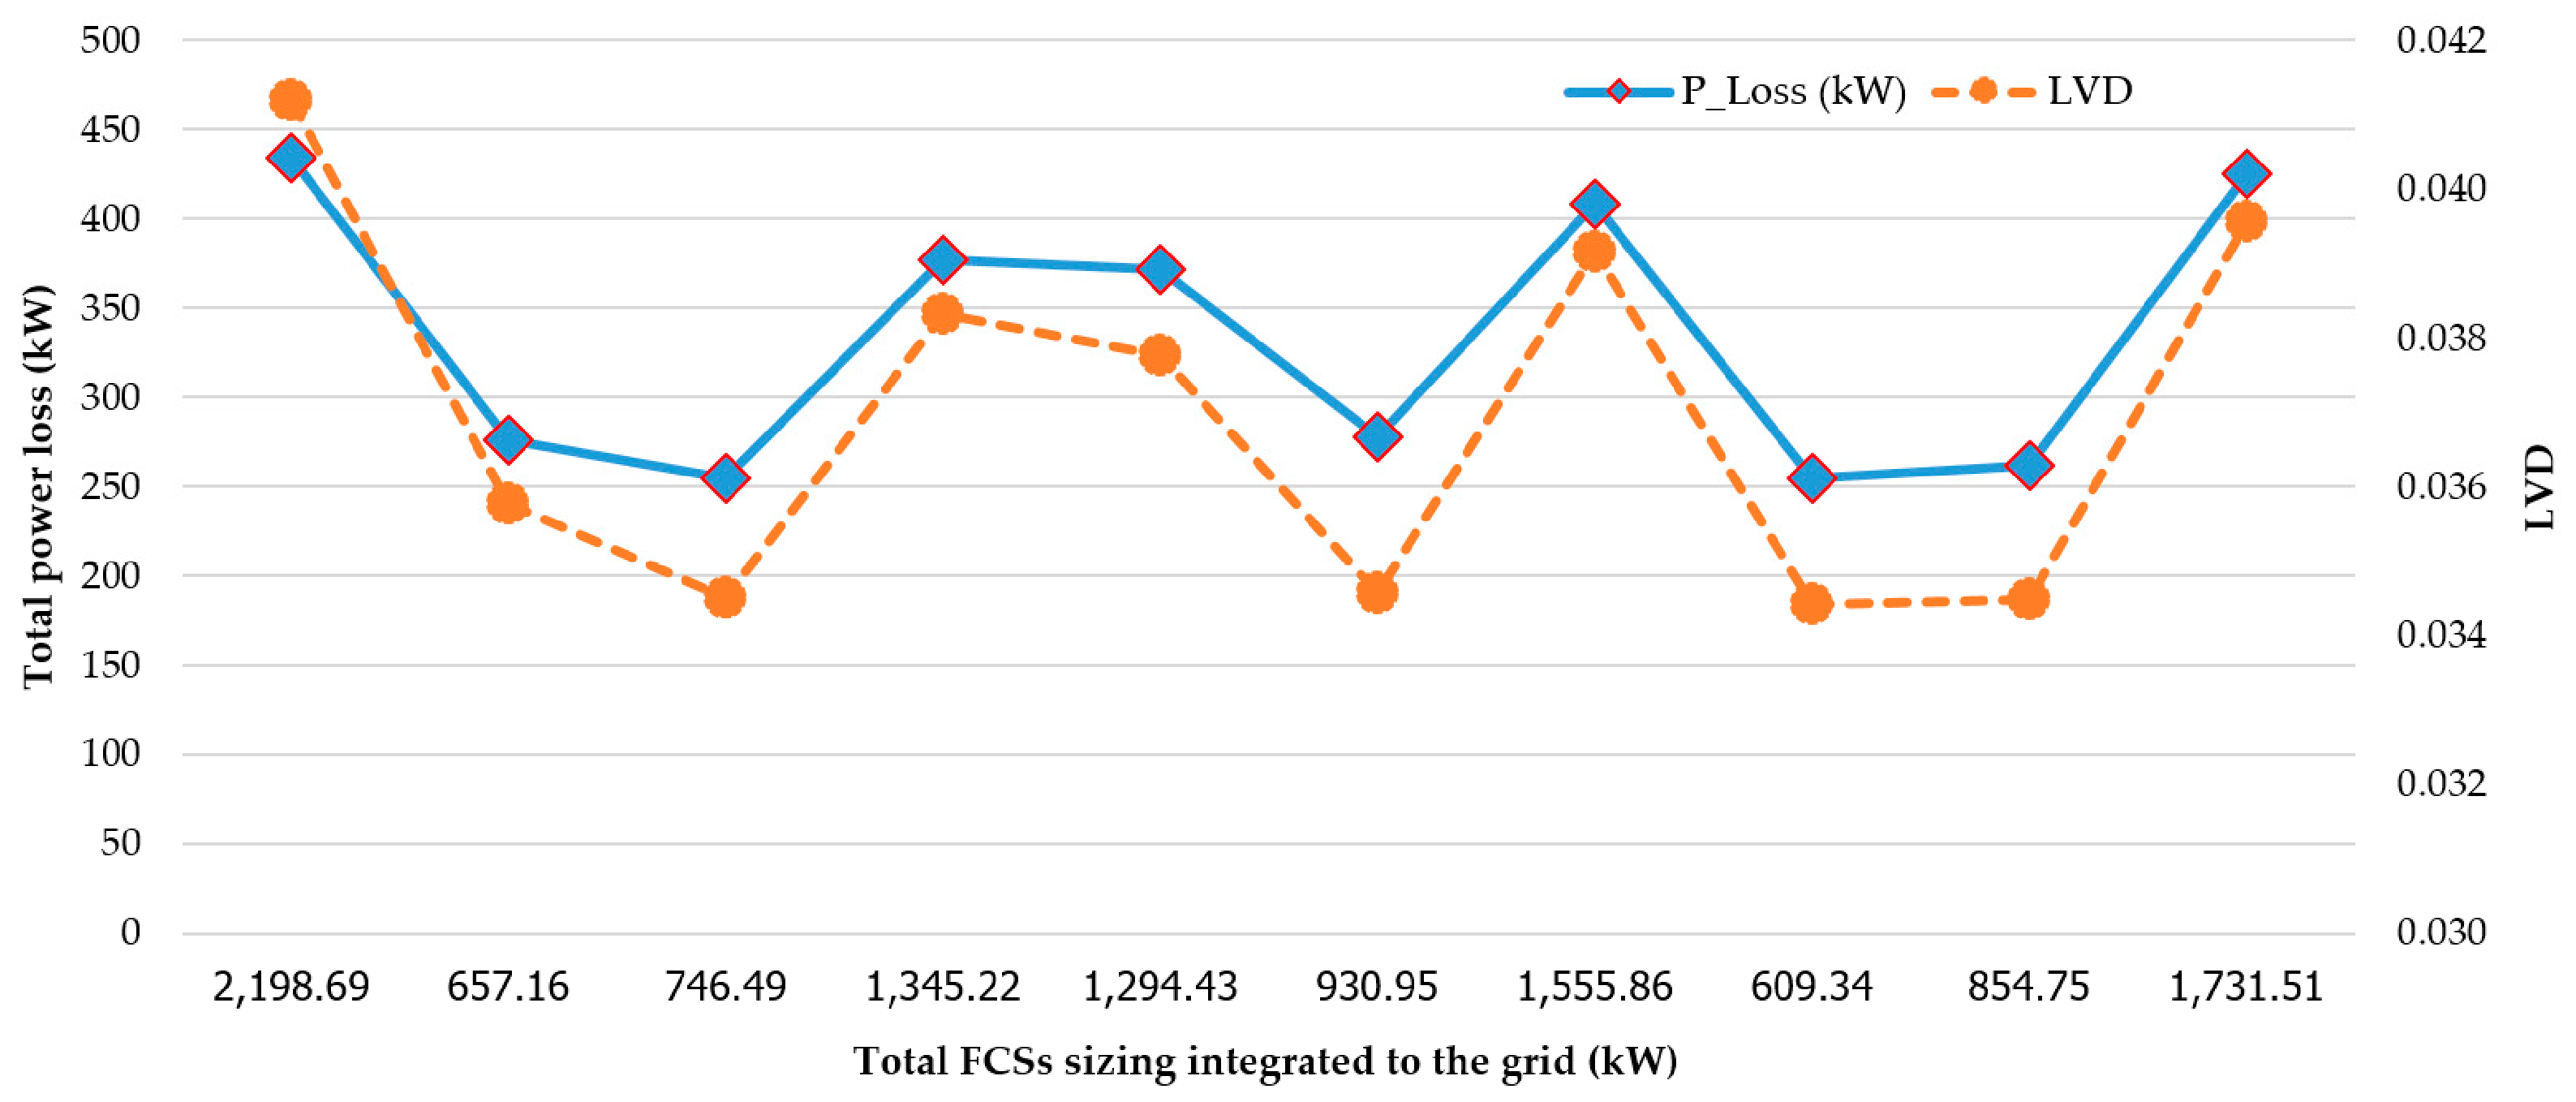
| Genetic Algorithm (GA) | |||||||||||||
| Generation | 1 | 2 | 3 | 4 | 5 | 6 | 7 | 8 | 9 | 10 | Max | Min | Avg. |
| Time (s) | 55.88 | 49.42 | 49.28 | 33.91 | 52.29 | 49.21 | 52.26 | 46.46 | 48.46 | 45.98 | 55.88 | 33.91 | 48.31 |
| Min (LVD) | 0.041 | 0.036 | 0.035 | 0.038 | 0.038 | 0.035 | 0.039 | 0.034 | 0.034 | 0.040 | 0.041 | 0.034 | 0.037 |
| PV site | 9 | 6 | 6 | 9 | 9 | 6 | 9 | 6 | 6 | 9 | - | - | - |
| PV size (MW) | 1.097 | 1.152 | 1.060 | 1.025 | 1.020 | 1.083 | 1.070 | 1.094 | 1.045 | 1.081 | 1.152 | 1.020 | 1.073 |
| Total loss | 434.29 | 275.72 | 254.81 | 377.35 | 372.03 | 277.73 | 408.41 | 254.32 | 261.98 | 425.53 | 434.29 | 254.32 | 334.22 |
| Cuckoo Search Algorithm (CSA) | |||||||||||||
| Generation | 1 | 2 | 3 | 4 | 5 | 6 | 7 | 8 | 9 | 10 | Max | Min | Avg. |
| Time (s) | 62.04 | 58.12 | 56.56 | 55.54 | 59.03 | 58.93 | 59.63 | 59.17 | 59.30 | 59.64 | 62.04 | 55.54 | 58.80 |
| Min (LVD) | 0.024 | 0.022 | 0.029 | 0.022 | 0.023 | 0.023 | 0.029 | 0.022 | 0.024 | 0.020 | 0.029 | 0.020 | 0.024 |
| PV site | 15 | 17 | 15 | 15 | 12 | 15 | 12 | 15 | 15 | 17 | - | - | - |
| PV size (MW) | 0.293 | 0.197 | 0.311 | 0.272 | 0.302 | 0.282 | 0.338 | 0.276 | 0.289 | 0.188 | 0.338 | 0.188 | 0.275 |
| Total loss | 195.68 | 193.35 | 191.52 | 191.94 | 191.94 | 191.83 | 193.90 | 194.02 | 191.75 | 193.06 | 195.68 | 191.52 | 192.90 |
| Simulated Annealing Algorithm (SAA) | |||||||||
|---|---|---|---|---|---|---|---|---|---|
| Posi.1 | Posi.2 | Posi.3 | Posi.4 | Posi.5 | Posi.6 | Posi.7 | Avg. | PV | |
| FCS best position (bus no.) | 2 | 3 | 7 | 22 | 24 | 15 | 27, 30 | - | 6 |
| Best hit counter | 4 | 5 | 5 | 4 | 6 | 5 | 3 | - | 6 |
| % | 40 | 50 | 50 | 40 | 60 | 50 | 30 | 45.71 | 60 |
| Genetic Algorithm (GA) | |||||||||
| Posi.1 | Posi.2 | Posi.3 | Posi.4 | Posi.5 | Posi.6 | Posi.7 | Avg. | PV | |
| FCS best position (bus no.) | 2 | 3 | 13 | 14 | 28 | 15 | 27 | - | 6,9 |
| Best hit counter | 5 | 10 | 9 | 8 | 8 | 10 | 10 | - | 5 |
| % | 50 | 100 | 90 | 80 | 80 | 100 | 100 | 85.71 | 50 |
| Cuckoo Search Algorithm(CSA) | |||||||||
| Posi.1 | Posi.2 | Posi.3 | Posi.4 | Posi.5 | Posi.6 | Posi.7 | Avg. | PV | |
| FCS best position (bus no.) | 2 | 3 | 10 | 14, 16 | 26, 28 | 15 | 27, 33 | - | 15 |
| Best hit counter | 3 | 4 | 5 | 4 | 4 | 8 | 3 | - | 6 |
| % | 30 | 40 | 50 | 40 | 40 | 80 | 30 | 44.29 | 60 |
| Sizing of FCSs 1–7 | |||||||||
|---|---|---|---|---|---|---|---|---|---|
| FCS1 (kW) | FCS2 (kW) | FCS3 (kW) | FCS4 (kW) | FCS5 (kW) | FCS6 (kW) | FCS7 (kW) | Total_FCS (kW) | ||
| SA | Max | 133.79 | 111.91 | 106.37 | 149.52 | 97.62 | 85.66 | 105.85 | 571.22 |
| Min | 52.05 | 50.00 | 51.60 | 50.00 | 50.00 | 52.14 | 54.87 | 386.36 | |
| Avg. | 72.16 | 67.15 | 65.68 | 69.35 | 68.38 | 62.66 | 77.06 | 482.44 | |
| GA | Max | 497.47 | 235.69 | 492.26 | 383.07 | 337.57 | 419.21 | 139.52 | 2198.69 |
| Min | 54.54 | 50.00 | 57.96 | 50.00 | 50.00 | 52.04 | 50.00 | 609.34 | |
| Avg. | 268.57 | 129.84 | 228.08 | 176.98 | 146.96 | 181.08 | 60.94 | 1192.44 | |
| CSA | Max | 500.00 | 500.00 | 500.00 | 500.00 | 137.88 | 251.18 | 50.00 | 1319.22 |
| Min | 50.00 | 50.00 | 50.00 | 50.01 | 50.00 | 50.00 | 50.00 | 447.16 | |
| Avg. | 232.38 | 135.56 | 121.67 | 212.71 | 64.13 | 86.95 | 50.00 | 903.40 | |
Publisher’s Note: MDPI stays neutral with regard to jurisdictional claims in published maps and institutional affiliations. |
© 2021 by the authors. Licensee MDPI, Basel, Switzerland. This article is an open access article distributed under the terms and conditions of the Creative Commons Attribution (CC BY) license (https://creativecommons.org/licenses/by/4.0/).
Share and Cite
Yenchamchalit, K.; Kongjeen, Y.; Prabpal, P.; Bhumkittipich, K. Optimal Placement of Distributed Photovoltaic Systems and Electric Vehicle Charging Stations Using Metaheuristic Optimization Techniques. Symmetry 2021, 13, 2378. https://doi.org/10.3390/sym13122378
Yenchamchalit K, Kongjeen Y, Prabpal P, Bhumkittipich K. Optimal Placement of Distributed Photovoltaic Systems and Electric Vehicle Charging Stations Using Metaheuristic Optimization Techniques. Symmetry. 2021; 13(12):2378. https://doi.org/10.3390/sym13122378
Chicago/Turabian StyleYenchamchalit, Kulsomsup, Yuttana Kongjeen, Prakasit Prabpal, and Krischonme Bhumkittipich. 2021. "Optimal Placement of Distributed Photovoltaic Systems and Electric Vehicle Charging Stations Using Metaheuristic Optimization Techniques" Symmetry 13, no. 12: 2378. https://doi.org/10.3390/sym13122378
APA StyleYenchamchalit, K., Kongjeen, Y., Prabpal, P., & Bhumkittipich, K. (2021). Optimal Placement of Distributed Photovoltaic Systems and Electric Vehicle Charging Stations Using Metaheuristic Optimization Techniques. Symmetry, 13(12), 2378. https://doi.org/10.3390/sym13122378