
Modeling Compressive Strength of Eco-Friendly Volcanic Ash Mortar Using Artificial Neural Networking

 ,
,  , , and
Abstract
:1. Introduction
2. Materials and Methods
2.1. Experimental
2.2. Modeling
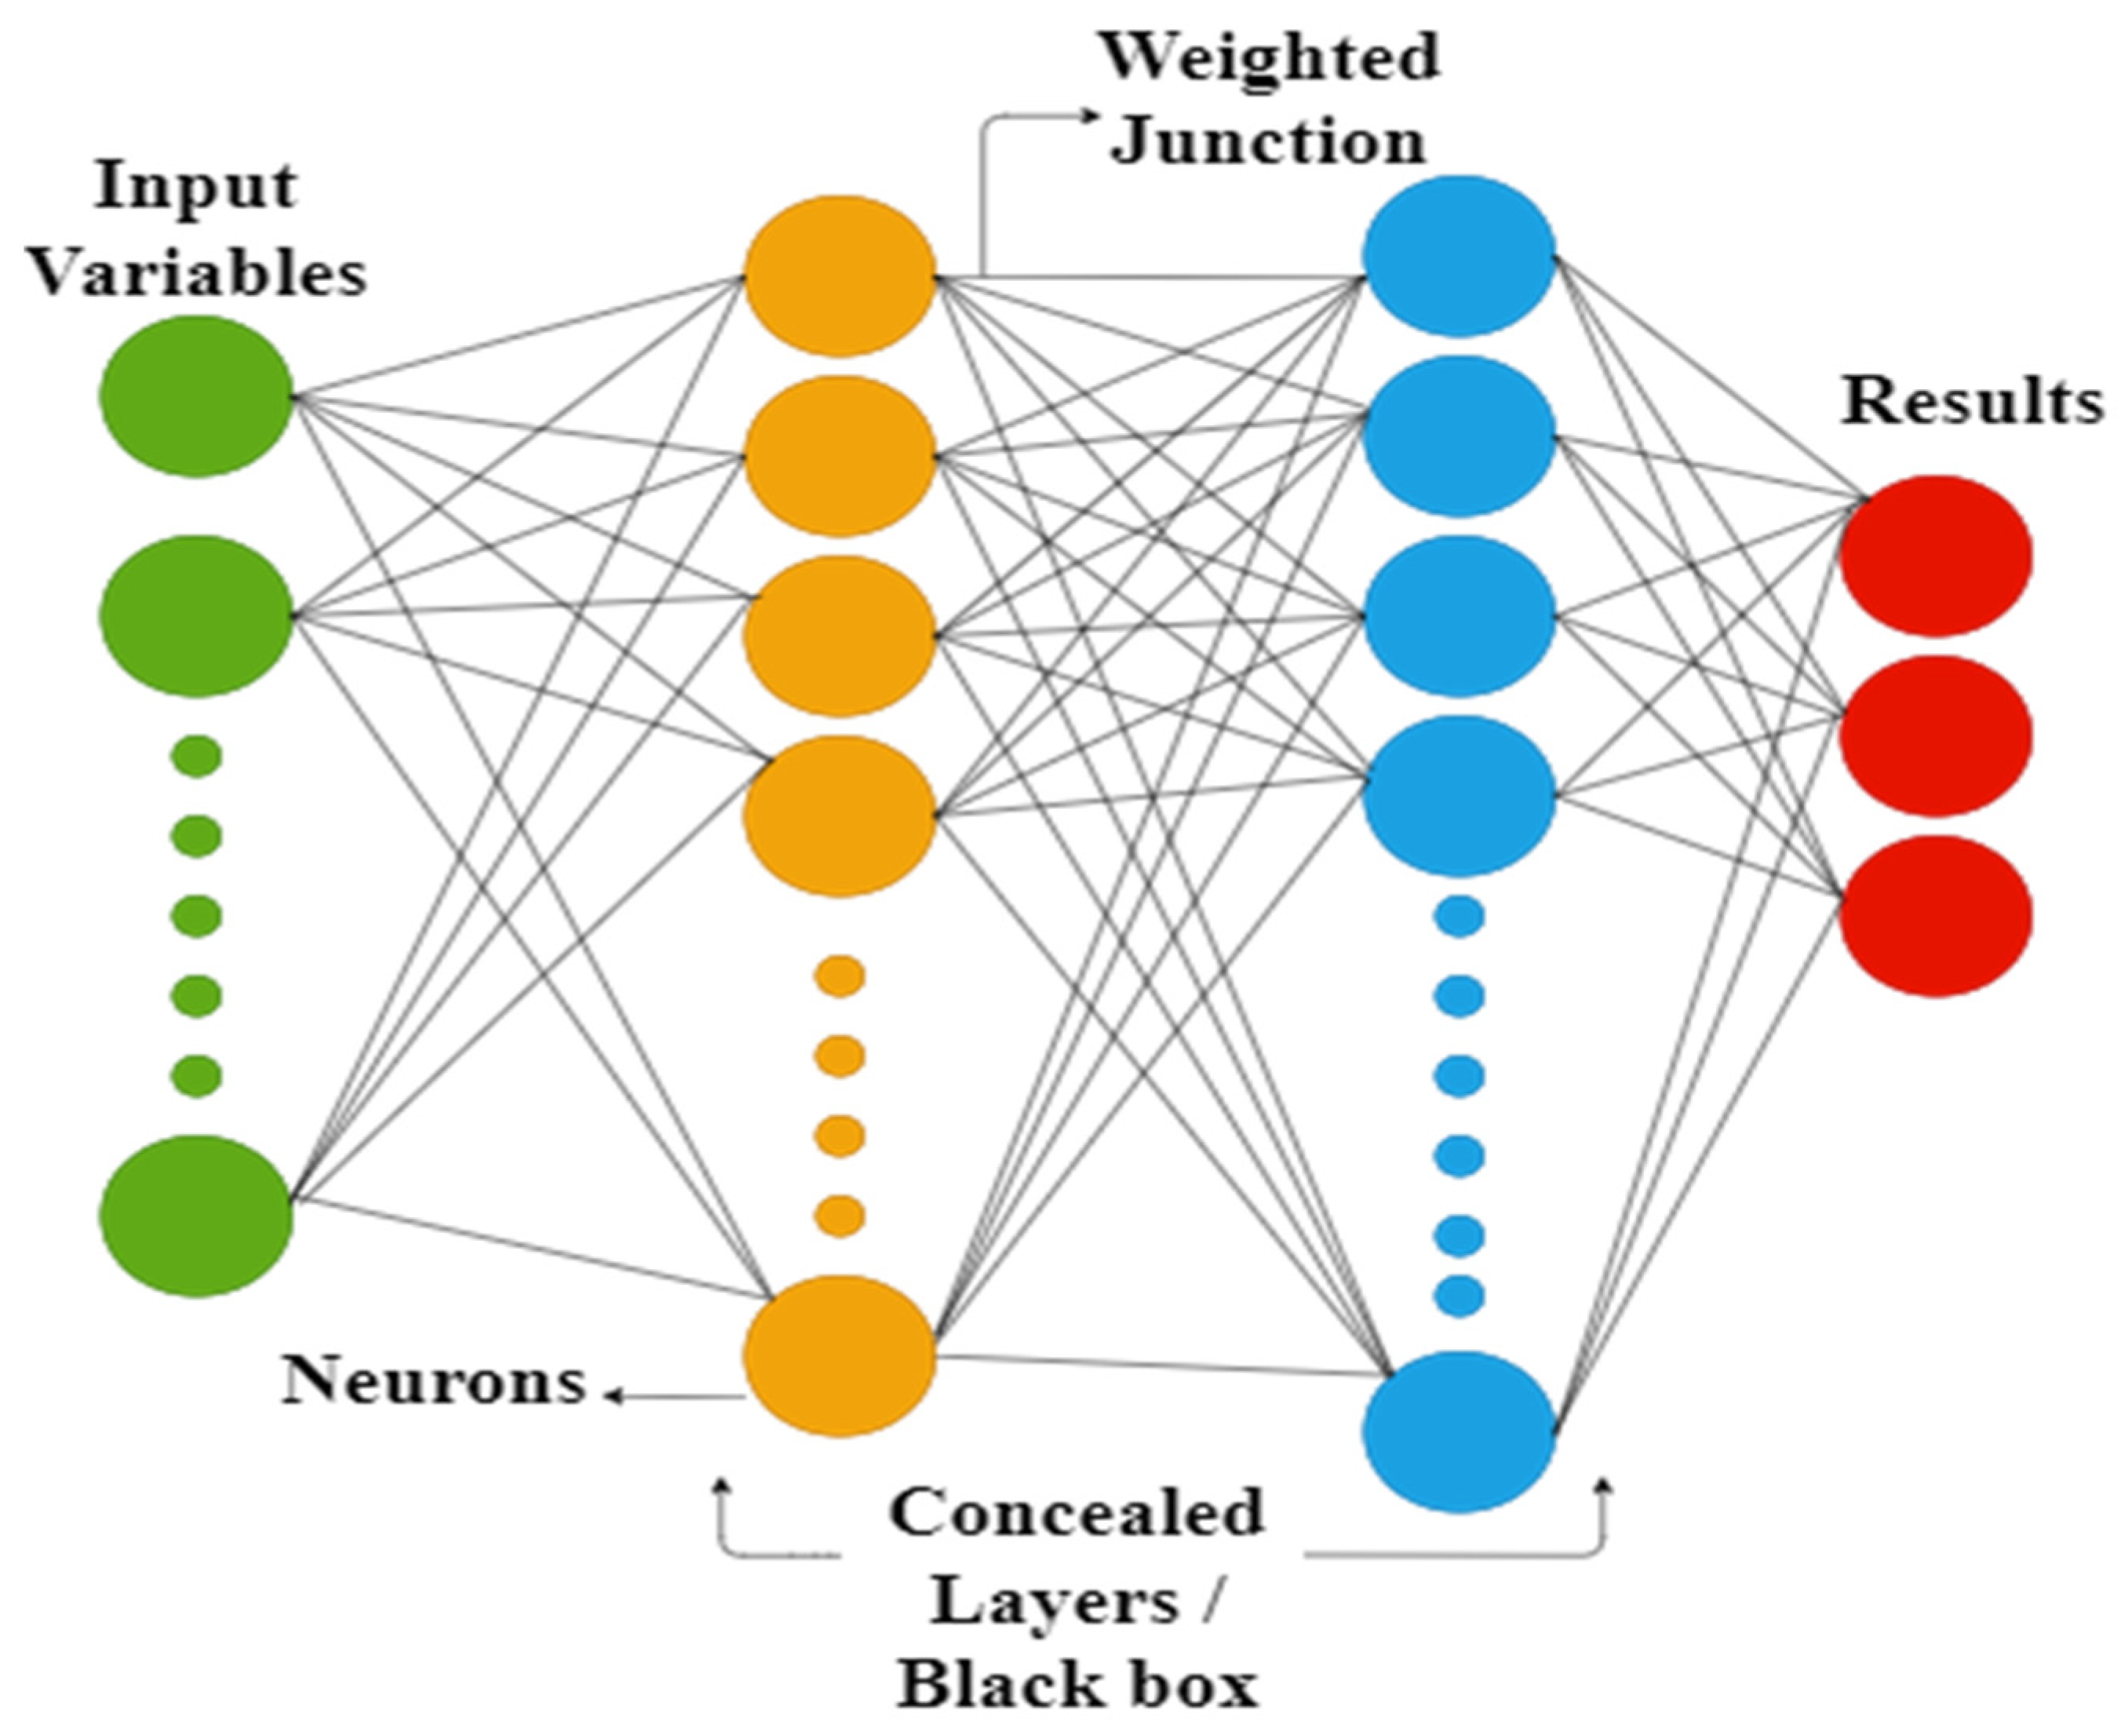
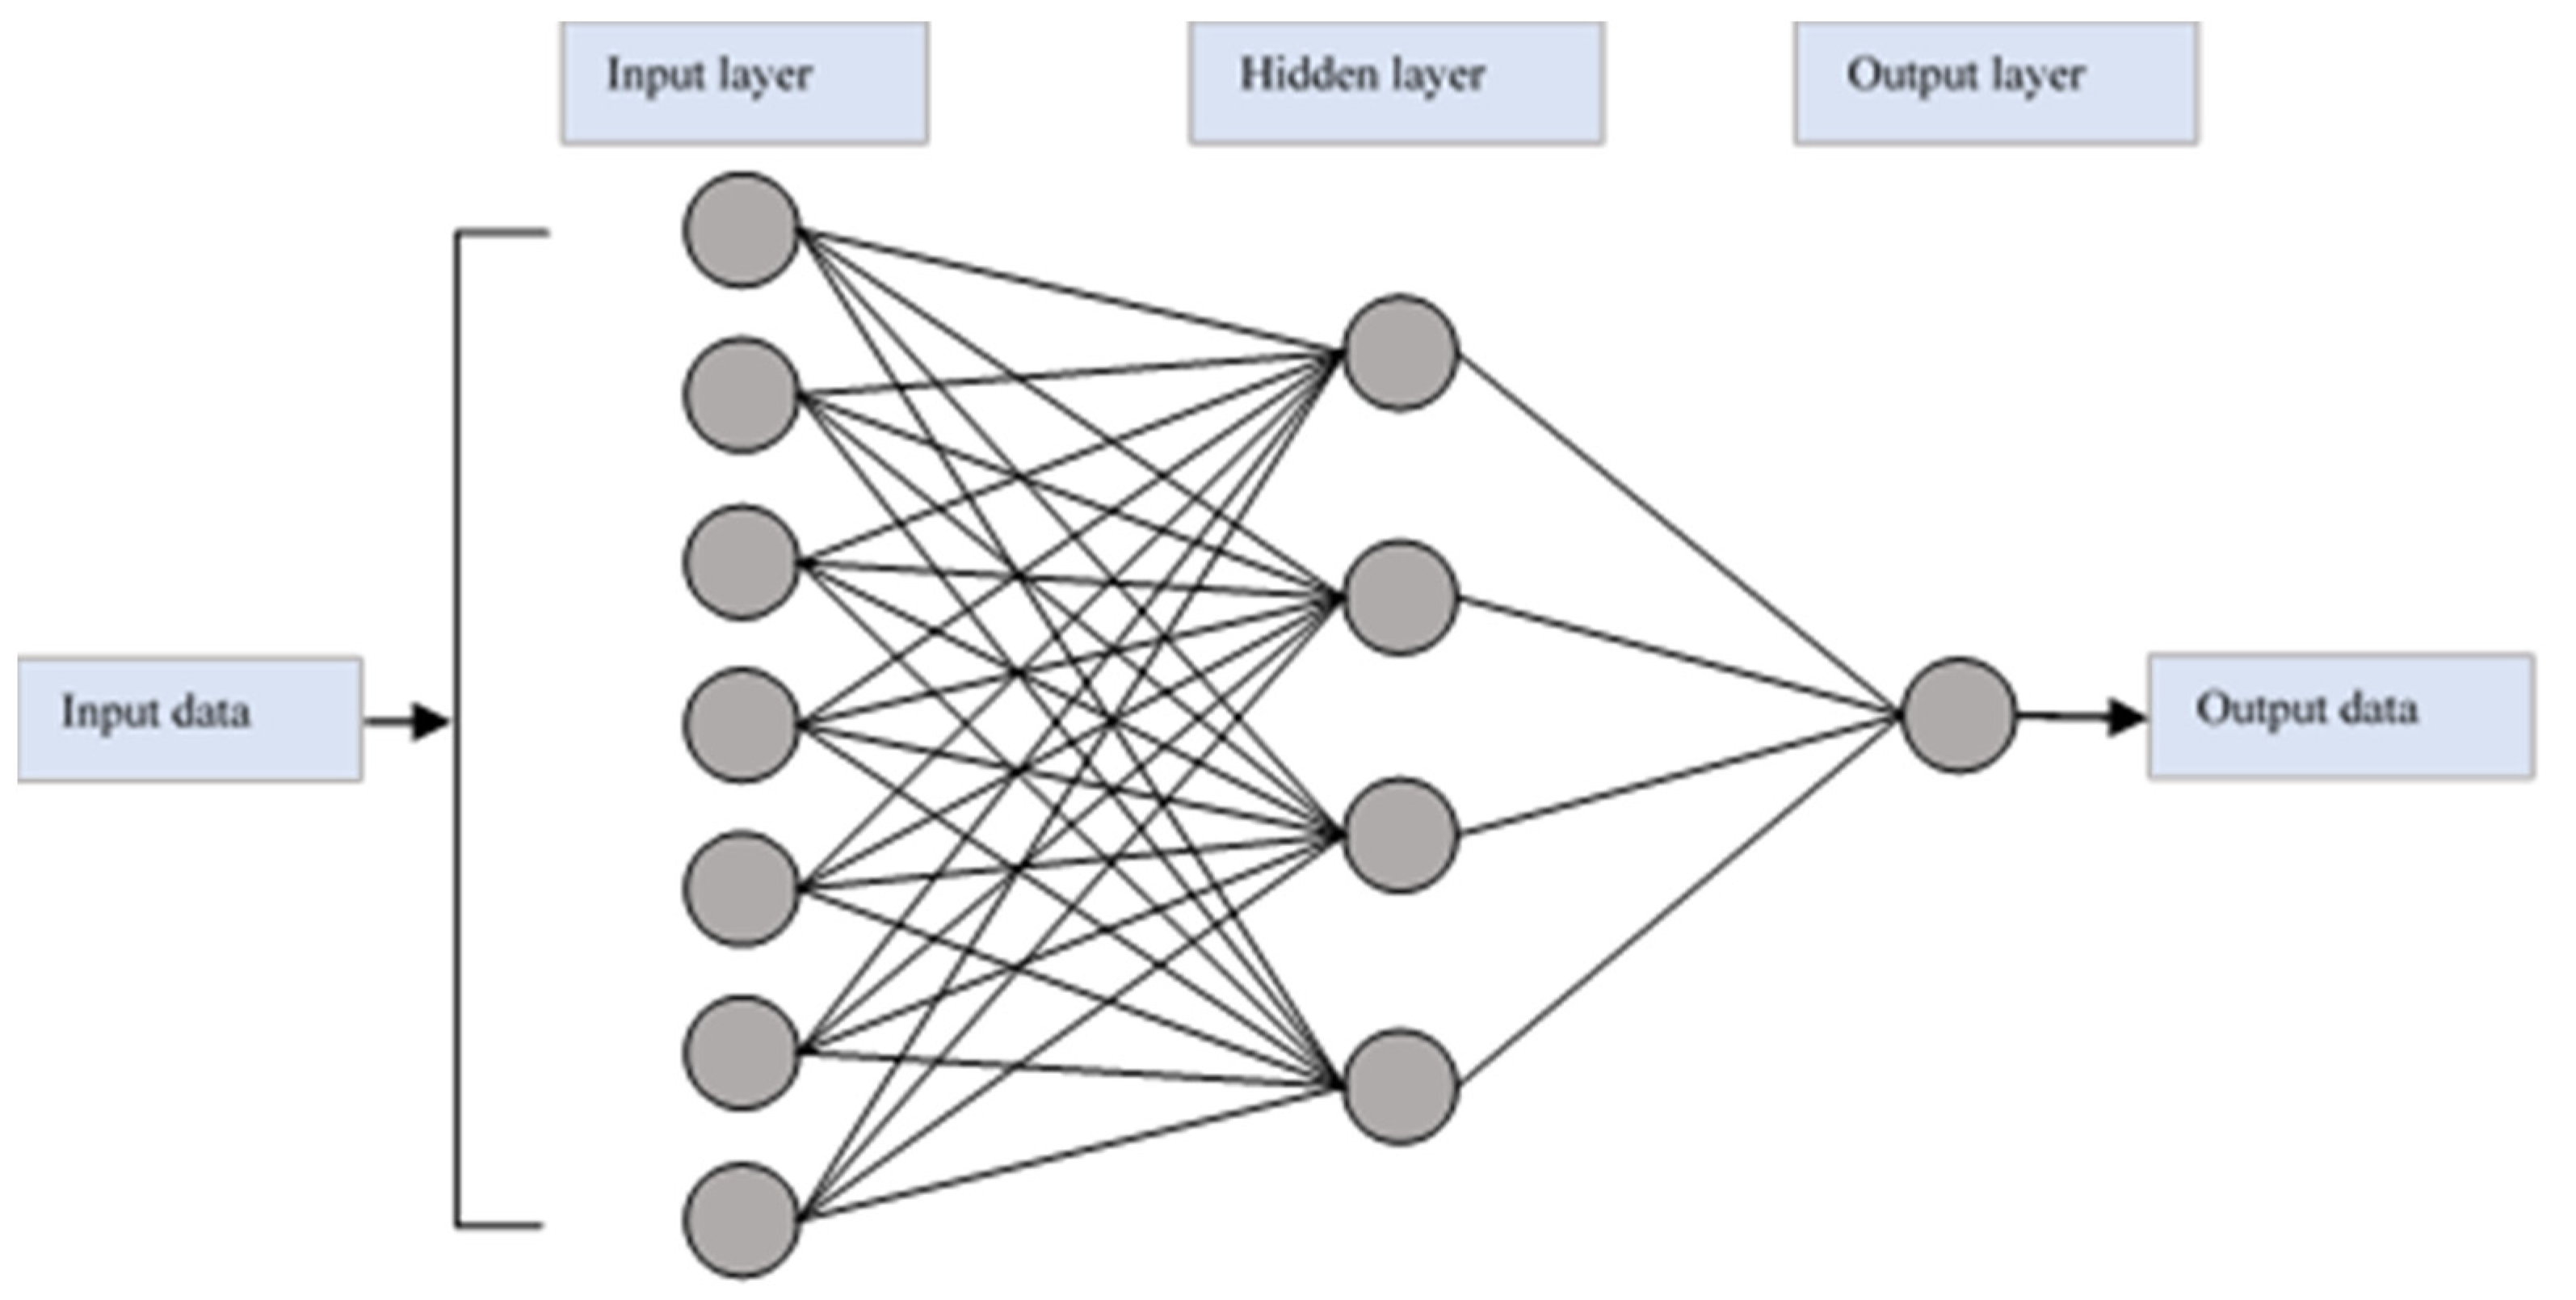
2.2.1. Artificial Neural Network
- The summations of weighted inputs are calculated using weights and bias.
- The output of the neurons is calculated using different mathematical functions, such as sigmoid and ramp. Here, the sigmoid function is employed due to its simplicity.
- The final output is calculated using the following equations:where is the weight from the node to the target node and is the bias of the target node.
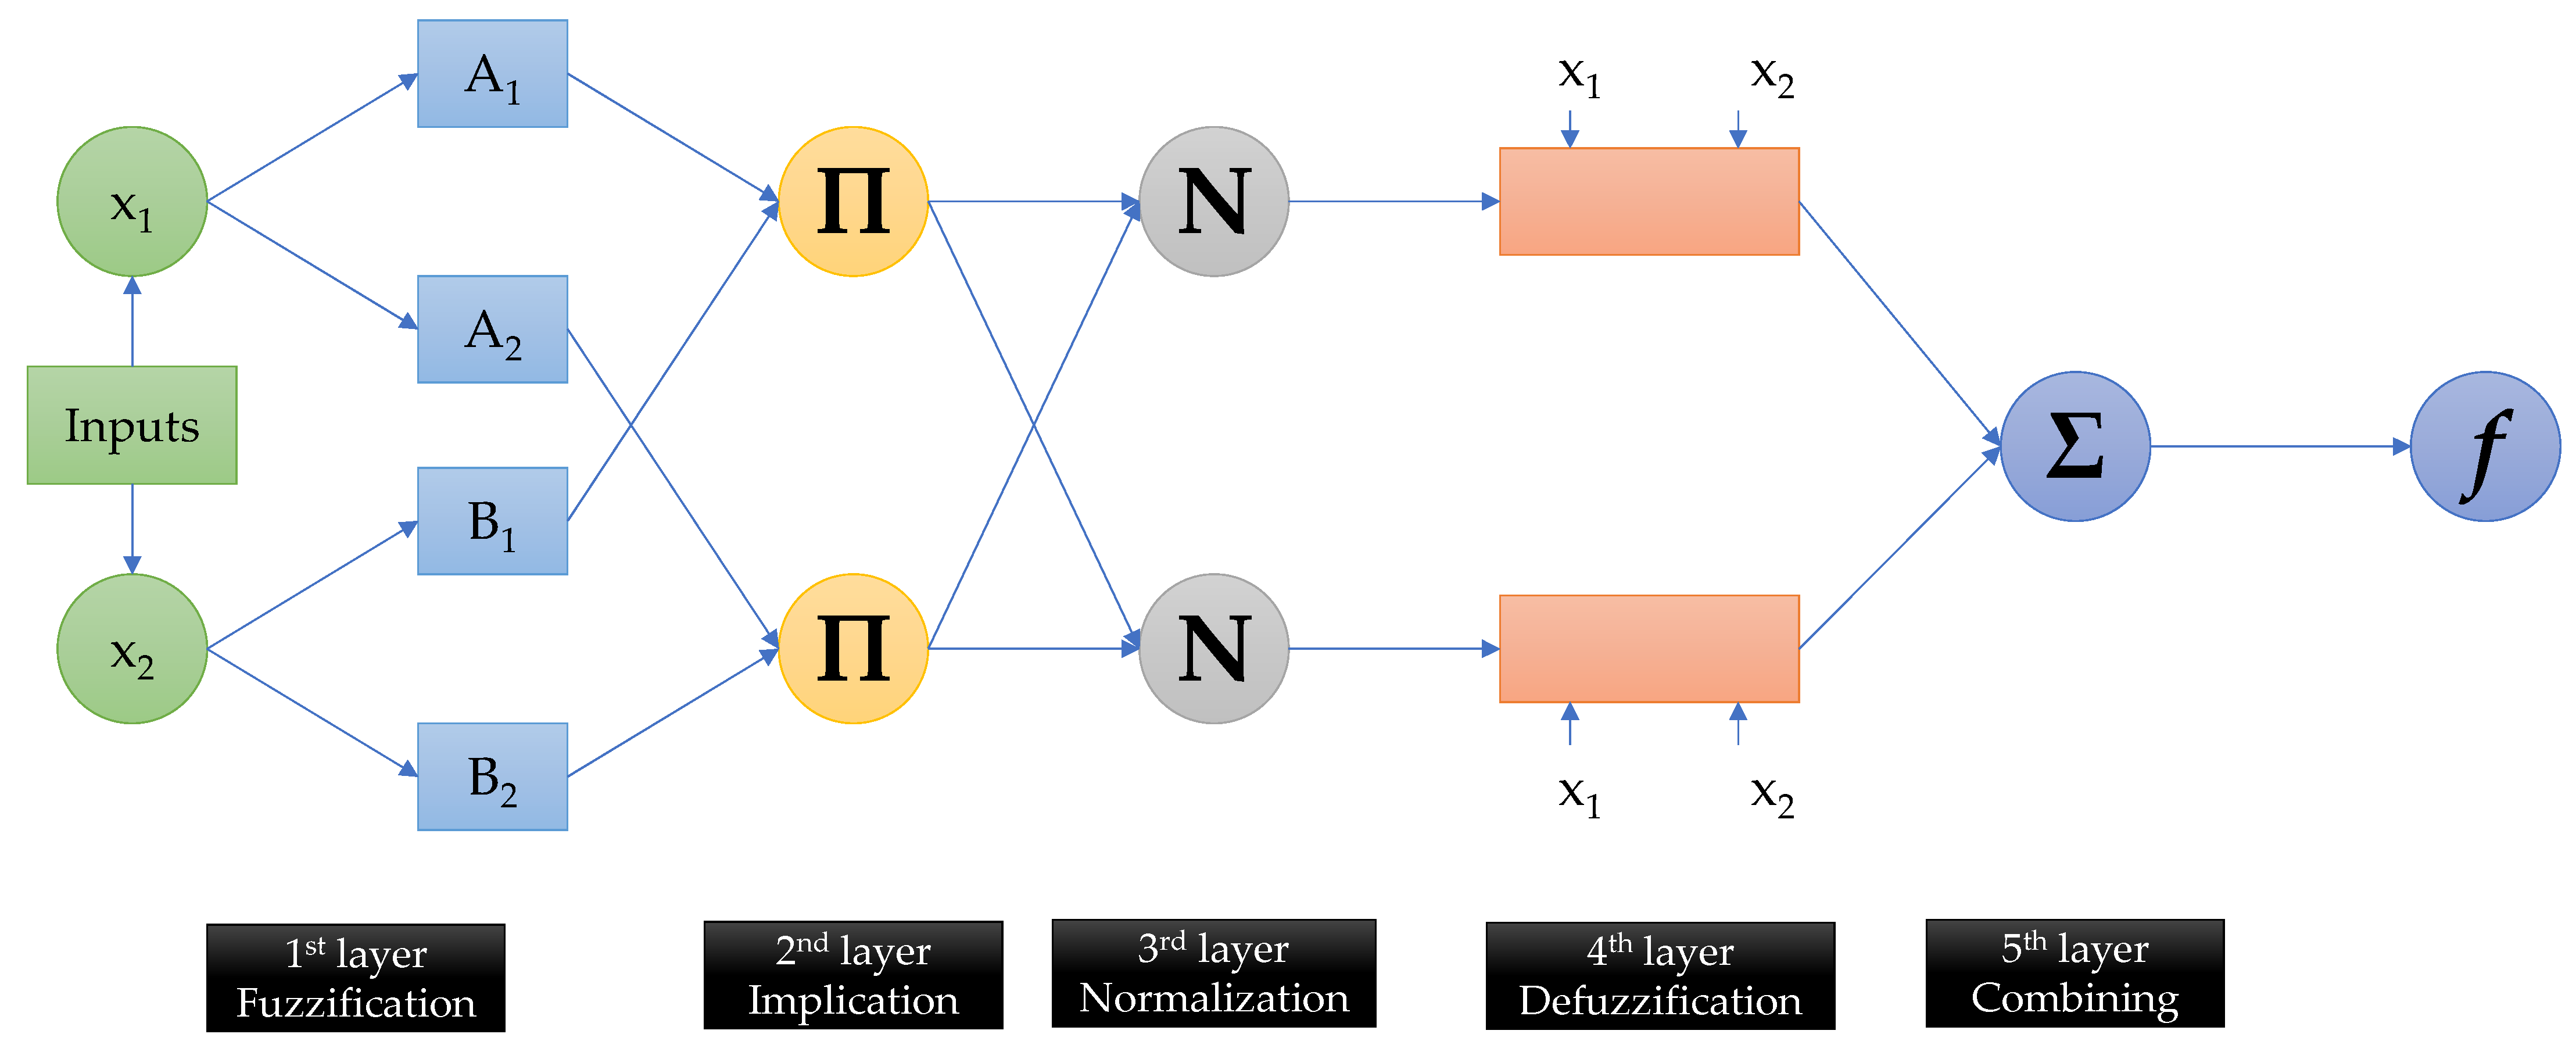
2.2.2. Adaptive Neuro-Fuzzy Interface System
- First Layer (input nodes and fuzzification): This layer takes the inputs and recognizes the linked membership functions. Applying membership function parameters, all nodes in this layer produce membership scores indicating whether or not they correspond to each of the relevant fuzzy sets.
- Second Layer (rule nodes): In the rule layer, the firing strengths for the designated rules are generated. The AND operator is used to produce a single outcome that reflects the consequence of the predecessor (i.e., firing strength). Firing intensity refers to the degree to which the predecessor portion of a fuzzy set rule is fulfilled. It shapes and influence the rule’s output function.
- Third Layer (average nodes or normalization): In this layer the normalized firing capacity is computed. The primary goal of this layer is achieved by calculating the ratio between all firing strengths of the rule to the addition of the firing strength of the entire rules.
- Fourth Layer (consequent parametric node): This layer receives the normalized firing capacity and determines the influence of every set rule to the complete outcome and function using the consequent parametric set.
- Fifth Layer (output nodes or defuzzification): This layer provides the final resultant outcome by adding all the receiving signals. Consequently, at this layer, the defuzzification process converts the fuzzy outcomes of each rule into a clear and definable output.
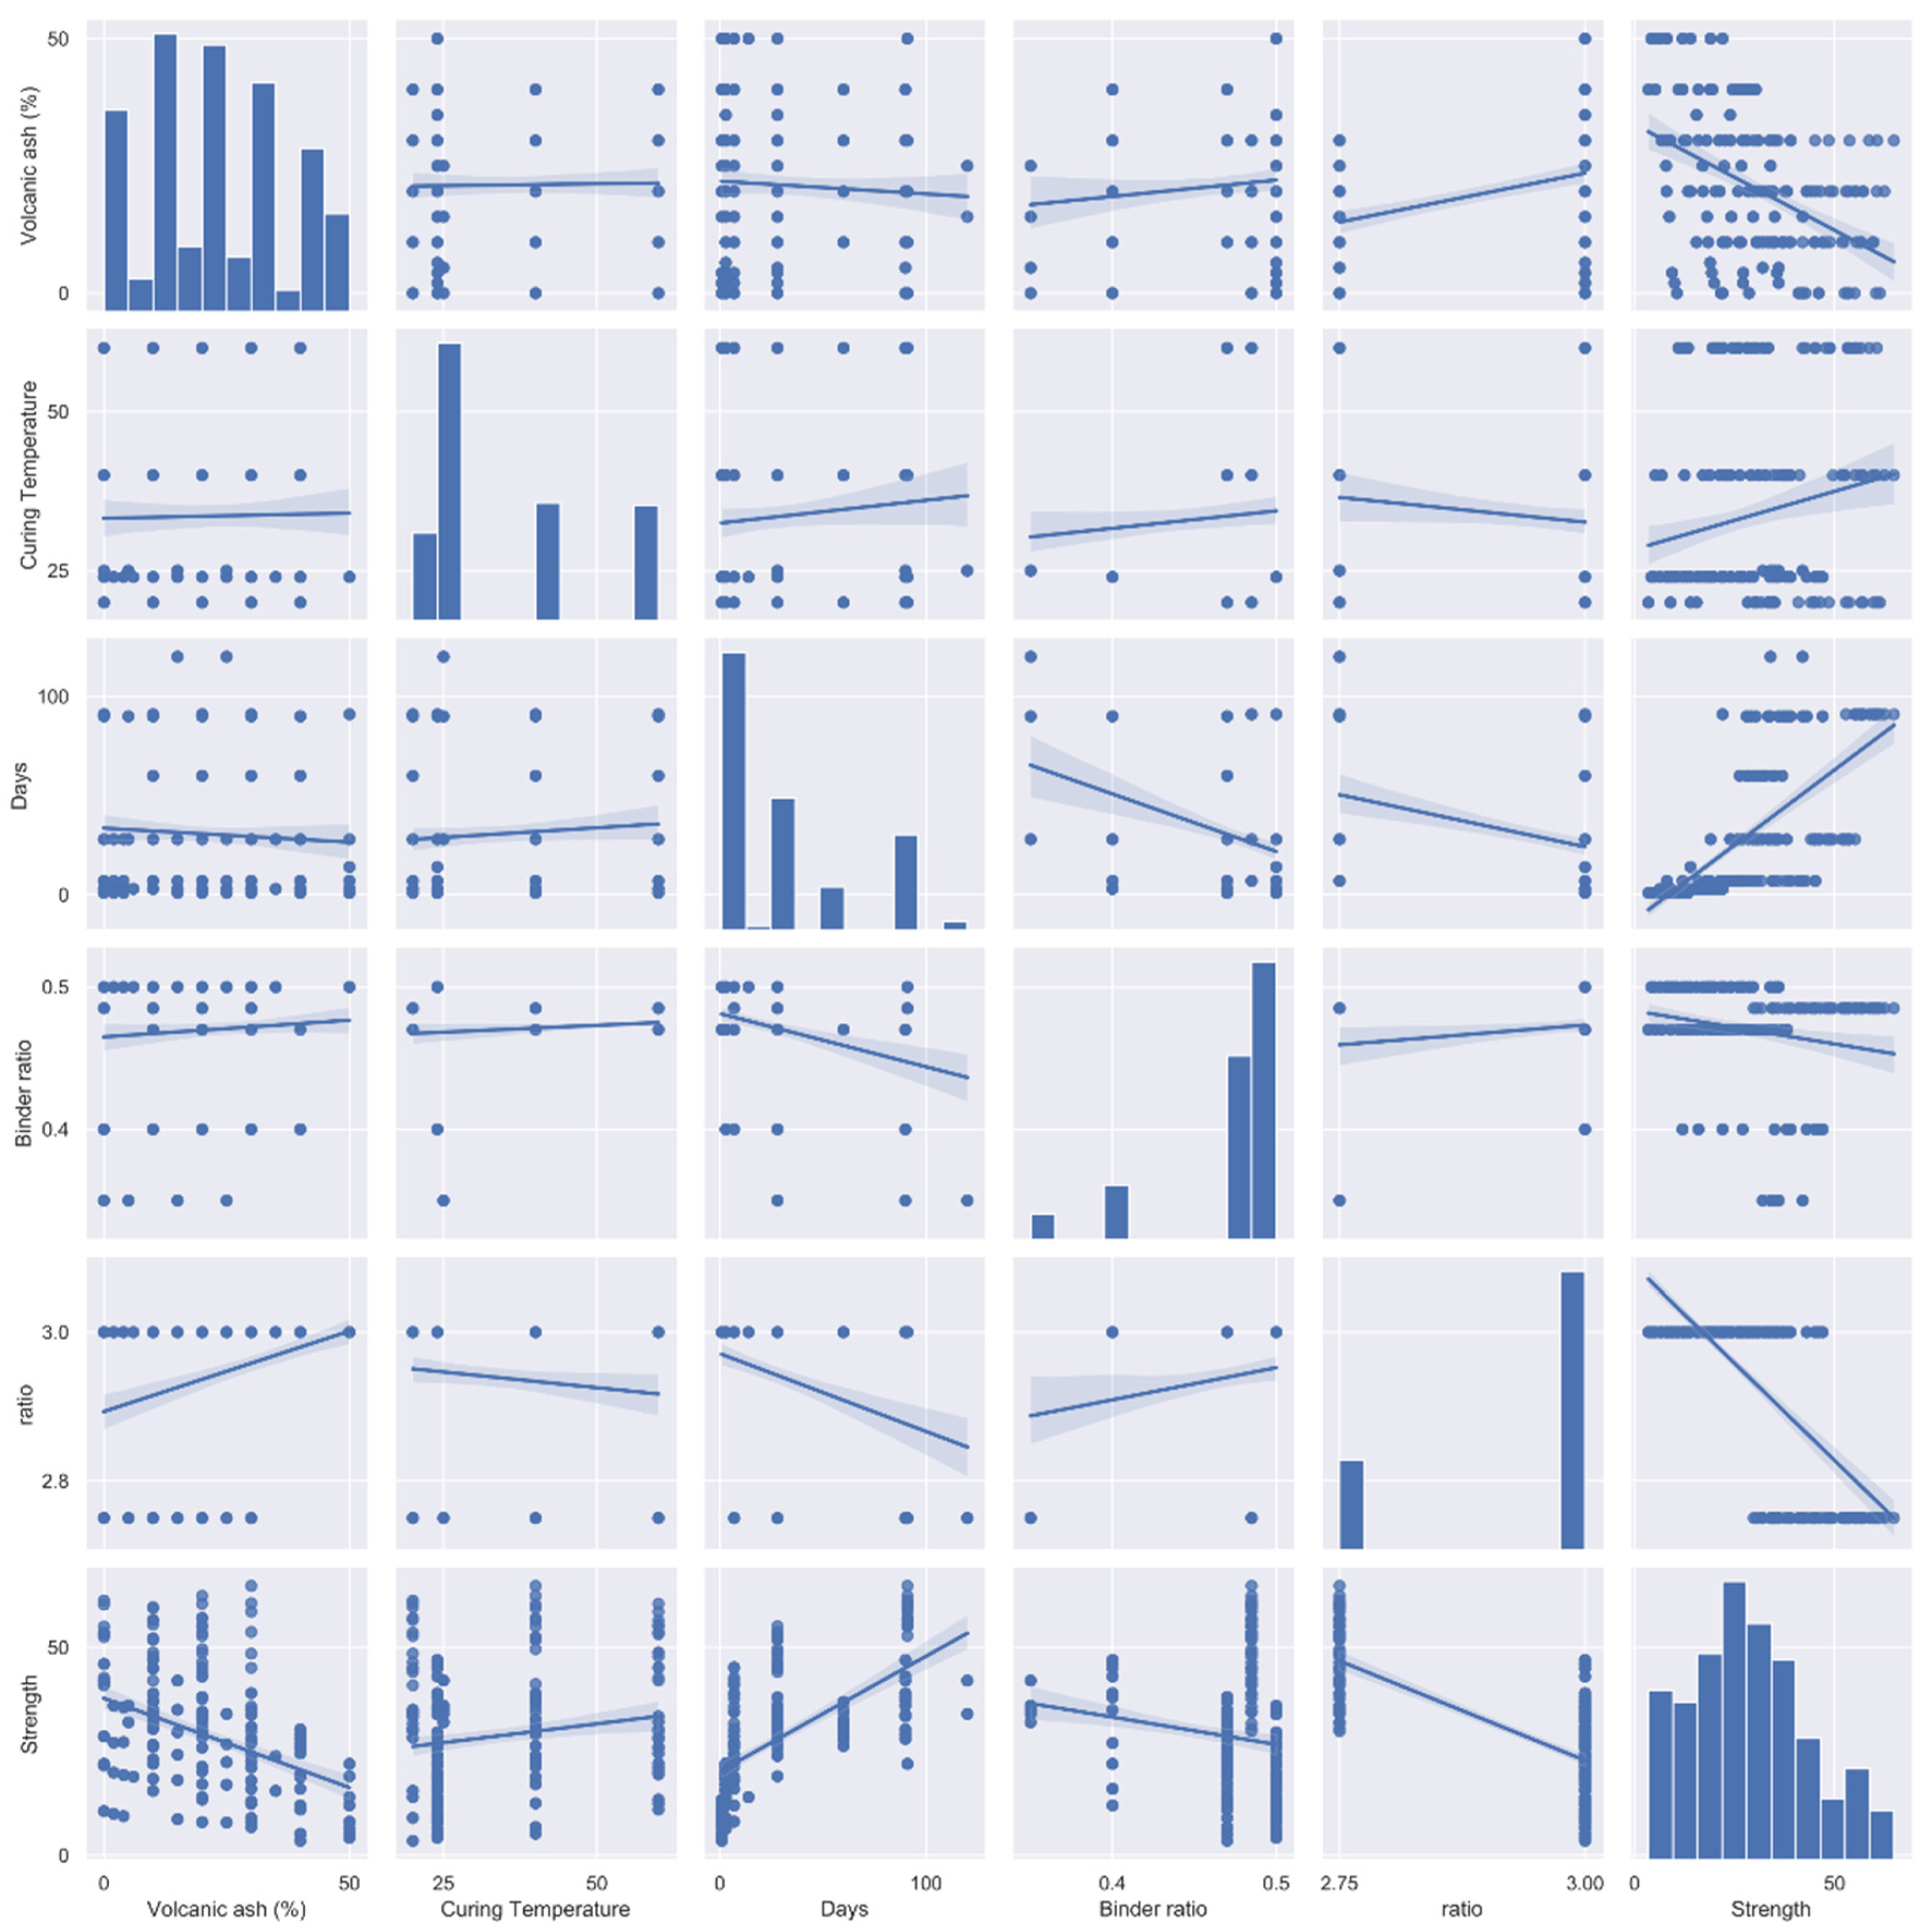
2.2.3. Database Development
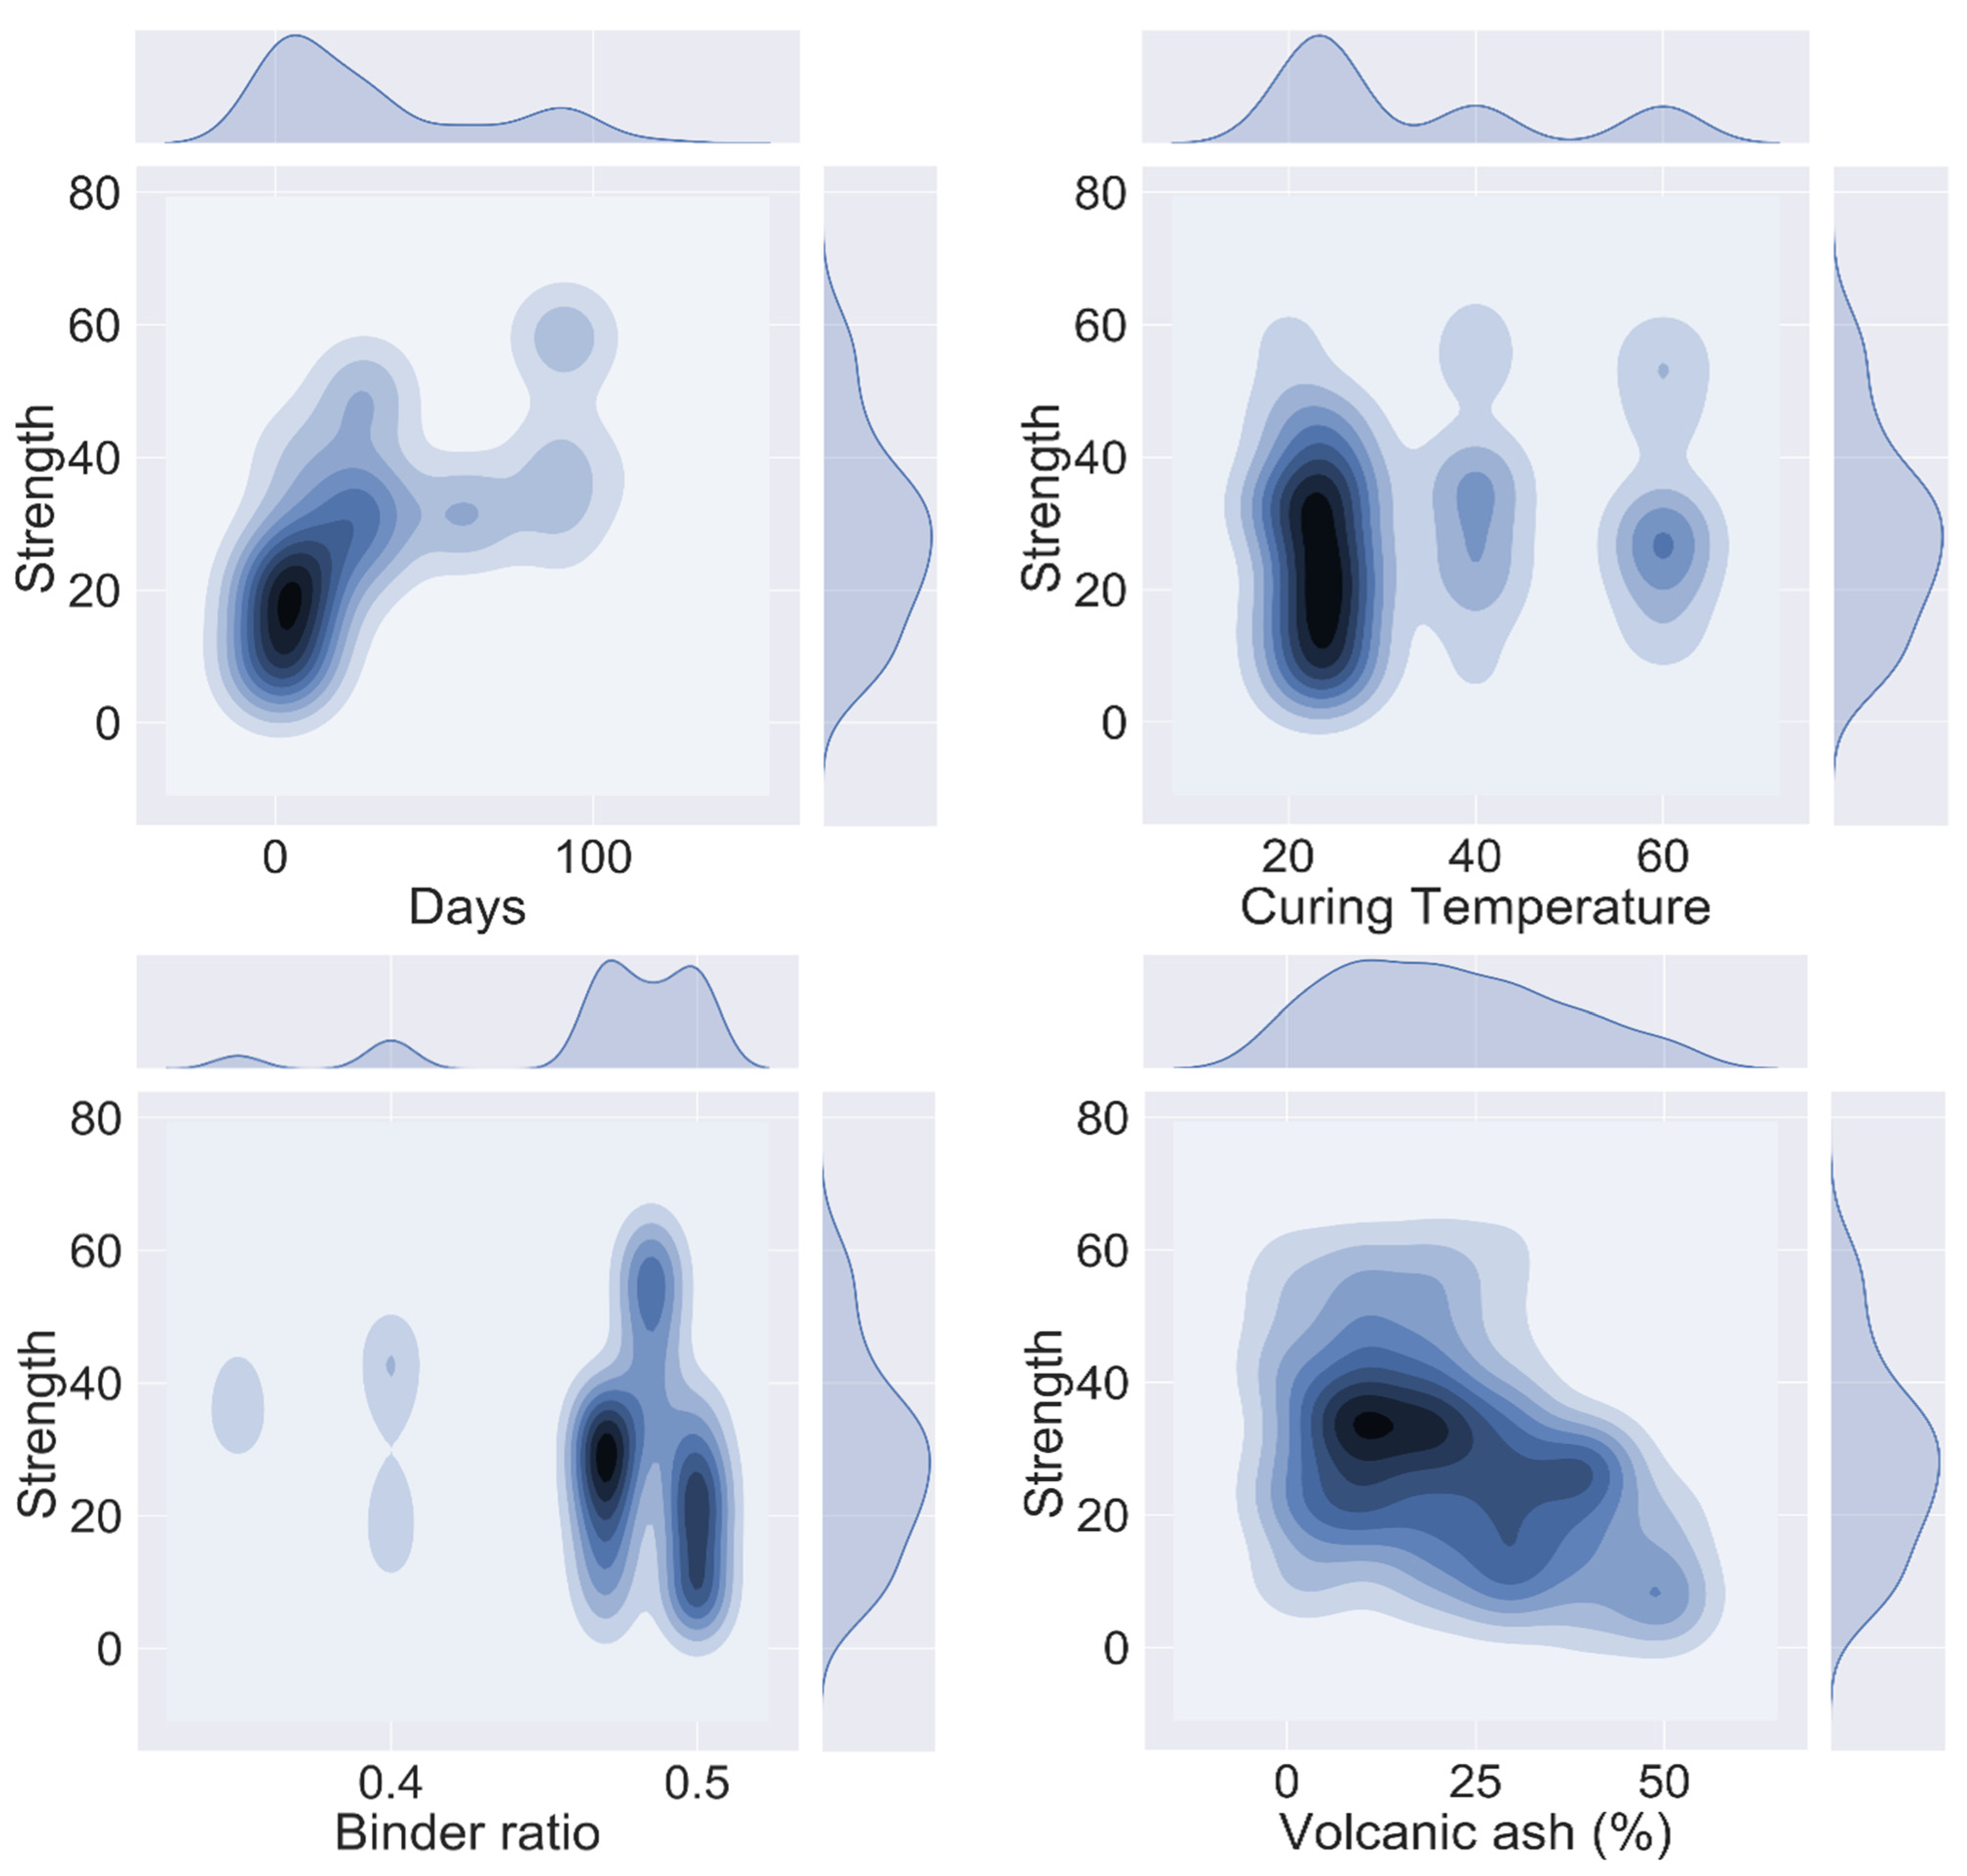
2.2.4. Data Representation Using Python
2.2.5. Python-Based Contour Maps
2.2.6. Performance Evaluation of Prediction Models
3. Results and Discussion
3.1. Test Findings
Compressive Strength in Respect of Curing Temperature and Age
3.2. Modeling Results
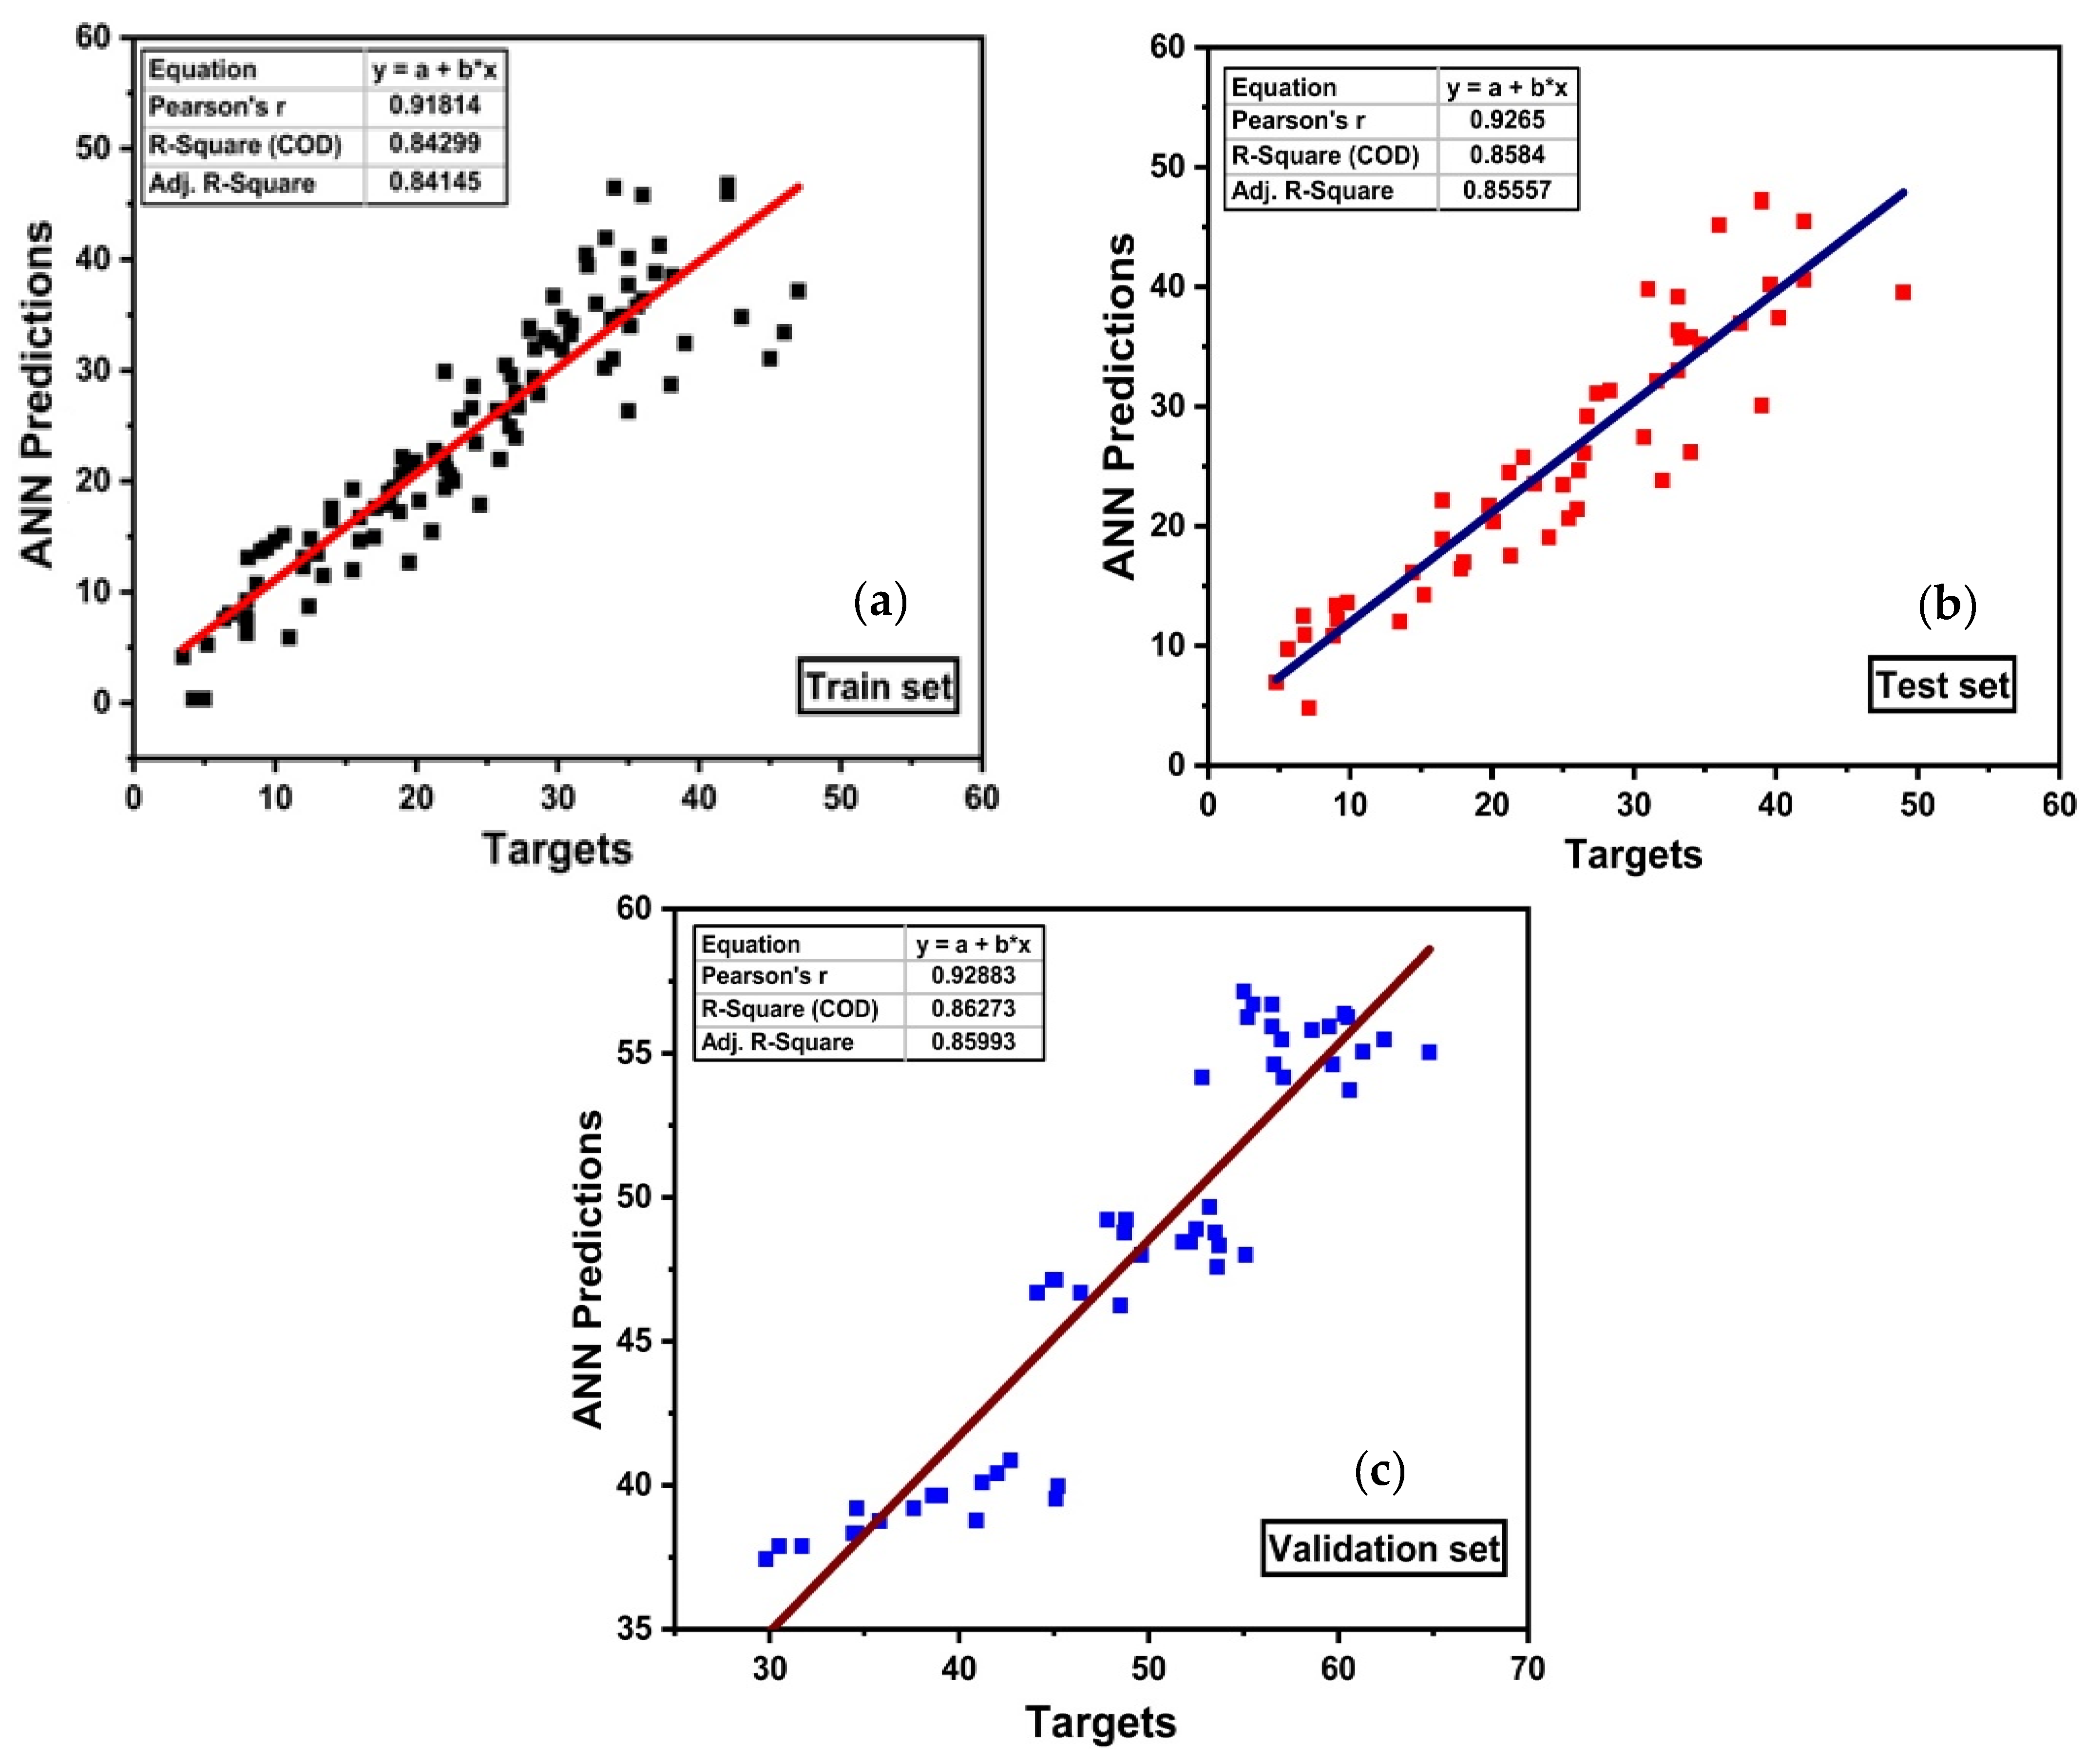
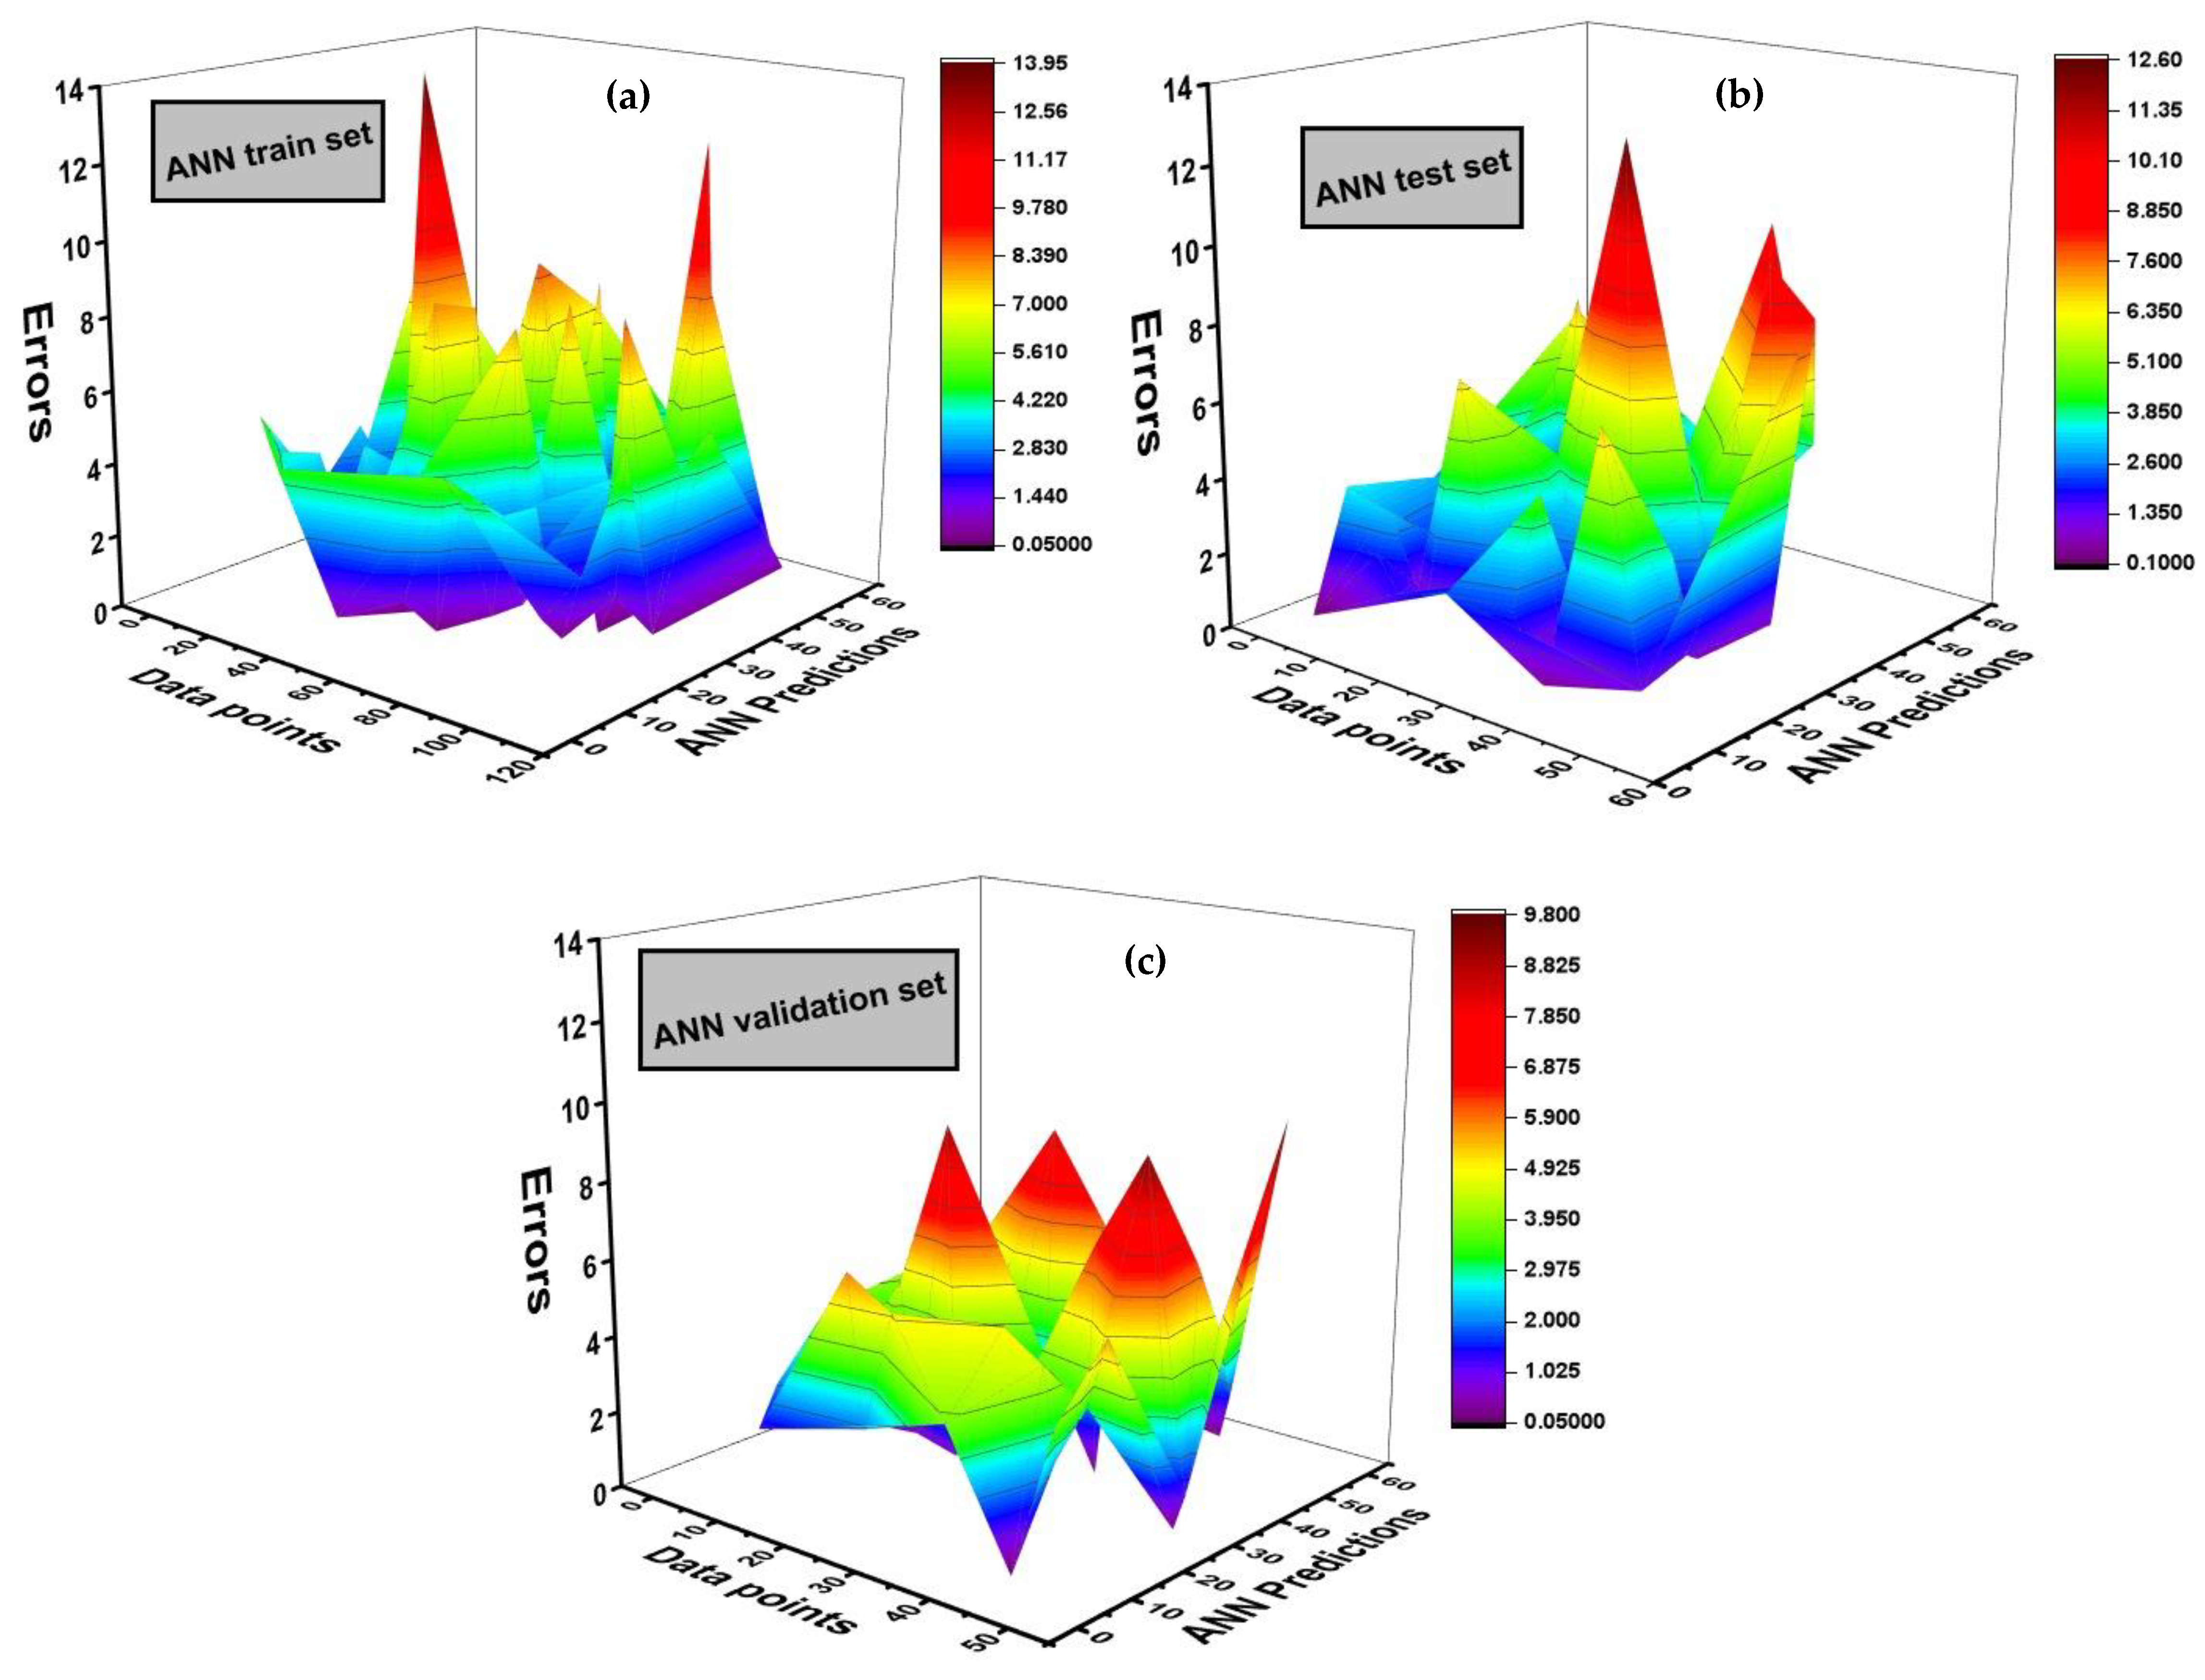
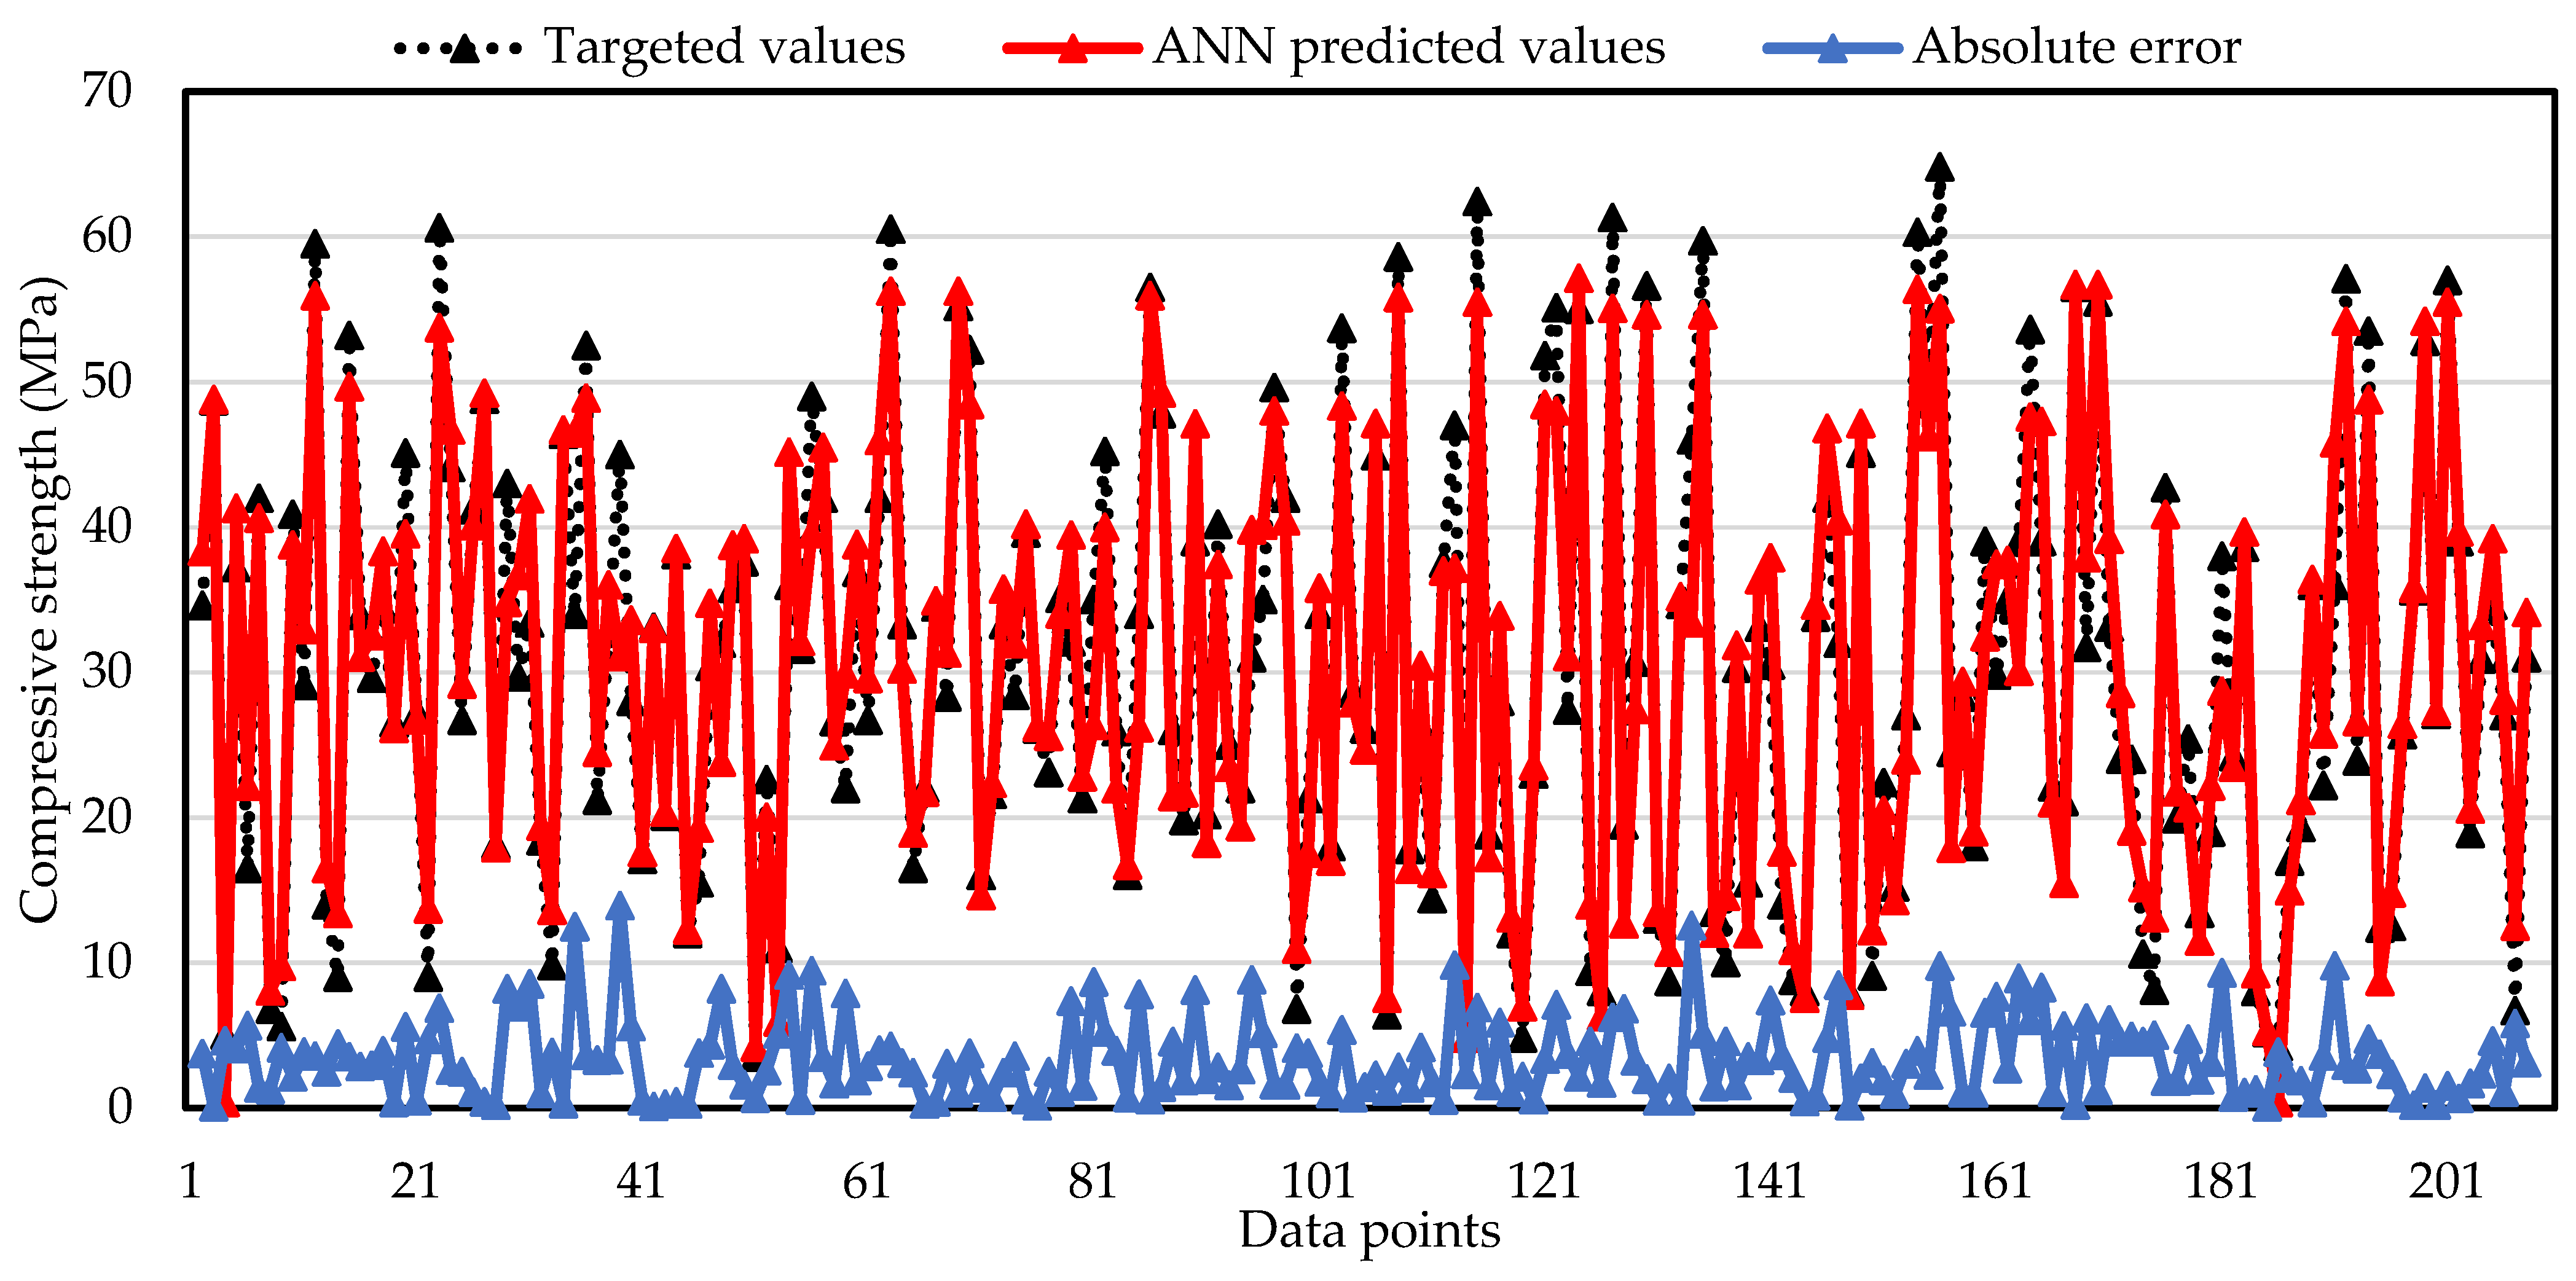
3.2.1. ANN Prediction Model
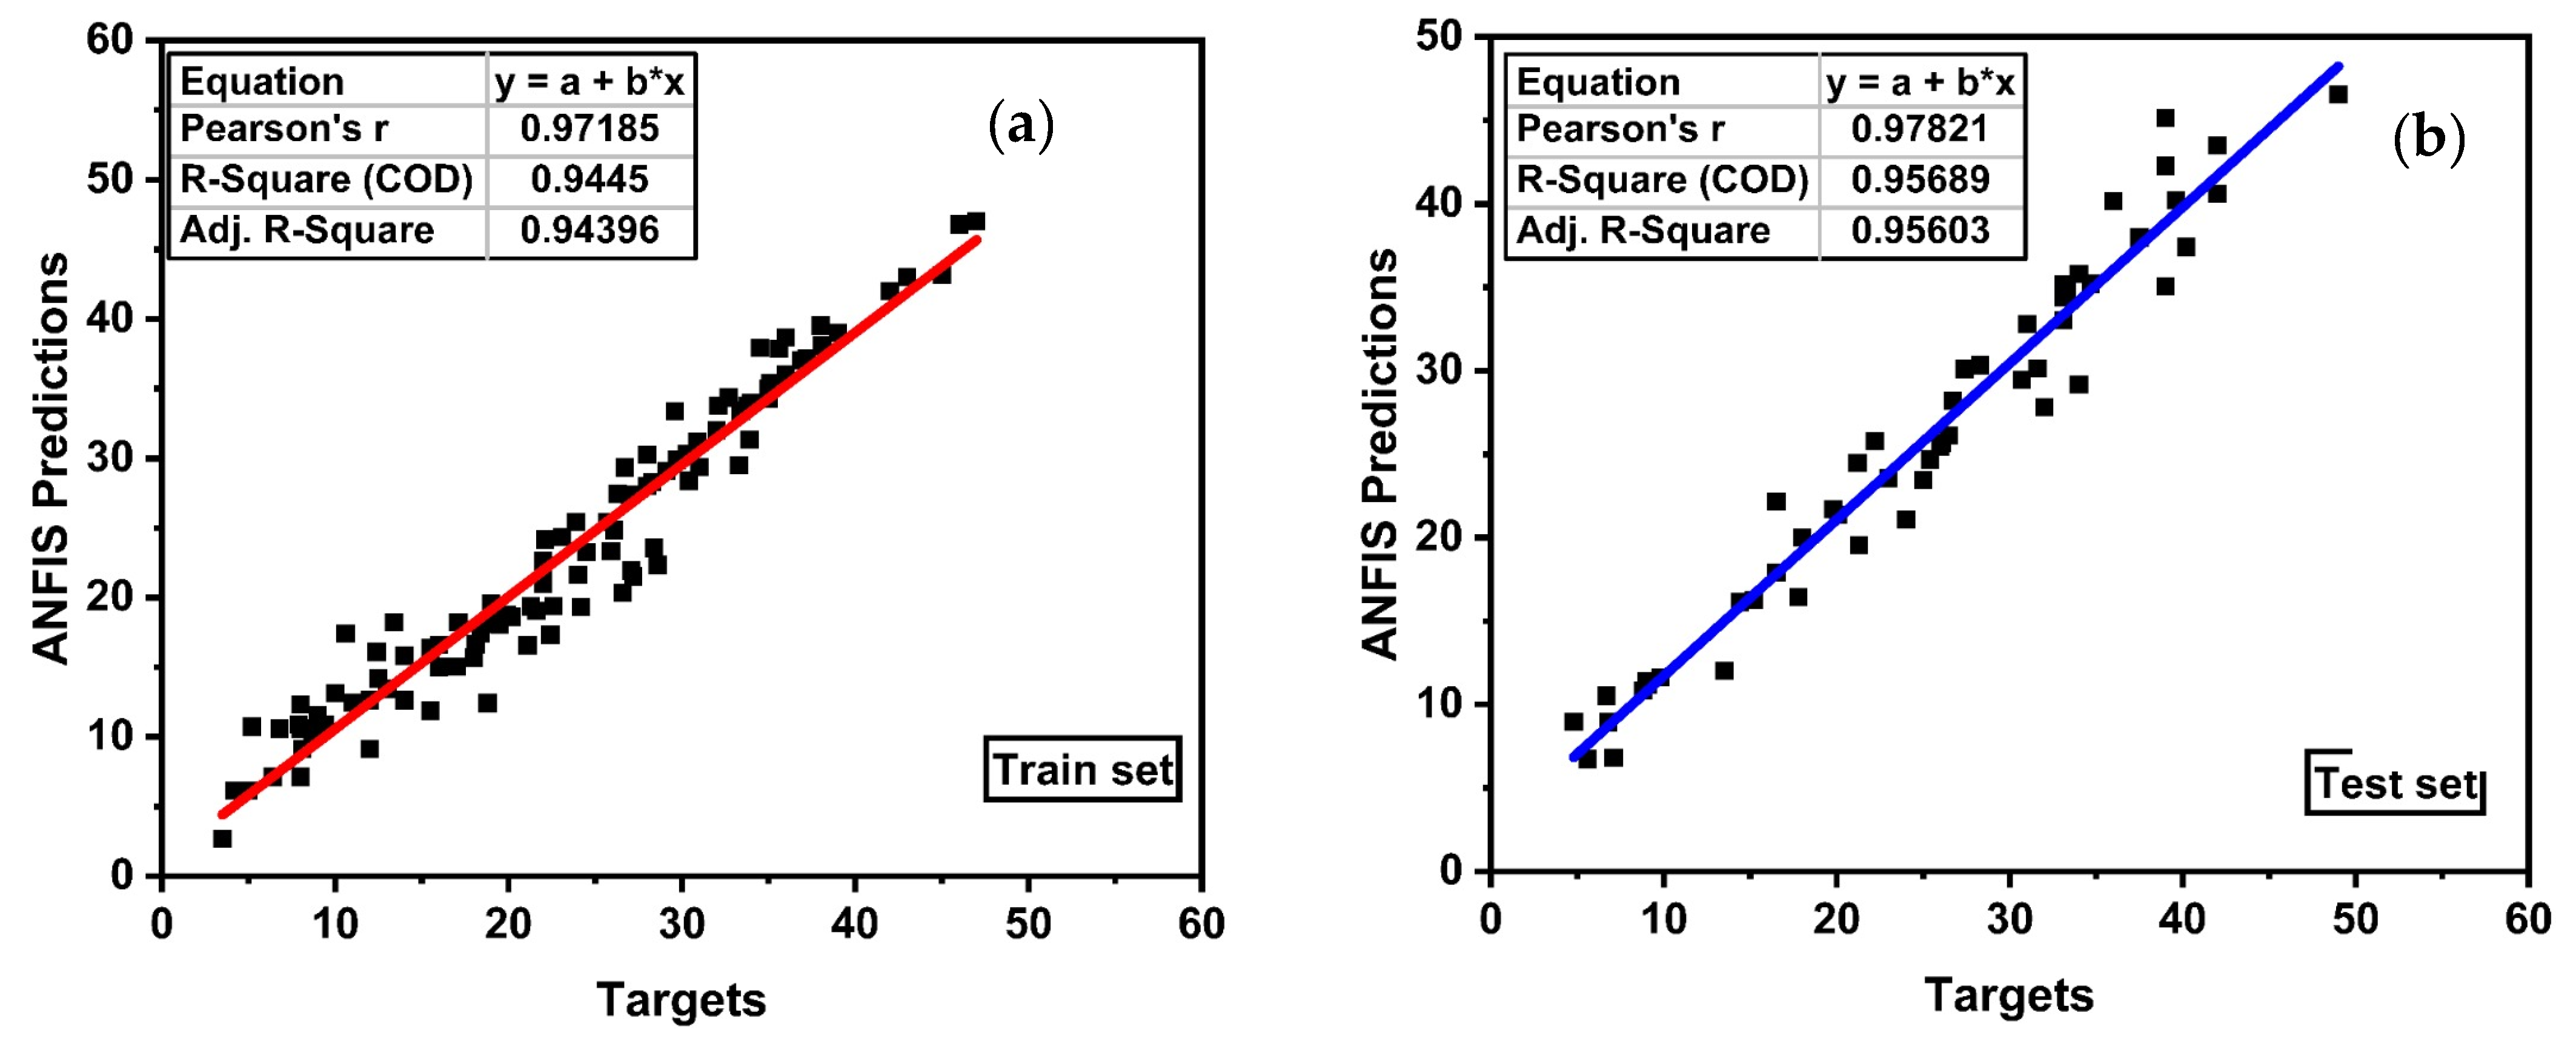
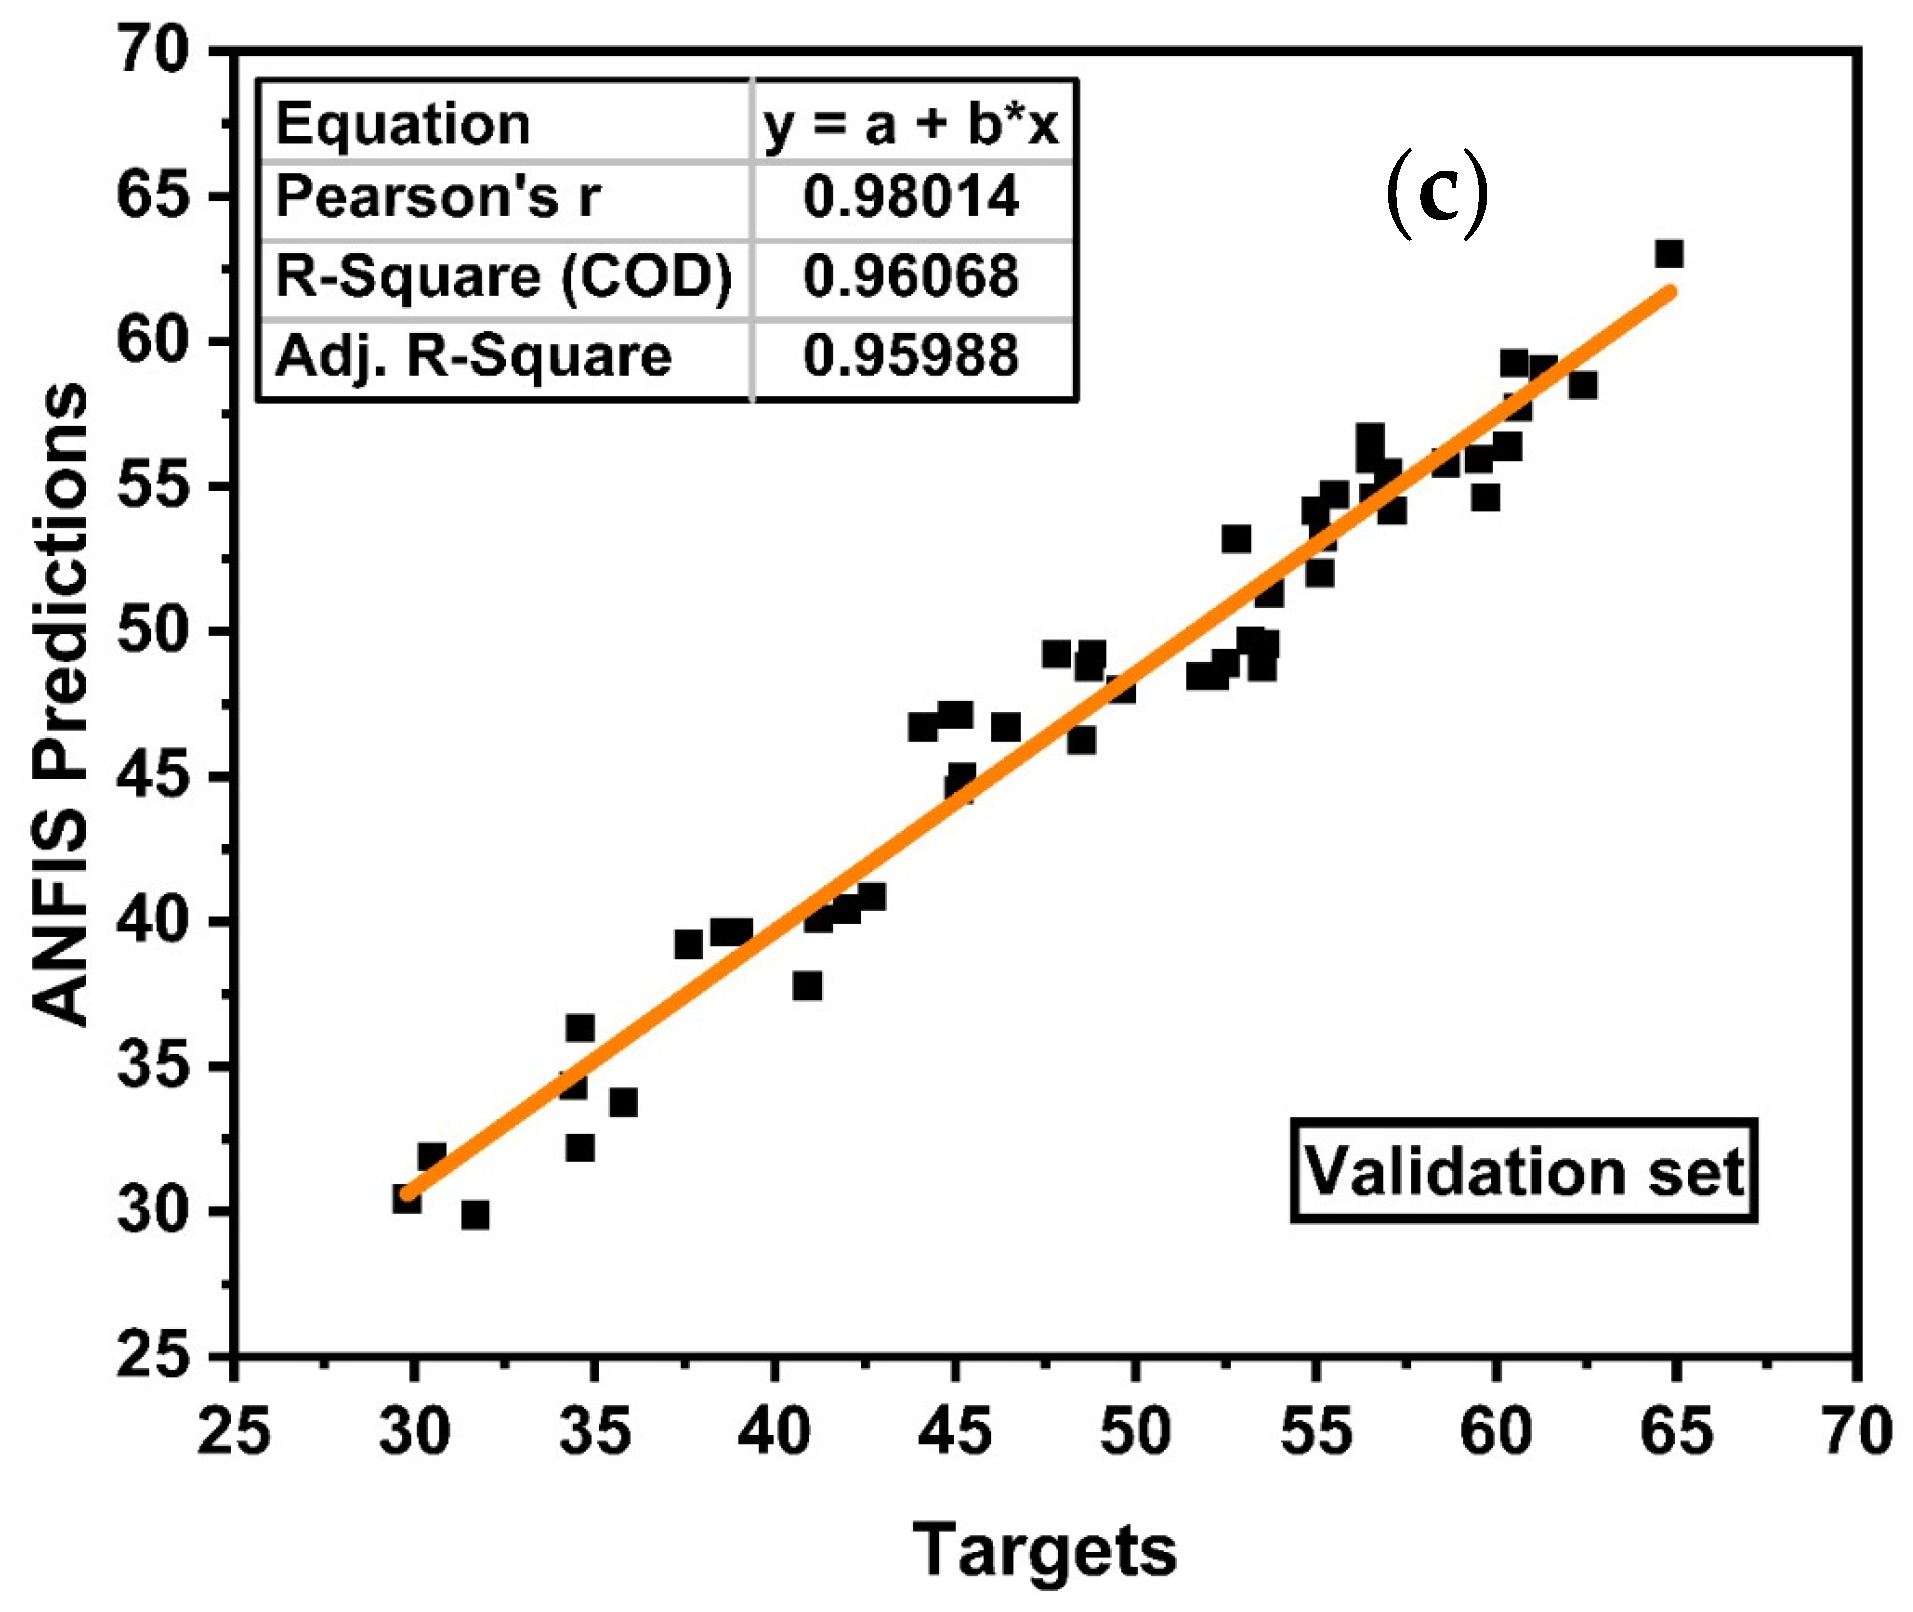
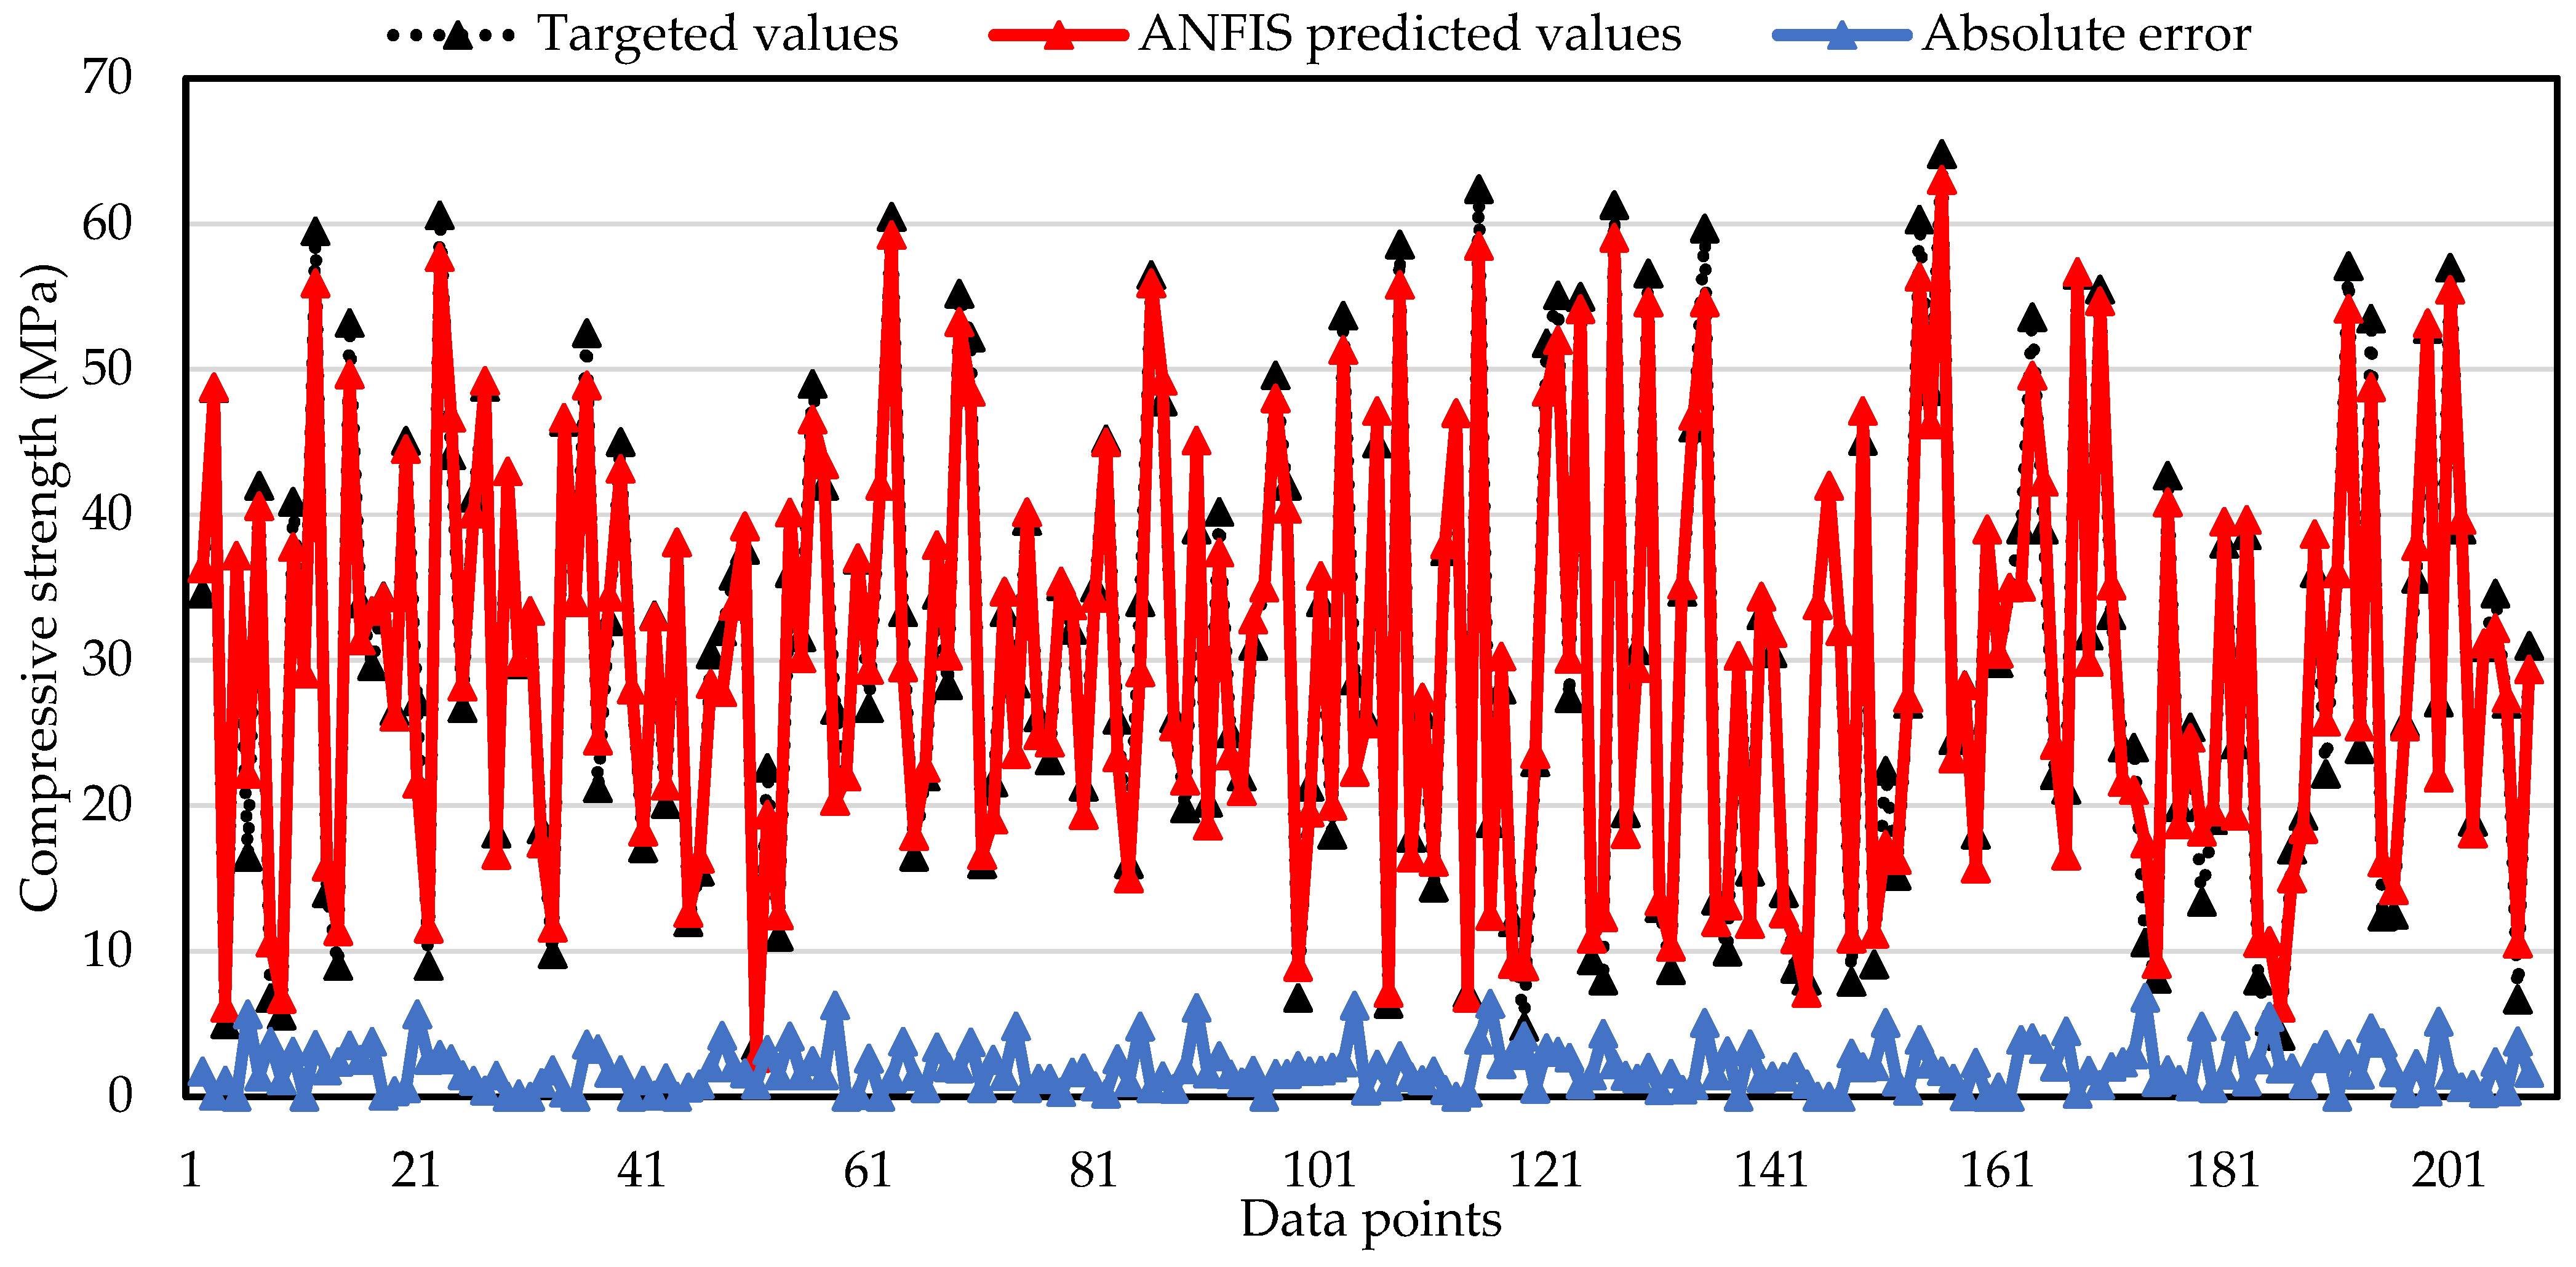
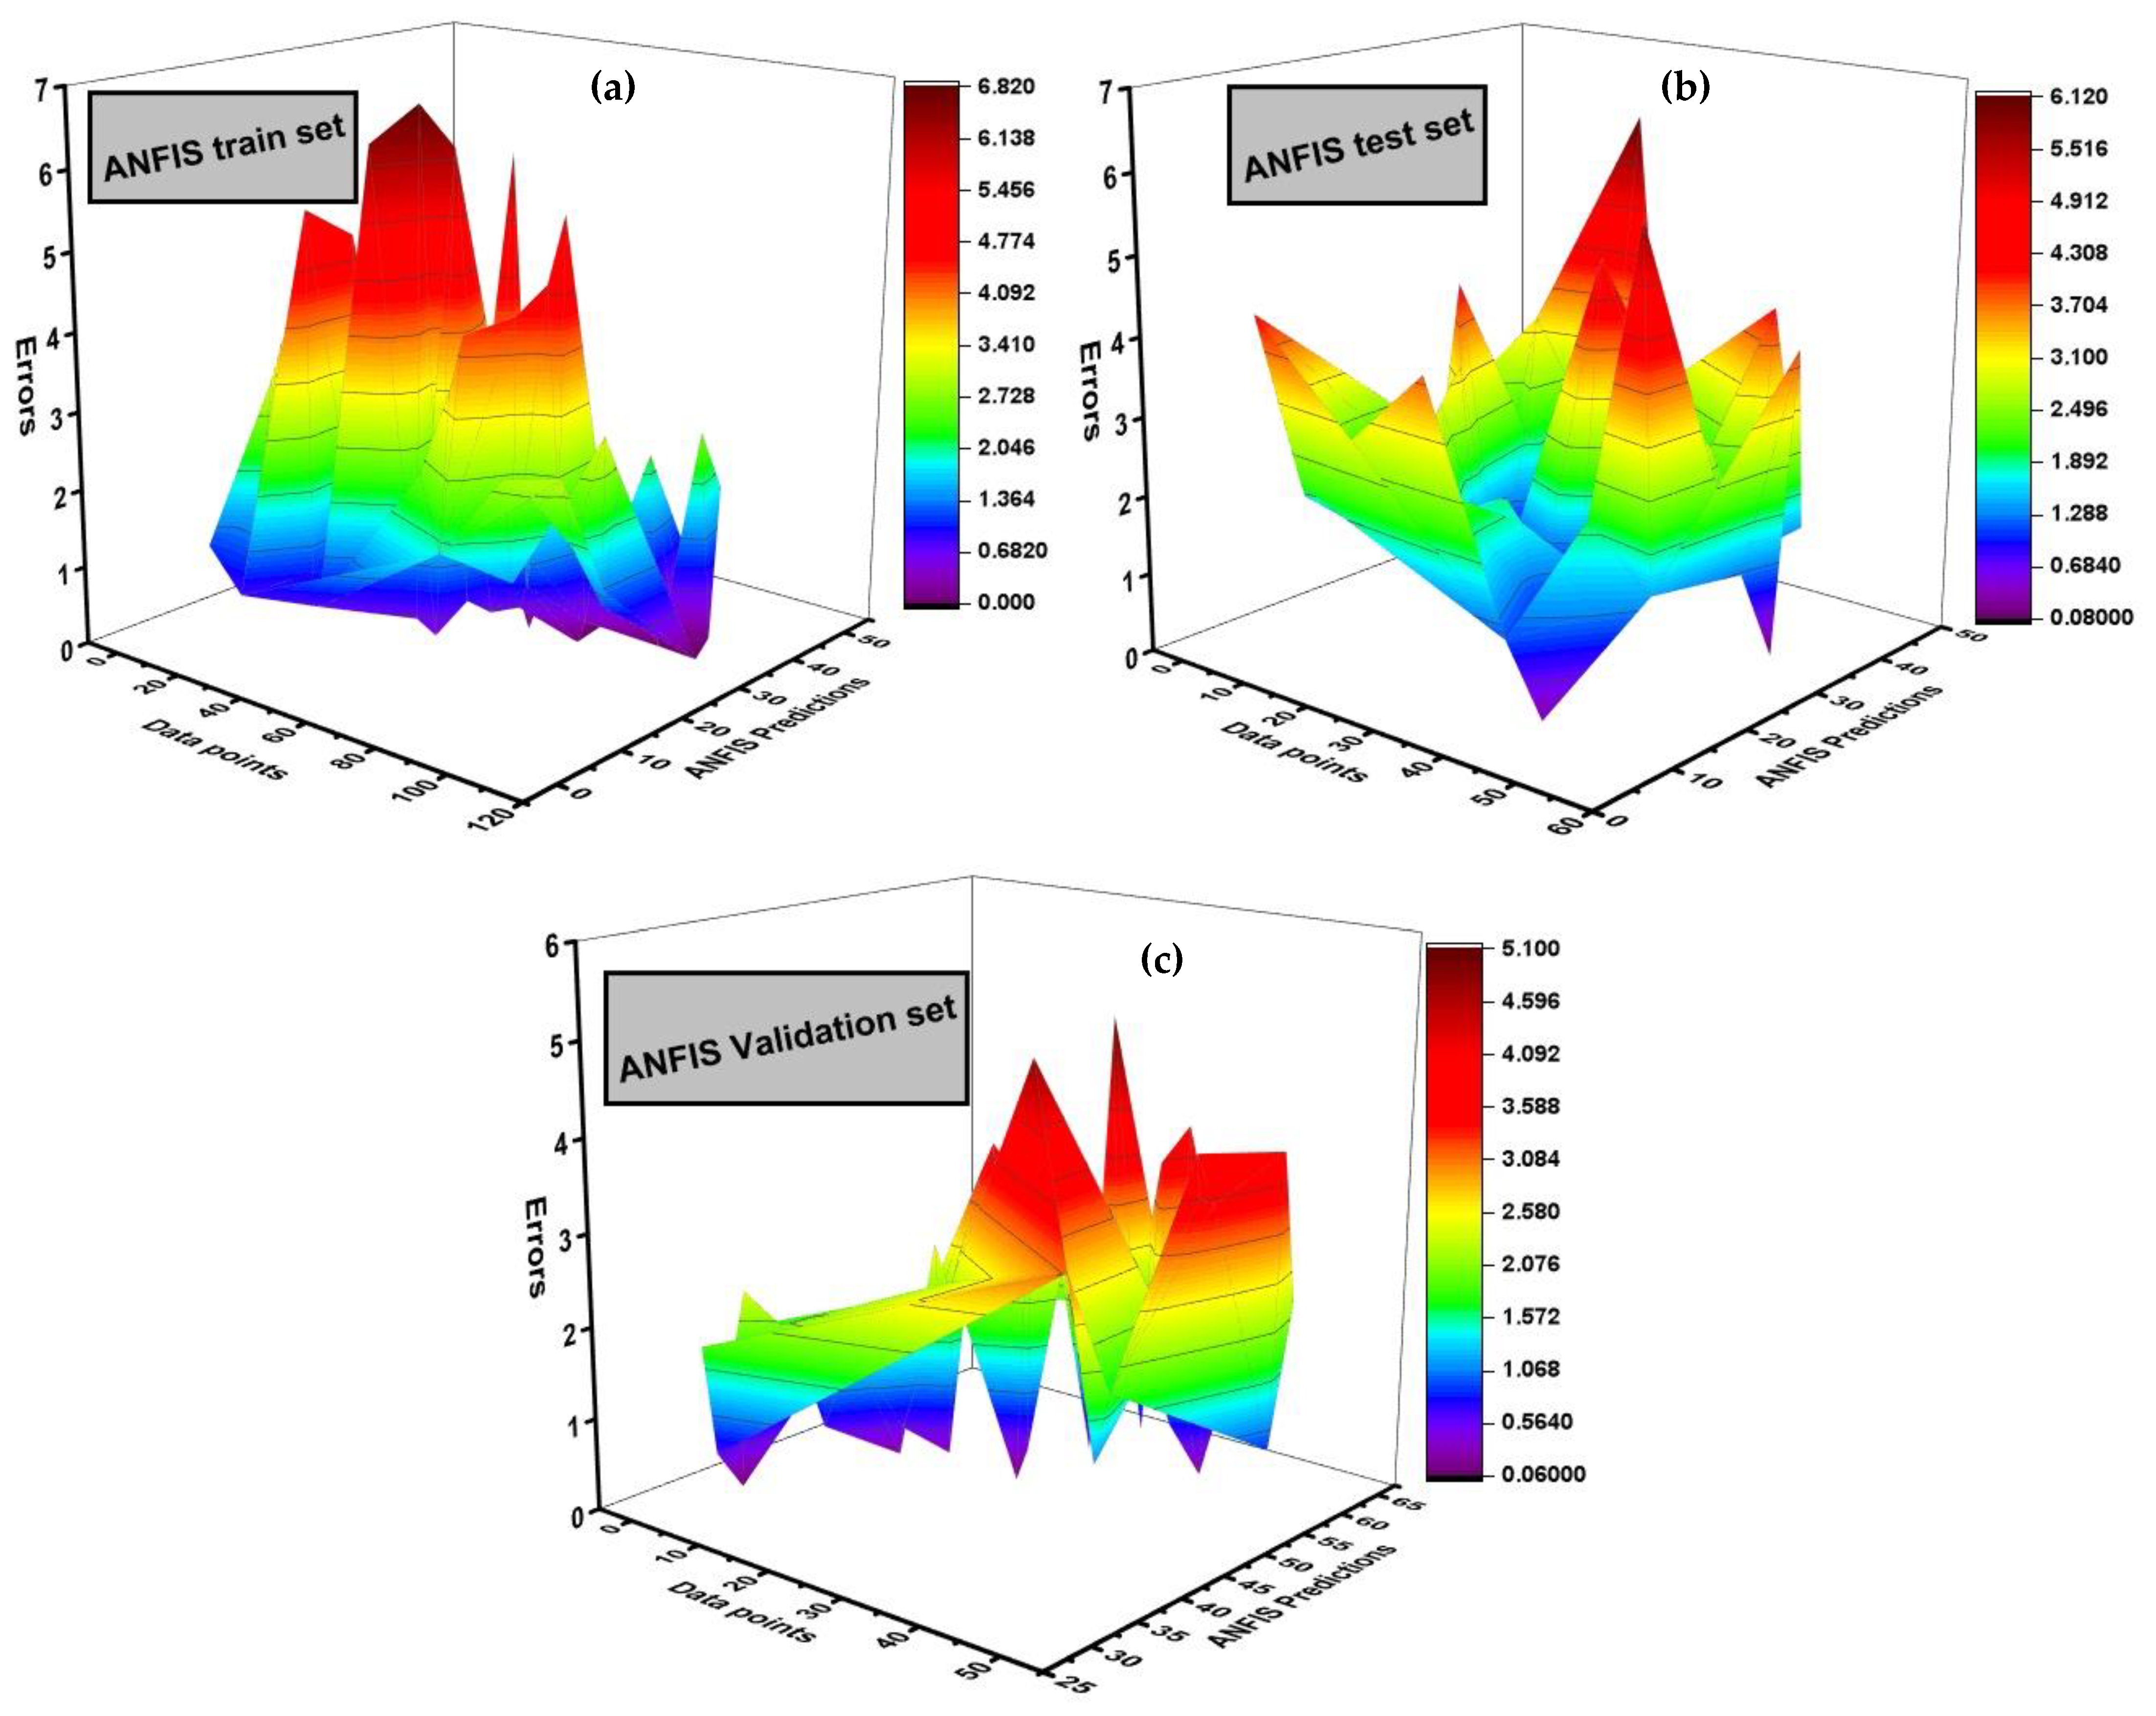
3.2.2. ANFIS Prediction Model
3.2.3. Comparison between ANN and ANFIS Predictive Models
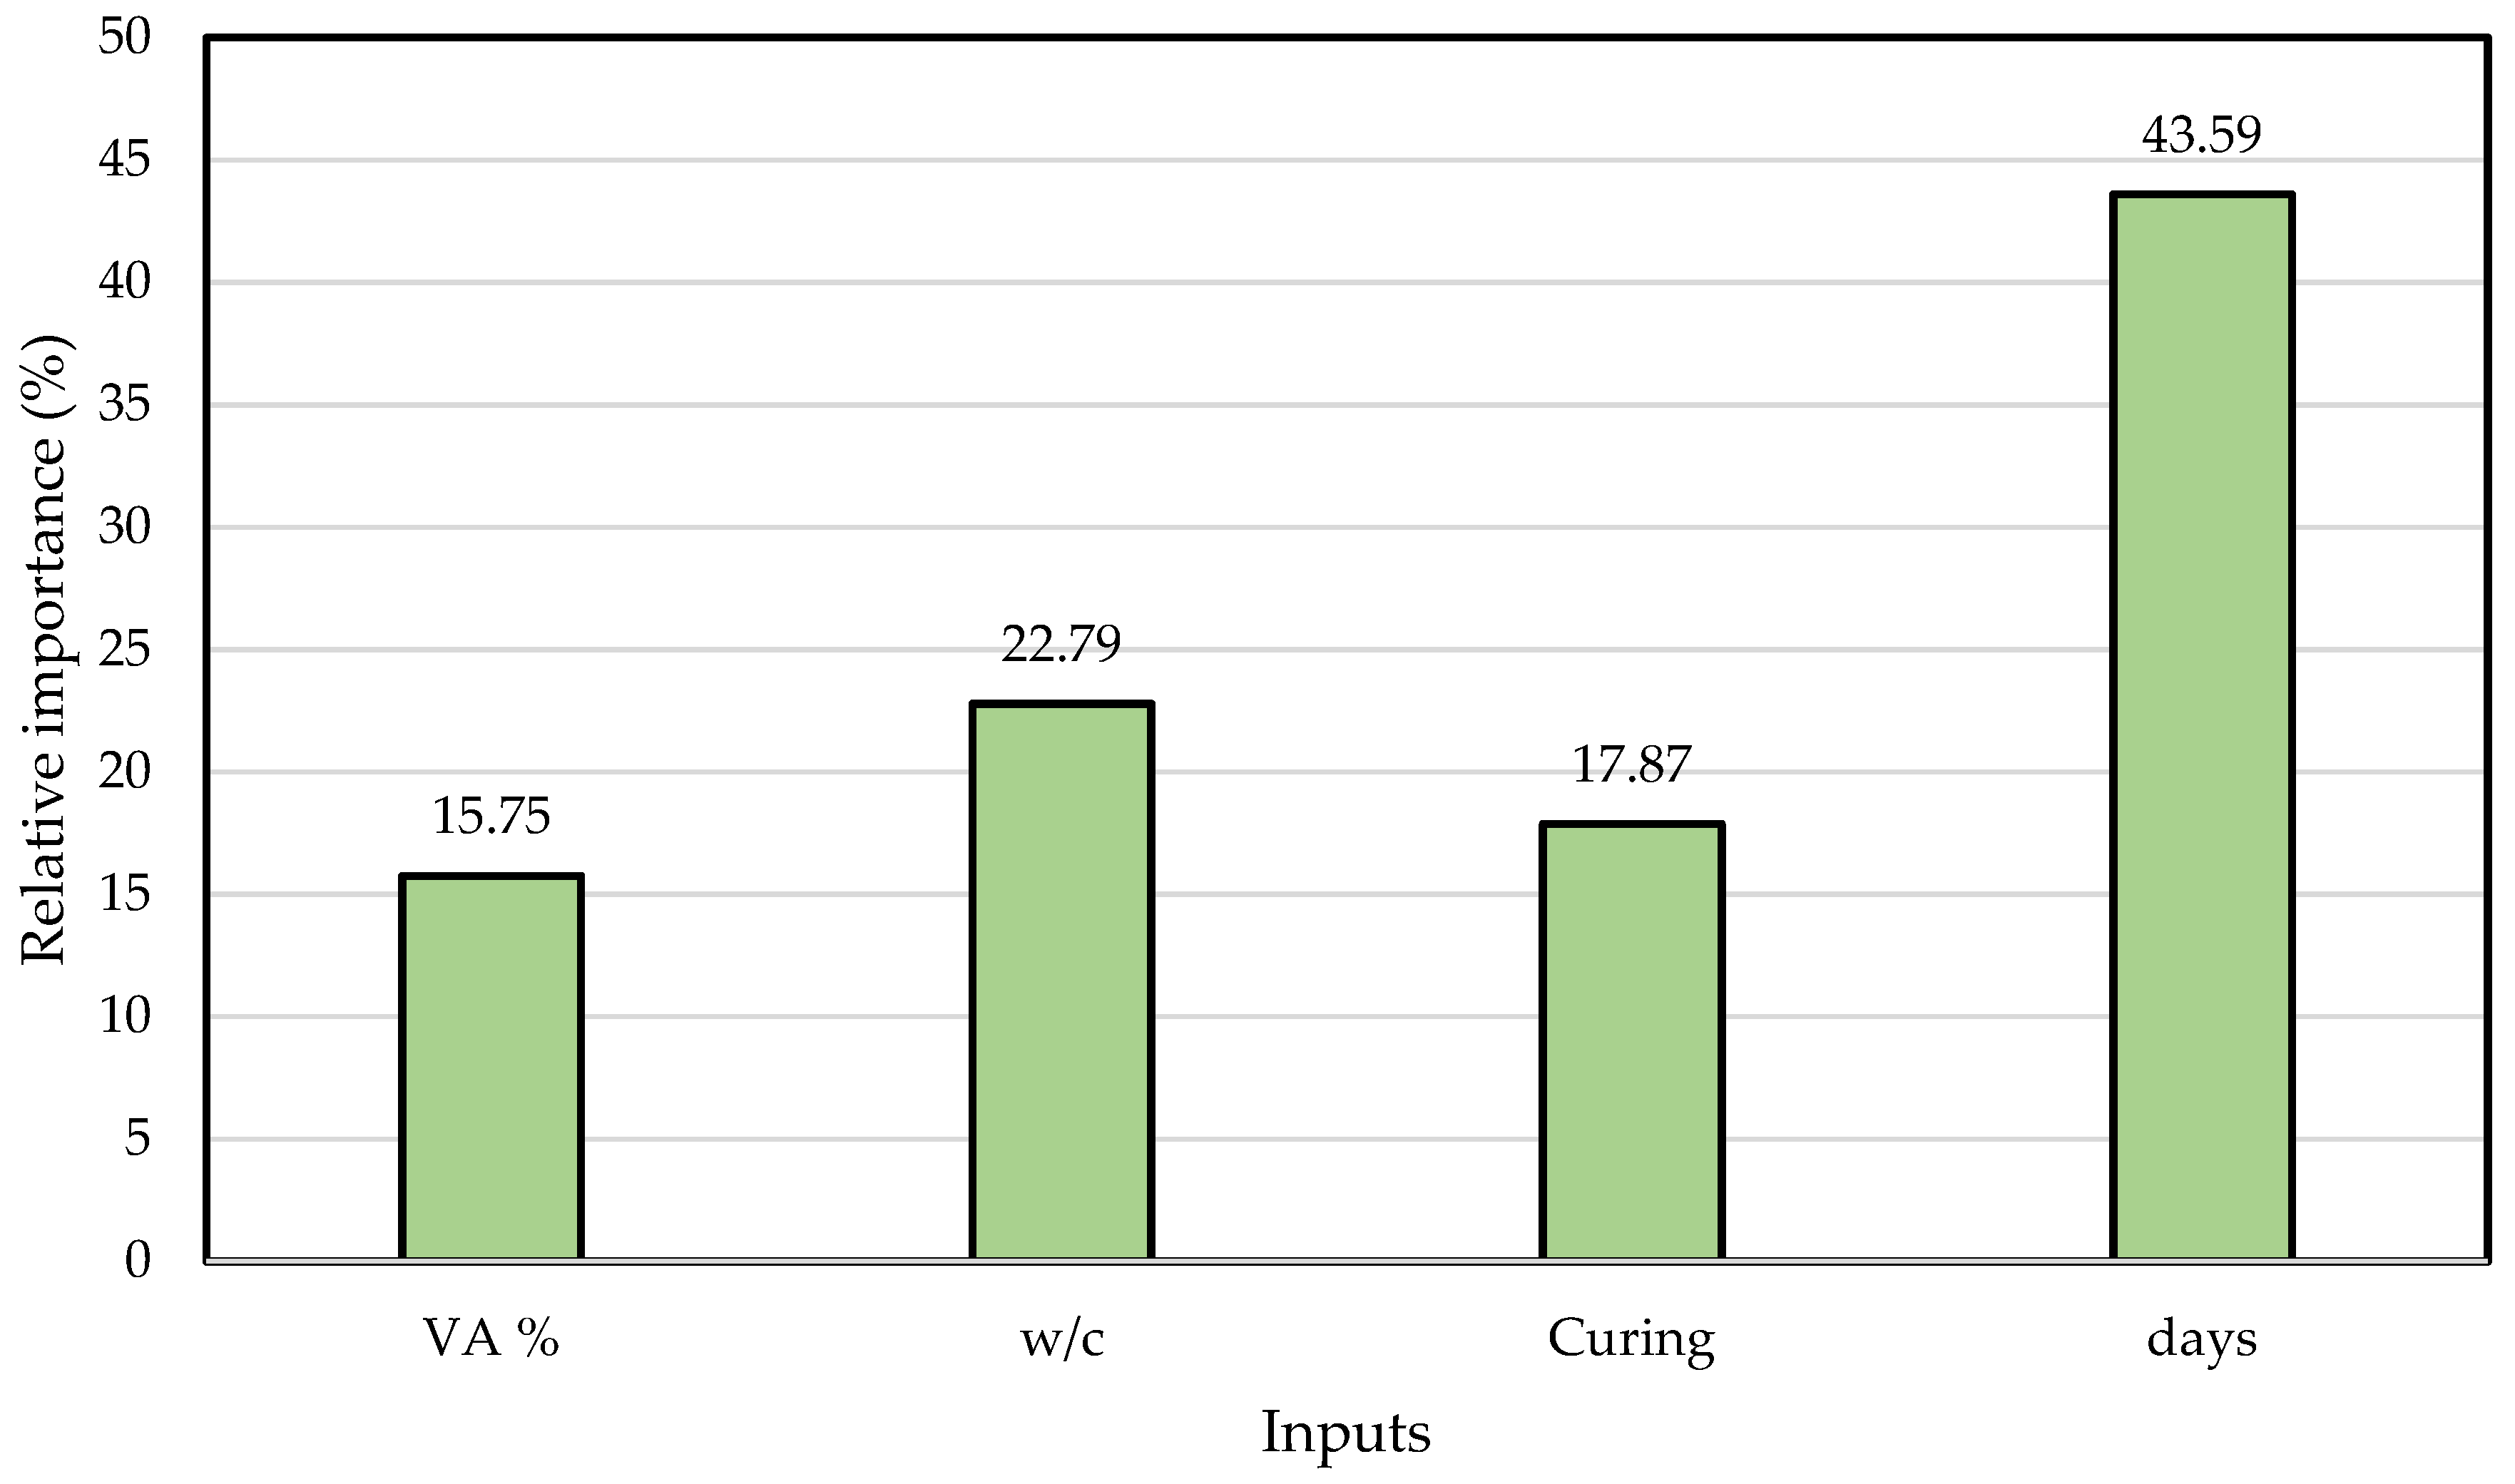
3.2.4. Permutation Feature Analysis
4. Conclusions
- Compared to the standard curing temperature (20 °C), the compressive strength of VA-containing mortar improved significantly under high curing temperatures (40 °C and 60 °C). This is a good indication that such mortar could be applied under hot environmental conditions.
- Among all mortar mixes, the mortar containing a high percentage (30%) of ultra-fine volcanic ash (VUF30) exhibited the highest compressive strength at both 40 °C and 60 °C. This indicates that VA can be used in high percentages as a partial substitute for cement.
- ANN and ANFIS algorithms were exercised to estimate the compressive strength of the VAM. The accuracy, reliability, and performance of the final proposed models were assessed using statistical indicators, including RMSE, RSE, RRMSE, MAE, ρ, and R-square. The predicted results displayed an exceptional correlation with the experimental data with R2 value above 0.9 and RMSE and MAE below 5. Based on RRMSE and performance index, the ANFIS model gave 41% and 50%, respectively, providing a better prediction than the ANN predictive model.
- The permutation feature analysis (PFA) revealed that the developed model considers the effect of all the inputs. The most influential factor affecting the strength of VAM is the age of the specimen, followed by w/c, curing temperature, and VA%.
Author Contributions
Funding
Institutional Review Board Statement
Informed Consent Statement
Data Availability Statement
Acknowledgments
Conflicts of Interest
References
- Ali Khan, M.; Zafar, A.; Akbar, A.; Javed, M.F.; Mosavi, A. Application of Gene Expression Programming (GEP) for the Prediction of Compressive Strength of Geopolymer Concrete. Materials 2021, 14, 1106. [Google Scholar] [CrossRef] [PubMed]
- Khurram, N.; Khan, K.; Saleem, M.U.; Amin, M.N.; Akmal, U. Effect of Elevated Temperatures on Mortar with Naturally Occurring Volcanic Ash and Its Blend with Electric Arc Furnace Slag. Adv. Mater. Sci. Eng. 2018, 2018, 5324036. [Google Scholar] [CrossRef] [Green Version]
- Khan, M.A.; Memon, S.A.; Farooq, F.; Javed, M.F.; Aslam, F.; Alyousef, R. Compressive Strength of Fly-Ash-Based Geopolymer Concrete by Gene Expression Programming and Random Forest. Adv. Civ. Eng. 2021, 2021, 6618407. [Google Scholar]
- Javed, M.F.; Sulong, N.H.R.; Memon, S.A.; Rehman, S.K.-U.; Khan, N.B. Experimental and Numerical Study of Flexural Behavior of Novel Oil Palm Concrete Filled Steel Tube Exposed to Elevated Temperature. J. Clean. Prod. 2018, 205, 95–114. [Google Scholar] [CrossRef]
- Javed, M.F.; Amin, M.N.; Shah, M.I.; Khan, K.; Iftikhar, B.; Farooq, F.; Aslam, F.; Alyousef, R.; Alabduljabbar, H. Applications of Gene Expression Programming and Regression Techniques for Estimating Compressive Strength of Bagasse Ash Based Concrete. Crystals 2020, 10, 737. [Google Scholar] [CrossRef]
- Iqbal, M.F.; Liu, Q.-F.; Azim, I.; Zhu, X.; Yang, J.; Javed, M.F.; Rauf, M. Prediction of Mechanical Properties of Green Concrete Incorporating Waste Foundry Sand Based on Gene Expression Programming. J. Hazard. Mater. 2020, 384, 121322. [Google Scholar] [CrossRef]
- Rehman, S.K.U.; Ibrahim, Z.; Memon, S.A.; Javed, M.F.; Khushnood, R.A. A Sustainable Graphene Based Cement Composite. Sustainability 2017, 9, 1229. [Google Scholar] [CrossRef] [Green Version]
- Saharuddin, E.; Badaruzzaman, W.W.; Al Zand, A. Polymer-Based Composite Materials for Industralised Building System in Flooding Situations. In EASEC16; Springer: Berlin/Heidelberg, Germany, 2021; pp. 1053–1062. [Google Scholar]
- Javed, U.; Khushnood, R.A.; Memon, S.A.; Jalal, F.E.; Zafar, M.S. Sustainable Incorporation of Lime-Bentonite Clay Composite for Production of Ecofriendly Bricks. J. Clean. Prod. 2020, 263, 121469. [Google Scholar] [CrossRef]
- Memon, S.A.; Khan, S.; Wahid, I.; Shestakova, Y.; Ashraf, M. Evaluating the Effect of Calcination and Grinding of Corn Stalk Ash on Pozzolanic Potential for Sustainable Cement-Based Materials. Adv. Mater. Sci. Eng. 2020, 2020, 1619480. [Google Scholar] [CrossRef] [Green Version]
- Memon, S.A.; Shah, S.F.A.; Khushnood, R.A.; Baloch, W.L. Durability of Sustainable Concrete Subjected to Elevated Temperature-A Review. Constr. Build. Mater. 2019, 199, 435–455. [Google Scholar] [CrossRef]
- Ahmad, M.R.; Chen, B.; Shah, S.F.A. Mechanical and Microstructural Characterization of Bio-Concrete Prepared with Optimized Alternative Green Binders. Constr. Build. Mater. 2021, 281, 122533. [Google Scholar] [CrossRef]
- Shah, S.F.A.; Chen, B.; Ahmad, M.R.; Haque, M.A. Development of Cleaner One-Part Geopolymer from Lithium Slag. J. Clean. Prod. 2020, 291, 125241. [Google Scholar] [CrossRef]
- Imtiaz, L.; Rehman, S.K.U.; Ali Memon, S.; Khizar Khan, M.; Faisal Javed, M. A Review of Recent Developments and Advances in Eco-Friendly Geopolymer Concrete. Appl. Sci. 2020, 10, 7838. [Google Scholar] [CrossRef]
- Rahman, S.S.; Khattak, M.J. Feasibility of Roller Compacted Geopolymer Concrete Containing Recycle Concrete Aggregate. In Tran-SET 2020; American Society of Civil Engineers: Reston, VA, USA, 2021; pp. 305–313. [Google Scholar]
- Azad, A.; Saeedian, A.; Mousavi, S.-F.; Karami, H.; Farzin, S.; Singh, V.P. Effect of Zeolite and Pumice Powders on the Environmental and Physical Characteristics of Green Concrete Filters. Constr. Build. Mater. 2020, 240, 117931. [Google Scholar] [CrossRef]
- Nematzadeh, M.; Tayebi, M.; Samadvand, H. Prediction of Ultrasonic Pulse Velocity in Steel Fiber-Reinforced Concrete Containing Nylon Granule and Natural Zeolite after Exposure to Elevated Temperatures. Constr. Build. Mater. 2021, 273, 121958. [Google Scholar] [CrossRef]
- Masood, B.; Elahi, A.; Barbhuiya, S.; Ali, B. Mechanical and Durability Performance of Recycled Aggregate Concrete Incorporating Low Calcium Bentonite. Constr. Build. Mater. 2020, 237, 117760. [Google Scholar] [CrossRef]
- Ahmad, J.; Tufail, R.F.; Aslam, F.; Mosavi, A.; Alyousef, R.; Faisal Javed, M.; Zaid, O.; Khan Niazi, M.S. A Step towards Sustainable Self-Compacting Concrete by Using Partial Substitution of Wheat Straw Ash and Bentonite Clay Instead of Cement. Sustainability 2021, 13, 824. [Google Scholar] [CrossRef]
- Omrane, M.; Rabehi, M. Effect of Natural Pozzolan and Recycled Concrete Aggregates on Thermal and Physico-Mechanical Characteristics of Self-Compacting Concrete. Constr. Build. Mater. 2020, 247, 118576. [Google Scholar] [CrossRef]
- Haddad, R.H.; Lababneh, Z.K. Geopolymer Composites Using Natural Pozzolan and Oil-Shale Ash Base Materials: A Parametric Study. Constr. Build. Mater. 2020, 240, 117899. [Google Scholar] [CrossRef]
- Amin, M.N.; Hissan, S.; Shahzada, K.; Khan, K.; Bibi, T. Pozzolanic Reactivity and the Influence of Rice Husk Ash on Early-Age Autogenous Shrinkage of Concrete. Front. Mater. 2019, 6, 150. [Google Scholar] [CrossRef]
- Amin, M.N.; Murtaza, T.; Shahzada, K.; Khan, K.; Adil, M. Pozzolanic Potential and Mechanical Performance of Wheat Straw Ash Incorporated Sustainable Concrete. Sustainability 2019, 11, 519. [Google Scholar] [CrossRef] [Green Version]
- Belfiore, C.M.; Amato, C.; Pezzino, A.; Viccaro, M. An End of Waste Alternative for Volcanic Ash: A Resource in the Manufacture of Ceramic Tiles. Constr. Build. Mater. 2020, 263, 120118. [Google Scholar] [CrossRef]
- Xie, T.; Yang, G.; Zhao, X.; Xu, J.; Fang, C. A Unified Model for Predicting the Compressive Strength of Recycled Aggregate Concrete Containing Supplementary Cementitious Materials. J. Clean. Prod. 2020, 251, 119752. [Google Scholar] [CrossRef]
- Muthukrishnan, S.; Kua, H.W.; Yu, L.N.; Chung, J.K. Fresh Properties of Cementitious Materials Containing Rice Husk Ash for Construction 3D Printing. J. Mater. Civ. Eng. 2020, 32, 04020195. [Google Scholar] [CrossRef]
- Elahi, M.M.A.; Shearer, C.R.; Reza, A.N.R.; Saha, A.K.; Khan, M.N.N.; Hossain, M.M.; Sarker, P.K. Improving the Sulfate Attack Resistance of Concrete by Using Supplementary Cementitious Materials (SCMs): A Review. Constr. Build. Mater. 2021, 281, 122628. [Google Scholar] [CrossRef]
- Zhou, A.; Zhang, W.; Wei, H.; Liu, T.; Zou, D.; Guo, H. A Novel Approach for Recycling Engineering Sediment Waste as Sustainable Supplementary Cementitious Materials. Resour. Conserv. Recycl. 2021, 167, 105435. [Google Scholar] [CrossRef]
- Wang, H.; Hou, P.; Li, Q.; Adu-Amankwah, S.; Chen, H.; Xie, N.; Zhao, P.; Huang, Y.; Wang, S.; Cheng, X. Synergistic Effects of Supplementary Cementitious Materials in Limestone and Calcined Clay-Replaced Slag Cement. Constr. Build. Mater. 2021, 282, 122648. [Google Scholar] [CrossRef]
- Thomas, B.S.; Yang, J.; Mo, K.H.; Abdalla, J.A.; Hawileh, R.A.; Ariyachandra, E. Biomass Ashes from Agricultural Wastes as Supplementary Cementitious Materials or Aggregate Replacement in Cement/Geopolymer Concrete: A Comprehensive Review. J. Build. Eng. 2021, 40, 102332. [Google Scholar] [CrossRef]
- Habibi, A.; Ramezanianpour, A.M.; Mahdikhani, M. RSM-Based Optimized Mix Design of Recycled Aggregate Concrete Containing Supplementary Cementitious Materials Based on Waste Generation and Global Warming Potential. Resour. Conserv. Recycl. 2021, 167, 105420. [Google Scholar] [CrossRef]
- Sakir, S.; Raman, S.N.; Safiuddin, M.; Kaish, A.; Mutalib, A.A. Utilization of By-Products and Wastes as Supplementary Cementitious Materials in Structural Mortar for Sustainable Construction. Sustainability 2020, 12, 3888. [Google Scholar] [CrossRef]
- Liu, S.; Zhu, M.; Ding, X.; Ren, Z.; Zhao, S.; Zhao, M.; Dang, J. High-Durability Concrete with Supplementary Cementitious Admixtures Used in Corrosive Environments. Crystals 2021, 11, 196. [Google Scholar] [CrossRef]
- Shakouri, M.; Exstrom, C.L.; Ramanathan, S.; Suraneni, P. Hydration, Strength, and Durability of Cementitious Materials Incorporating Untreated Corn Cob Ash. Constr. Build. Mater. 2020, 243, 118171. [Google Scholar] [CrossRef]
- Ibrahim, M.; Johari, M.A.M.; Hussaini, S.R.; Rahman, M.K.; Maslehuddin, M. Influence of Pore Structure on the Properties of Green Concrete Derived from Natural Pozzolan and Nanosilica. J. Sustain. Cem.-Based Mater. 2020, 9, 233–257. [Google Scholar] [CrossRef]
- Ibrahim, M.; Rahman, M.K.; Johari, M.A.M.; Nasir, M.; Oladapo, E.A. Chloride Diffusion and Chloride-Induced Corrosion of Steel Embedded in Natural Pozzolan-Based Alkali Activated Concrete. Constr. Build. Mater. 2020, 262, 120669. [Google Scholar] [CrossRef]
- Amran, Y.M.; Soto, M.G.; Alyousef, R.; El-Zeadani, M.; Alabduljabbar, H.; Aune, V. Performance Investigation of High-Proportion Saudi-Fly-Ash-Based Concrete. Results Eng. 2020, 6, 100118. [Google Scholar] [CrossRef]
- Amin, M.N.; Khan, K. Mechanical Performance of High-Strength Sustainable Concrete under Fire Incorporating Locally Available Volcanic Ash in Central Harrat Rahat, Saudi Arabia. Materials 2021, 14, 21. [Google Scholar] [CrossRef]
- Siddique, R. Properties of Concrete Made with Volcanic Ash. Resour. Conserv. Recycl. 2012, 66, 40–44. [Google Scholar] [CrossRef]
- Siddique, R. Effect of volcanic ash on the properties of cement paste and mortar. Resour. Conserv. Recycl. 2011, 56, 66–70. [Google Scholar] [CrossRef]
- Hossain, K.; Lachemi, M. Fresh, Mechanical, and Durability Characteristics of Self-Consolidating Concrete Incorporating Volcanic Ash. J. Mater. Civ. Eng. 2010, 22, 651–657. [Google Scholar] [CrossRef]
- Khan, K.; Amin, M.N.; Saleem, M.U.; Qureshi, H.J.; Al-Faiad, M.A.; Qadir, M.G. Effect of Fineness of Basaltic Volcanic Ash on Pozzolanic Reactivity, ASR Expansion and Drying Shrinkage of Blended Cement Mortars. Materials 2019, 12, 2603. [Google Scholar] [CrossRef] [PubMed] [Green Version]
- Thorstensen, R.T.; Fidjestol, P. Inconsistencies in the Pozzolanic Strength Activity Index (SAI) for Silica Fume According to EN and ASTM. Mater. Struct. 2015, 48, 3979–3990. [Google Scholar] [CrossRef] [Green Version]
- Pekmezci, B.Y.; Akyüz, S. Optimum Usage of a Natural Pozzolan for the Maximum Compressive Strength of Concrete. Cem. Concr. Res. 2004, 34, 2175–2179. [Google Scholar] [CrossRef]
- Reuter, U.; Sultan, A.; Reischl, D.S. A Comparative Study of Machine Learning Approaches for Modeling Concrete Failure Surfaces. Adv. Eng. Softw. 2018, 116, 67–79. [Google Scholar] [CrossRef]
- Chaabene, W.B.; Flah, M.; Nehdi, M.L. Machine Learning Prediction of Mechanical Properties of Concrete: Critical Review. Constr. Build. Mater. 2020, 260, 119889. [Google Scholar] [CrossRef]
- Zhang, J.; Huang, Y.; Wang, Y.; Ma, G. Multi-Objective Optimization of Concrete Mixture Proportions Using Machine Learning and Metaheuristic Algorithms. Constr. Build. Mater. 2020, 253, 119208. [Google Scholar] [CrossRef]
- Okazaki, Y.; Okazaki, S.; Asamoto, S.; Chun, P.J. Applicability of Machine Learning to a Crack Model in Concrete Bridges. Comput. -Aided Civ. Infrastruct. Eng. 2020, 35, 775–792. [Google Scholar] [CrossRef]
- Han, T.; Siddique, A.; Khayat, K.; Huang, J.; Kumar, A. An Ensemble Machine Learning Approach for Prediction and Optimization of Modulus of Elasticity of Recycled Aggregate Concrete. Constr. Build. Mater. 2020, 244, 118271. [Google Scholar] [CrossRef]
- Cai, R.; Han, T.; Liao, W.; Huang, J.; Li, D.; Kumar, A.; Ma, H. Prediction of Surface Chloride Concentration of Marine Concrete Using Ensemble Machine Learning. Cem. Concr. Res. 2020, 136, 106164. [Google Scholar] [CrossRef]
- Nguyen, H.; Vu, T.; Vo, T.P.; Thai, H.-T. Efficient Machine Learning Models for Prediction of Concrete Strengths. Constr. Build. Mater. 2021, 266, 120950. [Google Scholar] [CrossRef]
- Olalusi, O.B.; Awoyera, P.O. Shear Capacity Prediction of Slender Reinforced Concrete Structures with Steel Fibers Using Machine Learning. Eng. Struct. 2021, 227, 111470. [Google Scholar] [CrossRef]
- Zhang, J.; Huang, Y.; Ma, G.; Nener, B. Mixture Optimization for Environmental, Economical and Mechanical Objectives In Silica Fume Concrete: A Novel Frame-Work Based on Machine Learning and a New Meta-Heuristic Algorithm. Resour. Conserv. Recycl. 2021, 167, 105395. [Google Scholar] [CrossRef]
- Cuong-Le, T.; Nghia-Nguyen, T.; Khatir, S.; Trong-Nguyen, P.; Mirjalili, S.; Nguyen, K.D. An Efficient Approach for Damage Identification Based on Improved Machine Learning Using PSO-SVM. Eng. Comput. 2021, 1–16. [Google Scholar] [CrossRef]
- Lin, S.-S.; Shen, S.-L.; Zhou, A.; Xu, Y.-S. Risk Assessment and Management of Excavation System Based on Fuzzy Set Theory and Machine Learning Methods. Autom. Constr. 2021, 122, 103490. [Google Scholar] [CrossRef]
- Marcelino, P.; de Lurdes Antunes, M.; Fortunato, E.; Gomes, M.C. Machine Learning Approach for Pavement Performance Prediction. Int. J. Pavement Eng. 2021, 22, 341–354. [Google Scholar] [CrossRef]
- Avci, O.; Abdeljaber, O.; Kiranyaz, S.; Hussein, M.; Gabbouj, M.; Inman, D.J. A Review of Vibration-Based Damage Detection in Civil Structures: From Traditional Methods to Machine Learning and Deep Learning Applications. Mech. Syst. Signal Process. 2021, 147, 107077. [Google Scholar] [CrossRef]
- Naser, M. Mechanistically Informed Machine Learning and Artificial Intelligence in Fire Engineering and Sciences. Fire Technol. 2021, 1–44. [Google Scholar] [CrossRef]
- Pham, B.T.; Nguyen, M.D.; Nguyen-Thoi, T.; Ho, L.S.; Koopialipoor, M.; Quoc, N.K.; Armaghani, D.J.; Van Le, H. A Novel Approach for Classification of Soils Based on Laboratory Tests Using Adaboost, Tree and ANN Modeling. Transp. Geotech. 2021, 27, 100508. [Google Scholar] [CrossRef]
- Abdullah, M.S.; Alaloul, W.S.; Liew, M.; Musarat, M.A. Delay and Cost Overrun of Palm Oil Refinery Construction Projects: Artificial Neural Network (ANN) Model. In Proceedings of the International Conference on Civil, Offshore and Environmental Engineering; Springer: Singapore, 2021; pp. 580–589. [Google Scholar]
- Liu, J.; Jiang, Y.; Han, W.; Sakaguchi, O. Optimized ANN Model for Predicting Rock Mass Quality ahead of Tunnel Face Using Measure-While-Drilling Data. Bull. Eng. Geol. Environ. 2021, 80, 2283–2305. [Google Scholar] [CrossRef]
- ASTM Committee C-09 on Concrete and Concrete Aggregates. Standard Specification for Coal Fly Ash and Raw or Calcined Natural Pozzolan for Use as a Mineral Admixture in Concrete; ASTM International: West Conshohocken, PA, USA, 2019. [Google Scholar]
- ASTM Committee C-09 on Concrete and Concrete Aggregates. Standard Practice for Making and Curing Concrete Test Specimens in the Laboratory; ASTM International: West Conshohocken, PA, USA, 2016. [Google Scholar]
- Khan, K.; Amin, M.N. Influence of Fineness of Volcanic Ash and Its Blends with Quarry Dust and Slag on Compressive Strength of Mortar under Different Curing Temperatures. Constr. Build. Mater. 2017, 154, 514–528. [Google Scholar] [CrossRef]
- Azim, I.; Yang, J.; Iqbal, M.F.; Mahmood, Z.; Javed, M.F.; Wang, F.; Liu, Q.-f. Prediction of Catenary Action Capacity of RC Beam-Column Substructures under a Missing Column Scenario Using Evolutionary Algorithm. KSCE J. Civ. Eng. 2021, 25, 891–905. [Google Scholar] [CrossRef]
- Shah, M.I.; Javed, M.F.; Abunama, T. Proposed Formulation of Surface Water Quality and Modelling Using Gene Expression, Machine Learning, and Regression Techniques. Environ. Sci. Pollut. Res. 2020, 28, 13202–13220. [Google Scholar] [CrossRef] [PubMed]
- Dao, D.V.; Ly, H.-B.; Vu, H.-L.T.; Le, T.-T.; Pham, B.T. Investigation and Optimization of the C-ANN Structure in Predicting the Compressive Strength of Foamed Concrete. Materials 2020, 13, 1072. [Google Scholar] [CrossRef] [PubMed] [Green Version]
- Kumar, S.; Roshni, T.; Himayoun, D. A Comparison of Emotional Neural Network (ENN) and Artificial Neural Network (ANN) Approach for Rainfall-Runoff Modelling. Civ. Eng. J. 2019, 5, 2120–2130. [Google Scholar] [CrossRef]
- Chakraborty, A.; Goswami, D. Prediction of Slope Stability Using Multiple Linear Regression (MLR) and Artificial Neural Network (ANN). Arab. J. Geosci. 2017, 10, 385. [Google Scholar] [CrossRef]
- McCulloch, W.S.; Pitts, W. A Logical Calculus of the Ideas Immanent in Nervous Activity. Bull. Math. Biophys. 1943, 5, 115–133. [Google Scholar] [CrossRef]
- Moayedi, H.; Mehrabi, M.; Mosallanezhad, M.; Rashid, A.S.A.; Pradhan, B. Modification of Landslide Susceptibility Mapping Using Optimized PSO-ANN Technique. Eng. Comput. 2019, 35, 967–984. [Google Scholar] [CrossRef]
- Zadeh, L.A. Fuzzy Sets, in Fuzzy Sets, Fuzzy Logic, and fuzzy Systems: Selected Papers by Lotfi a Zadeh; World Scientific Publishing: Singapore, 1996; pp. 394–432. [Google Scholar]
- Khan, M.A.; Zafar, A.; Farooq, F.; Faisal Javed, M.; Alyousef, R.; Alabduljabbar, H.; Khan, M.I. Geopolymer Concrete Compressive Strength via Artificial Neural Network, Adaptive Neuro Fuzzy Interface System, and Gene Expression Programming with K-Fold Cross Validation. Front. Mater. 2021, 8, 621163. [Google Scholar] [CrossRef]
- Jalal, F.E.; Xu, Y.; Iqbal, M.; Faisal Javed, M.; Jamhiri, B. Predictive Modeling of Swell-Strength of Expansive Soils Using Artificial Intelligence Approaches: ANN, ANFIS and GEP. J. Environ. Manag. 2021, 289, 112420. [Google Scholar] [CrossRef] [PubMed]
- Shannag, M.J.; Yeginobali, A. Properties of Pastes, Mortars and Concretes Containing Natural Pozzolan. Cem. Concr. Res. 1995, 25, 647–657. [Google Scholar] [CrossRef]
- Hossain, K.M.A. Blended Cement Using Volcanic Ash and Pumice. Cem. Concr. Res. 2003, 33, 1601–1605. [Google Scholar] [CrossRef]
- Ezziane, K.; Bougara, A.; Kadri, A.; Khelafi, H.; Kadri, E. Compressive Strength of Mortar Containing Natural Pozzolan under Various Curing Temperature. Cem. Concr. Compos. 2007, 29, 587–593. [Google Scholar] [CrossRef]
- Ezziane, K.; Kadri, E.-H.; Bougara, A.; Bennacer, R. Analysis of Mortar Long-Term Strength with Supplementary Cementitious Materials Cured at Different Temperatures. ACI Mater. J. 2010, 107, 323–331. [Google Scholar]
- Letelier, V.; Ortega, J.M.; Tremiño, R.M.; Henriquéz-Jara, B.I.; Fustos, I.; Real-Herraiz, T.; Moriconi, G.; Climent, M.Á.; Sánchez, I. The Use of Volcanic Powder as a Cement Replacement for the Development of Sustainable Mortars. Appl. Sci. 2020, 10, 1460. [Google Scholar] [CrossRef] [Green Version]
- Celik, K.; Hay, R.; Hargis, C.W.; Moon, J. Effect of Volcanic Ash Pozzolan or Limestone Replacement on Hydration of Portland Cement. Constr. Build. Mater. 2019, 197, 803–812. [Google Scholar] [CrossRef]
- Fares, G.; Alhozaimy, A.; Alawad, O.A.; Al-Negheimish, A. Evaluation of Powdered Scoria Rocks from Various Volcanic Lava Fields as Cementitious Material. J. Mater. Civ. Eng. 2016, 28, 04015139. [Google Scholar] [CrossRef]
- Mohamad, S.A.; Al-Hamd, R.K.S.; Khaled, T.T. Investigating the Effect of Elevated Temperatures on the Properties of Mortar Produced with Volcanic Ash. Innov. Infrastruct. Solut. 2020, 5, 25. [Google Scholar] [CrossRef]
- Al-Fadala, S.; Chakkamalayath, J.; Al-Bahar, S.; Al-Aibani, A.; Ahmed, S. Significance of Performance Based Specifications in the Qualification and Characterization of Blended Cement Using Volcanic Ash. Constr. Build. Mater. 2017, 144, 532–540. [Google Scholar] [CrossRef]
- Siddique, R.; Singh, G. Utilization of Waste Foundry Sand (WFS) in Concrete Manufacturing. Resour. Conserv. Recycl. 2011, 55, 885–892. [Google Scholar] [CrossRef]
- Iqbal, M.F.; Faisal Javed, M.; Rauf, M.; Azim, I.; Ashraf, M.; Yang, J.; Liu, Q.-F. Sustainable Utilization of Foundry Waste: Forecasting Mechanical Properties of Foundry Sand Based Concrete Using Multi-Expression Programming. Sci. Total. Environ. 2021, 780, 146524. [Google Scholar] [CrossRef]
- Chu, H.-H.; Ali Khan, M.; Javed, M.; Zafar, A.; Khan, M.I.; Alabduljabbar, H.; Qayyum, S. Sustainable Use of Fly-Ash: Use of Gene-Expression Programming (GEP) and Multi-Expression Programming (MEP) for Forecasting the Compressive Strength Geopolymer Concrete. Ain Shams Eng. J. 2021, in press. [Google Scholar] [CrossRef]


| OPC | VA | |
|---|---|---|
| Physical Characteristics | ||
| Specific gravity in g/cm3 | 3.150 | 2.640 |
| Blain fineness in m2/kg | 344 | − |
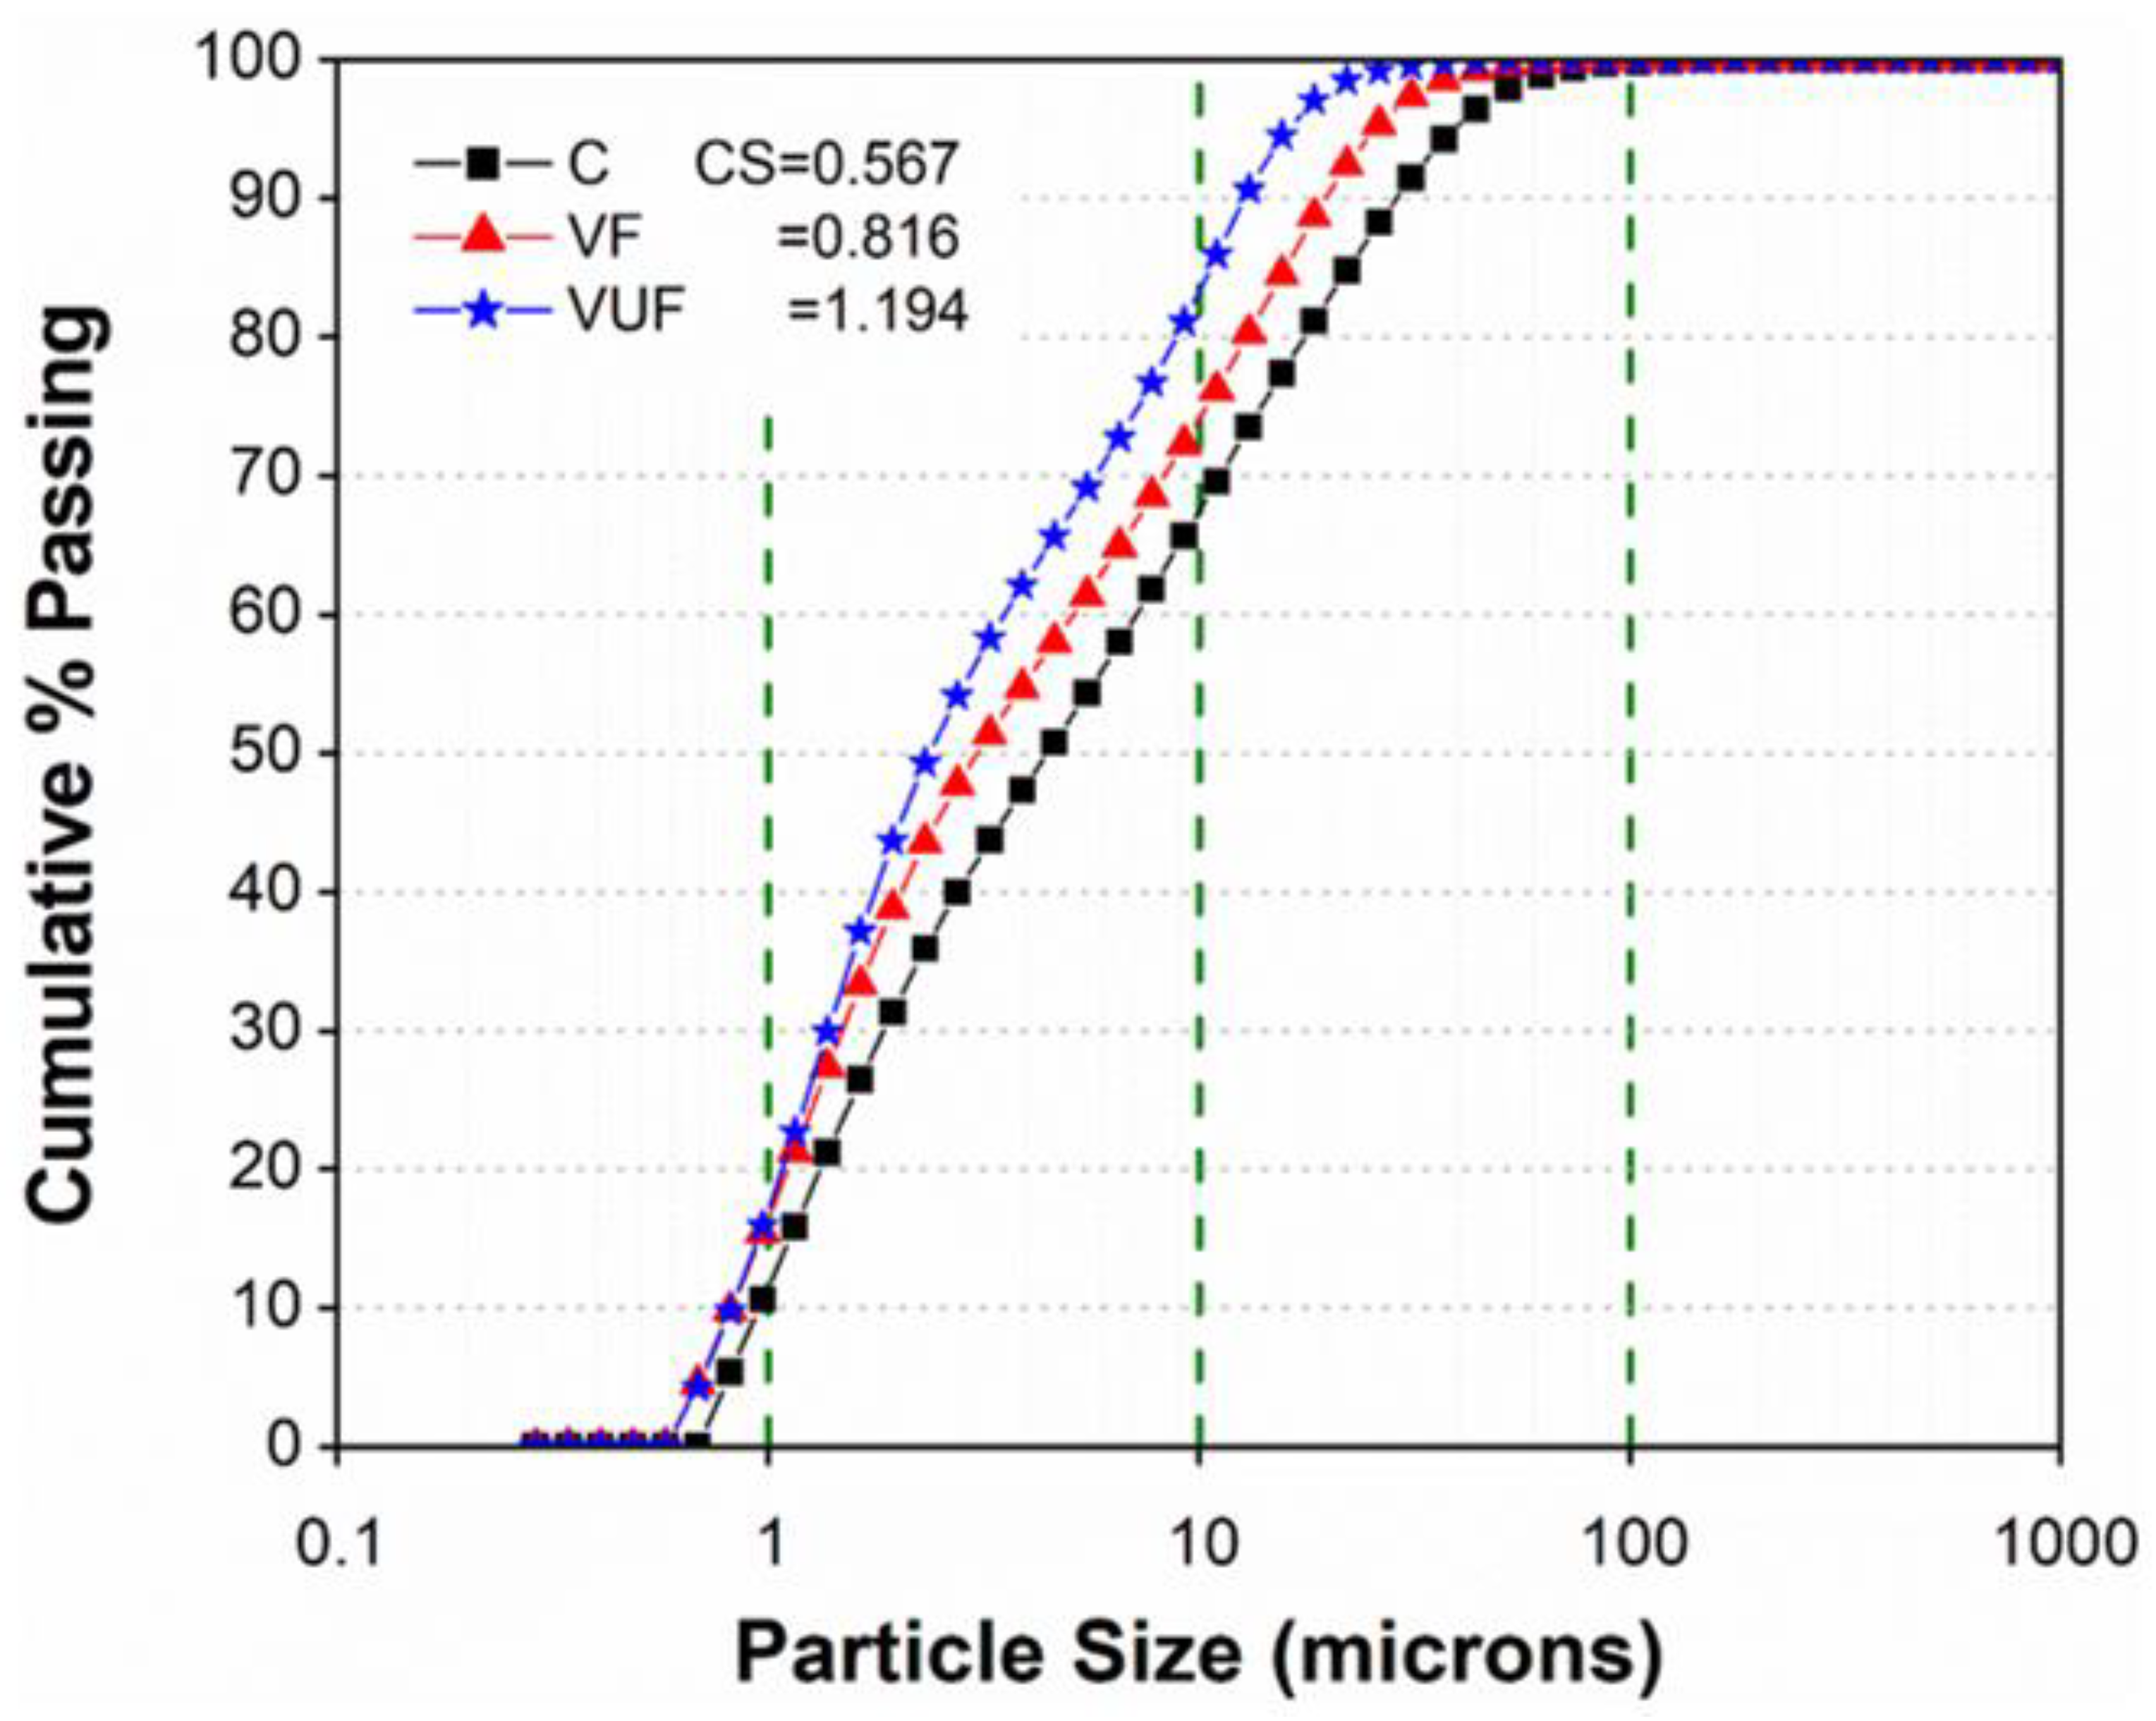
| Fineness (m2/cc) by Microtrac S3500 | 0.567 | 0.816 (˂38 µ) for VF |
| 1.194 (˂20 µ) for VUF | ||
| Chemical Characteristics(% of Oxides by Weight) | ||
| SiO2 | 20.9 | 46.4 |
| Al2O3 | 5.18 | 14.4 |
| Fe2O3 | 3.04 | 12.8 |
| (SiO2 + Al2O3 + Fe2O3) * | − | 73.6 |
| CaO | 63.9 | 8.80 |
| MgO | 1.65 | 8.30 |
| Na2O | 0.10 | 3.80 |
| K2O | 0.52 | 1.90 |
| SO3 | 2.61 | 0.80 |
| LOI ** | 2.51 | 2.80 |
| Compounds (%) | ||
| C3S | 52.1 | − |
| C2S | 19.6 | − |
| C3A | 8.17 | − |
| C4AF | 8.81 | − |
| Sieve Number | Size of Sieve (mm) | Weight Retained (g) | Weight Retained (%) | Cumulative Percent Passing (%) | Cumulative Percent Retained (%) |
|---|---|---|---|---|---|
| 3/8 inch | 9.5 | 0 | 0 | 100 | 0 |
| No. 4 | 4.75 | 0 | 0 | 100 | 0 |
| No. 8 | 2.36 | 0 | 0 | 100 | 0 |
| No. 16 | 1.18 | 134 | 26.80 | 73.20 | 26.80 |
| No. 30 | 0.600 | 179 | 35.80 | 37.40 | 62.60 |
| No. 50 | 0.300 | 49.0 | 09.80 | 27.60 | 72.40 |
| No. 100 | 0.150 | 98.8 | 19.76 | 7.840 | 92.16 |
| Pan − | 39.2 | 7.84 | 0 | − | |
| Batch Quantities in ‘g’ for Nine Mortar Specimens 50 mm3 Size | |||||
|---|---|---|---|---|---|
| Mix Identification | OPC Replacement in % | Water | OPC | VA | Sand (s) |
| Control Mix (CM) | 0 | 364 | 750 | 0 | 2063 |
| 10% VF (VF10) | 10 | 364 | 675 | 75 | 2063 |
| 20% VF (VF20) | 20 | 364 | 600 | 150 | 2063 |
| 30% VUF (VUF30) | 30 | 364 | 525 | 225 | 2063 |
| Hyper-Parameters | ANN |
|---|---|
| Neurons in Input Layer | 4 |
| Hidden Layers | 2 |
| Neurons in 1st Hidden Layer | 5 |
| Neurons in 2nd Hidden Layer | 5 |
| Neurons in Output Layer | 1 |
| Parameters | ANFIS |
|---|---|
| Linear Parameters | 243 |
| Non-Linear Parameters | 45 |
| Total Parameters | 288 |
| Data Division | Subtractive Clustering |
| Fuzzy Rule | 243 |
| Nodes | 524 |
| Membership Functions | 4 |
| Training Epochs | 55 |
| Training Error Goal | 0 |
| Optimization Method | Back-Propagation and Least-Squares |
| Type of MF | Trimf |
| Fuzzy Structure | Takagi-Sugeno |
| Output Function | Linear |
| Descriptive Statistics | Input Variables | Response Parameter | ||||
|---|---|---|---|---|---|---|
| VA Percentage | Curing Temp | Days | W/C | Sand/Cement | Compressive Strength | |
| Total Data | ||||||
| Mean | 20.45 | 33.37 | 32.68 | 0.47 | 2.92 | 30.27 |
| Standard Error | 0.95 | 1.03 | 2.46 | 0.00 | 0.01 | 1.05 |
| Median | 20.00 | 24.00 | 28.00 | 0.47 | 3.00 | 29.70 |
| Mode | 10.00 | 24.00 | 28.00 | 0.47 | 3.00 | 42.00 |
| Standard Deviation | 13.70 | 14.75 | 35.36 | 0.04 | 0.12 | 15.07 |
| Sample Variance | 187.80 | 217.66 | 1250.3 | 0.00 | 0.01 | 227.10 |
| Kurtosis | −0.71 | −0.71 | −0.60 | 2.42 | −1.28 | −0.69 |
| Skewness | 0.34 | 0.92 | 0.95 | −1.82 | −0.86 | 0.26 |
| Range | 50.00 | 40.00 | 119.00 | 0.15 | 0.25 | 61.30 |
| Minimum | 0.00 | 20.00 | 1.00 | 0.35 | 2.75 | 3.50 |
| Maximum | 50.00 | 60.00 | 120.00 | 0.50 | 3.00 | 64.80 |
| Sum | 4233.0 | 6908.00 | 6764.0 | 96.77 | 605.25 | 6266.20 |
| Count | 207.00 | 207.00 | 207.00 | 207.0 | 207.00 | 207.00 |
| Training Data (70%) | ||||||
| Mean | 22.84 | 32.17 | 27.38 | 0.47 | 2.99 | 23.62 |
| Standard Error | 1.46 | 1.35 | 3.22 | 0.00 | 0.01 | 1.05 |
| Median | 20.00 | 24.00 | 7.00 | 0.47 | 3.00 | 23.95 |
| Mode | 10.00 | 24.00 | 3.00 | 0.47 | 3.00 | 35.00 |
| Standard Deviation | 14.86 | 13.80 | 32.81 | 0.04 | 0.06 | 10.71 |
| Sample Variance | 220.91 | 190.32 | 1076.4 | 0.00 | 0.00 | 114.67 |
| Kurtosis | −0.99 | −0.04 | 0.27 | 1.34 | 13.07 | −0.79 |
| Skewness | 0.23 | 1.22 | 1.23 | −1.50 | −3.85 | 0.03 |
| Range | 50.00 | 40.00 | 119.00 | 0.15 | 0.25 | 43.50 |
| Minimum | 0.00 | 20.00 | 1.00 | 0.35 | 2.75 | 3.50 |
| Maximum | 50.00 | 60.00 | 120.00 | 0.50 | 3.00 | 47.00 |
| Sum | 2375.0 | 3346.00 | 2847.0 | 48.48 | 310.50 | 2456.60 |
| Count | 104.00 | 104.00 | 104.00 | 104.0 | 104.00 | 104.00 |
| Testing Data (15%) | ||||||
| Mean | 21.31 | 30.04 | 32.52 | 0.45 | 2.97 | 25.13 |
| Standard Error | 1.84 | 1.86 | 5.20 | 0.01 | 0.01 | 1.58 |
| Median | 20.00 | 24.00 | 10.50 | 0.47 | 3.00 | 26.05 |
| Mode | 30.00 | 24.00 | 7.00 | 0.47 | 3.00 | 39.00 |
| Standard Deviation | 13.25 | 13.43 | 37.48 | 0.05 | 0.08 | 11.39 |
| Sample Variance | 175.47 | 180.35 | 1404.9 | 0.00 | 0.01 | 129.82 |
| Kurtosis | −0.98 | 0.80 | −0.43 | 0.19 | 4.31 | −0.90 |
| Skewness | 0.04 | 1.48 | 1.03 | −1.20 | −2.48 | −0.14 |
| Range | 50.00 | 40.00 | 119.00 | 0.15 | 0.25 | 44.20 |
| Minimum | 0.00 | 20.00 | 1.00 | 0.35 | 2.75 | 4.80 |
| Maximum | 50.00 | 60.00 | 120.00 | 0.50 | 3.00 | 49.00 |
| Sum | 1108.0 | 1562.00 | 1691.0 | 23.56 | 154.50 | 1306.50 |
| Count | 52.00 | 52.00 | 52.00 | 52.00 | 52.00 | 52.00 |
| Validation Data (15%) | ||||||
| Mean | 14.71 | 39.22 | 43.65 | 0.49 | 2.75 | 49.08 |
| Standard Error | 1.35 | 2.31 | 5.09 | 0.00 | 0.00 | 1.30 |
| Median | 10.00 | 40.00 | 28.00 | 0.49 | 2.75 | 51.80 |
| Mode | 10.00 | 20.00 | 91.00 | 0.49 | 2.75 | 34.60 |
| Standard Deviation | 9.66 | 16.47 | 36.34 | 0.00 | 0.00 | 9.31 |
| Sample Variance | 93.41 | 271.37 | 1320.2 | 0.00 | 0.00 | 86.63 |
| Kurtosis | −0.91 | −1.52 | −1.63 | −2.08 | −1.28 | −0.81 |
| Skewness | 0.02 | 0.07 | 0.46 | 1.03 | −0.86 | −0.43 |
| Range | 30.00 | 40.00 | 84.00 | 0.00 | 0.00 | 35.00 |
| Minimum | 0.00 | 20.00 | 7.00 | 0.49 | 2.75 | 29.80 |
| Maximum | 30.00 | 60.00 | 91.00 | 0.49 | 2.75 | 64.80 |
| Sum | 750.00 | 2000.00 | 2226.0 | 24.74 | 140.25 | 2503.10 |
| Count | 51.00 | 51.00 | 51.00 | 51.00 | 51.00 | 51.00 |
| Mix ID | Curing Temperature (°C) | ||||||||
|---|---|---|---|---|---|---|---|---|---|
| 20 | 40 | 60 | |||||||
| Age (Days) | |||||||||
| 7 | 28 | 91 | 7 | 28 | 91 | 7 | 28 | 91 | |
| CM | 40.9 | 53.6 | 61.3 | 41.2 | 52.5 | 60.3 | 42.7 | 53.2 | 55.0 |
| VF10 | 34.6 | 45.1 | 56.6 | 38.6 | 51.8 | 56.5 | 42.0 | 47.8 | 55.5 |
| VF20 | 30.5 | 44.1 | 52.8 | 34.6 | 49.6 | 57.0 | 45.2 | 48.7 | 55.2 |
| VUF30 | 29.8 | 48.5 | 60.6 | 35.8 | 58.9 | 64.8 | 50.9 | 53.7 | 58.6 |
| Model | RMSE | MAE | RSE | ||||||
|---|---|---|---|---|---|---|---|---|---|
| ANN | Train | Validation | Test | Train | Validation | Test | Train | Validation | Test |
| 4.45 | 4.04 | 4.38 | 3.33 | 3.35 | 3.33 | 0.16 | 0.15 | 0.14 | |
| RRMSE | R-square | ρ | |||||||
| Train | Validation | Test | Train | Validation | Test | Train | Validation | Test | |
| 0.017 | 0.016 | 0.008 | 0.84 | 0.86 | 0.86 | 0.10 | 0.090 | 0.04 | |
| Model | RMSE | MAE | RSE | ||||||
|---|---|---|---|---|---|---|---|---|---|
| ANN | Train | Validation | Test | Train | Validation | Test | Train | Validation | Test |
| 2.51 | 2.47 | 2.37 | 1.82 | 2.05 | 1.99 | 0.058 | 0.052 | 0.078 | |
| RRMSE | R-square | ρ | |||||||
| Train | Validation | Test | Train | Validation | Test | Train | Validation | Test | |
| 0.01 | 0.009 | 0.004 | 0.94 | 0.95 | 0.96 | 0.05 | 0.05 | 0.02 | |
Publisher’s Note: MDPI stays neutral with regard to jurisdictional claims in published maps and institutional affiliations. |
© 2021 by the authors. Licensee MDPI, Basel, Switzerland. This article is an open access article distributed under the terms and conditions of the Creative Commons Attribution (CC BY) license (https://creativecommons.org/licenses/by/4.0/).
Share and Cite
Amin, M.N.; Javed, M.F.; Khan, K.; Shalabi, F.I.; Qadir, M.G. Modeling Compressive Strength of Eco-Friendly Volcanic Ash Mortar Using Artificial Neural Networking. Symmetry 2021, 13, 2009. https://doi.org/10.3390/sym13112009
Amin MN, Javed MF, Khan K, Shalabi FI, Qadir MG. Modeling Compressive Strength of Eco-Friendly Volcanic Ash Mortar Using Artificial Neural Networking. Symmetry. 2021; 13(11):2009. https://doi.org/10.3390/sym13112009
Chicago/Turabian StyleAmin, Muhammad Nasir, Muhammad Faisal Javed, Kaffayatullah Khan, Faisal I. Shalabi, and Muhammad Ghulam Qadir. 2021. "Modeling Compressive Strength of Eco-Friendly Volcanic Ash Mortar Using Artificial Neural Networking" Symmetry 13, no. 11: 2009. https://doi.org/10.3390/sym13112009
APA StyleAmin, M. N., Javed, M. F., Khan, K., Shalabi, F. I., & Qadir, M. G. (2021). Modeling Compressive Strength of Eco-Friendly Volcanic Ash Mortar Using Artificial Neural Networking. Symmetry, 13(11), 2009. https://doi.org/10.3390/sym13112009