Abstract
The enhancement of the detection of weak signals against a strong noise background is a key problem in local gear fault diagnosis. Because the periodic impact signal generated by local gear damage is often modulated by high-frequency components, fault information is submerged in its envelope signal when demodulating the fault signal. However, the traditional bistable stochastic resonance (BSR) system cannot accurately match the asymmetric characteristics of the envelope signal because of its symmetrical potential well, which weakens the detection performance for weak faults. In order to overcome this problem, a novel method based on underdamped asymmetric periodic potential stochastic resonance (UAPPSR) is proposed to enhance the weak feature extraction of the local gear damage. The main advantage of this method is that it can better match the characteristics of the envelope signal by using the asymmetry of its potential well in the UAPPSR system and it can effectively enhance the extraction effect of periodic impact signals. Furthermore, the proposed method enjoys a good anti-noise capability and robustness and can strengthen weak fault characteristics under different noise levels. Thirdly, by reasonably adjusting the system parameters of the UAPPSR, the effective detection of input signals with different frequencies can be realized. Numerical simulations and experimental tests are performed on a gear with a local root crack, and the vibration signals are analyzed to validate the effectiveness of the proposed method. The comparison results show that the proposed method possesses a better resonance output effect and is more suitable for weak fault feature extraction under a strong noise background.
1. Introduction
Gears are an essential component in industrial machinery [1]. The power transmission of various types of industrial machinery (such as wind turbines, airplanes, and motor vehicles) is achieved through gears. During the service process, gear failure may occur due to improper gear design, poor manufacturing or assembly accuracy, inadequate maintenance, or for other reasons [2,3,4]. Therefore, in order to ensure the safety of mechanical equipment and improve the reliability of gear transmission, it is necessary not only to enhance the design, manufacturing accuracy, and assembly quality of the gear, but also to improve its operation and maintenance ability. It can be seen that condition monitoring and fault diagnosis of gear transmission devices is of great significance. However, because the gear is often installed in a gearbox that has a complex structure and many components in engineering applications, the excitation and response of multiple vibration sources are coupled with each other, resulting in large noise interference in the working environment [5,6]. In addition, the complex and variable vibration transmission path makes the characteristics of the gear early fault vibration response relatively weak, so it is difficult to correctly diagnose the early fault of gears from the vibration signals collected during gear operation.
To tackle this issue, most traditional signal processing methods based on the principle of noise filtering, such as wavelet transform [7,8,9,10], empirical mode decomposition [11,12,13], dual-tree complex wavelet [14,15], and sparse decomposition [16,17] can be applied to extract the weak features of early gear failure. Although these methods can be useful in analyzing the signal to be measured, they inevitably weaken the energy of the feature information embedded in the signal while eliminating the noise. Therefore, the processing result is not perfect. The emergence of the stochastic resonance (SR) [18] theory provides a new way to diagnose weak gear faults. It can transfer some noise energy to a characteristic signal through the synergy of a periodic signal and random noise in a certain nonlinear system in order to achieve the goal of noise reduction. Compared with traditional methods, SR strengthens the characteristics of weak signals by making full use of the noise instead of filtering it. Therefore, in recent years, it has been widely used in weak fault diagnosis of mechanical equipment. The early research on SR mainly focused on the bistable potential model. Constrained by the theoretical conditions of adiabatic approximation, the bistable stochastic resonance (BSR) can only be applied to small parameter signals (i.e., when signal amplitude, frequency, and noise intensity are far less than one), which greatly limits its application in engineering practice [19]. With the purpose of extending the application scope of SR to large parameter signals, Li et al. [20] proposed a step-varying SR to extract weak fault features. By adjusting the structural parameters of the potential function and the calculation step interval of the bistable system, this method can effectively detect large parameter weak signals. Considering the coupling disadvantage of the bistable system in adjusting the system parameters, Lu et al. [21] studied SR by considering the Woods–Saxon potential. Because a Woods–Saxon potential with independent parameters can adaptively match various measured signals to an extreme, the results show that a higher output signal-to-noise ratio (SNR) is obtained via the Woods–Saxon potential as opposed to the BSR system. On this basis, Zhang et al. [22] presented a new BSR system by combining the Gaussian and Woods–Saxon models. As the system parameters are independent of each other and are not sensitive to noise, the simulation results confirm that the optimal output of the system can be obtained with the aid of the new bistable potential model. Liu et al. [23] introduced a periodic potential structure into SR and established a multi-stable SR system. The potential structure of the model is not only infinite and variable, but also has independently adjustable system parameters, and shows a better output effect in weak feature extraction. In conclusion, choosing an appropriate potential structure model is very important to achieve the optimal output of SR.
Considering the influence of stiffness, for an undamaged gear, the frequency component of its meshing vibration response is meshing frequency and its harmonics. When the gear has a local fault (such as cracks), its vibration response is characterized as a periodic shock signal [24,25]. Therefore, the extraction of periodic impact signals is the key to local gear damage detection. However, the existing SR methods [26,27,28,29] often use the envelope signal of the signal to be measured as the input signal of the system when extracting fault information with periodic shocks. The envelope is asymmetric, even after removing DC. If it is fed into an SR system with a symmetrical potential model, the system output is generated symmetry, which cannot obtain some of the characteristics that are consistent with the input signal. To solve this problem, this paper proposed a method for diagnosing local weak faults of gears based on underdamped asymmetric periodic potential stochastic resonance (UAPPSR). Compared with traditional methods, this method has the advantage of using the asymmetry of its potential model in the UAPPSR system, which can better match the characteristics of the input signal of the system and effectively enhance the extraction effect of the periodic shock signal. In addition, by optimizing the calculation step interval, this method can also effectively detect large parameter signals in practical engineering. Meanwhile, consideration of the damping coefficient causes the system to have a secondary filtering function and improves the signal-to-noise ratio (SNR) of the system response. With these properties, the UAPPSR method can achieve an accurate diagnosis of the localized weak faults of gears. The effectiveness and practicability of the proposed method are verified using numerical simulations and an experiment test on a gear with a local root crack.
The rest of the paper is organized as follows. In Section 2, the theoretical framework of the UAPPSR method is introduced and a strategy for detecting weak signals based on UAPPSR is proposed. In Section 3, compared with a traditional bistable SR, the simulation signal is used to evaluate the resonance output performance of the proposed method under different system parameters and different system input signals. In Section 4, the effectiveness of the proposed method is verified by analyzing an experimental signal containing a local gear fault. Finally, the main results of this paper are presented in Section 5.
2. Underdamped Asymmetric Periodic Potential Stochastic Resonance
2.1. Theoretical Model
Considering the inertial term, the Langevin equation of the classic bistable SR system under underdamped conditions is expressed as follows [30]:
where denotes the damping factor and represents the system input. with represents the noise item, where is the noise intensity and is a Gaussian white noise, of which the mean and variance are zero and one, respectively.
For a system with a bistable potential, is a reflection-symmetric quartic potential [19]:
where and are the barrier parameters of the bistable potential model with positive real values. Figure 1 illustrates the shape changes of bistable potential under varying system parameters. It is seen that, for the traditional SR system with the bistable potential model, only two parameters can be adjusted. When the system parameter, or , is changed, the width and height of the potential barrier will change simultaneously, which indicates that the model cannot achieve an independent adjustment of the potential structure. From a mathematical point of view, the width and height of the potential barrier can be obtained using the following two equations, respectively [19]:
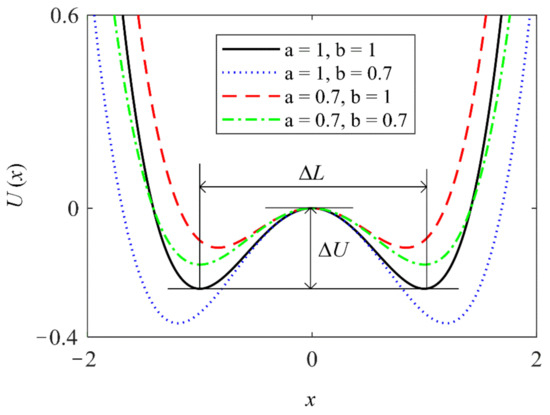
Figure 1.
Variation curves of the bistable potential with different system parameters.
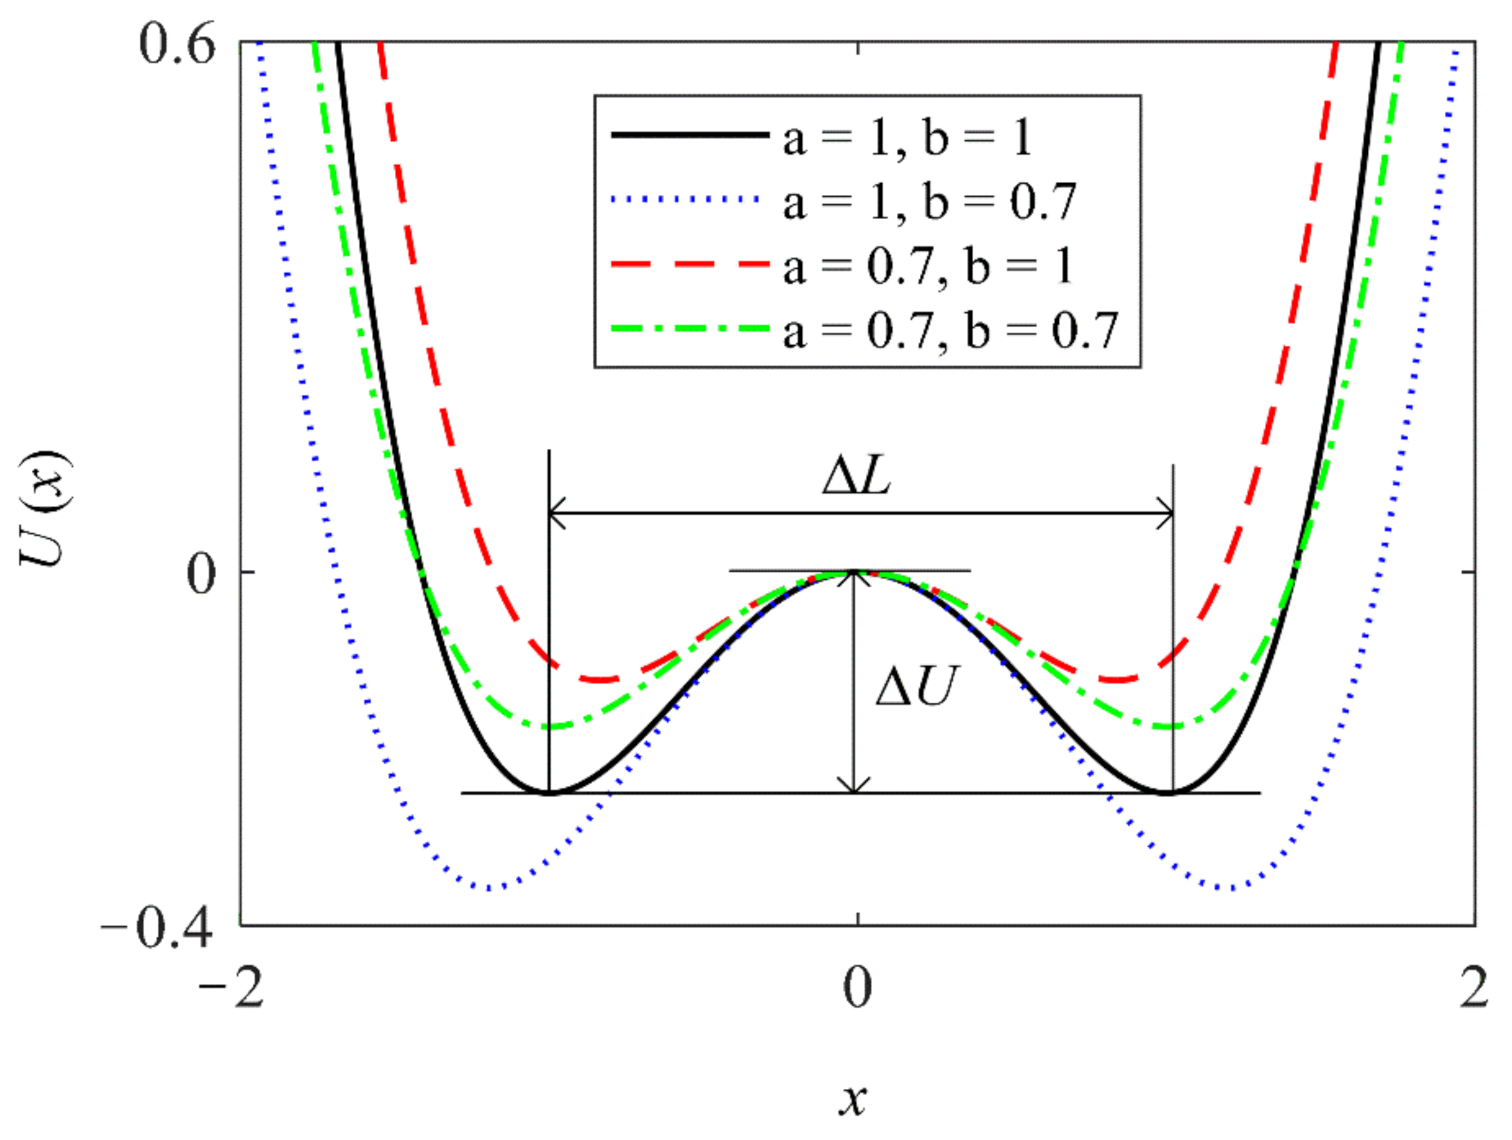
The two formulas above show that there is a mutual coupling relationship between the system parameters of the bistable potential model, which makes it impossible to realize the arbitrary change of the potential structure by independently adjusting a single parameter. Accordingly, it is difficult to obtain the optimal potential shape to perfectly match the system input signal, which will weaken the enhancement effect, especially for weak signals. To enhance the extraction performance of weak signals, a SR system based on the asymmetric periodic potential model is investigated. The potential function is given below [31]:
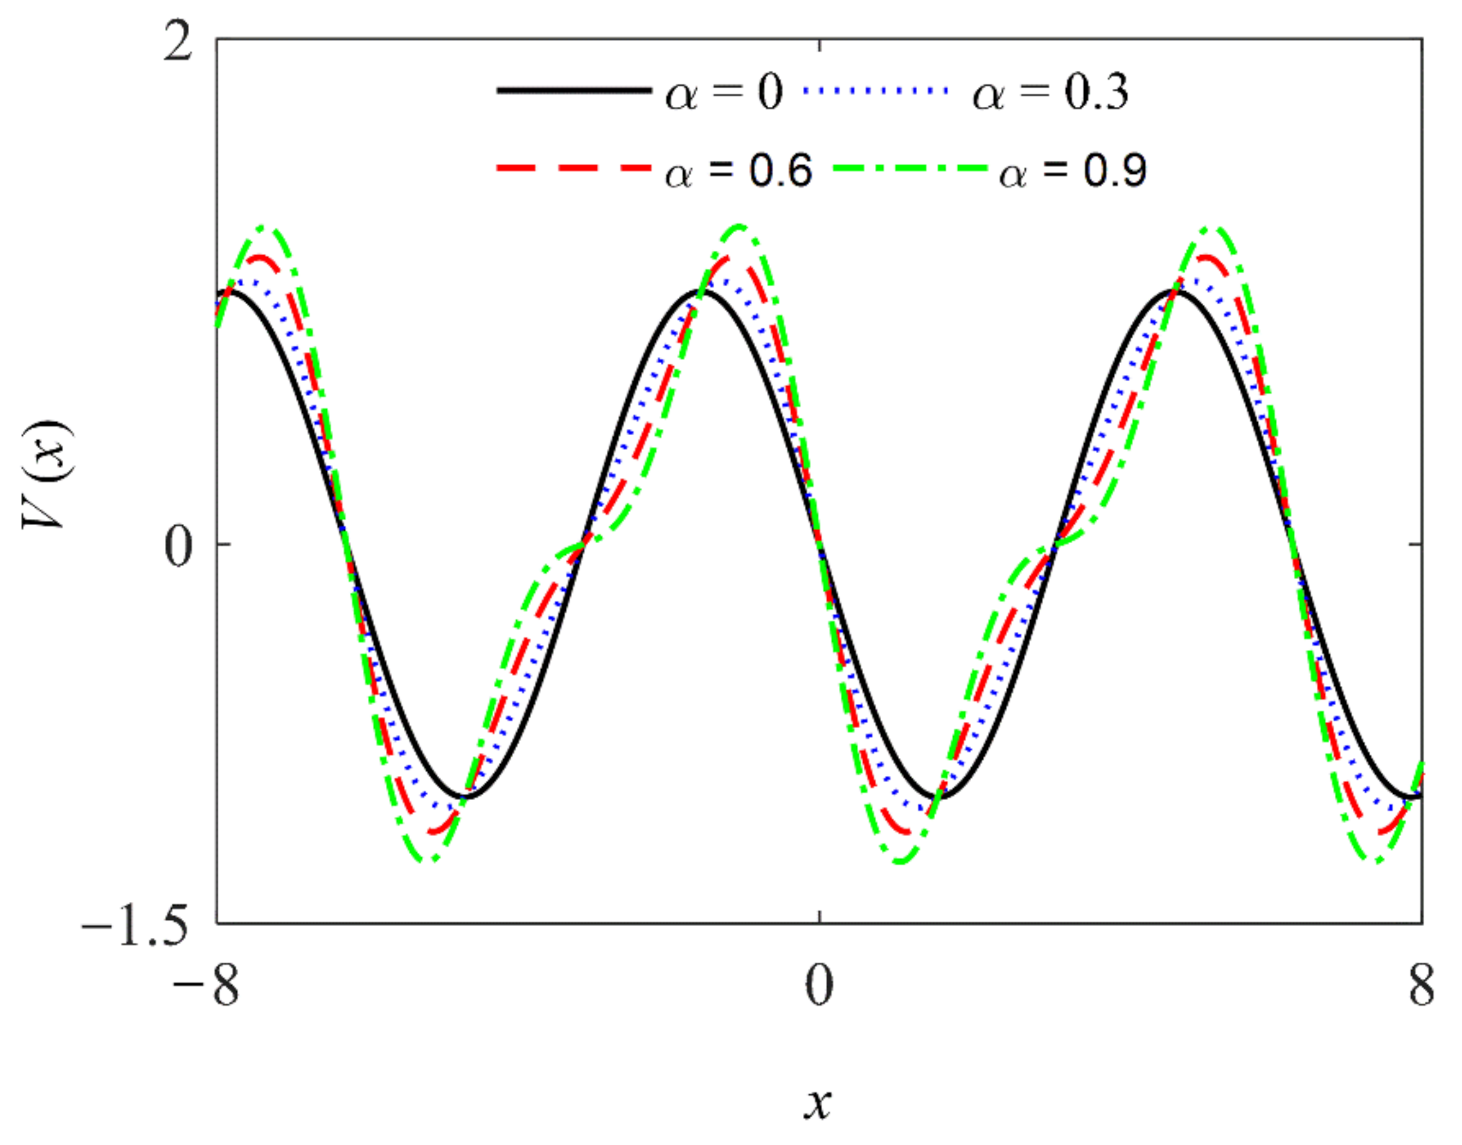
where denotes the asymmetric coefficient. The variation curves of the asymmetric periodic potential with different values are shown in Figure 2.
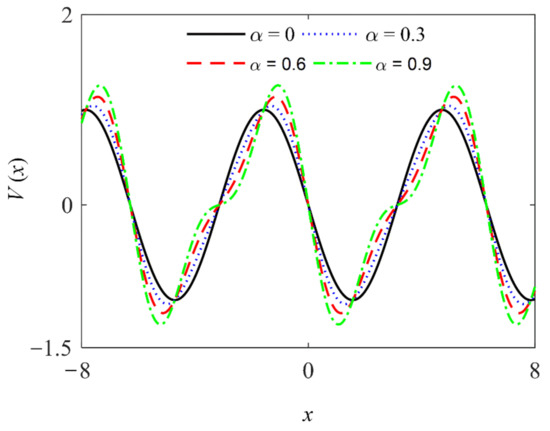
Figure 2.
Variation curves of the asymmetric periodic potential with different values.
It can be seen from Figure 2 that when the asymmetry coefficient gradually increases, the height of the barrier in the asymmetric periodic potential model increases, and the steepness of the barrier also changes. When the asymmetry coefficient gradually decreases to 0, the model will degenerate into a standard periodic potential structure. For the classical bistable potential model, the change in the potential structure requires an adjustment of the two system parameters to achieve optimal global matching, which easily leads to a shortcoming in the local optimization of the resonance model. However, this new model can adjust both the barrier height and steepness of the potential model by changing only a single system parameter, making this model easier and more convenient in the adjustment of the potential structure; the calculation period is also short. In addition, the asymmetric periodic potential model still has many advantages of the standard periodic potential structure; that is, the system output does not have output saturation characteristics; the potential structure is infinite and variable, and it is very easy to match the various types of input signals; and the output effect is more accurate than the bistable model with finite term approximation [23]. In short, because this model adds an asymmetric adjustment coefficient to the standard periodic potential structure, the model not only has the characteristic of the symmetrical potential model, but can also obtain a more abundant potential structure by adjusting the slope of the potential barrier in the potential function. Therefore, the new model used in this paper can effectively solve the shortcomings of the existing potential model to realize the best matching of the potential structure of the SR system and can better enhance the early weak fault characteristics hidden in the gear vibration signal.
2.2. Weak Fault Diagnosis Strategy Based on UAPPSR Method
The essence of SR is mainly realized by the perfect coordination of a periodic signal, random noise, and a particular nonlinear system to achieve the purpose of extracting weak fault features. However, in practical engineering applications, the input signal and noise type of a system are often fixed, so the output effect of the SR system will mainly depend on the structure of the potential model. Generally, for a specific potential model, if the height of the barrier is too high and the distance between the two sides of the wall is too wide, particles will not have enough energy to pass through the barrier and return to their original position from the other potential well, resulting in them staying in a potential well to form “under-resonance”; if the barrier height is too low and the inclination of the potential walls on both sides is too large, the particles will obtain enough energy to accelerate the periodic oscillation of the back and forth transition between the two potential wells, and this forms “over-resonance”. Therefore, it can be seen that the key factor to obtain the best SR output effect is how to choose a suitable potential function structure so that the particles form periodic oscillations between the potential wells with the help of a periodic weak signal and random noise.
Substituting Equation (5) into Equation (1), it can be seen that the governing equation of UAPPSR is as follows:
In the above equation, the output of the UAPPSR system depends on the potential function (the first and second terms on the right side of Equation (6)) and the input signal (the third and fourth terms on the right of Equation (6)) and its damping term (the second term on the left of Equation (6)). It is worth noting that Equation (6) is a typical second-order continuous-time differential equation. Assuming , the equation can be decomposed into two first-order differential equations. In order to apply the UAPPSR model to detect weak digital signals, it can be solved using the numerical method based on the fourth-order Runge–Kutta algorithm shown in Equation (7).
To obtain the optimal system response, the system output can be enhanced by adjusting parameters and . Considering that the signals processed in practical engineering applications are mostly large parameter signals, the UAPPSR system adopts a step-varying method to overcome this problem, and the system output SNR is used as the evaluation index for UAPPSR to extract weak characteristic signals, which are defined as follows:
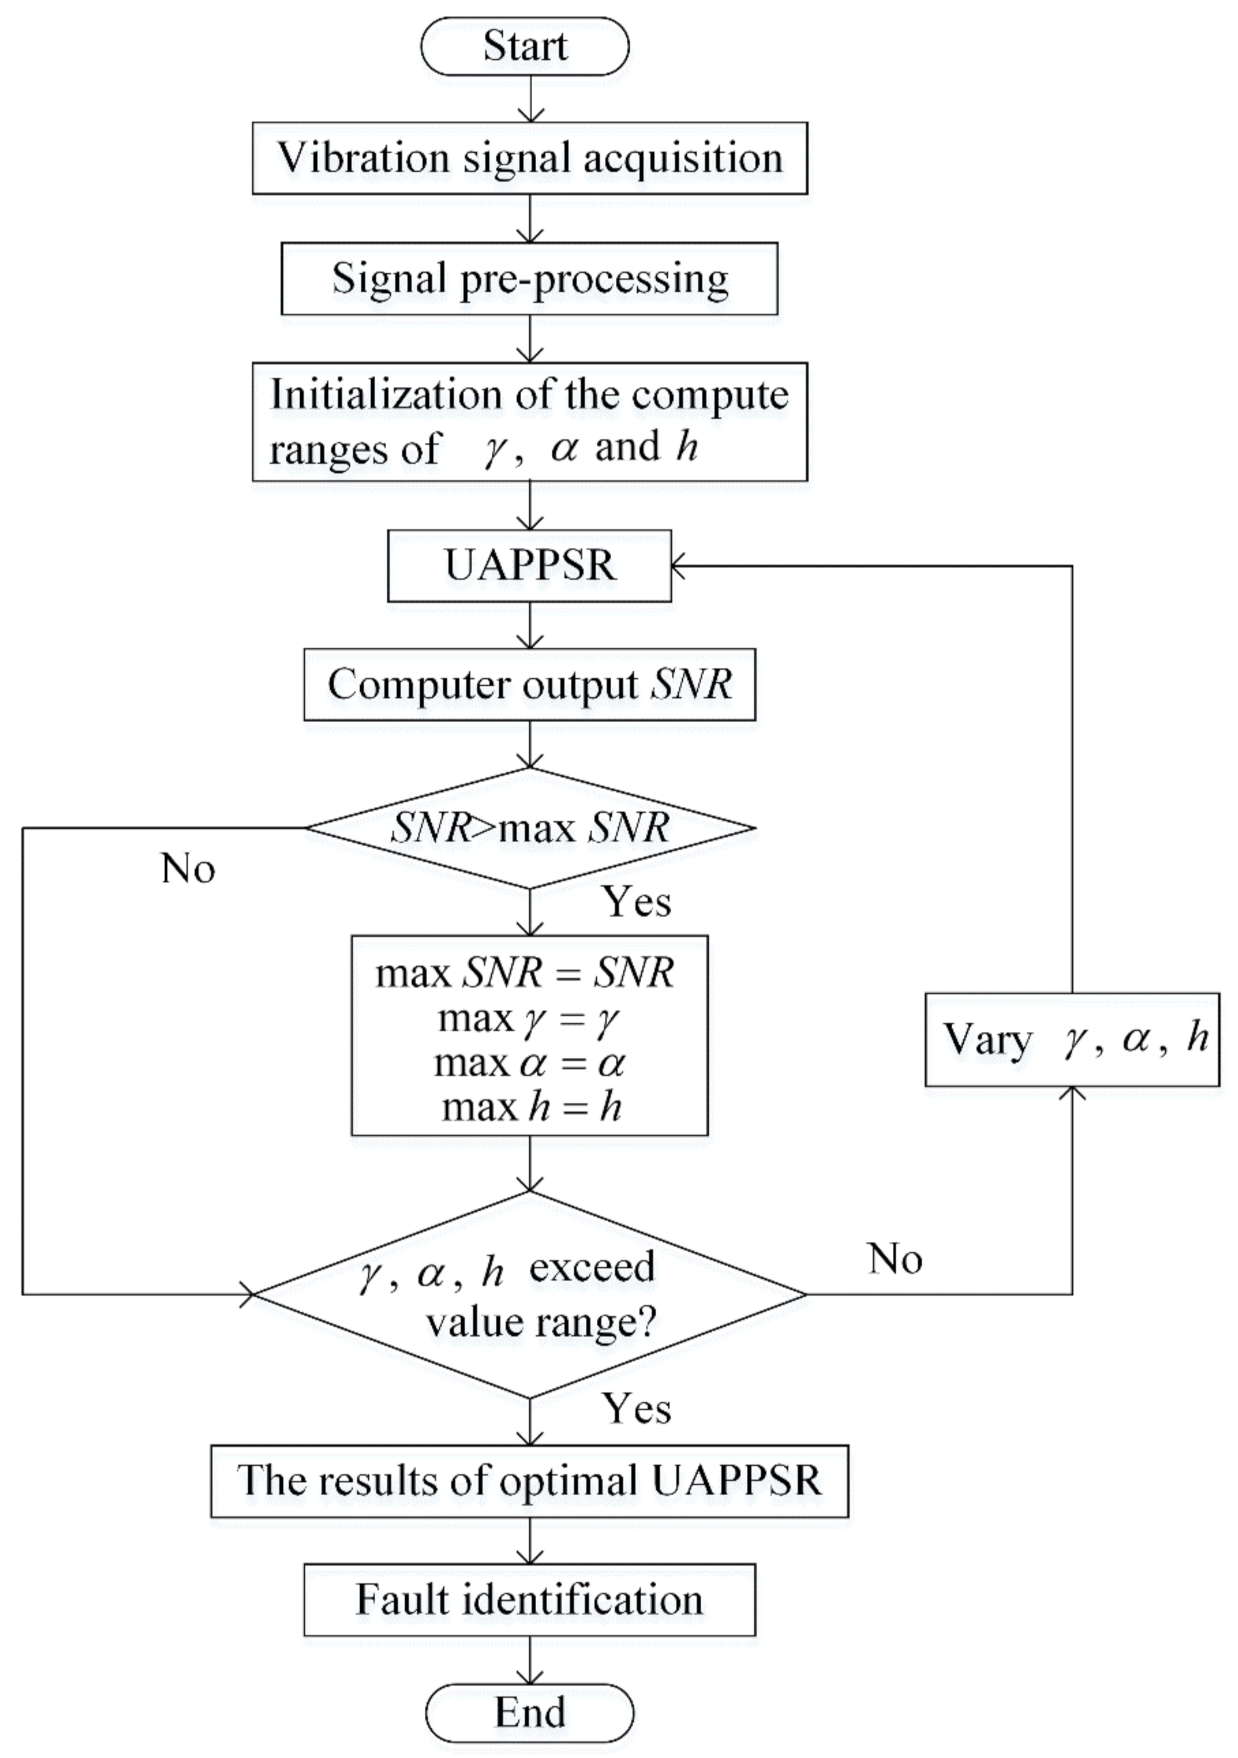
where denotes the length of the input signal, and and are the power of the signal to be detected and the total noise power in the output signal power spectrum, respectively. Therefore, the specific steps of the weak signal detection method based on UAPPSR are shown in Figure 3.
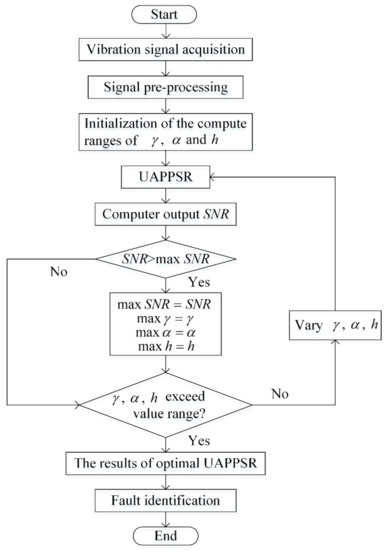
Figure 3.
Proposed weak signal detection method based on UAPPSR.
- (1)
- Signal preprocessing: Common signal processing methods (such as envelope demodulation technology used to process the modulated signal to be detected) are employed to preprocess the collected original signal.
- (2)
- Parameter initialization: In the UAPPSR system, the search range of system parameters and is set, and calculation step is initialized.
- (3)
- Parameter optimization: By calculating the maximum output SNR of system variables , , and calculation step within the specified range, the optimal parameter combination corresponding to the maximum SNR is determined. If all the optimal parameters do not exceed the search range, the optimal output has been found; otherwise, expand the search range and perform the searching step again.
- (4)
- Signal post-processing: The final system output is obtained according to the optimal parameter combination of the UAPPSR system, and the frequency domain information is adopted to judge the fault characteristic frequency contained in the original measured signal and the corresponding fault characteristics.
3. Performance Evaluation
3.1. Effect of the UAPPSR
To intuitively understand the potential advantages of UAPPSR in weak signal feature extraction, a set of simulation signals was performed for the qualitative analysis. Taking into account that the local failure of gears often manifests in the form of periodic impact signals, the vibration signals of a faulted gear can be generated using the following formula.
where is the amplitude; Hz represents the modulation frequency; is the attenuation rate; Hz is the sampling frequency; is the noise intensity; represents the impulses that occur periodically; is the interval between the occurrence of the impulse; is the signal length; and is the additive Gaussian white noise for which the mean and variance are 0 and 1, respectively.
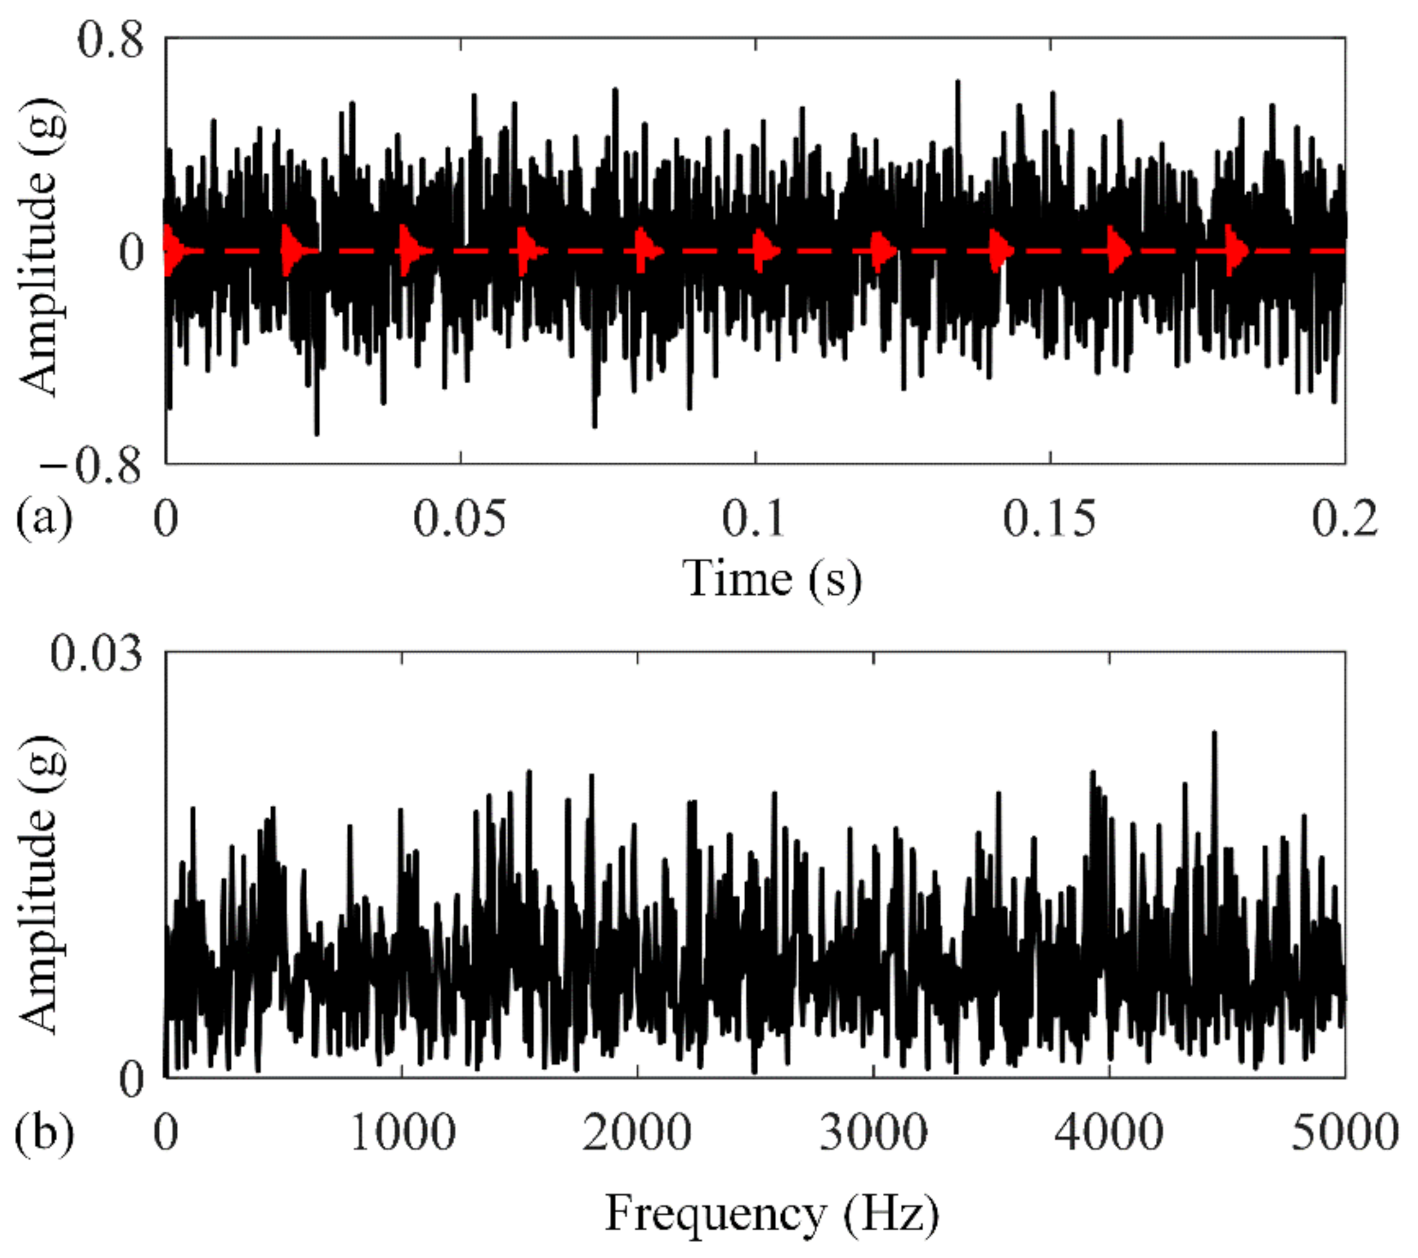
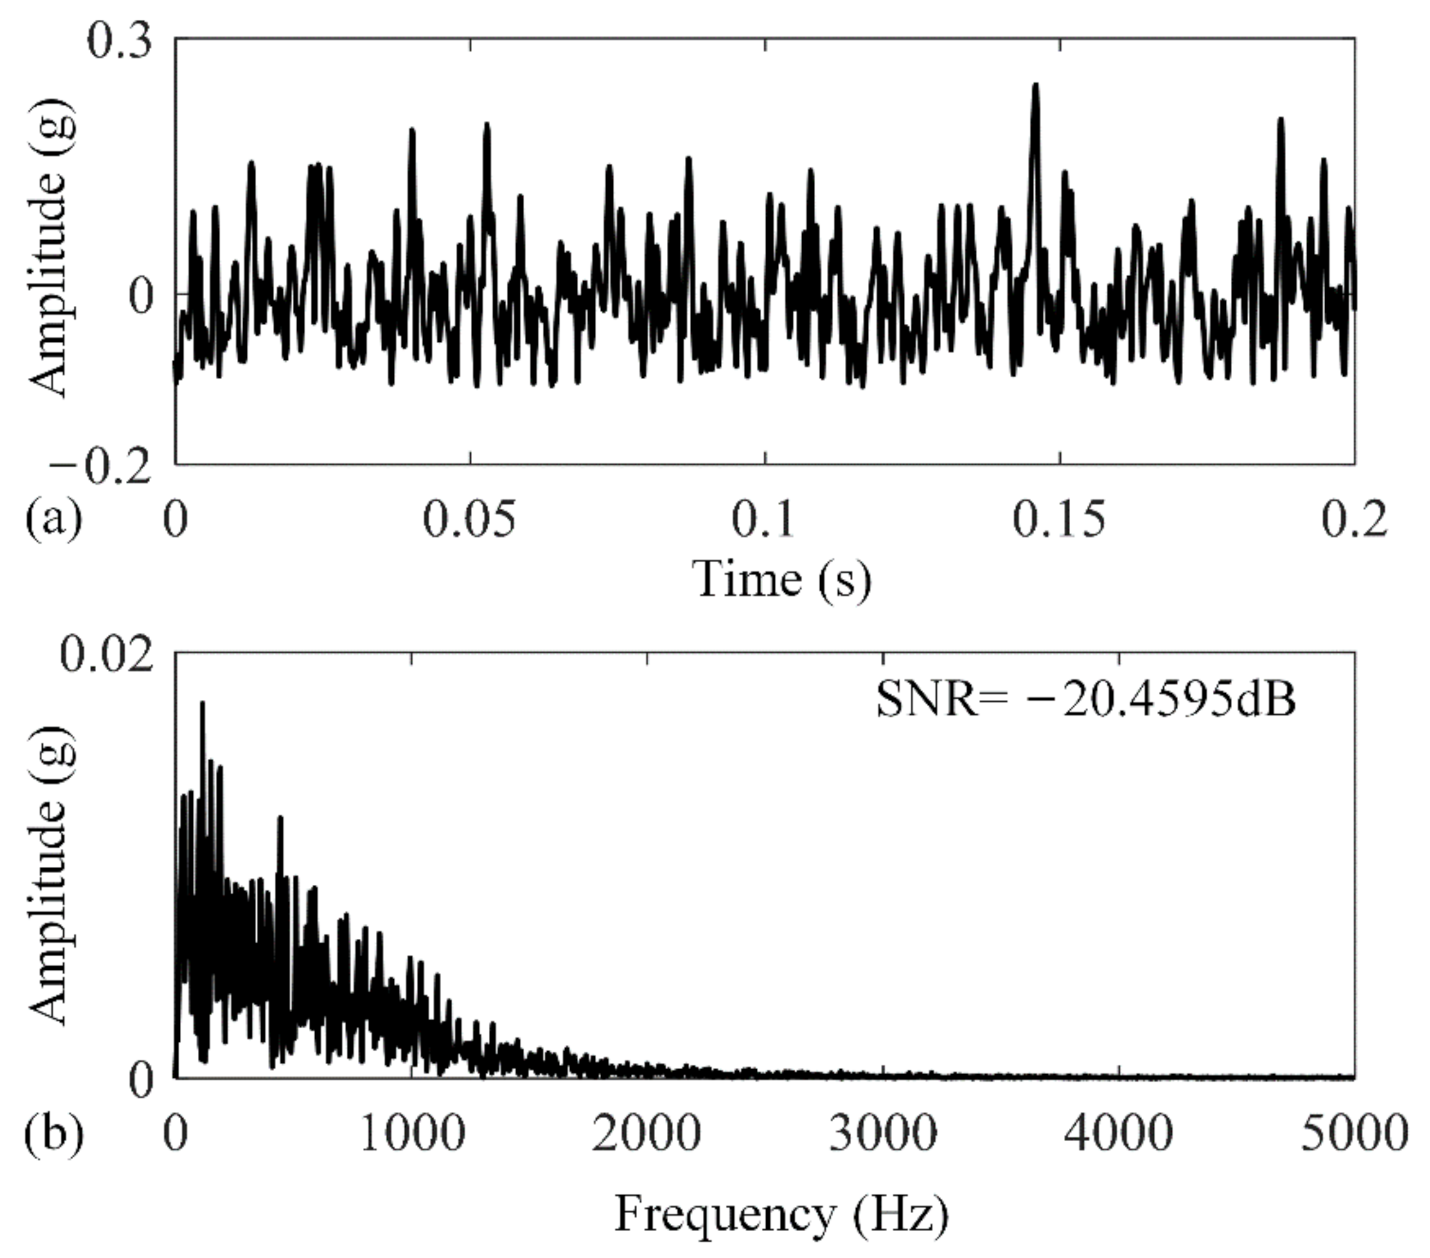
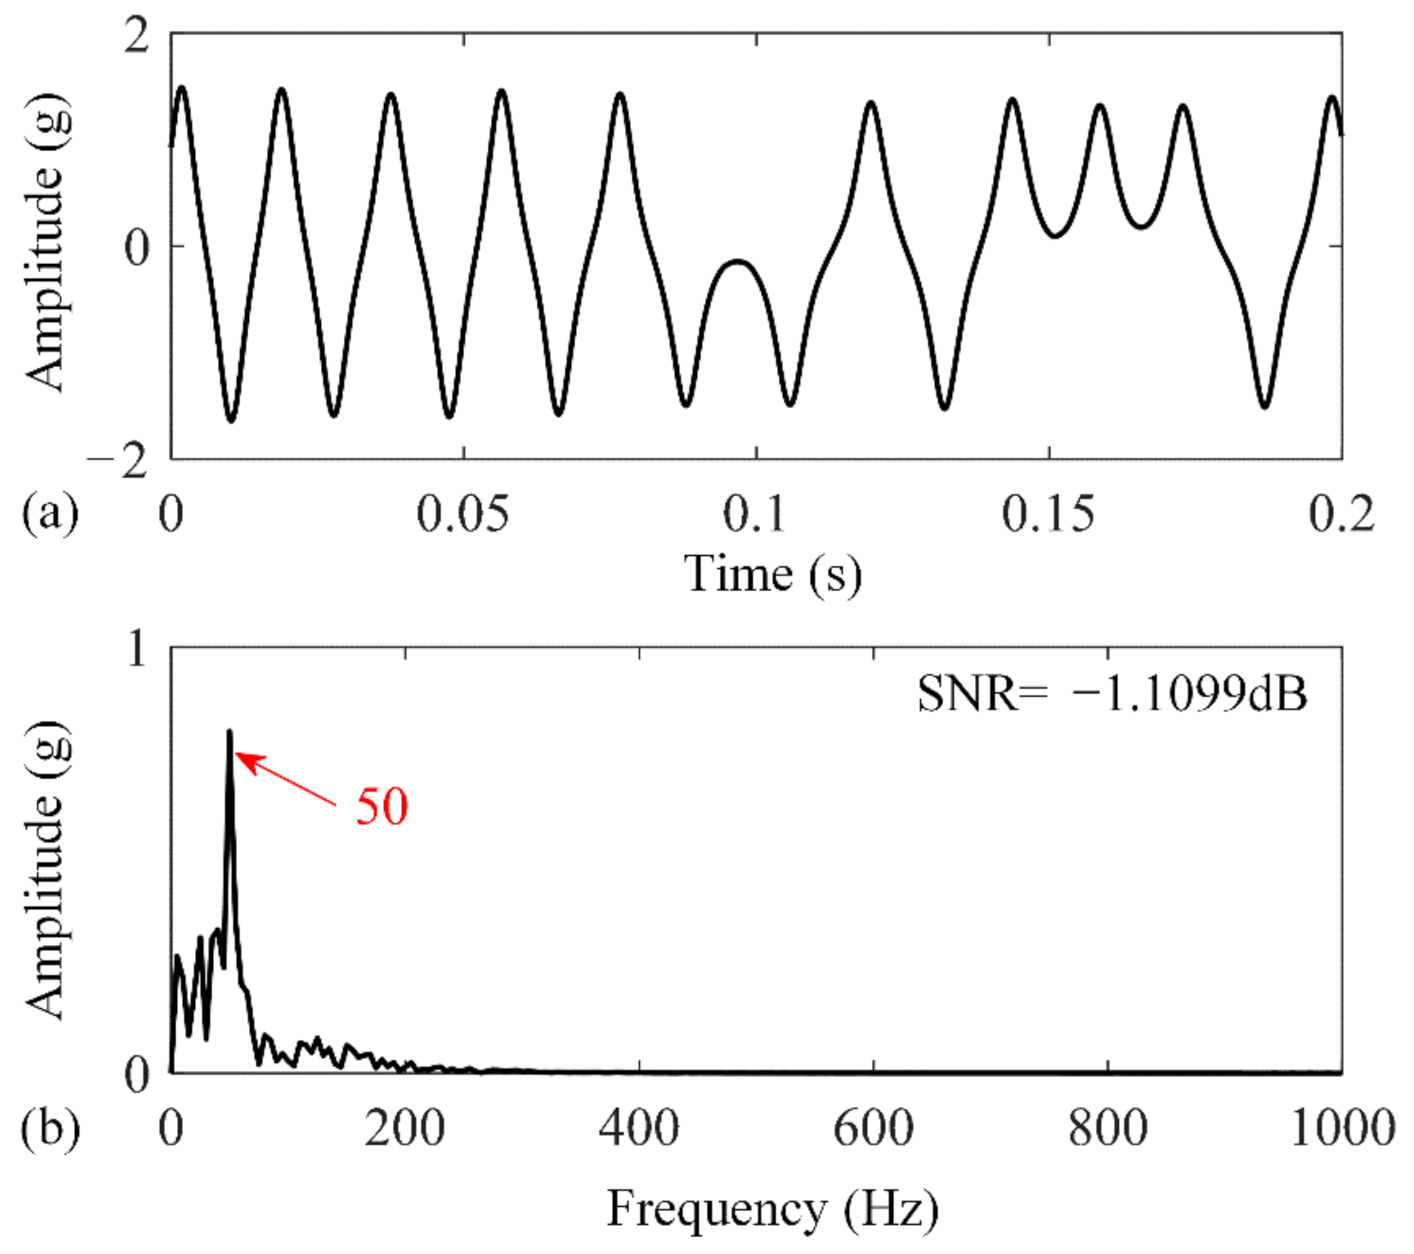
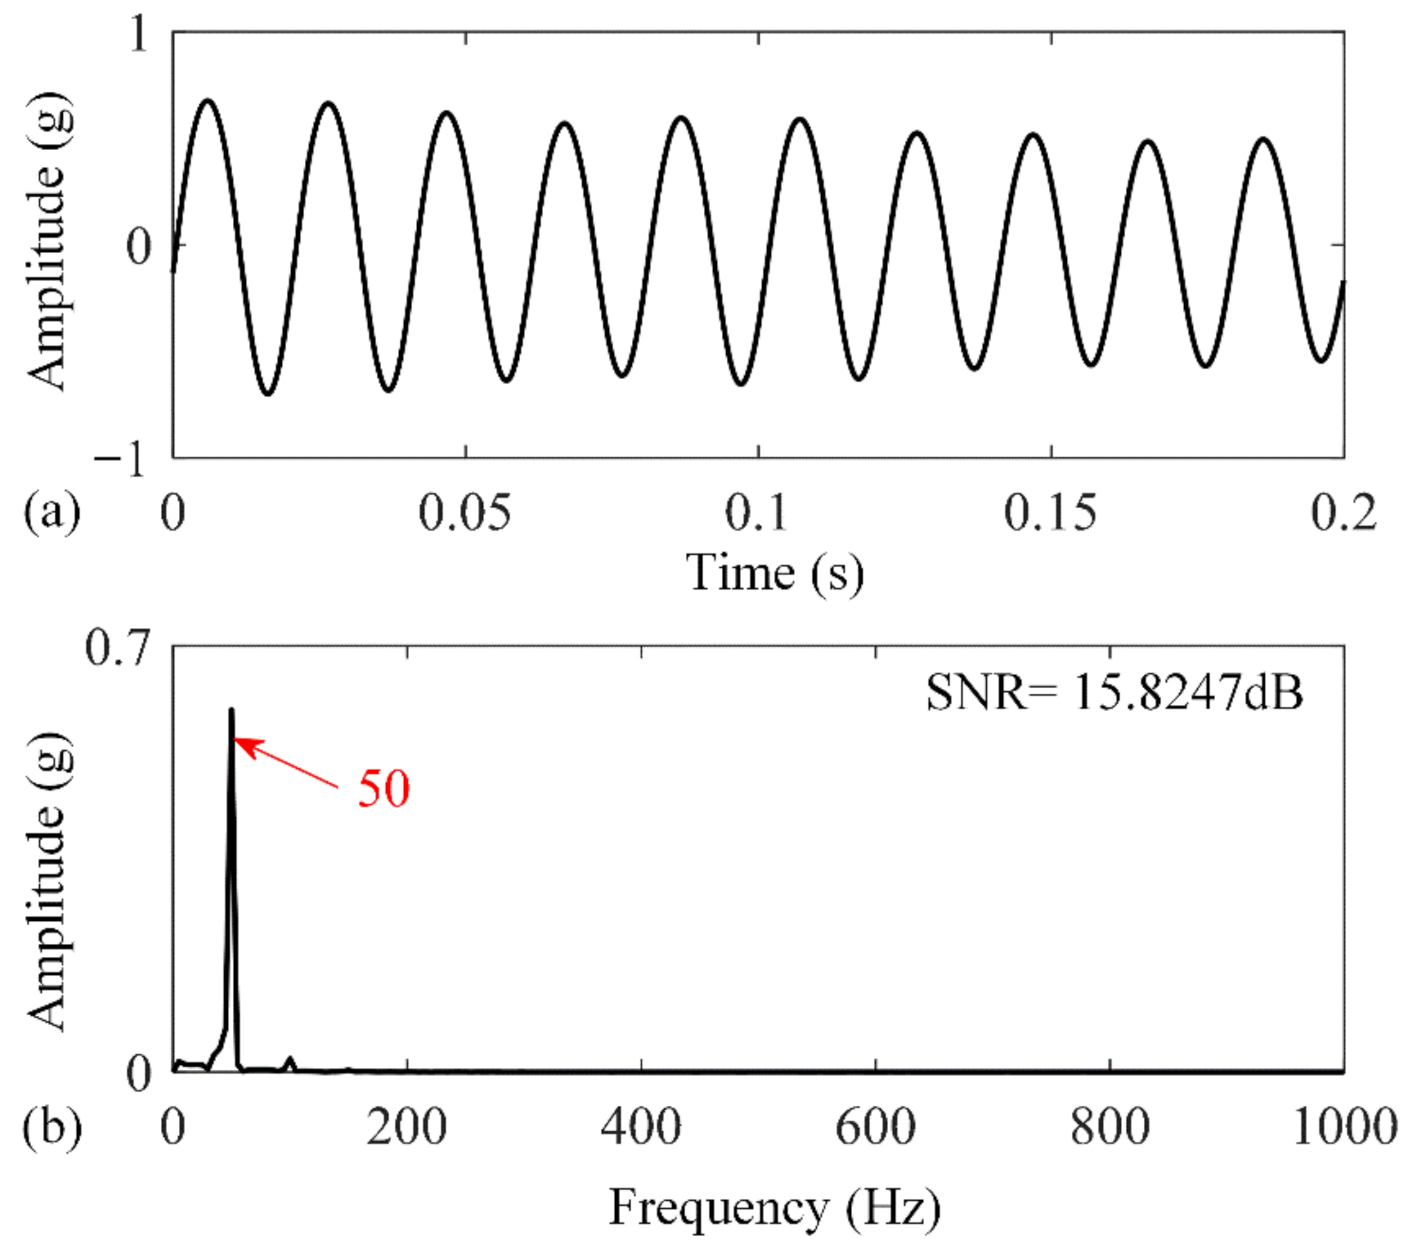
Figure 4a shows the time domain waveform of the simulated signal. It can be seen from Figure 4a that we cannot determine the periodic impact signal component related to the local fault of the gear. The simulated signal spectrum obtained by FFT transformation is shown in Figure 4b. Due to interference from strong background noise, the characteristic frequency component of 50 Hz is completely submerged in the noise, and the fault information of the simulated signal cannot be identified. As the simulation signal containing local gear damage is modulated, the fault characteristic information can be detected with the help of the Hilbert transform (HT). The time domain waveform and its spectrum of the envelope signal (obtained using HT) are shown in Figure 5a,b. In the envelope spectrum, the fault characteristic frequency is still difficult to identify from the surrounding interference frequencies. To further detect the weak fault that is hidden in the simulation signal, the envelope signal is sent to the traditional underdamped bistable stochastic resonance (UBSR) system; Figure 6a,b shows the obtained optimal output signal and the spectrum. The corresponding optimal system parameters are = 0.01 and = 0.046. From the output signal spectrum, it is obvious that the characteristic frequency of 50 Hz, interfered with by the strong background noise is extracted, but there is still a small amount of noise interference around it. Finally, the envelope signal is analyzed using the proposed method. By optimizing the system parameters, the optimal output signal and its spectrum can be obtained, as shown in Figure 7a,b. The corresponding optimal system parameters are = 0.01, = 0.91, and = 0.022. The results show that the time domain waveform of the system output signal presents obvious periodic characteristics, and the fault characteristic frequency of 50 Hz is clearly visible in the system output spectrum. In addition, the surrounding interference frequency components have basically been eliminated. Comparing the output results of the two systems, it can be seen that the UAPPSR system can better recover the periodic shock waveform of the simulation signal using the asymmetric structure of its potential well. When dealing with periodic impact signals, the proposed method has certain advantages, and the output SNR is larger, which can provide highly reliable diagnosis results.
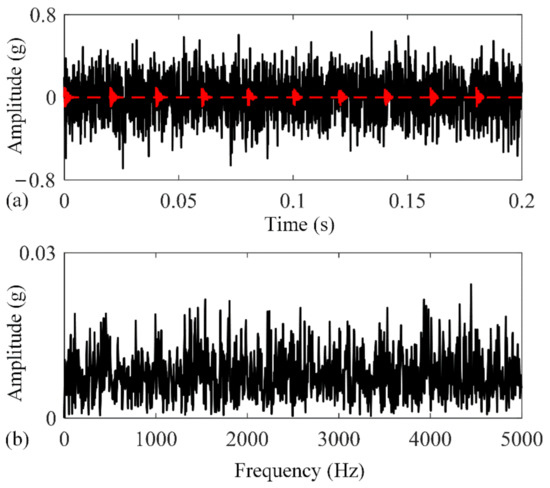
Figure 4.
Simulation signal: (a) time domain waveform and (b) frequency spectrum.
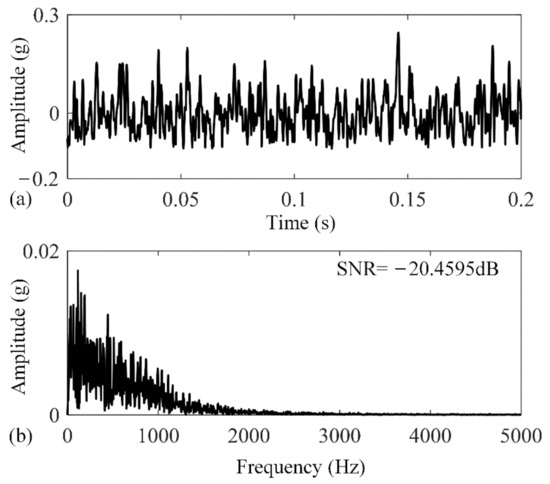
Figure 5.
Envelope signal: (a) time domain waveform and (b) frequency spectrum.
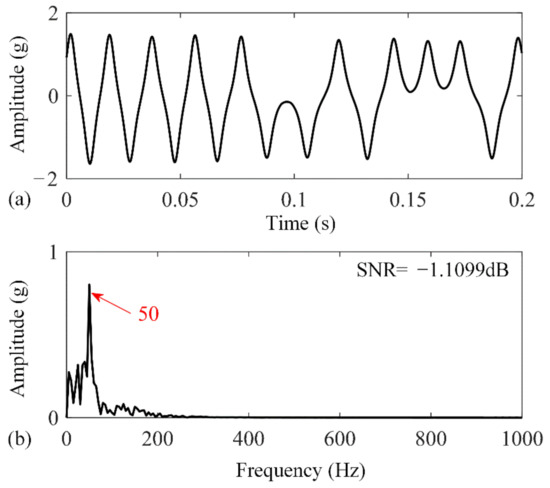
Figure 6.
Optimal output signal resulted from the UBSR method: (a) time domain waveform and (b) frequency spectrum.
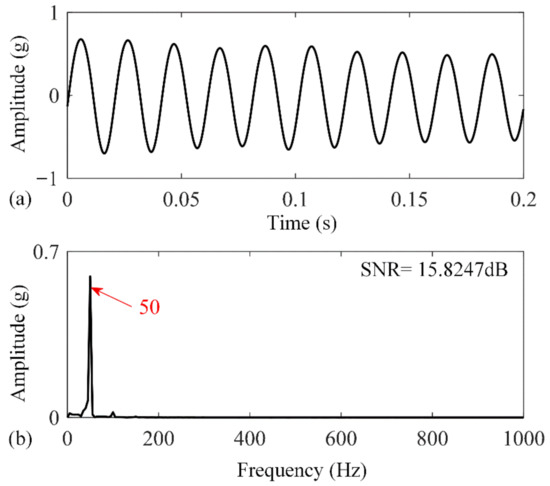
Figure 7.
Optimal output signal results from the UAPPSR method: (a) time domain waveform and (b) frequency spectrum.
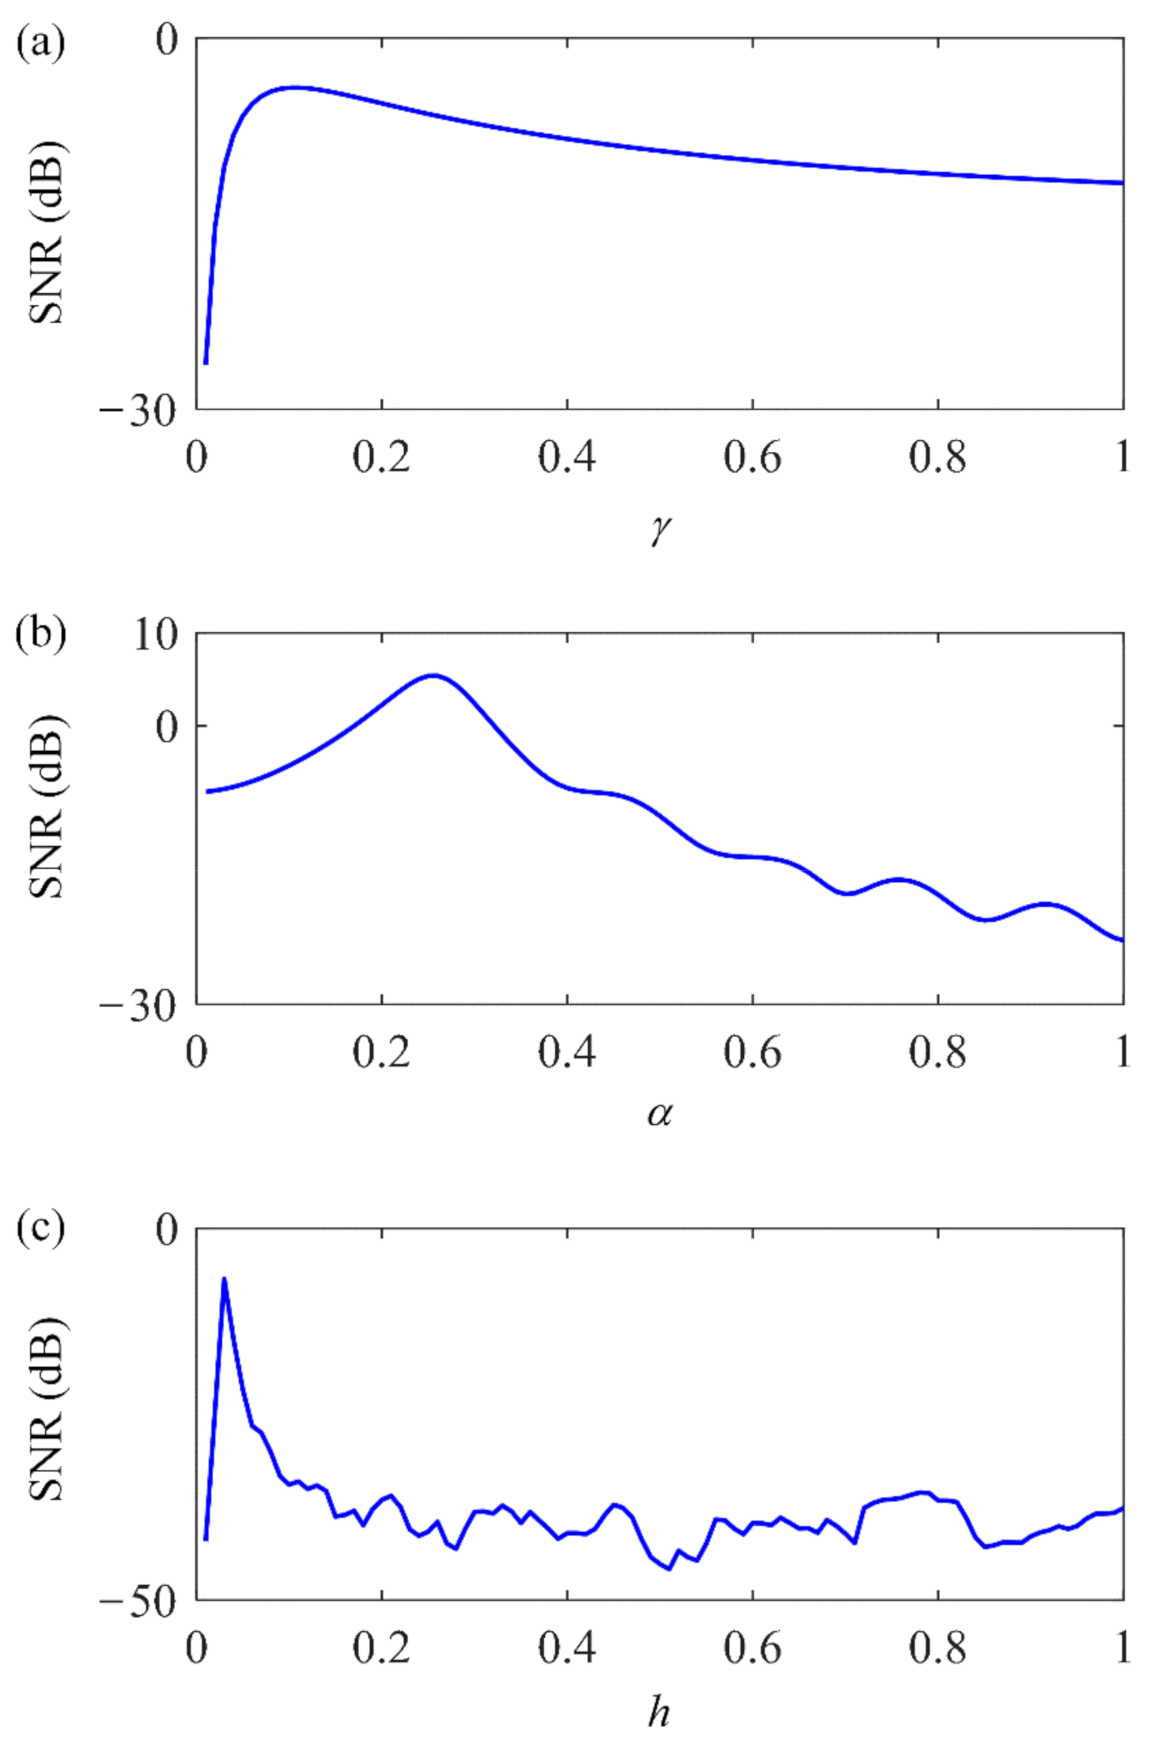
According to the above, to acquire the optimal output of the UAPPSR system, the output signal needs to have an optimal solution with the change of different system parameters. The simulation signal will be used to further analyze the influence of different system parameters on the system output. For the UAPPSR system, we select the same simulation signal as the system input. Among the system parameters, , , and the calculated interval , we changed the third parameter value successively under the condition of fixing two parameters to obtain the changing trend of the system output SNR with each parameter, as shown in Figure 8. It can be seen that the output SNR of the proposed system has similar non-monotonic characteristics to the traditional SR; that is, as the system parameters continue to increase, the output SNR of the system first increases and then gradually decreases after reaching the peak. Moreover, the results show that the maximum SNR of the UAPPSR system output can be obtained by adjusting system parameters , , and the calculated interval to effectively extract the weak fault features under a background of strong noise.
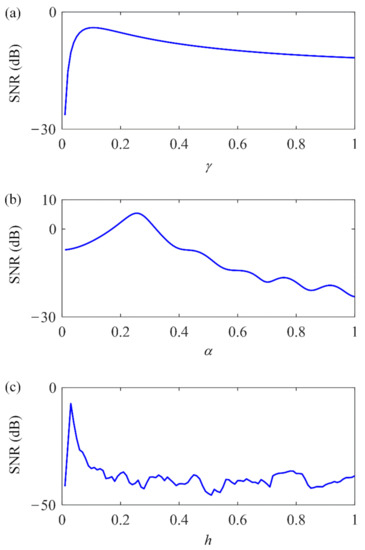
Figure 8.
SNRs of the output signals under three different parameters of the UAPPSR system: (a) , , ; (b) , , ; (c) , , .
3.2. System Performance with Different Input Signals
In addition to the influence of the system parameters on the UAPPSR output effect, different types of input signals also have a certain influence on the system response. The following two resonance models are used to process simulation signals with different input types, and the resonance output effects are compared and analyzed.
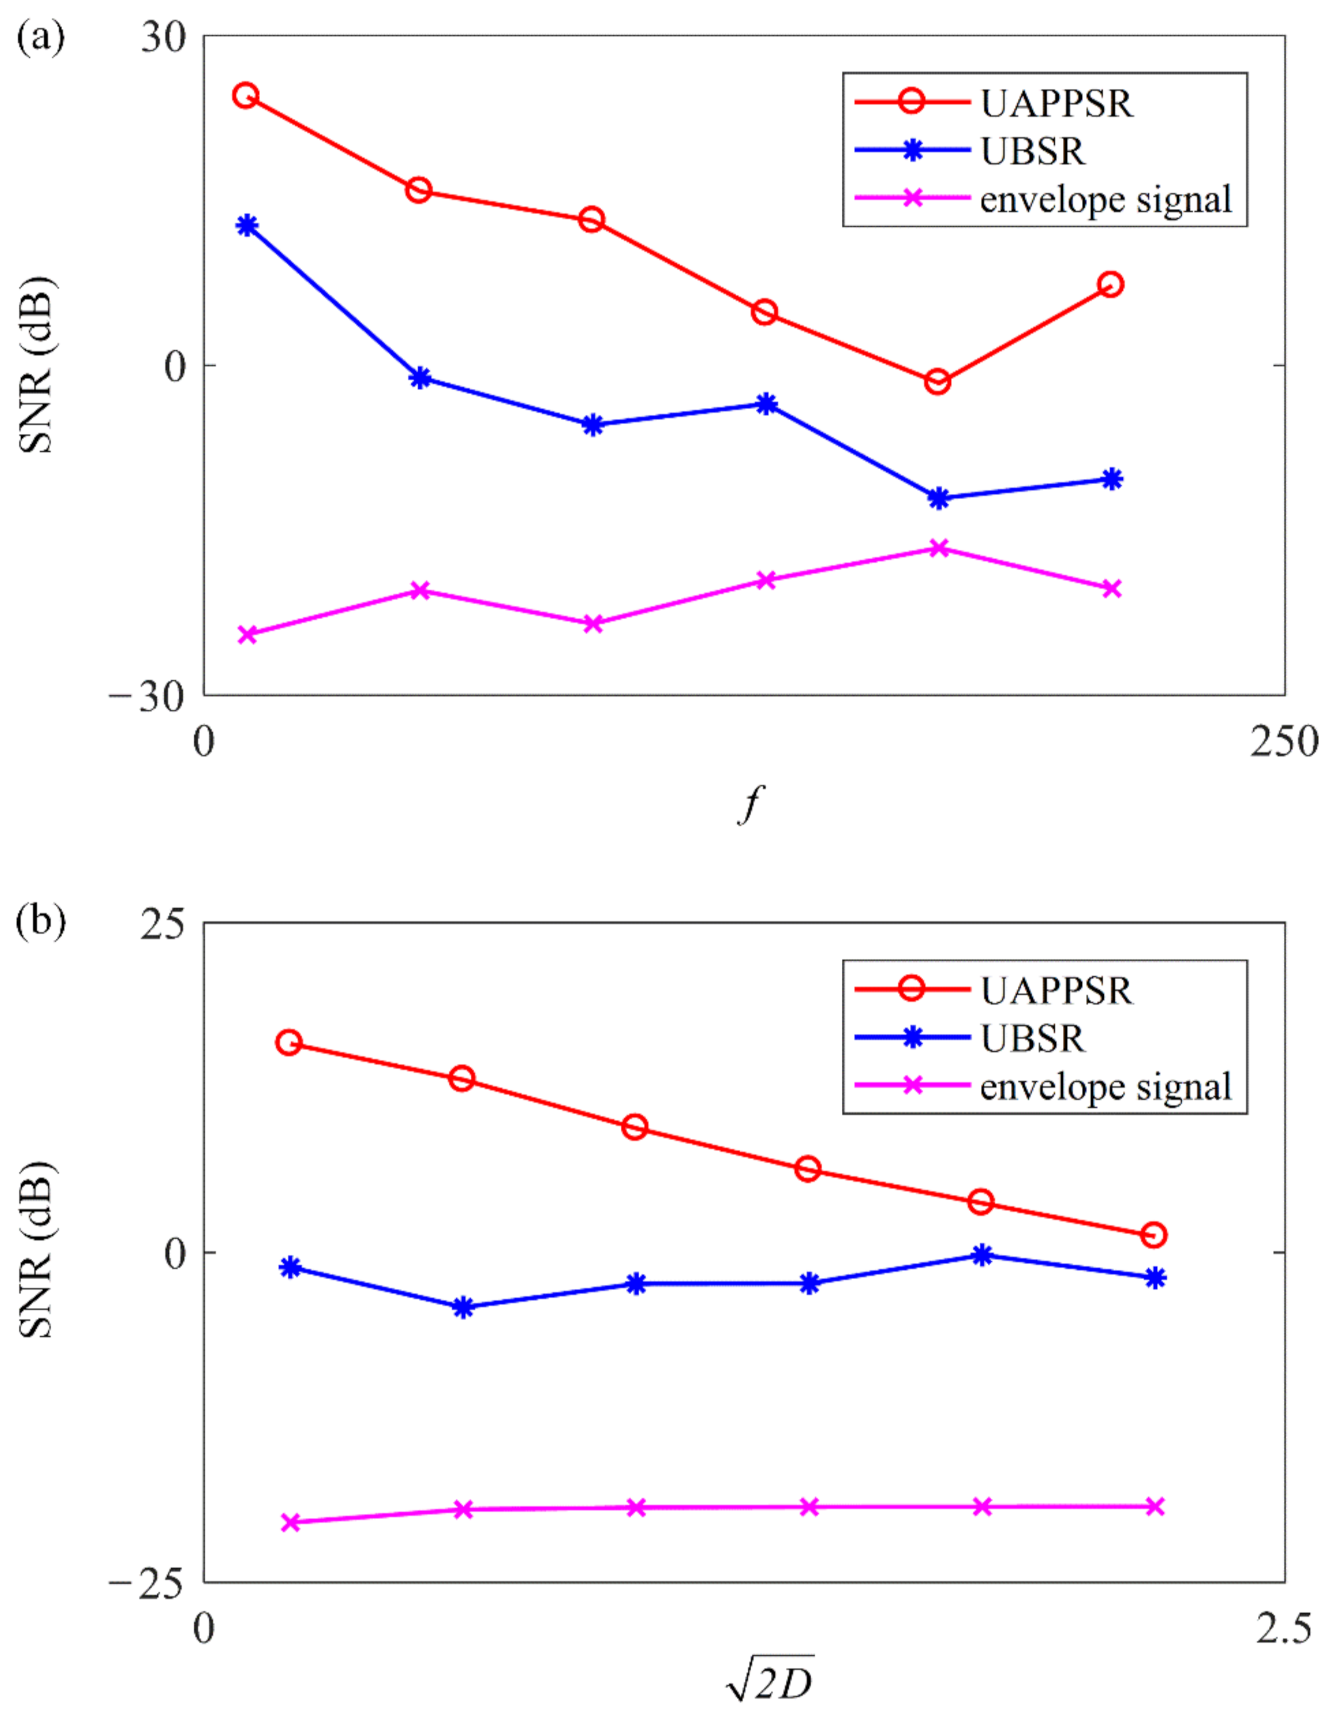
Firstly, the amplitude of the periodic impact signal remains with the noise intensity chosen as , and the other parameters are consistent with the aforementioned simulation signal with local gear damage. The input signal frequency is then gradually increased from 10 to 210 Hz at an interval of 40 Hz. Each driving frequency generates a new simulation signal. The envelope analysis method, the UBSR method, and the UAPPSR method are tested to process the simulation signals, respectively. The optimal output with a maximal SNR under each driving frequency can be obtained. The SNR of each output signal under different driving frequencies is calculated and is shown in Figure 9a. It can be seen that the UBSR and UAPPSR methods can effectively detect input signals under various driving frequencies by adjusting the system parameters and the calculated interval, but the enhancement effect of the UAPPSR method on weak signals is obviously better than the other two traditional weak signal processing methods. The above results show that the proposed method can enhance the detection accuracy of weak fault signals with various input frequencies by adjusting the asymmetric periodic potential structure to a certain extent, which is more suitable for the accurate extraction of periodic impact signals under a strong noise background.
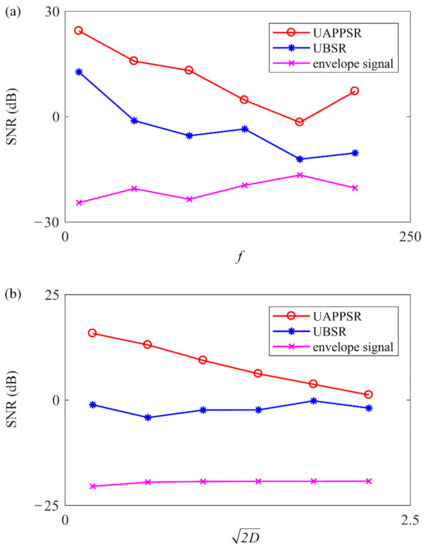
Figure 9.
System output performance with different input signals: (a) output SNR with different driving frequencies and (b) output SNR with different noise intensities.
Subsequently, by fixing the signal frequency at 50 Hz, the amplitude of the periodic impact signal is set to and the noise intensity is changed from 0.2 to 2.2 with a step of 0.4. Similarly, three signal processing methods are used to analyze each simulated signal. The variation trend in the output SNR, corresponding to the optimal output of the three systems with different noise intensities, is shown in Figure 9b. Compared with the other two analysis methods, the proposed method maintains a better signal amplification effect under different noise intensities. The UAPPSR system provides a higher optimal output SNR than the other two methods. The analysis results indicate that the UAPPSR method can effectively extract weak periodic shock signals under different noise intensities and has a certain anti-noise robustness.
Based on the above analysis, it can be confirmed that the UAPPSR method is capable of detecting weak signals with different driving frequencies and different noise intensities, and shows an excellent detection performance and engineering application value. In the next section, the proposed method will be applied to extract the local weak fault of a gear with crack information to verify the correctness and effectiveness of the method.
4. Experimental Verification
4.1. Gear Defect Detection with Local Damage
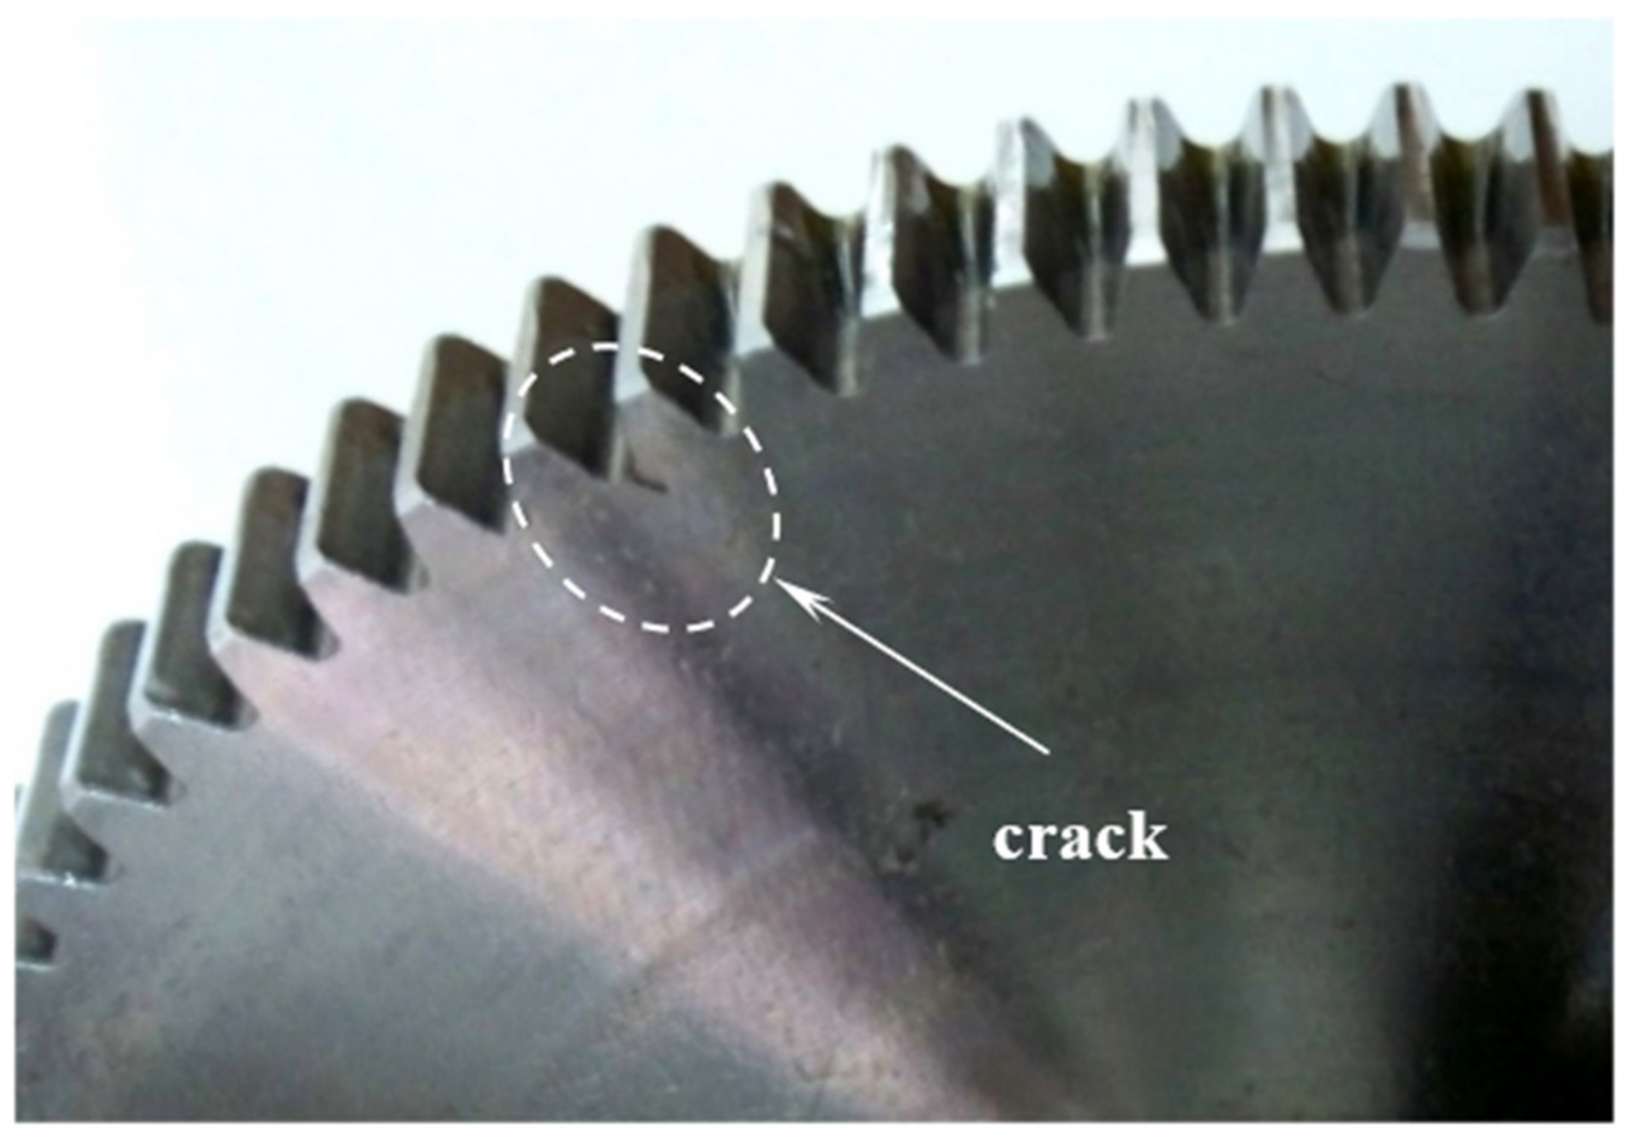
To verify the effectiveness and accuracy of the proposed UAPPSR method in an engineering application, an example gear diagnosis with a local root crack is selected for analysis. In the experiment, the gearbox failure test platform, as shown in Figure 10, is used. The platform is composed of a motor with AC frequency conversion, which is coupled with a shaft, a magnetic powder clutch brake, and a gearbox. Table 1 shows the geometry parameters of the tested gearbox adopted in the experiment. As shown in Figure 11, the normal pinion has 55 teeth, while the tested gear has 75 teeth, on which a root crack is fabricated through wire cutting. The vibration signal is collected by an acceleration sensor mounted on the gearbox housing at a sampling frequency of 12.8 KHz. During the experiment, the rotating speed of the normal pinion is set to be constantly 440.6 r/min, based on which the characteristic frequency of the tested gear is evaluated to be 5.385 Hz.
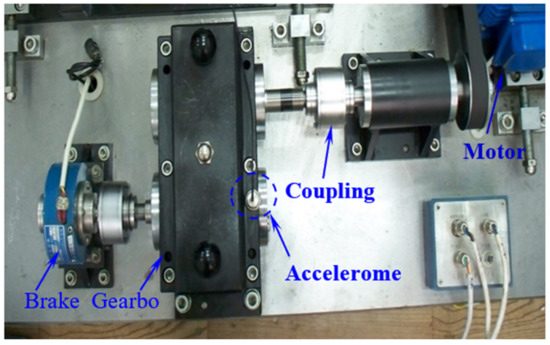
Figure 10.
Gear test rig in the experiment.

Table 1.
Detailed parameters of the gear in the experiment.
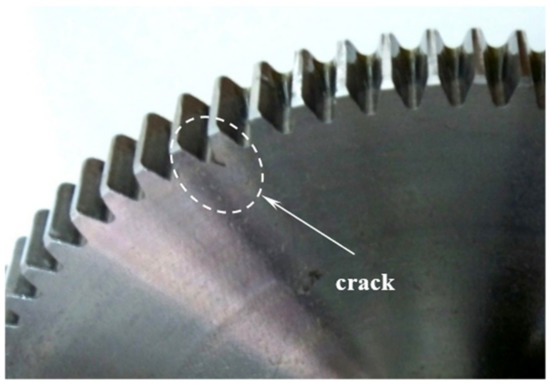
Figure 11.
Test gear with crack failure.
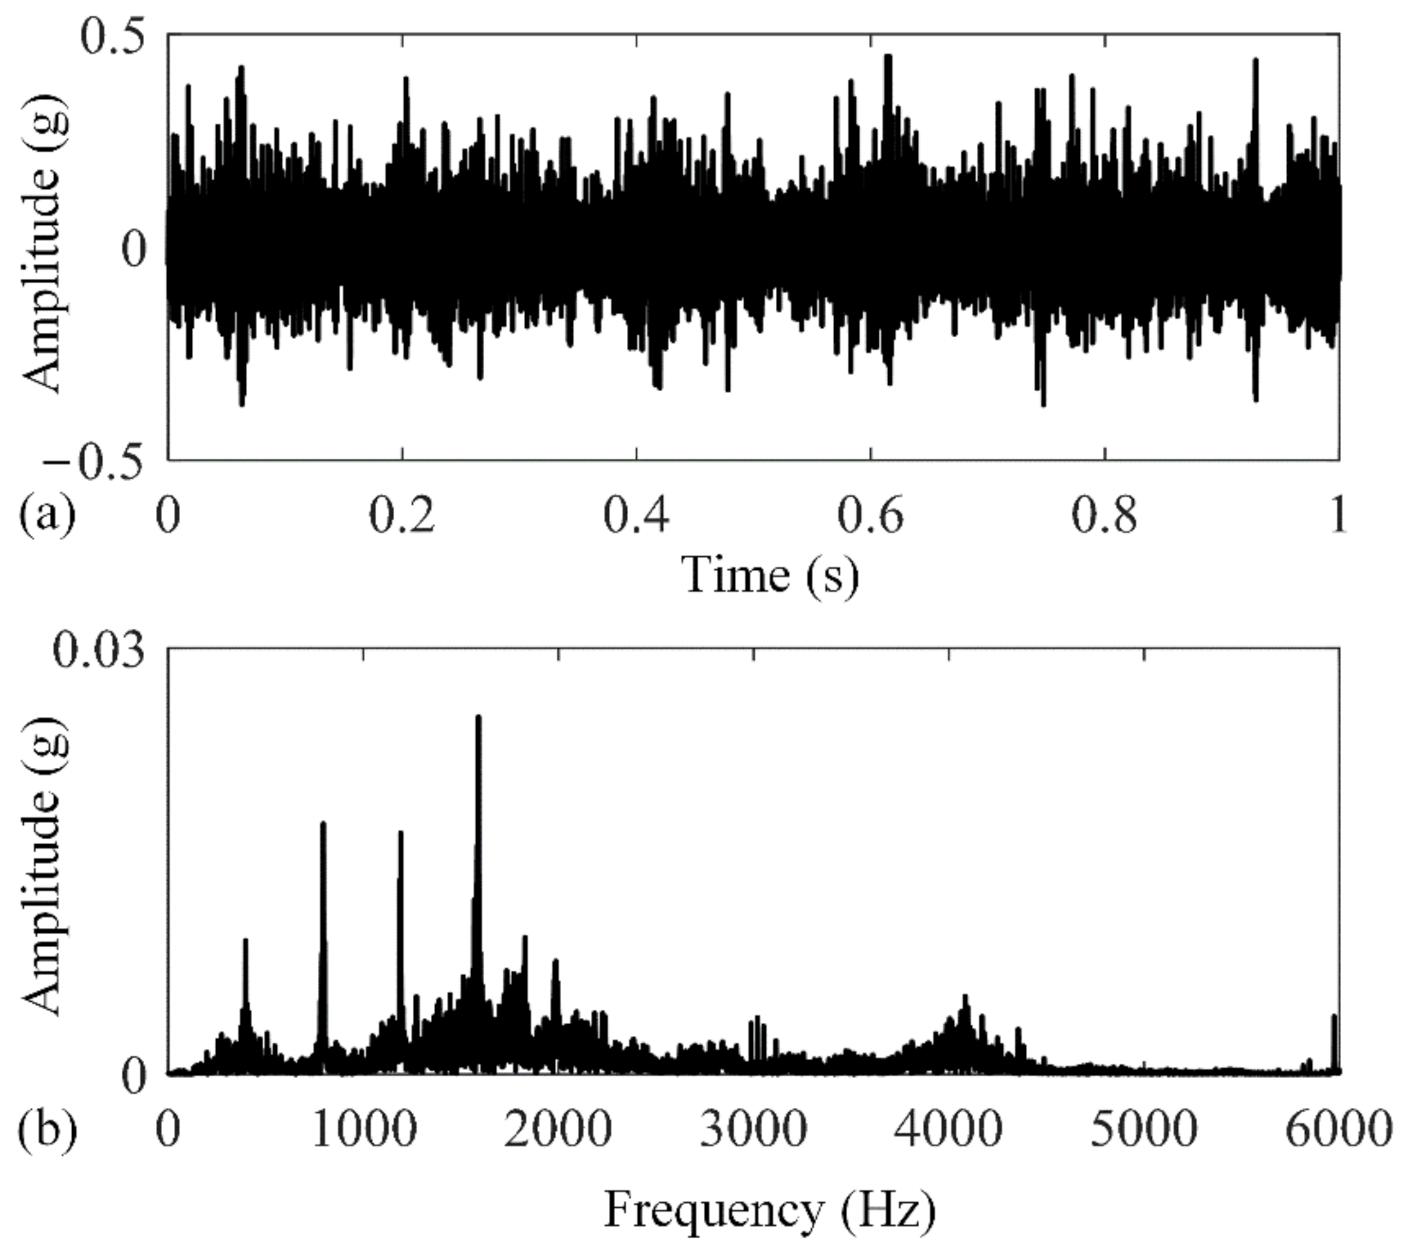
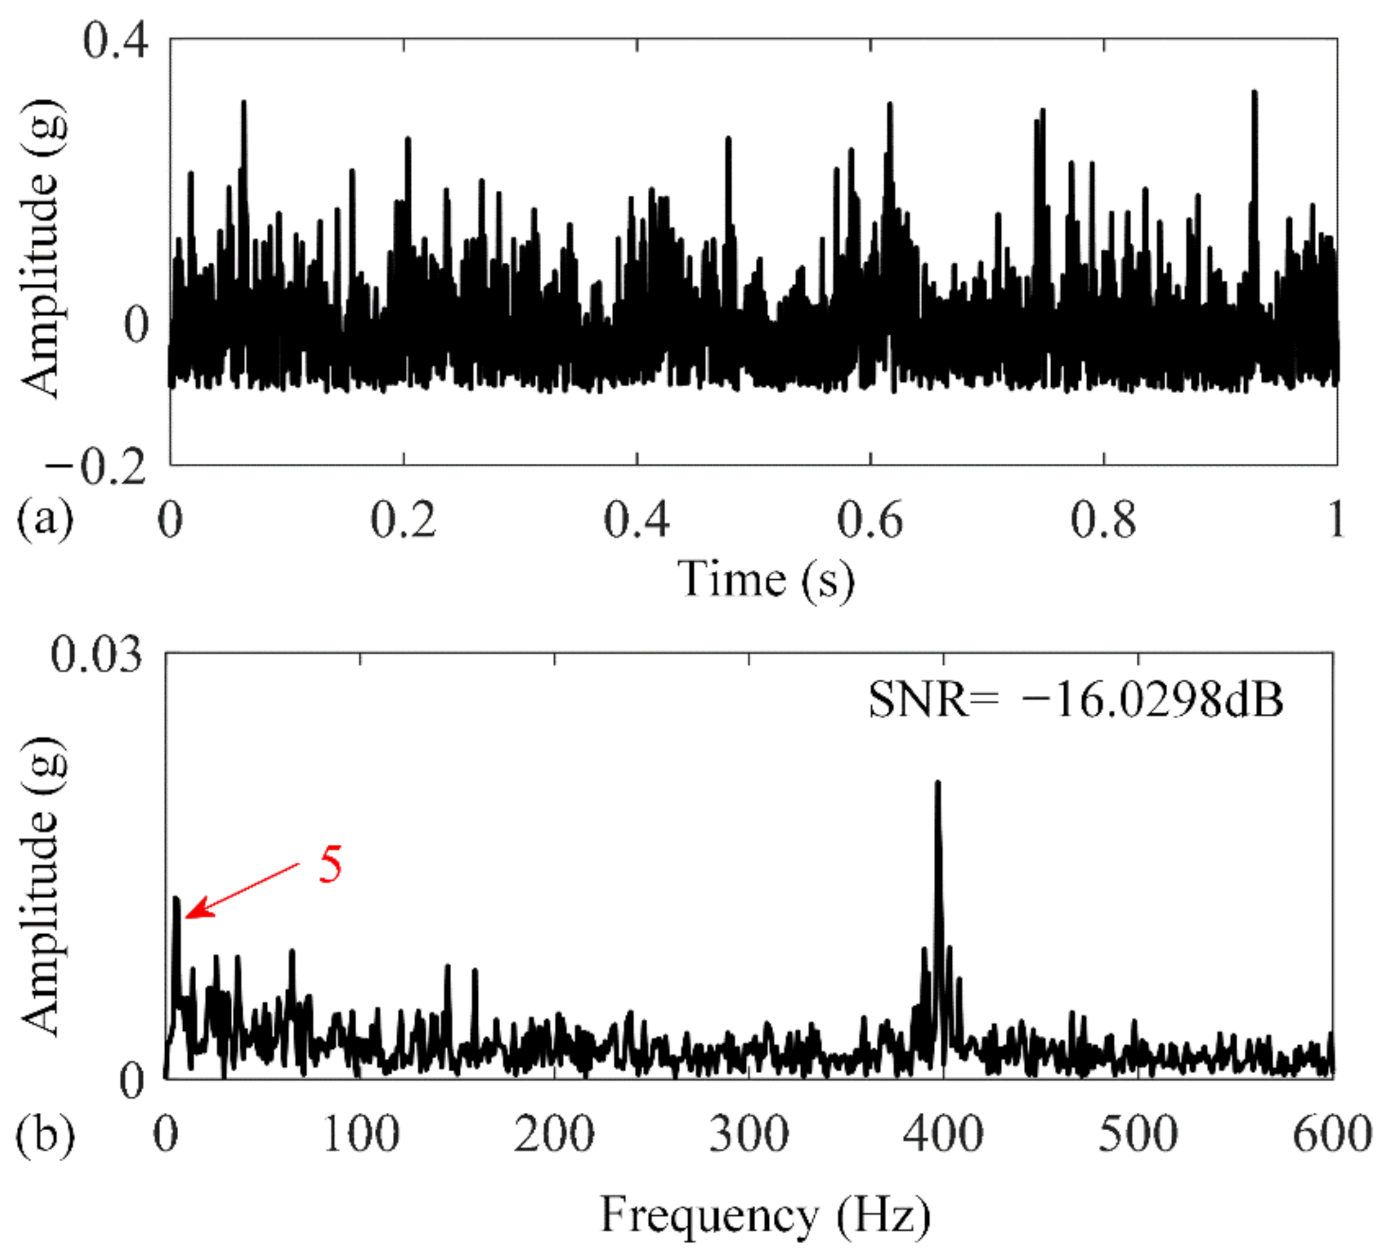
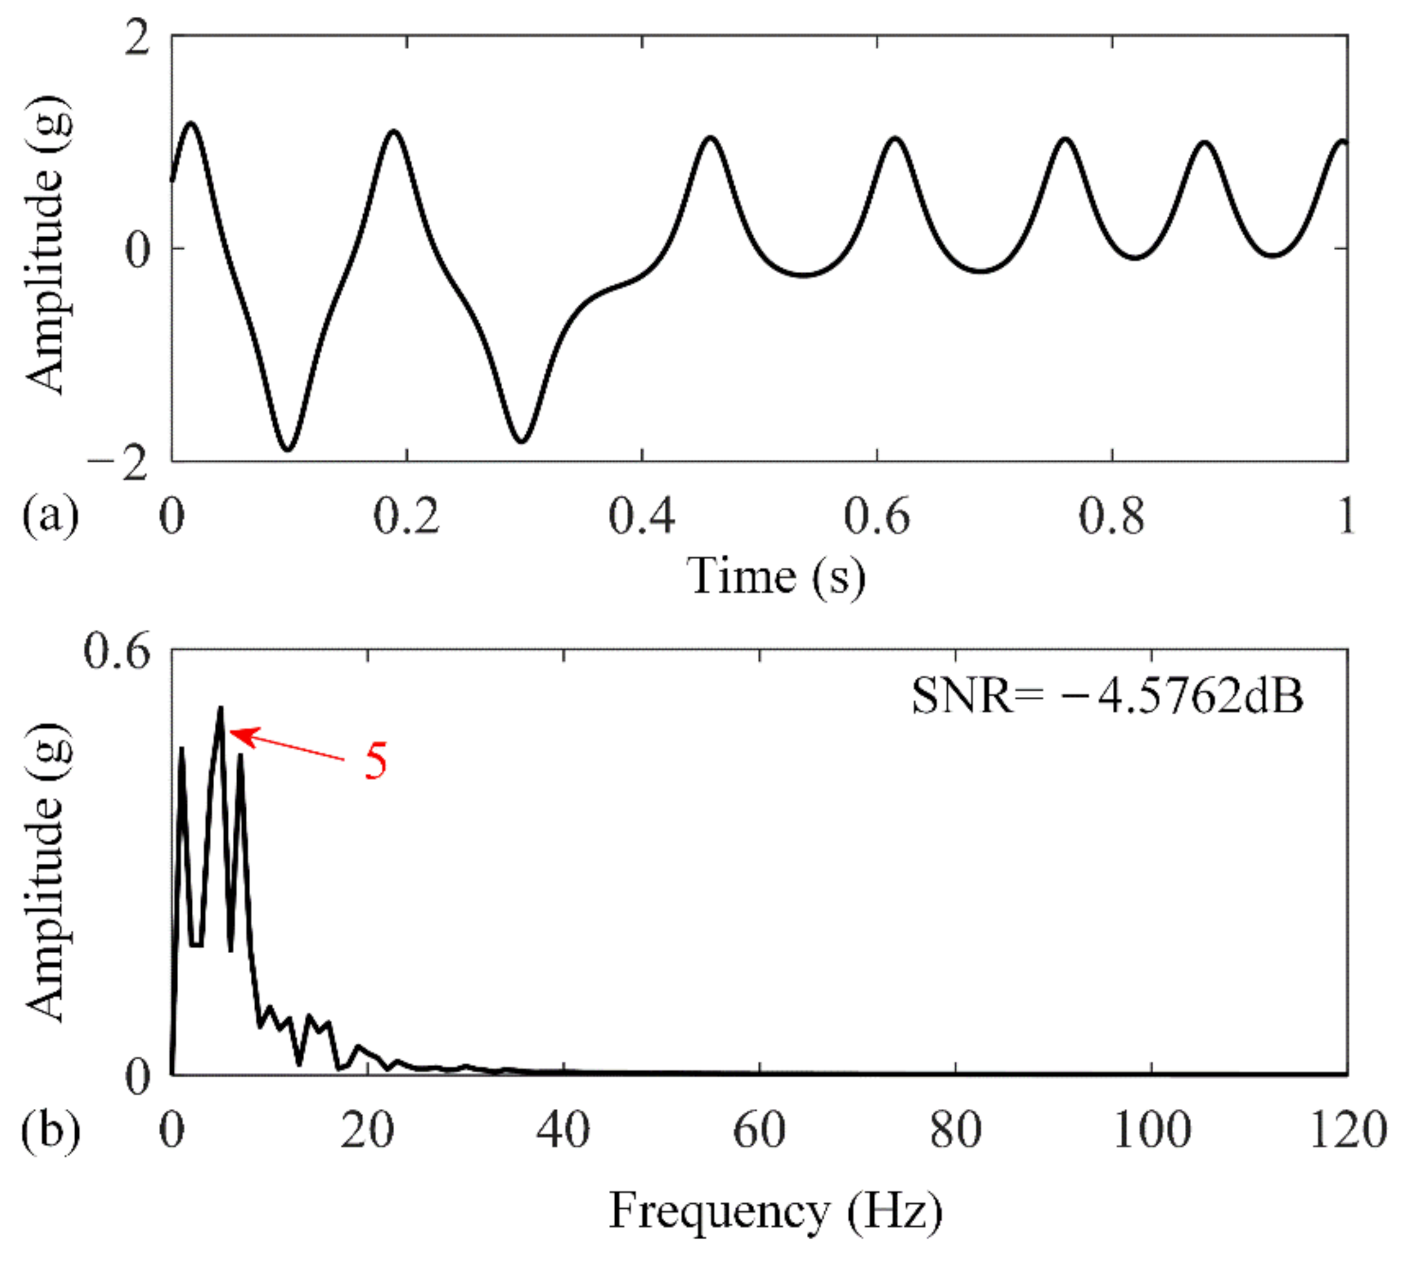
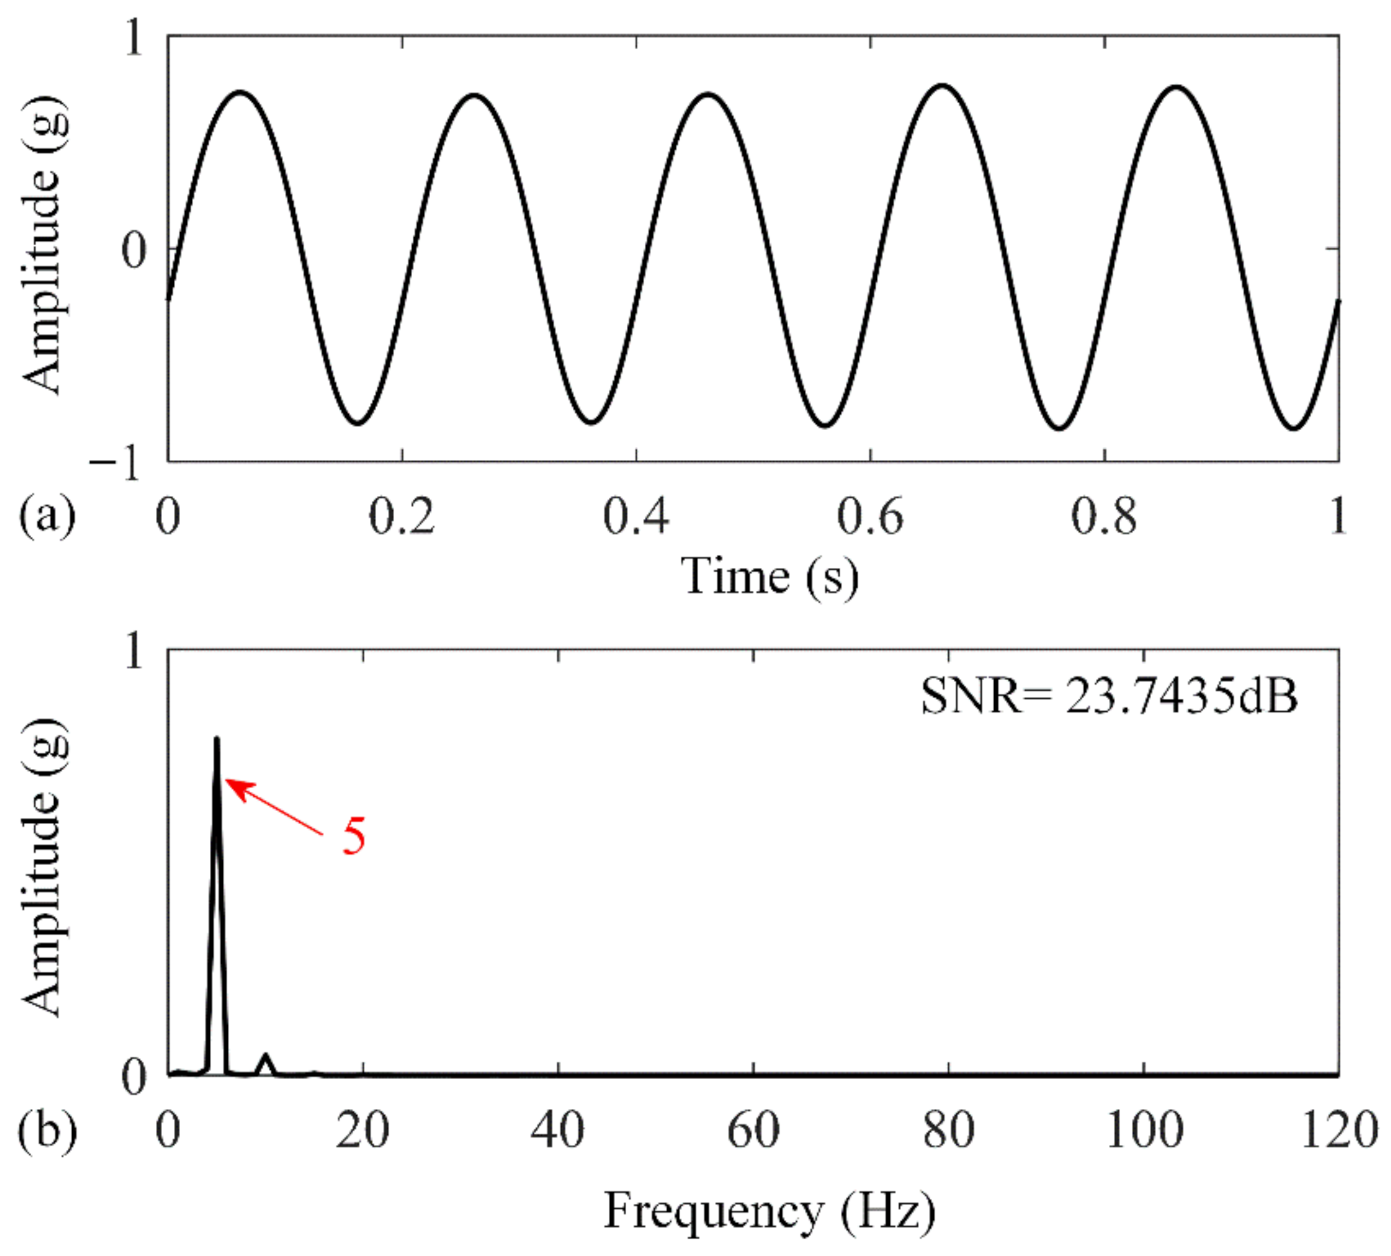
For the gear crack damage signal, the time domain waveform of the original signal and its frequency spectrum are shown in Figure 12. Due to the interference of the strong background noise, the periodic impact signal cannot be directly identified from the time domain. Moreover, the information related to the gear crack failure cannot be found in the frequency spectrum. Therefore, it is difficult to judge whether the gear has a crack fault using only the time domain vibration measurements or the Fourier spectrum. Subsequently, the envelope analysis method is used to process the collected vibration signal, and the results are displayed in Figure 13. Although the fault characteristic frequency of 5 Hz can be observed in the envelope spectrum, the corresponding amplitude is small, and there are many interference frequency components, especially in the high frequency range, which could lead to a misdiagnosis. To further enhance the diagnosis accuracy, the envelope signals of the vibration measurements are obtained and further processed using both the UBSR and UAPPSR methods. The results are shown in Figure 14 and Figure 15, respectively. The results show that both methods can successfully extract the fault feature from the vibration measurements under a strong background noise, but the time domain waveform shows obvious irregularity after the envelope signal passed through the UBSR system. Meanwhile, from the output spectrum, it is found that most interference components in the high-frequency range have been filtered out, while some low-frequency components still exist around the fault characteristic frequency. However, when the envelope signal is analyzed in the UAPPSR system, the high and low frequency noise interference in the output spectrum of the system is eliminated, and the time domain waveform shows good periodicity. By quantitatively analyzing the output SNR of the two systems, it can be found that the UAPPSR system has a higher SNR output than the UBSR system. These results indicate the UAPPSR method can effectively enhance the weak fault characteristic, but it also has better visibility and a higher SNR for the system output.

Figure 12.
Vibration signal of the tested gear with a local root crack: (a) time domain waveform; (b) frequency spectrum.

Figure 13.
Envelope signal of the tested gear with a local root crack: (a) time domain waveform and (b) frequency spectrum.

Figure 14.
Analyzed results of the tested gear with a local root crack using the UBSR method: (a) time domain waveform and (b) frequency spectrum.

Figure 15.
Analyzed results of the tested gear with a local root crack using the UAPPSR method: (a) time domain waveform and (b) frequency spectrum.
4.2. Discussions for Experimental Results
The analysis results of the above-mentioned simulation and experimental signals show the performance of the proposed UAPPSR method. During the comparison of the proposed UAPPSR method with other existing techniques, the vibration signal collected from the test gear with local damage is also processed by the envelope analysis and UBSR methods. The output SNRs of these three methods are calculated and are listed in Table 2, which are −16.0298 dB, −4.5762 dB, and 23.7435 dB, respectively. The results reveal that, compared with the other two traditional signal detection methods, the proposed method has obvious advantages in enhancing weak defect-induced impulses buried in the background noise. Some discussions on the merits of the UAPPSR detection method are given below.
Table 2.
System output SNRs of different methods when analyzing the experimental signal.
- (1)
- The introduction of the damping coefficient enables the SR system to exhibit the effect of secondary filtering on the input signals. By adjusting the value of the damping factor, UAPPSR can appear as an under-damped or over-damped system, which facilitates the analysis of different types of input signals under different noise levels. With the advantage of secondary filtering, finding an optimal damping factor can effectively enhance the detection performance of the proposed method, ensure that the system output has a relatively high SNR, and reduce the interference of other components.
- (2)
- Considering that the local fault response of gears usually appears in the form of periodic impulses modulated by high-frequency components, the traditional bistable SR system with a symmetrical potential structure, i.e., with two potential wells and one potential barrier, will often result in symmetrical characteristics when analyzing the envelope of the input signal, which loses the asymmetric characteristics of the original envelope signal. The main reason for this result is that the envelope signal in the positive region will make it difficult for particles to jump into the left potential well. However, in the UAPPSR system, a lower well on the left side can be obtained by adjusting the asymmetry coefficient , so that the particles can pass smoothly through the potential barrier to achieve inter-well resonance. Because the proposed method considers the consistency of the impulsive input signal and the UAPPSR system, the transition of particles between the potential wells is easier than in the traditional UBSR system. The simulation and experimental results also confirmed that the output effect of the UAPPSR system with an asymmetric potential well model is better than that of the traditional UBSR system.
- (3)
- The classical bistable SR model needs to meet the condition of small parameters that the amplitude and frequency of the periodic signal, as well as the noise, are all smaller than one when detecting weak signals. However, current strategies for processing large parameter signals, such as the frequency re-scaling technique [32], the scale normalization technique [33], and the multiscale noise tuning method [34], all need some prior knowledge to adjust the original signal in the time or frequency domains, such that, to overcome the limitations of small parameters, these methods cannot be effectively applied to engineering practice. In the proposed UAPPSR method, the large parameter signal is properly processed through the adjustment of calculating step . In essence, is equal to the reciprocal of the sampling frequency, which represents searching for the best sampling frequency to make the SR system and input signal match perfectly. Therefore, the UAPPSR system combined with the step-varying method shows a good nonlinear filtering effect when analyzing engineering signals with large parameter characteristics. The simulation and experimental results validate the effectiveness and advantages of the proposed method.
5. Conclusions
To obtain the optimal system output, a UAPPSR method is proposed for local gear fault diagnosis. Compared with the traditional UBSR method, by introducing the asymmetric periodic potential structure model, the proposed method can effectively use the asymmetry of its potential well to get the best matching for the characteristics of the system input signal, thereby achieving weak gear failure detection. In addition, the proposed method not only overcomes the limitation where classical SR can only analyze small parameter signals by optimizing the system parameters and the calculated interval to realize the effective detection of system input signals with different driving frequencies, but it also has a better frequency domain response and anti-noise performance. Based on these advantages, the driving frequency of the system input signal can be significantly improved to some extent, and the strong background noise components will be successfully eliminated. The effectiveness and feasibility of the proposed method are verified through simulation experiments and a gear fault diagnosis example with crack damage. The results show that, compared with the traditional UBSR method, the proposed method obtains a higher system output SNR, which implies that the proposed method has a better noise filtering performance and better engineering application value.
Author Contributions
Conceptualization, B.H. and S.Z.; methodology, B.H. and S.Z.; software, B.H.; validation, M.P., J.L. and S.L.; formal analysis, M.P. and S.L.; investigation, B.H., S.Z., J.L. and S.L.; resources, B.H. and M.P.; data curation, B.H. and S.Z.; writing—original draft preparation, B.H. and S.Z.; writing—review and editing, J.L. and C.Z.; visualization, S.Z.; supervision B.H. All authors have read and agreed to the published version of the manuscript.
Funding
This research was supported by the National Key Research and Development Program of China (2019YFB1707200), the National Natural Science Foundation of China (51705420), the Natural Science Basic Research Program of Shaanxi (program no. 2020JQ-127 and 2020JQ-630), the Key Research and Development Program of Shaanxi Province (2019ZDLGY14-08), and the Technology Innovation Leading Program of Shaanxi Province (2020QFY03-08).
Institutional Review Board Statement
Not applicable.
Informed Consent Statement
Not applicable.
Data Availability Statement
The study did not report any data.
Conflicts of Interest
The authors declare no conflict of interest.
Nomenclature
| damping factor | |
| asymmetric coefficient | |
| calculation step interval | |
| noise intensity of a signal | |
| barrier parameter of the bistable potential | |
| barrier parameter of the bistable potential | |
| amplitude of a signal | |
| length of a signal | |
| interval between the occurrence of the impulse | |
| modulation frequency | |
| sampling frequency | |
| width of the potential barrier | |
| height of the potential barrier | |
| a Gaussian white noise with zero mean and unit variance | |
| system input signal | |
| system noise item |
References
- Radzevich, S. Theory of Gearing: Kinematics, Geometry, and Synthesis; CRC Press: Boca Raton, FL, USA, 2018. [Google Scholar]
- Gołębski, R.; Boral, P. Study of machining of gears with regular and modified outline using CNC machine tools. Arch. Mater. 2021, 14, 2913. [Google Scholar] [CrossRef] [PubMed]
- Gołębski, R.; Ivandić, Ž. Analysis of modification of spur gear profile. Teh. Vjesn. 2018, 25, 643–648. [Google Scholar]
- Gołębski, R.; Szarek, A. Diagnosis of the operational gear wheel wear. Teh. Vjesn. 2019, 26, 658–661. [Google Scholar]
- Lei, Y.; Lin, J.; Zuo, M.; He, Z. Condition monitoring and fault diagnosis of planetary gearboxes: A review. Measurement 2014, 48, 292–305. [Google Scholar] [CrossRef]
- Goyal, D.; Vanraj; Pabla, B.; Dhami, S. Condition monitoring parameters for fault diagnosis of fixed axis gearbox: A review. Arch. Comput. Method Eng. 2017, 24, 543–556. [Google Scholar] [CrossRef]
- Bajric, R.; Zuber, N.; Skrimpas, G.; Mijatovic, N. Feature extraction using discrete wavelet transform for gear fault diagnosis of wind turbine gearbox. Shock Vib. 2016, 2016. [Google Scholar] [CrossRef] [Green Version]
- Gao, M.; Yu, G.; Wang, T. Impulsive gear fault diagnosis using adaptive Morlet wavelet filter based on alpha-stable distribution and Kurtogram. IEEE Access 2019, 7, 72283–72296. [Google Scholar] [CrossRef]
- Yu, G.; Gao, M.; Jia, C. A fast filtering method based on adaptive impulsive wavelet for the gear fault diagnosis. Proc. Inst. Mech. Eng. Part C. J. Eng. Mech. Eng. Sci. 2020. Available online: https://journals.sagepub.com/doi/abs/10.1177/0954406220906245 (accessed on 20 February 2020).
- Gao, L.; Yang, Z.; Cai, L.; Wang, H.; Chen, P. Roller Bearing Fault Diagnosis Based on Nonlinear Redundant Lifting Wavelet Packet Analysis. Sensors 2011, 11, 260–277. [Google Scholar] [CrossRef]
- Li, Y.; Xu, M.; Wei, Y.; Huang, W. An improvement EMD method based on the optimized rational Hermite interpolation approach and its application to gear fault diagnosis. Measurement 2015, 63, 330–345. [Google Scholar] [CrossRef]
- Kuai, M.; Cheng, G.; Pang, Y.; Li, Y. Research of planetary gear fault diagnosis based on permutation entropy of CEEMDAN and ANFIS. Sensors 2018, 18, 782. [Google Scholar] [CrossRef] [Green Version]
- Lei, Y.; Li, N.; Lin, J.; Wang, S. Fault diagnosis of rotating machinery based on an adaptive ensemble empirical mode decomposition. Sensors 2013, 13, 16950–16964. [Google Scholar] [CrossRef] [Green Version]
- Sun, W.; Yao, B.; Zeng, N.; Chen, B.; He, Y.; Cao, X.; He, W. An intelligent gear fault diagnosis methodology using a complex wavelet enhanced convolutional neural network. Materials 2017, 10, 790. [Google Scholar] [CrossRef] [Green Version]
- Wang, L.; Liu, Z.; Cao, H.; Zhang, X. Subband averaging kurtogram with dual-tree complex wavelet packet transform for rotating machinery fault diagnosis. Mech. Syst. Signal Proc. 2020, 142, 106755. [Google Scholar] [CrossRef]
- Sun, R.; Yang, Z.; Chen, X.; Tian, S.; Xie, Y. Gear fault diagnosis based on the structured sparsity time-frequency analysis. Mech. Syst. Signal Proc. 2018, 102, 346–363. [Google Scholar] [CrossRef]
- Huang, W.; Li, S.; Fu, X.; Zhang, C.; Shi, J.; Zhu, Z. Transient extraction based on minimax concave regularized sparse representation for gear fault diagnosis. Measurement 2019, 151, 107273. [Google Scholar] [CrossRef]
- Benzi, R.; Sutera, A.; Vulpiani, A. The mechanism of stochastic resonance. J. Phys. A Math. Gen. 1981, 14, L453–L457. [Google Scholar] [CrossRef]
- Gammaitoni, L.; Hänggi, P.; Jung, P.; Marchesoni, F. Stochastic resonance. Rev. Mod. Phys. 1998, 70, 223. [Google Scholar] [CrossRef]
- Li, Q.; Wang, T.; Leng, Y.; Wang, W.; Wang, G. Engineering signal processing based on adaptive step-changed stochastic resonance. Mech. Syst. Signal Proc. 2007, 21, 2267–2279. [Google Scholar]
- Lu, S.; He, Q.; Kong, F. Stochastic resonance with Woods–Saxon potential for rolling element bearing fault diagnosis. Mech. Syst. Signal Proc. 2014, 45, 488–503. [Google Scholar] [CrossRef]
- Zhang, H.; He, Q.; Lu, S.; Kong, F. Stochastic resonance with a joint woods-saxon and gaussian potential for bearing fault diagnosis. Math. Probl. Eng. 2014, 2014. [Google Scholar] [CrossRef] [Green Version]
- Liu, X.; Liu, H.; Yang, J.; Litak, G.; Cheng, G.; Han, S. Improving the bearing fault diagnosis efficiency by the adaptive stochastic resonance in a new nonlinear system. Mech. Syst. Signal Proc. 2017, 96, 58–76. [Google Scholar] [CrossRef]
- Chen, Z.; Shao, Y. Dynamic simulation of spur gear with tooth root crack propagating along tooth width and crack depth. Eng. Fail. Anal. 2011, 18, 2149–2164. [Google Scholar] [CrossRef]
- Khang, N.; Cau, T.; Dien, N. Modelling parametric vibration of gear-pair systems as a tool for aiding gear fault diagnosis. Tech. Mech. 2004, 24, 198–205. [Google Scholar]
- Qiao, Z.; Lei, Y.; Lin, J.; Jia, F. An adaptive unsaturated bistable stochastic resonance method and its application in mechanical fault diagnosis. Mech. Syst. Signal Proc. 2017, 84, 731–746. [Google Scholar] [CrossRef]
- Li, J.; Chen, X.; He, Z. Multi-stable stochastic resonance and its application research on mechanical fault diagnosis. J. Sound Vibr. 2013, 332, 5999–6015. [Google Scholar] [CrossRef]
- Zhao, S.; Shi, P.; Han, D. A novel mechanical fault signal feature extraction method based on unsaturated piecewise tri-stable stochastic resonance. Measurement 2021, 168, 108374. [Google Scholar] [CrossRef]
- Li, Z.; Liu, X.; He, T.; Shan, Y. A periodic potential underdamped stochastic resonance method and its application for gear fault diagnosis. IEEE Access 2019, 7, 141633–141647. [Google Scholar] [CrossRef]
- Ray, R.; Sengupta, S. Stochastic resonance in underdamped, bistable systems. Phys. Lett. A. 2006, 353, 364–371. [Google Scholar] [CrossRef] [Green Version]
- Qi, Q.; Zhou, B. Stochastic resonance in an underdamped periodic potential system with symmetric trichotomous noise. Indian J. Phys. 2020, 94, 81–86. [Google Scholar] [CrossRef]
- Leng, Y.; Wang, T.; Guo, Y.; Xu, Y.; Fan, S. Engineering signal processing based on bistable stochastic resonance. Mech. Syst. Signal Proc. 2007, 21, 138–150. [Google Scholar] [CrossRef]
- Hu, N.; Chen, M.; Wen, X. The application of stochastic resonance theory for early detecting rub-impact fault of rotor system. Mech. Syst. Signal Proc. 2003, 17, 883–895. [Google Scholar] [CrossRef]
- He, Q.; Wang, J.; Liu, Y.; Dai, D.; Kong, F. Multiscale noise tuning of stochastic resonance for enhanced fault diagnosis in rotating machines. Mech. Syst. Signal Proc. 2012, 28, 443–457. [Google Scholar] [CrossRef]

Publisher’s Note: MDPI stays neutral with regard to jurisdictional claims in published maps and institutional affiliations. |
© 2021 by the authors. Licensee MDPI, Basel, Switzerland. This article is an open access article distributed under the terms and conditions of the Creative Commons Attribution (CC BY) license (https://creativecommons.org/licenses/by/4.0/).