Abstract
Background: Pain maps provide reliable information on pain location in various conditions. This study explored the feasibility of pain maps as a screening tools for serious underlying conditions. The pain symmetry was evaluated as the possible distinguishing feature. Methods: A Web-based survey on the correlation of pain-related disability and pain pattern was developed. Respondents with lower back pain were asked to mark the exact location of their pain over the pain chart. The symmetry index was calculated and used to divide subjects into two groups that were then compared in terms of the prevalence of red flags for serious pathologies, as well as the pain-related disability measured with COMI and ODI instruments. Results: Of the 4213 respondents who completed the survey, 1018 were included in the study. The pain related disability was greater in respondents with asymmetrical pain patterns, as shown with all instruments. The distribution of red flags was also dependent on pain symmetry. The history of weight loss (6.70 vs. 1.76 p < 0.001) and fever (4.91 vs. 2.14 p < 0.001) were more prevalent with symmetrical pain patterns, and the history of trauma was more frequent with asymmetrical pain (21.41 vs. 10.71 p < 0.001). Conclusions: It was shown that the symmetry of pain is correlated to the prevalence of red flags and pain-related disability.
Lower back pain (LBP) is a complex condition involving the bones, muscles, and nerves near the lumbosacral segment of the spine. It is one of the leading causes of disability throughout the world [1,2], with an annual incidence ranging from 1.5–36% of the general population [3]. Despite its prevalence, this entity remains a clinical conundrum. This highly ambiguous symptom can be a presentation of various underlying conditions that require vastly different approaches. In most cases, the cause is benign and requires rather minimalistic management. In other cases, it is caused by a serious pathology where a quick and accurate diagnosis is of critical importance. An essential problem in daily practice is how to screen patients to determine their eligibility for further investigation. Virtually all modern guidelines include the recommendation that the initial clinical evaluation should focus on the identification of red flags (RFs) to screen for specific diseases such as cancer, infection, and vertebral fracture [4]. Although RFs are often criticized for high false-positive rates, especially in the detection of malignancies and vertebral fractures [5,6], their negative predictive value is as high as 99% [7]. Thus, it is very unlikely to miss serious pathologies with no positive RFs. One of basic characteristics is pain location, which can, to a certain extent, predict the source [7]. The principal method of obtaining information on the exact pain location is through pain maps (PMs). It has been proven that assessing the pain distribution by using pain drawings is a clinically relevant and reliable method [8,9,10]. In the past several years, with the development of new mobile technologies, this method has gained a new interest from investigators. Starting as an effective, yet simple pen-on-paper tool, pain maps are now advanced digital health applications paving the way for new avenues of basic translational and clinical applications [11]. A key advantage of the electronic pain map is the much-needed ability to analyze results right upon completion of the drawings, without the need for labor-intensive digitization [12]. This can be further enhanced with data mining and machine learning approaches [11] in order to enable the instantaneous evaluation of even very large datasets.
In this study, LBP patterns were analyzed regarding pain symmetry. The entire population studied was divided into two groups: highly symmetrical and asymmetrical pain patterns. The main aim was to compare the prevalence of RFs between groups. The secondary goal was to assess the pain-related disability in each group. The pain map with relevant patient-reported disability measures was launched as an open Web-based survey embedded within a thematic portal.
1. Methods
1.1. Web Questionnaire
A Web-based survey on the correlation of pain-related disability and pain patterns was developed. It was an open-access survey nested within a thematic Web portal. The survey was developed as a rich Internet application using JavaScript technology on the client side and PHP scripting on the server side. The forms were interactive, self-validating providing relevant feedback data based on selected options. Users were able to review their answers at the end of the survey, prior to final submission. The usability and technical functionality were thoroughly tested before implementing the final version. The questionnaire was divided into the following four steps: the first contained information on basic demographics and the duration of symptoms (five questions), the latter was divided into four categories: less than 7 days, 7 days–4 weeks, 4 weeks–3 months, and more than 3 months. This was followed by the subsequent steps, namely: the Oswestry Disability Questionnaire (ODI) (10 items), the Core Outcome Measures Index (COMI) (6 items), the RFs (3 items), and the digital PM. The following factors were considered to be RFs: unexplained weight loss, fever lasting >3 days, and a history of trauma. The PM was placed as the last step of the survey. It was a clickable 2D silhouette representing the entire body and could be viewed from either the front or back. Each image was a GIF file of 435 × 600 pixels in diameter. The images were gender specific. Users were allowed to make any number of markings.
The data used in this study were collected from 1 September 2013 until 25 June 2016. No information that could lead to the identification of respondents was recorded, including the IP addresses. For the same reason, cookies were not used. Google Analytics (Google Inc., Mountain View, CA, USA) was used to evaluate the Web traffic. The Web survey was created according to the Checklist for Reporting Results of Internet E-Surveys [13]. Institutional Review Board approval was waived as this was an observational study based on data which were entirely anonymous. Informed consent was obtained from each subject beforehand.
The Web survey was nested within a thematic Web portal dedicated for users seeking information on spinal disorders. Its content was endorsed by the Polish Society of Spinal Surgery. The subjects were conveniently recruited from the visitors of this website. The baseline criteria were as follows: a minimum age of 18 and back pain as the most troubling issue. The latter was determined based on the first question of the COMI questionnaire which read, “Which of the following problems troubles you the most?”, with the following possible answers: (a) back pain; (b) leg/buttock pain; (c) sensory disturbances in the back/leg/buttocks, e.g., tingling, “pins and needles’, and numbness; or (d) none of the above. Only subjects who selected the “a” answer were included in this study.
1.2. Statistical Analysis
We analyzed the symmetry regarding the midline by computing the symmetry index (SI) of pain markings, which was calculated per each subject using the formula proposed by Herzog et al. [14], with XR and XL as an absolute distance from the midline in points.
The sample size was calculated. Based on a previous study [15], the Cohen d was estimated to be 0.2; thus, the calculated minimum sample size was 786 in order to achieve a statistical power of 0.80.
For the purpose of this study, we selected an SI value of 20 as the threshold between the symmetrical pain group (SPG – AI ≤ 20) and the asymmetrical pain group (ASG − AI > 20). The data integrity was assessed by calculating Cronbach’s alpha for the ODI.
Differences in the mean values of the continuous variables were compared with Student’s t-test. Proportions were compared with the “N-1” Chi-squared test [16]. A p-value ≤ 0.05 was considered statistically significant.
2. Results
From 1 September 2013 until 25 June 2016, a total of 4213 users visited the web page containing the questionnaire. During this time, 3621 respondents completed the questionnaire. Within this group, 1418 selected “back pain” as the problem troubling them the most. Out of the respondents who selected “back pain”, 1018 marked at least three points in the designated area (within the silhouette outlines from mid-thoracic down to the knee level). Thus, the final n of subjects included in the analysis was 1018. There were 549 females with a mean (SD) age of 42.19 (22.86) and 469 males with a mean (SD) age of 36.60 (21.20). The difference was statistically significant at p < 0.001. The flowchart is presented in Figure 1.
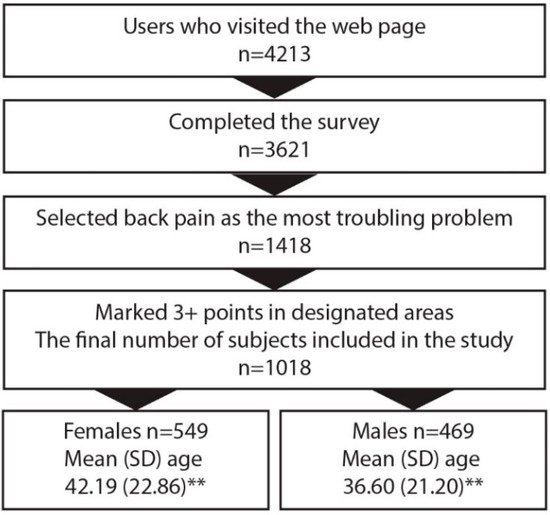
Figure 1.
Flowchart of the survey. ** p < 0.001.
A total of 4650 points were marked. Each respondent marked a mean of 4.57 points. The averaged pain maps are shown in Figure 2. In 439 cases, the pain was symmetrical (AI ≤ 20) (symmetrical pain group (SPG)) and in 579 cases, it was asymmetrical (AI > 20) (asymmetrical pain group (APG)). The F/M ratio in the former group was 44.42/55.58 and 52.68/47.32 in the latter. The difference was not statistically significant. Respondents in the SPG group were slightly older with a mean (SD) age of 41.57 (11.64) vs. 40.57 (12.02) in the APG; however, the difference was not significant. The median duration of pain was more than 3 months, with no difference between groups.
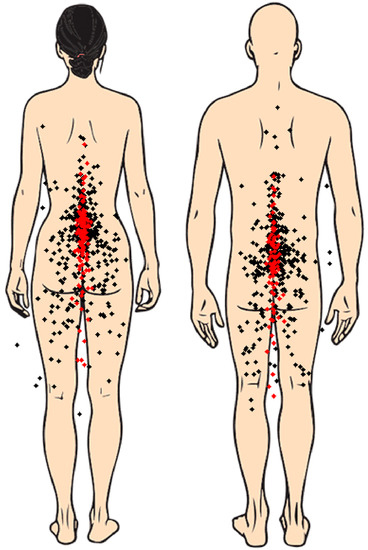
Figure 2.
Pain drawings. Each point represents the mean value of each respondent in the x- and y-axes. Red dots: symmetrical group; black dots: asymmetrical group.
The pain in the APG caused a significantly greater disability than in the SPG, as measured with all instruments. All differences were statistically significant at p < 0.001. Details are shown in Figure 3.
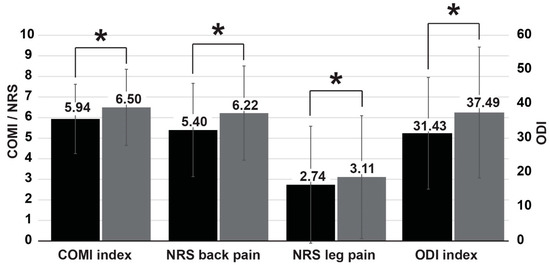
Figure 3.
Pain-related disability. Black bars: symmetrical group; grey bars: asymmetrical group. * p < 0.05.
In terms of the RFs, there was a significantly greater proportion of respondents who declared a history of trauma in APG (21.41 vs. 10.71 p < 0.001). On the contrary, the remaining RFs—weight loss (6.70 vs. 1.76 p < 0.001) and fever (4.91 vs. 2.14 p < 0.001)—were significantly more frequent in SPG (Figure 4).
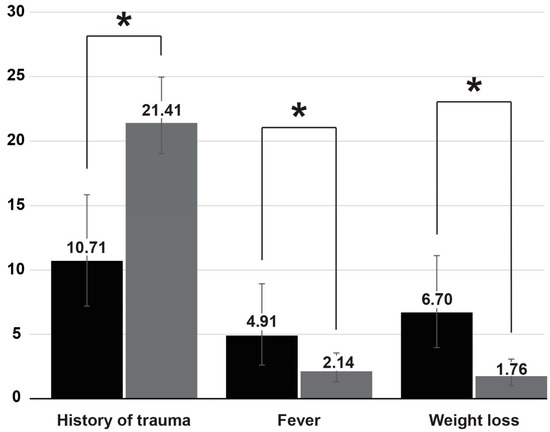
Figure 4.
Prevalence of red flags. Black bars: symmetrical group; grey bars: asymmetrical group. * p < 0.05.
The internal consistency of the data was high, with a Cronbach’s alpha value of 0.90 for the ODI and 0.84 for the COMI.
3. Discussion
PMs have been used in clinical settings for decades. Over the years, they underwent a significant evolution from simple pen-on-paper charts into advanced 3D multifaceted instruments [11], with digital technologies playing a key role this process. This concept is in line with the pursuit for more personalized medicine, with a demand for new modalities for the recording and quantification of pain experiences, such as pain location, intensity, and area [16]. One of the advantages of modern pain maps are their easiness for screening large populations. This study was designed to explore the suitability of PMs of LBP to screen for serious pathologies, and to supplement the classical RFs. With a tremendous overall burden of LBP, it is of key importance to employ simple yet effective screening tools to detect serious health issues. To address this necessity, RF screening questions have been developed and embraced for use in the detection of potentially serious spine pathologies in either the primary or multidisciplinary care [17]. Their negative predictive value is excellent, close to 99%, but their positive predictive value is very low [18]. The working hypothesis of this study was that PMs may be a source of useful data that could enhance the predictive capabilities of RFs. It has already been shown that the pain location and its referral pattern reported by the patient can be a reliable indicator of the structural source of LBP [19]. We looked at the symmetry of the pain patterns about the midline as a parameter, which was easy to compute. The pain diagram used in this study was a rather simplistic gender-specific 2D body chart similar to that from the publication of Egsgaard et al., who first reported that patients believed sex-specific body charts facilitated the communication of pain [20].
The key finding of this work was that the distribution of RFs was dependent on the pain symmetry. The history of trauma was more frequent in APG. One plausible explanation for this is that two common causes of pain are the myofascial syndrome [21] and lumbar facet osteoarthritis [22]. Both are likely to produce asymmetrical symptoms. As the vast majority of patients complained of chronic pain, rather than acute pain, with no significant differences between the groups, the highly prevalent acute lumbar sprains were not likely to affect the outcomes of this study. On the other hand, the remaining RFs, i.e., weight loss and history of fever, were more likely in SPG. The significance of this finding requires further research, as with a very low positive predictive value for these flags, it is unlikely that the group studied included even a single case of tumor and/or spinal infection. The overall prevalence of RFs was similar to a previous study that used a similar Web survey [23].
It was also found in this study that the pain-related disability in APG was significantly higher than in SPG, as measured using both ODI and COMI. Similarly, the pain intensity measured with the NRS for backs and legs was higher in the APG group. These results show that asymmetrical pain, which may be considered “non-discogenic” [19], is more severe for patients. It is noteworthy that we excluded patients with pain radiating below the knee. Thus, the patients with pure radicular pain were excluded. The differences in disability between groups showed that APG and SPG contain different clinical entities with distinct clinical presentations.
4. Limitations
As this study was based on an open anonymous web survey, there was a question regarding the reliability and validity of data. The data integrity was assessed by calculating the Cronbach’s alpha for the ODI and COMI, which confirmed a good internal consistency, which was similar to the data coming from clinical studies [15,24]. Another limitation was the very low positive predictive value of RFs. It is very unlikely that, despite the fairly large population included in this study, there were very few respondents with a true positive RF, i.e., with a serious pathology. Clinical validation is required to associate pain patterns with serious underlying cause. Last but not least, the risk of bias in a study of this type is difficult to assess. The selection bias, for instance, should not be of concern, as Internet users are considered highly representative of the general population [25]. On the other hand, there is a significant risk of information bias. For the sake of minimizing the respondent burden, questions regarding possible covariates, such as BMI or smoking, were not included, and further research is required.
5. Conclusions
To the best of our knowledge, this is the first study on the symmetry of back pain using PM. It is shown that APG and SPG demonstrate distinctive features such as the prevalence of RFs and the pain-related disability. The exact clinical relevance requires validation.
Author Contributions
Conceptualization, G.M. and R.Z.; methodology, G.M., A.D. and R.Z.; software, G.M.; validation, G.M.; formal analysis, G.M. and D.S.; investigation, G.M., D.S., S.D.P., J.F. and A.D.; data curation, S.D.P., J.F., A.D., writing—original draft preparation, G.M., S.D.P. and J.F.; writing—review and editing, G.M., S.D.P., J.F. and A.D.; visualization, G.M., S.D.P., J.F. and C.P.; supervision, G.M., R.Z. and C.P.; project administration, G.M., C.P. and D.S. All authors have read and agreed to the published version of the manuscript.
Funding
This research received no external funding.
Institutional Review Board Statement
The study was conducted according to the guidelines of the Declaration of Helsinki, Institutional Review Board approval was waived as this was an observational study based on data which were entirely anonymous.
Informed Consent Statement
Informed consent was obtained from each subject beforehand.
Data Availability Statement
The original dataset is available at: https://docs.google.com/spreadsheets/d/1CI9xirJcGdFUuXvPAJjVAamapt-75JHx/edit?usp=sharing&ouid=105300947326623048589&rtpof=true&sd=true.
Conflicts of Interest
The authors declare no conflict of interest.
References
- Meucci, R.D.; Fassa, A.G.; Faria, N.M.X. Prevalence of chronic low back pain: Systematic review. Rev. Saude Publica 2015, 49, 1. [Google Scholar] [CrossRef]
- Deyo, R.A.; Weinstein, J.N. Low Back Pain. N. Engl. J. Med. 2001, 344, 363–370. [Google Scholar] [CrossRef] [PubMed]
- Hoy, D.; Brooks, P.; Blyth, F.; Buchbinder, R. The Epidemiology of Low Back Pain. Best Pract. Res. Clin. Rheumatol. 2010, 24, 769–781. [Google Scholar] [CrossRef] [PubMed]
- Koes, B.W.; van Tulder, M.; Lin, C.W.C.; Macedo, L.G.; McAuley, J.; Maher, C. An Updated Overview of Clinical Guidelines for the Management of Non-Specific Low Back Pain in Primary Care. Eur. Spine J. 2010, 19, 2075–2094. [Google Scholar] [CrossRef] [PubMed] [Green Version]
- Henschke, N.; Maher, C.G.; Ostelo, R.W.; De Vet, H.C.; Macaskill, P.; Irwig, L. Red flags to screen for malignancy in patients with low-back pain. Cochrane Database Syst. Rev. 2013. [Google Scholar] [CrossRef] [PubMed]
- Williams, C.M.; Henschke, N.; Maher, C.G.; Van Tulder, M.W.; Koes, B.W.; Macaskill, P.; Irwig, L. Red flags to screen for vertebral fracture in patients presenting with low-back pain. Cochrane Database Syst. Rev. 2013, CD008643. [Google Scholar] [CrossRef]
- Airaksinen, O.; Brox, J.I.; Cedraschi, C.; Hildebrandt, J.; Klaber-Moffett, J.; Kovacs, F.; Mannion, A.F.; Reis, S.; Staal, J.B.; Ursin, H.; et al. Chapter 4 European guidelines for the management of chronic nonspecific low back pain. Eur. Spine J. 2006, 15, s192–s300. [Google Scholar] [CrossRef] [Green Version]
- DePalma, M.J.; Ketchum, J.; Trussell, B.S.; Saullo, T.R.; Slipman, C.W. Does the Location of Low Back Pain Predict Its Source? PM&R 2011, 3, 33–39. [Google Scholar] [CrossRef]
- Boudreau, S.A.; Royo, A.C.; Matthews, M.; Graven-Nielsen, T.; Kamavuako, E.N.; Slabaugh, G.; Thorborg, K.; Vicenzino, B.; Rathleff, M.S. Distinct patterns of variation in the distribution of knee pain. Sci. Rep. 2018, 8, 16522. [Google Scholar] [CrossRef] [Green Version]
- Bertilson, B.; Grunnesjö, M.; Johansson, S.-E.; Strender, L.-E. Pain Drawing in the Assessment of Neurogenic Pain and Dysfunction in the Neck/Shoulder Region: Inter-Examiner Reliability and Concordance with Clinical Examination. Pain Med. 2007, 8, 134–146. [Google Scholar] [CrossRef] [Green Version]
- Matthews, M.; Rathleff, M.S.; Vicenzino, B.; Boudreau, S.A. Capturing patient-reported area of knee pain: A concurrent validity study using digital technology in patients with patellofemoral pain. PeerJ 2018, 6, e4406. [Google Scholar] [CrossRef] [Green Version]
- Shaballout, N.; Neubert, T.-A.; Boudreau, S.; Beissner, F. From Paper to Digital Applications of the Pain Drawing: Systematic Review of Methodological Milestones. JMIR mHealth uHealth 2019, 7, e14569. [Google Scholar] [CrossRef] [Green Version]
- Shaballout, N.; Aloumar, A.; Neubert, T.-A.; Dusch, M.; Beissner, F. Digital Pain Drawings Can Improve Doctors’ Understanding of Acute Pain Patients: Survey and Pain Drawing Analysis. JMIR mHealth uHealth 2019, 7, e11412. [Google Scholar] [CrossRef]
- Eysenbach, G. Improving the Quality of Web Surveys: The Checklist for Reporting Results of Internet E-Surveys (CHERRIES). J. Med. Internet Res. 2004, 6, e34. [Google Scholar] [CrossRef]
- Miekisiak, G.; Łątka, D.; Sobolewski, T.; Sulewski, A.; Kubaszewski, L.; Kaczmarczyk, J. Prevalence of “Red Flags” Among the Internet User with Low Back Pain Seeking Information on Spinal Health—A Web Survey. Telemed. e-Health 2015, 21, 120–124. [Google Scholar] [CrossRef]
- Herzog, W.; Nigg, B.M.; Read, L.J.; Olsson, E. Asymmetries in ground reaction force patterns in normal human gait. Med. Sci. Sports Exerc. 1989, 21, 110–114. [Google Scholar] [CrossRef] [PubMed]
- Campbell, I. Chi-squared and Fisher–Irwin tests of two-by-two tables with small sample recommendations. Stat. Med. 2007, 26, 3661–3675. [Google Scholar] [CrossRef]
- Bruehl, S.; Apkarian, A.V.; Ballantyne, J.C.; Berger, A.; Borsook, D.; Chen, W.G.; Farrar, J.T.; Haythornthwaite, J.A.; Horn, S.D.; Iadarola, M.J.; et al. Personalized Medicine and Opioid Analgesic Prescribing for Chronic Pain: Opportunities and Challenges. J. Pain 2013, 14, 103–113. [Google Scholar] [CrossRef] [Green Version]
- Verhagen, A.P.; Downie, A.; Popal, N.; Maher, C.; Koes, B.W. Red flags presented in current low back pain guidelines: A review. Eur. Spine J. 2016, 25, 2788–2802. [Google Scholar] [CrossRef] [Green Version]
- Premkumar, A.; Godfrey, W.; Gottschalk, M.B.; Boden, S.D. Red Flags for Low Back Pain Are Not Always Really Red: A Prospective Evaluation of the Clinical Utility of Commonly Used Screening Questions for Low Back Pain. J. Bone Jt. Surg. Am. Vol. 2018, 100, 368–374. [Google Scholar] [CrossRef]
- Laplante, B.L.; Ketchum, J.M.; Saullo, T.R.; DePalma, M.J. Multivariable analysis of the relationship between pain referral patterns and the source of chronic low back pain. Pain Physician 2012, 15, 171–178. [Google Scholar]
- Egsgaard, L.L.; Christensen, T.S.; Petersen, I.M.; Brønnum, D.S.; Boudreau, S.A.; Ghinea, G.; Schilder, A.; Castrillon, E. Do Gender-Specific and High-Resolution Three Dimensional Body Charts Facilitate the Communication of Pain for Women? A Quantitative and Qualitative Study. JMIR Hum. Factors 2016, 3, e19. [Google Scholar] [CrossRef] [Green Version]
- Partanen, J.V.; Ojala, T.A.; Arokoski, J.P. Myofascial syndrome and pain: A neurophysiological approach. Pathophysiology 2010, 17, 19–28. [Google Scholar] [CrossRef] [PubMed]
- Kalichman, L.; Hunter, D.J. Lumbar Facet Joint Osteoarthritis: A Review. Semin. Arthritis Rheum. 2007, 37, 69–80. [Google Scholar] [CrossRef]
- Van Gelder, M.M.H.J.; Bretveld, R.W.; Roeleveld, N. Web-based Questionnaires: The Future in Epidemiology? Am. J. Epidemiol. 2010, 172, 1292–1298. [Google Scholar] [CrossRef] [PubMed]
Publisher’s Note: MDPI stays neutral with regard to jurisdictional claims in published maps and institutional affiliations. |
© 2021 by the authors. Licensee MDPI, Basel, Switzerland. This article is an open access article distributed under the terms and conditions of the Creative Commons Attribution (CC BY) license (https://creativecommons.org/licenses/by/4.0/).