
Ocular Asymmetry in Electrooculographic Responses


Abstract
:1. Introduction
2. Materials and Methods
2.1. Participants
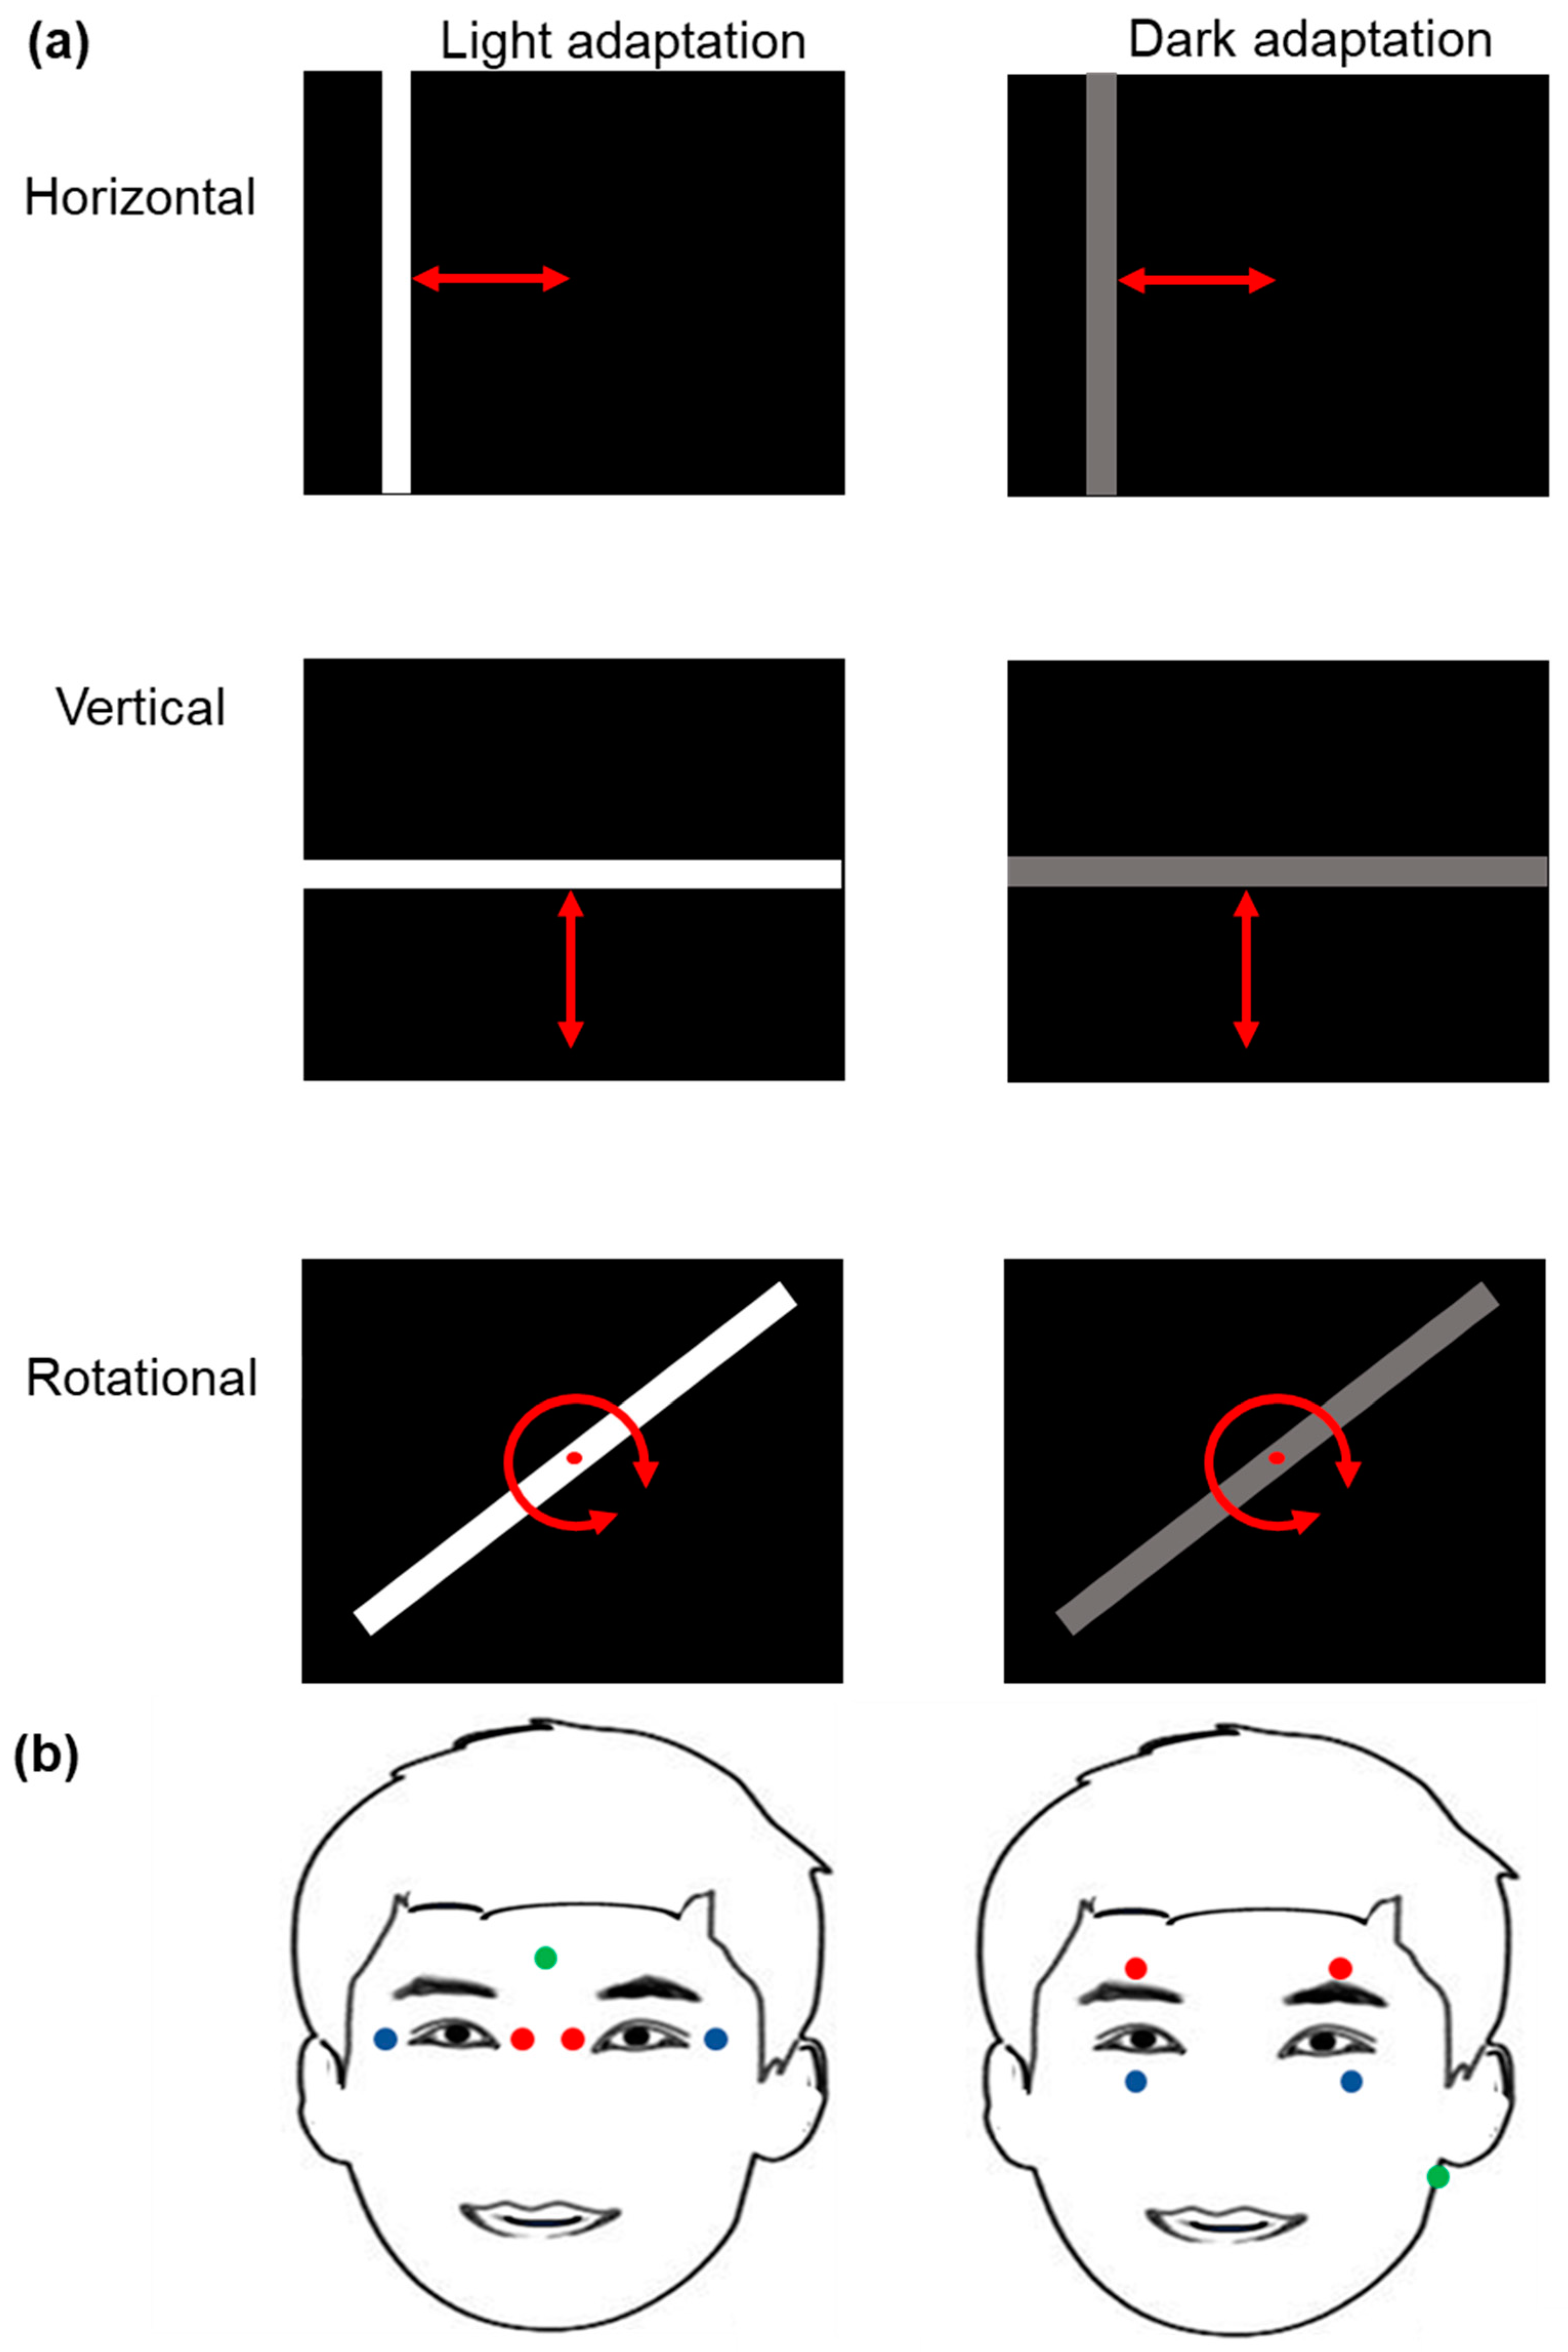
2.2. Light Stimulation Procedure
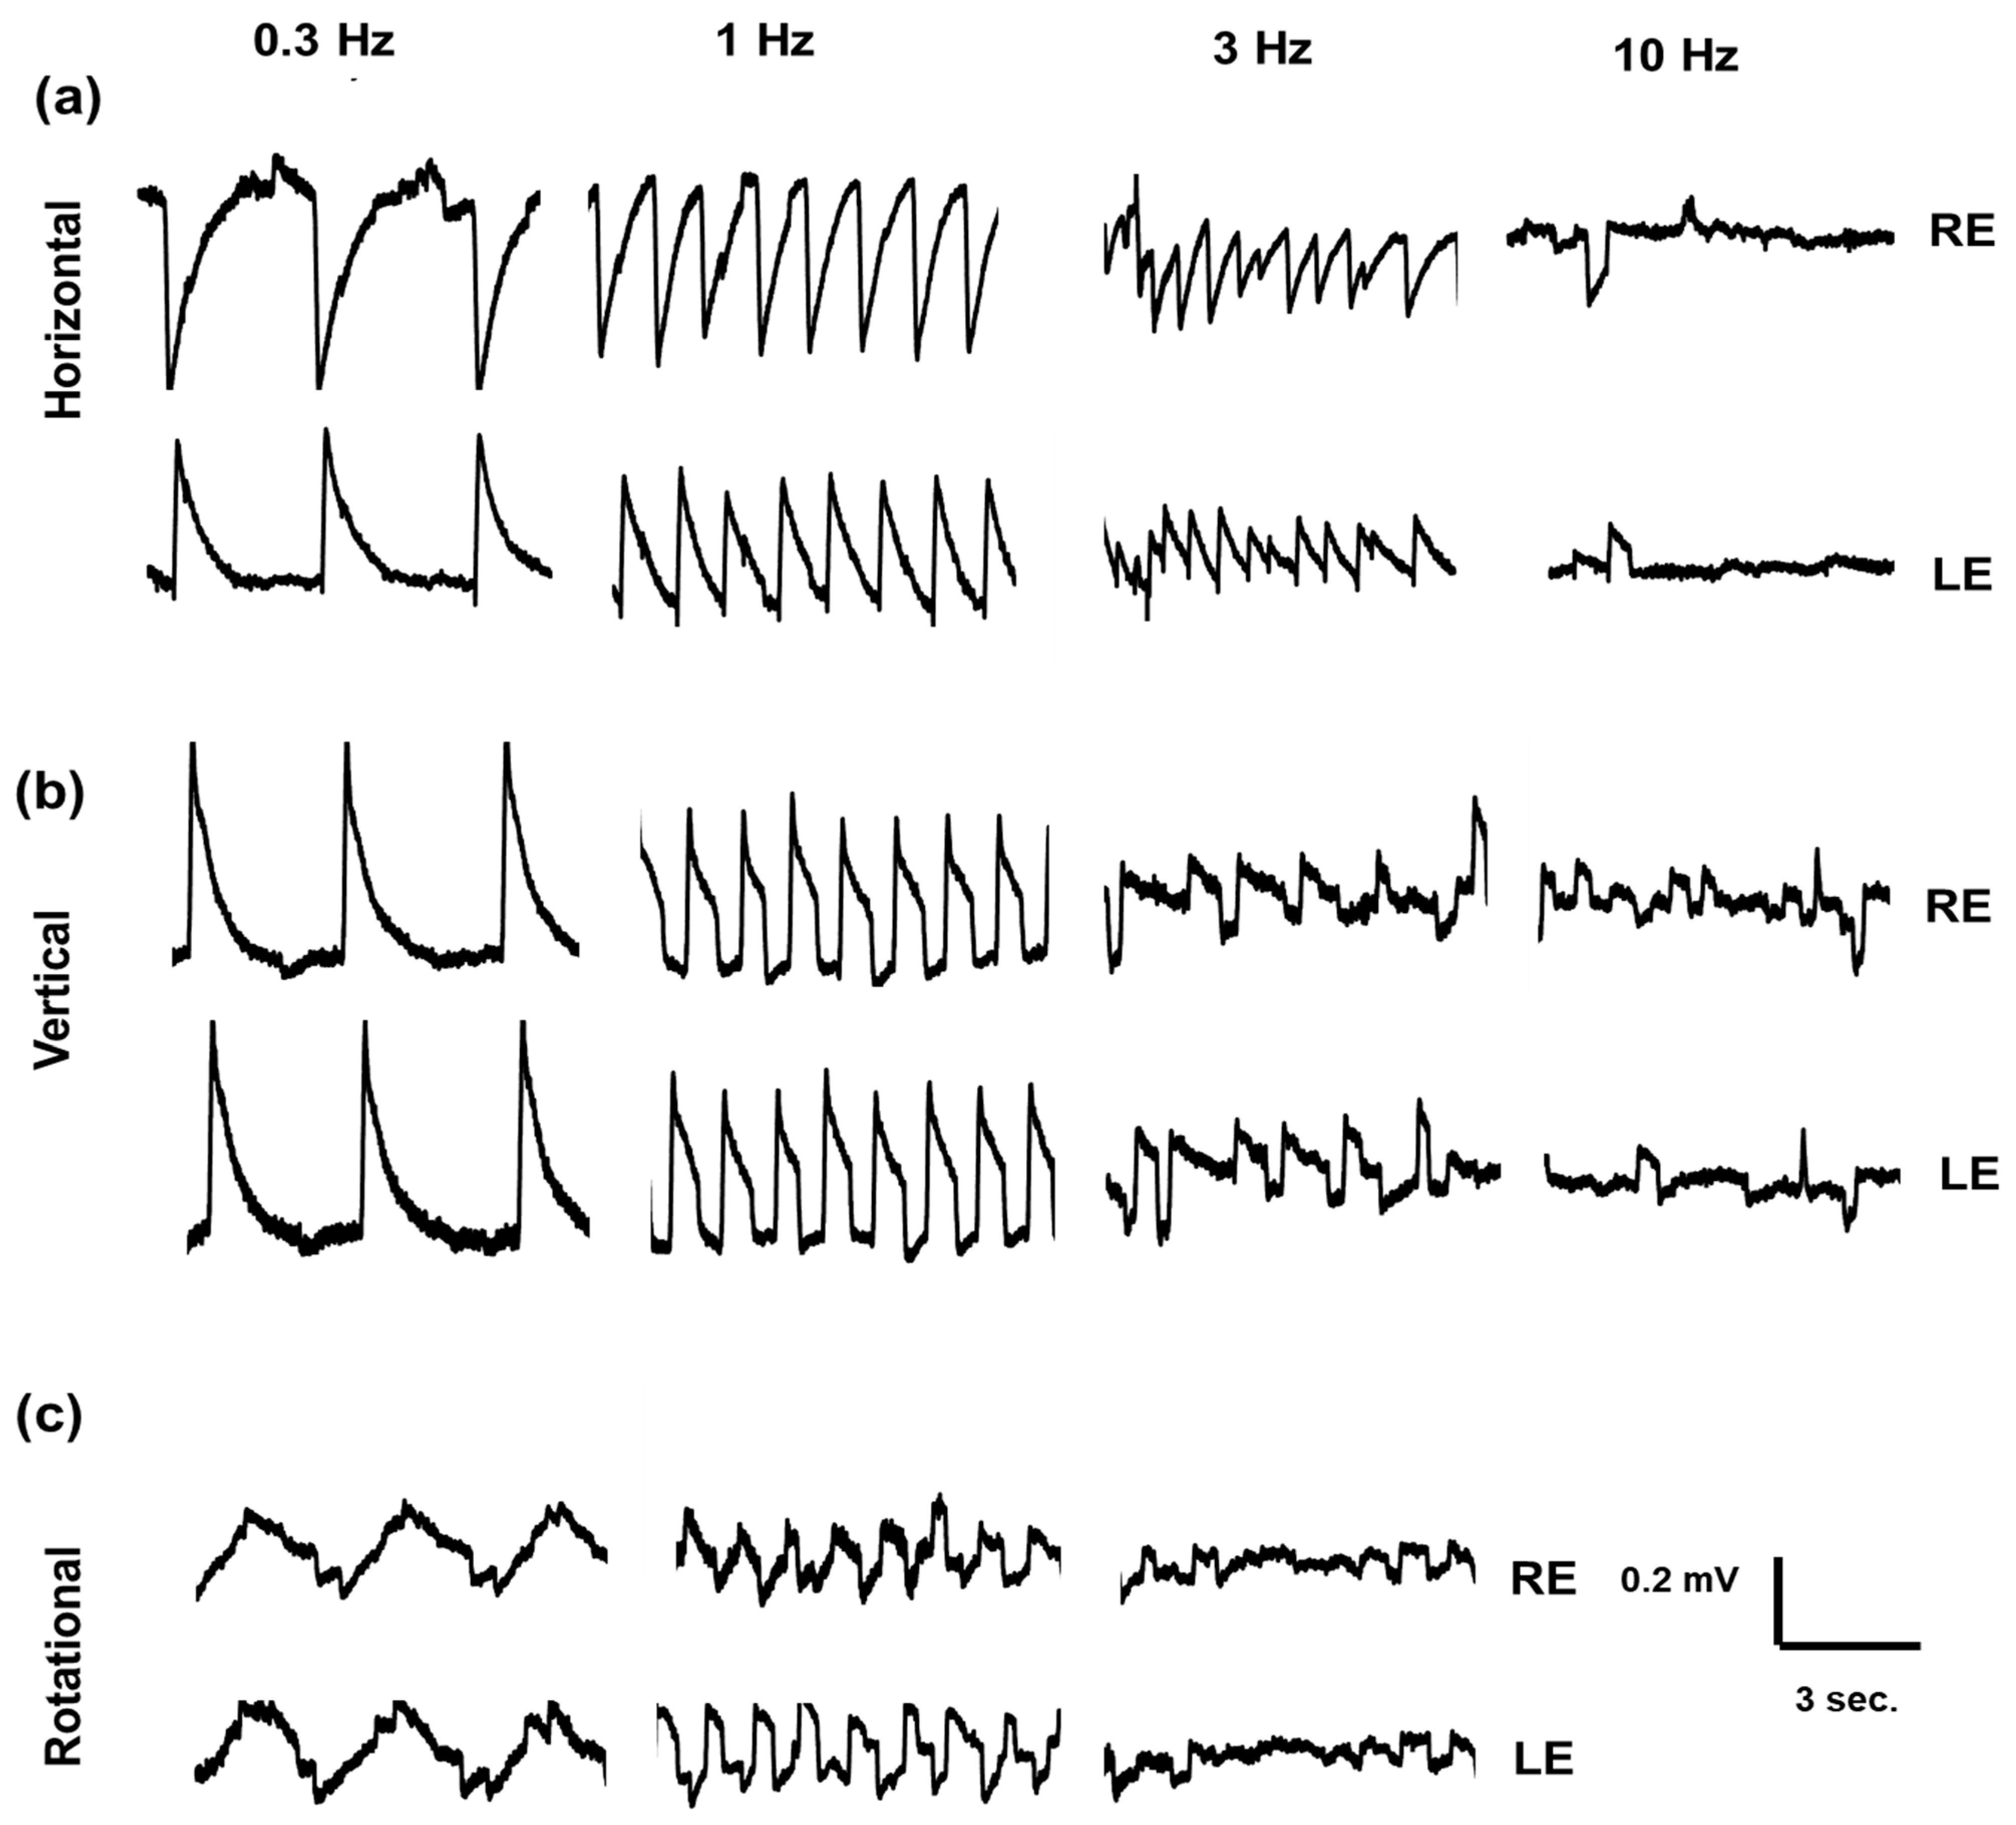
2.3. Electro-Oculography Signal Recording
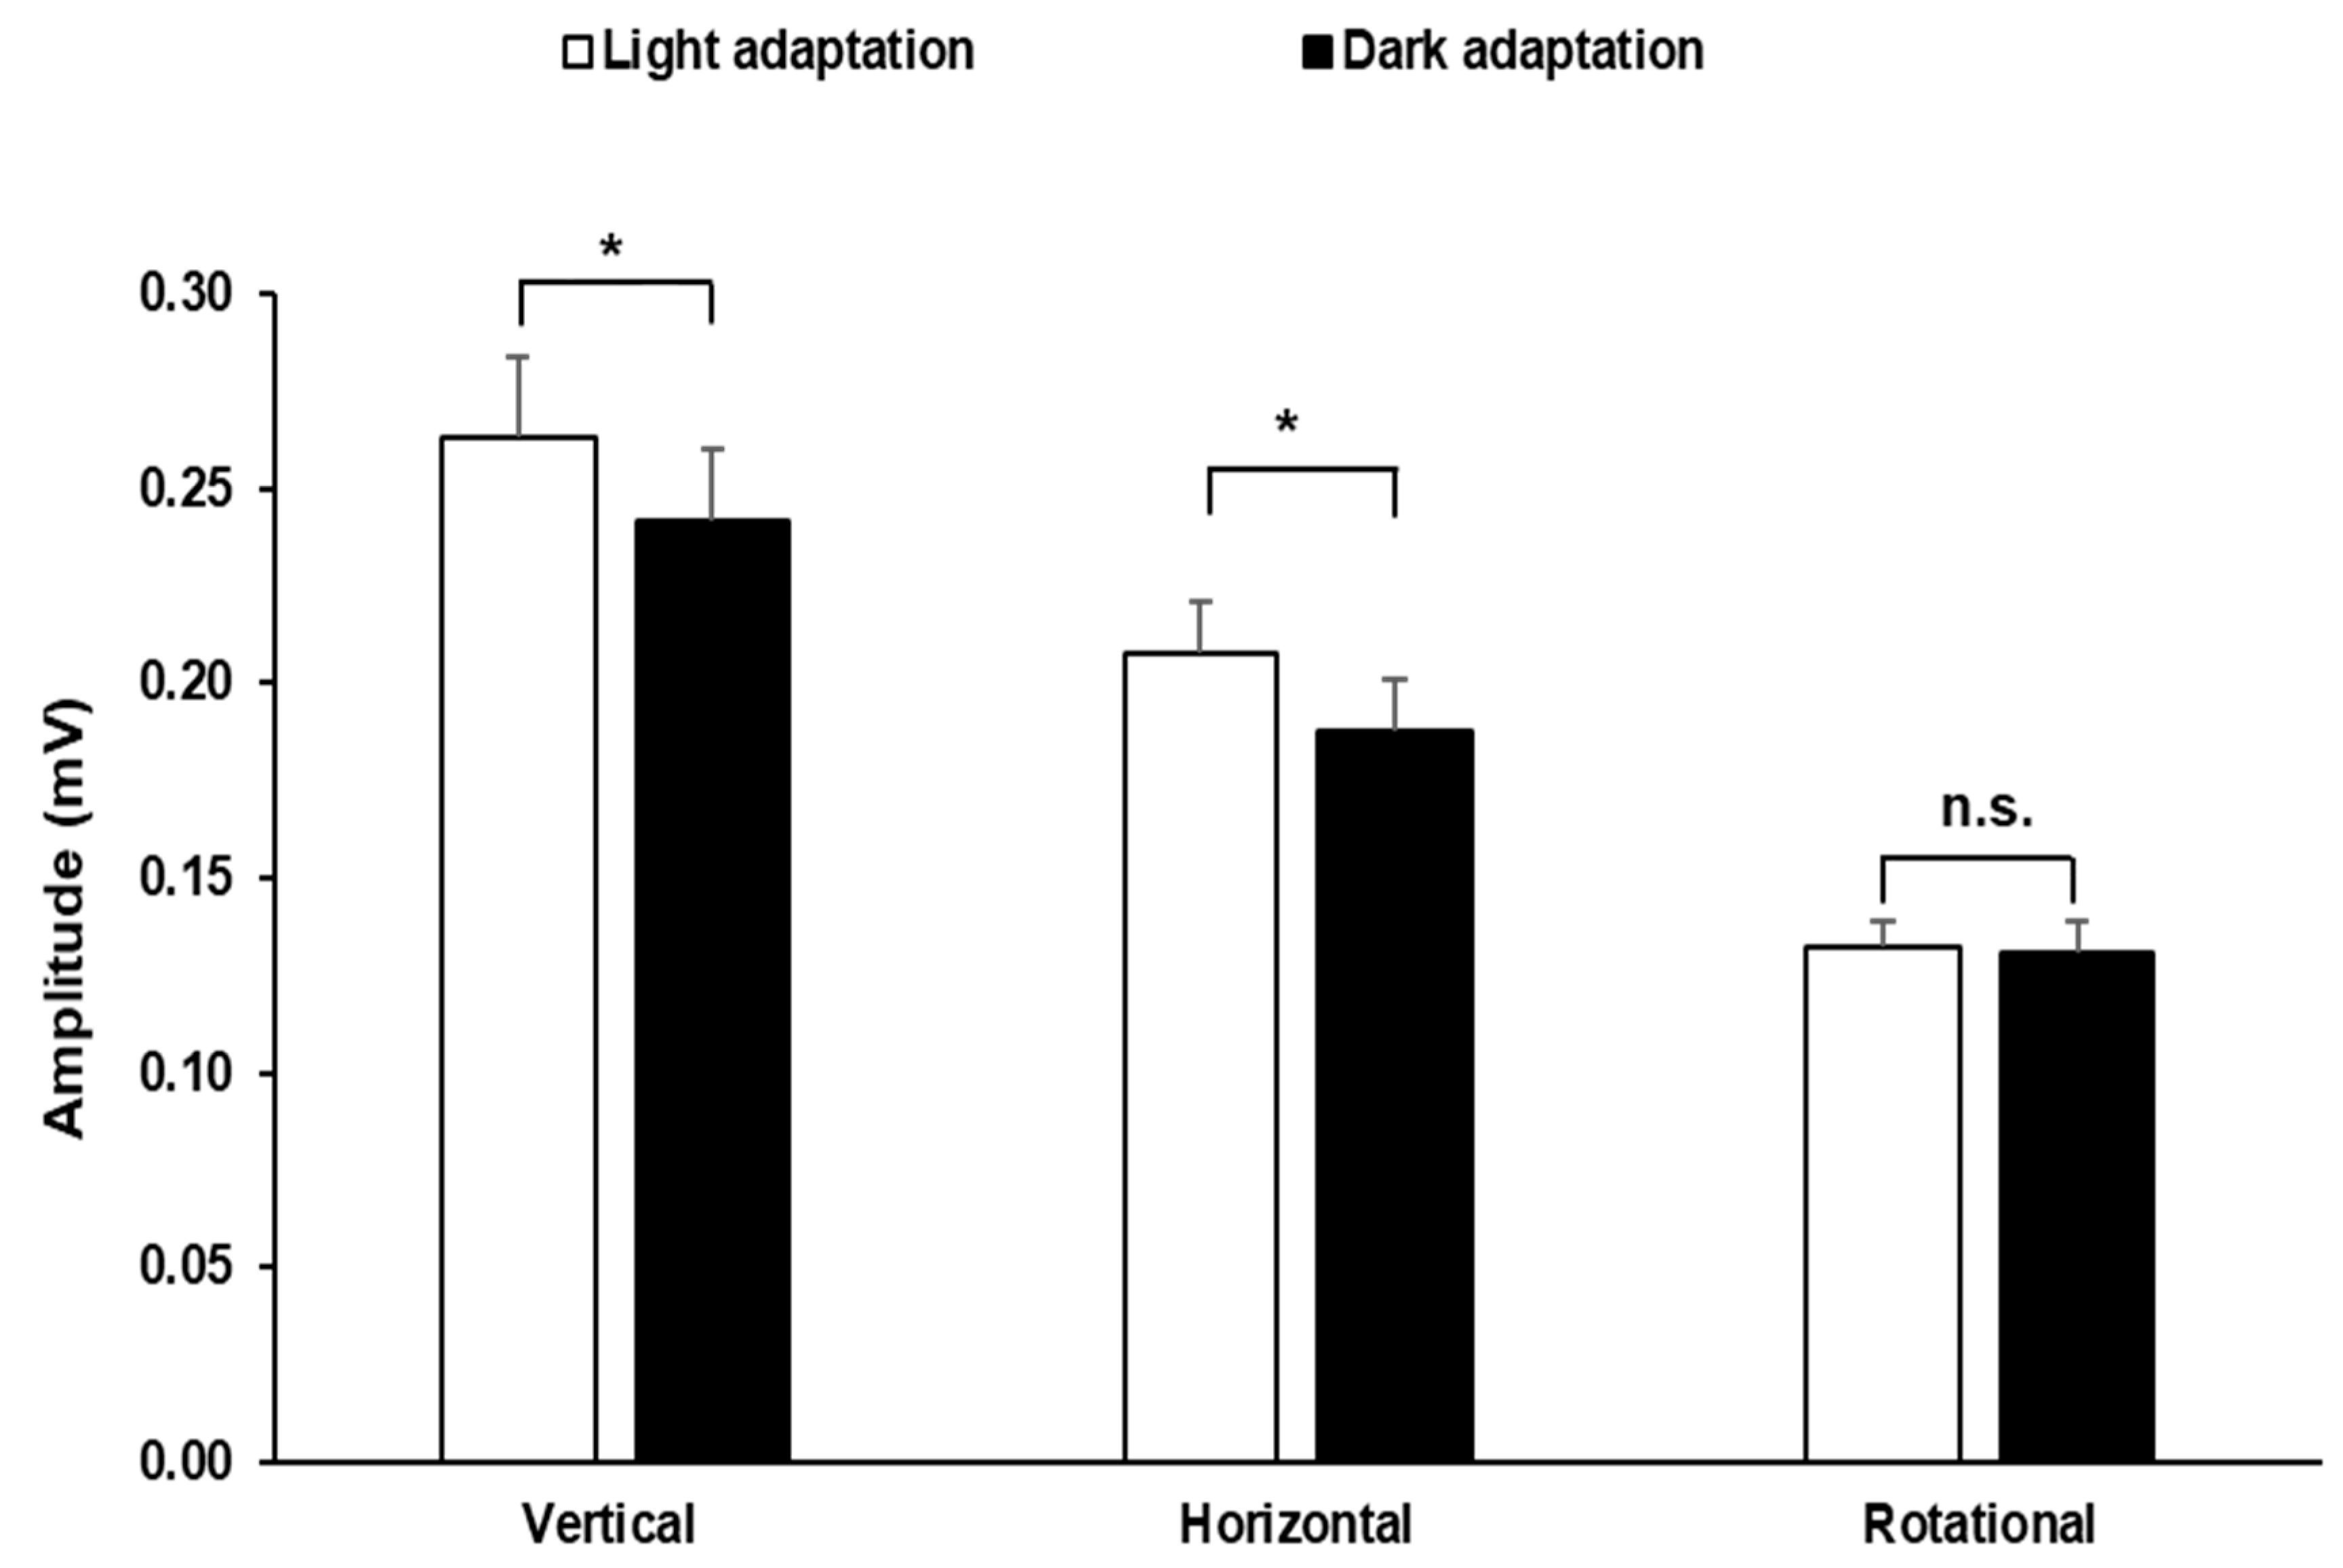
2.4. Quantitative and Statistical Analysis
3. Results
4. Discussion
Author Contributions
Funding
Institutional Review Board Statement
Informed Consent Statement
Data Availability Statement
Conflicts of Interest
References
- Duboc, V.; Dufourcq, P.; Blader, P.; Roussigné, M. Asymmetry of the Brain: Development and Implications. Annu. Rev. Genet. 2015, 49, 647–672. [Google Scholar] [CrossRef]
- Goldberg, E.; Roediger, D.; Kucukboyaci, N.E.; Carlson, C.; Devinsky, O.; Kuzniecky, R.; Halgren, E.; Thesen, T. Hemispheric asymmetries of cortical volume in the human brain. Cortex 2013, 49, 200–210. [Google Scholar] [CrossRef]
- Frässle, S.; Paulus, F.M.; Krach, S.; Schweinberger, S.R.; Stephan, K.E.; Jansen, A. Mechanisms of hemispheric lateralization: Asymmetric interhemispheric recruitment in the face perception network. Neuroimage 2016, 124, 977–988. [Google Scholar] [CrossRef]
- Geschwind, N.; Levitsky, W. Human brain: Left-right asymmetries in temporal speech region. Science 1968, 161, 186–187. [Google Scholar] [CrossRef]
- Toga, A.W.; Thompson, P.M. Mapping brain asymmetry. Nat. Rev. Neurosci. 2003, 4, 37–48. [Google Scholar] [CrossRef] [PubMed]
- Dane, S.; Gümüştekin, K. Correlation between hand preference and distance of focusing points of two eyes in the horizontal plane. Int. J. Neurosci. 2002, 112, 1141–1147. [Google Scholar] [CrossRef] [PubMed]
- Kawata, H.; Ohtsuka, K. Dynamic asymmetries in convergence eye movements under natural viewing conditions. Jpn. J. Ophthalmol. 2001, 45, 437–444. [Google Scholar] [CrossRef]
- Karatas, M. Internuclear and supranuclear disorders of eye movements: Clinical features and causes. Eur. J. Neurol. 2009, 16, 1265–1277. [Google Scholar] [CrossRef] [PubMed]
- Bozomitu, R.G.; Păsărică, A.; Tărniceriu, D.; Rotariu, C. Development of an Eye Tracking-Based Human-Computer Interface for Real-Time Applications. Sensors 2019, 19, 3630. [Google Scholar] [CrossRef] [PubMed] [Green Version]
- Di Stasi, L.L.; McCamy, M.B.; Martinez-Conde, S.; Gayles, E.; Hoare, C.; Foster, M.; Catena, A.; Macknik, S.L. Effects of long and short simulated flights on the saccadic eye movement velocity of aviators. Physiol. Behav. 2016, 153, 91–96. [Google Scholar] [CrossRef] [Green Version]
- Kapitaniak, B.; Walczak, M.; Kosobudzki, M.; Jóźwiak, Z.; Bortkiewicz, A. Application of eye-tracking in the testing of drivers: A review of research. Int. J. Occup. Med. Environ. Health 2015, 28, 941–954. [Google Scholar] [CrossRef] [Green Version]
- Carpenter, R.H.S. Movements of the Eyes, 2nd ed.; Pion Limited: London, UK, 1988. [Google Scholar]
- Becker, W. Saccades. In Vision and Visual Dysfunction; Carpenter, R.H.S., Ed.; CRC Press: Boca Raton, FL, USA, 1991; Volume 8, pp. 95–137. [Google Scholar]
- Gila, L.; Villanueva, A.; Cabeza, R. Fisiopatología y técnicas de registro de los movimientos oculares. An. Sist. Sanit. Navar. 2009, 32, 9–26. [Google Scholar] [CrossRef]
- Meyer, C.H.; Lasker, A.G.; Robinson, D.A. The upper limit of human smooth pursuit velocity. Vis. Res. 1985, 25, 561–563. [Google Scholar] [CrossRef]
- Lencer, R.; Trillenberg, P. Neurophysiology and neuroanatomy of smooth pursuit in humans. Brain Cogn. 2008, 68, 219–228. [Google Scholar] [CrossRef]
- Martinez-Conde, S.; Macknik, S.L.; Troncoso, X.G.; Dyar, T.A. Microsaccades counteract visual fading during fixation. Neuron 2006, 49, 297–305. [Google Scholar] [CrossRef] [Green Version]
- Costela, F.M.; McCamy, M.B.; Macknik, S.L.; Otero-Millan, J.; Martinez-Conde, S. Microsaccades restore the visibility of minute foveal targets. PeerJ 2013, 1, e119. [Google Scholar] [CrossRef] [PubMed] [Green Version]
- Wade, N.J.; Tatler, B.W.; Heller, D. Dodge-ing the issue: Dodge, Javal, Hering, and the measurement of saccades in eye-movement research. Perception 2003, 32, 793–804. [Google Scholar] [CrossRef] [PubMed]
- Eggert, T. Eye movement recordings: Methods. In Neuroophthalmology; Straube, A., Buttner, U., Eds.; Karger Publishers: Munich, Germany, 2007; Volume 40, pp. 15–34. [Google Scholar]
- Mowrer, O.; Ruch, T.C.; Miller, N. The corneo-retinal potential difference as the basis of the galvanometric method of recording eye movements. Am. J. Physiol.-Leg. Content 1935, 114, 423–428. [Google Scholar] [CrossRef]
- Constable, P.A.; Bach, M.; Frishman, L.J.; Jeffrey, B.G.; Robson, A.G. ISCEV Standard for clinical electro-oculography (2017 update). Doc. Ophthalmol. 2017, 134, 1–9. [Google Scholar] [CrossRef] [PubMed] [Green Version]
- Belov, D.P.; Eram, S.Y.; Kolodyazhnyi, S.F.; Kanunikov, I.E.; Getmanenko, O.V. Electrooculogram detection of eye movements on gaze displacement. Neurosci. Behav. Physiol. 2010, 40, 583–591. [Google Scholar] [CrossRef] [PubMed]
- Smyrnis, N. Metric issues in the study of eye movements in psychiatry. Brain Cogn. 2008, 68, 341–358. [Google Scholar] [CrossRef] [PubMed]
- Calkins, M.E.; Katsanis, J.; Hammer, M.A.; Iacono, W.G. The misclassification of blinks as saccades: Implications for investigations of eye movement dysfunction in schizophrenia. Psychophysiology 2001, 38, 761–767. [Google Scholar] [CrossRef] [PubMed]
- Leigh, R.J.; Kennard, C. Using saccades as a research tool in the clinical neurosciences. Brain 2004, 127, 460–477. [Google Scholar] [CrossRef]
- Missal, M.; Keller, E.L. Common inhibitory mechanism for saccades and smooth-pursuit eye movements. J. Neurophysiol. 2002, 88, 1880–1892. [Google Scholar] [CrossRef]
- Bargary, G.; Bosten, J.M.; Goodbourn, P.T.; Lawrance-Owen, A.J.; Hogg, R.E.; Mollon, J.D. Individual differences in human eye movements: An oculomotor signature? Vis. Res. 2017, 141, 157–169. [Google Scholar] [CrossRef]
- Laby, D.M.; Kirschen, D.G. Thoughts on ocular dominance-is it actually a preference? Eye Contact Lens 2011, 37, 140–144. [Google Scholar] [CrossRef]
- Beckerman, S.; Hitzeman, S.A. Sports vision testing of selected athletic participants in the 1997 and 1998 AAU Junior Olympic Games. Optometry 2003, 74, 502–516. [Google Scholar]
- Portal, J.M.; Romano, P.E. Major review: Ocular sighting dominance: A review and a study of athletic proficiency and eye-hand dominance in a collegiate baseball team. Binocul. Vis. Strabismus Q. 1998, 13, 125–132. [Google Scholar]
- Osborne, D.; Theodorou, M.; Lee, H.; Ranger, M.; Hedley-Lewis, M.; Shawkat, F.; Harris, C.M.; Self, J.E. Supranuclear eye movements and nystagmus in children: A review of the literature and guide to clinical examination, interpretation of findings and age-appropriate norms. Eye 2019, 33, 261–273. [Google Scholar] [CrossRef] [PubMed] [Green Version]
- López, A.; Ferrero, F.; Villar, J.R.; Postolache, O. High-Performance Analog Front-End (AFE) for EOG Systems. Electronics 2020, 9, 970. [Google Scholar] [CrossRef]
- Constable, P.A. A perspective on the mechanism of the light-rise of the electrooculogram. Invest. Ophthalmol. Vis. Sci. 2014, 55, 2669–2673. [Google Scholar] [CrossRef] [Green Version]
- Yüksel, D.; Orban de Xivry, J.J.; Lefèvre, P. Review of the major findings about Duane retraction syndrome (DRS) leading to an updated form of classification. Vis. Res. 2010, 50, 2334–2347. [Google Scholar] [CrossRef] [PubMed] [Green Version]
- Franco, J.G.; De Pablo, J.; Gaviria, A.M.; Sepúlveda, E.; Vilella, E. Movimientos de seguimiento ocular lento y esquizofrenia: Revisión de la literatura. Arch. Soc. Esp. Oftalmol. 2014, 89, 361–367. [Google Scholar] [CrossRef] [PubMed]
- Otero-Millan, J.; Schneider, R.; Leigh, R.J.; Macknik, S.L.; Martinez-Conde, S. Saccades during attempted fixation in parkinsonian disorders and recessive ataxia: From microsaccades to square-wave jerks. PLoS ONE 2013, 8, e58535. [Google Scholar] [CrossRef] [PubMed]
- Kapoula, Z.; Yang, Q.; Otero-Millan, J.; Xiao, S.; Macknik, S.L.; Lang, A.; Verny, M.; Martinez-Conde, S. Distinctive features of microsaccades in Alzheimer’s disease and in mild cognitive impairment. Age 2014, 36, 535–543. [Google Scholar] [CrossRef] [Green Version]
- Sommer, M.A.; Wurtz, R.H. What the brain stem tells the frontal cortex. I. Oculomotor signals sent from superior colliculus to frontal eye field via mediodorsal thalamus. J. Neurophysiol. 2004, 91, 1381–1402. [Google Scholar] [CrossRef] [PubMed]


| Bar Displacement | Frequency | ||||||||||
|---|---|---|---|---|---|---|---|---|---|---|---|
| 0.2 Hz | 0.3 Hz | 1 Hz | 2 Hz | 3 Hz | |||||||
| RE | LE | RE | LE | RE | LE | RE | LE | RE | LE | ||
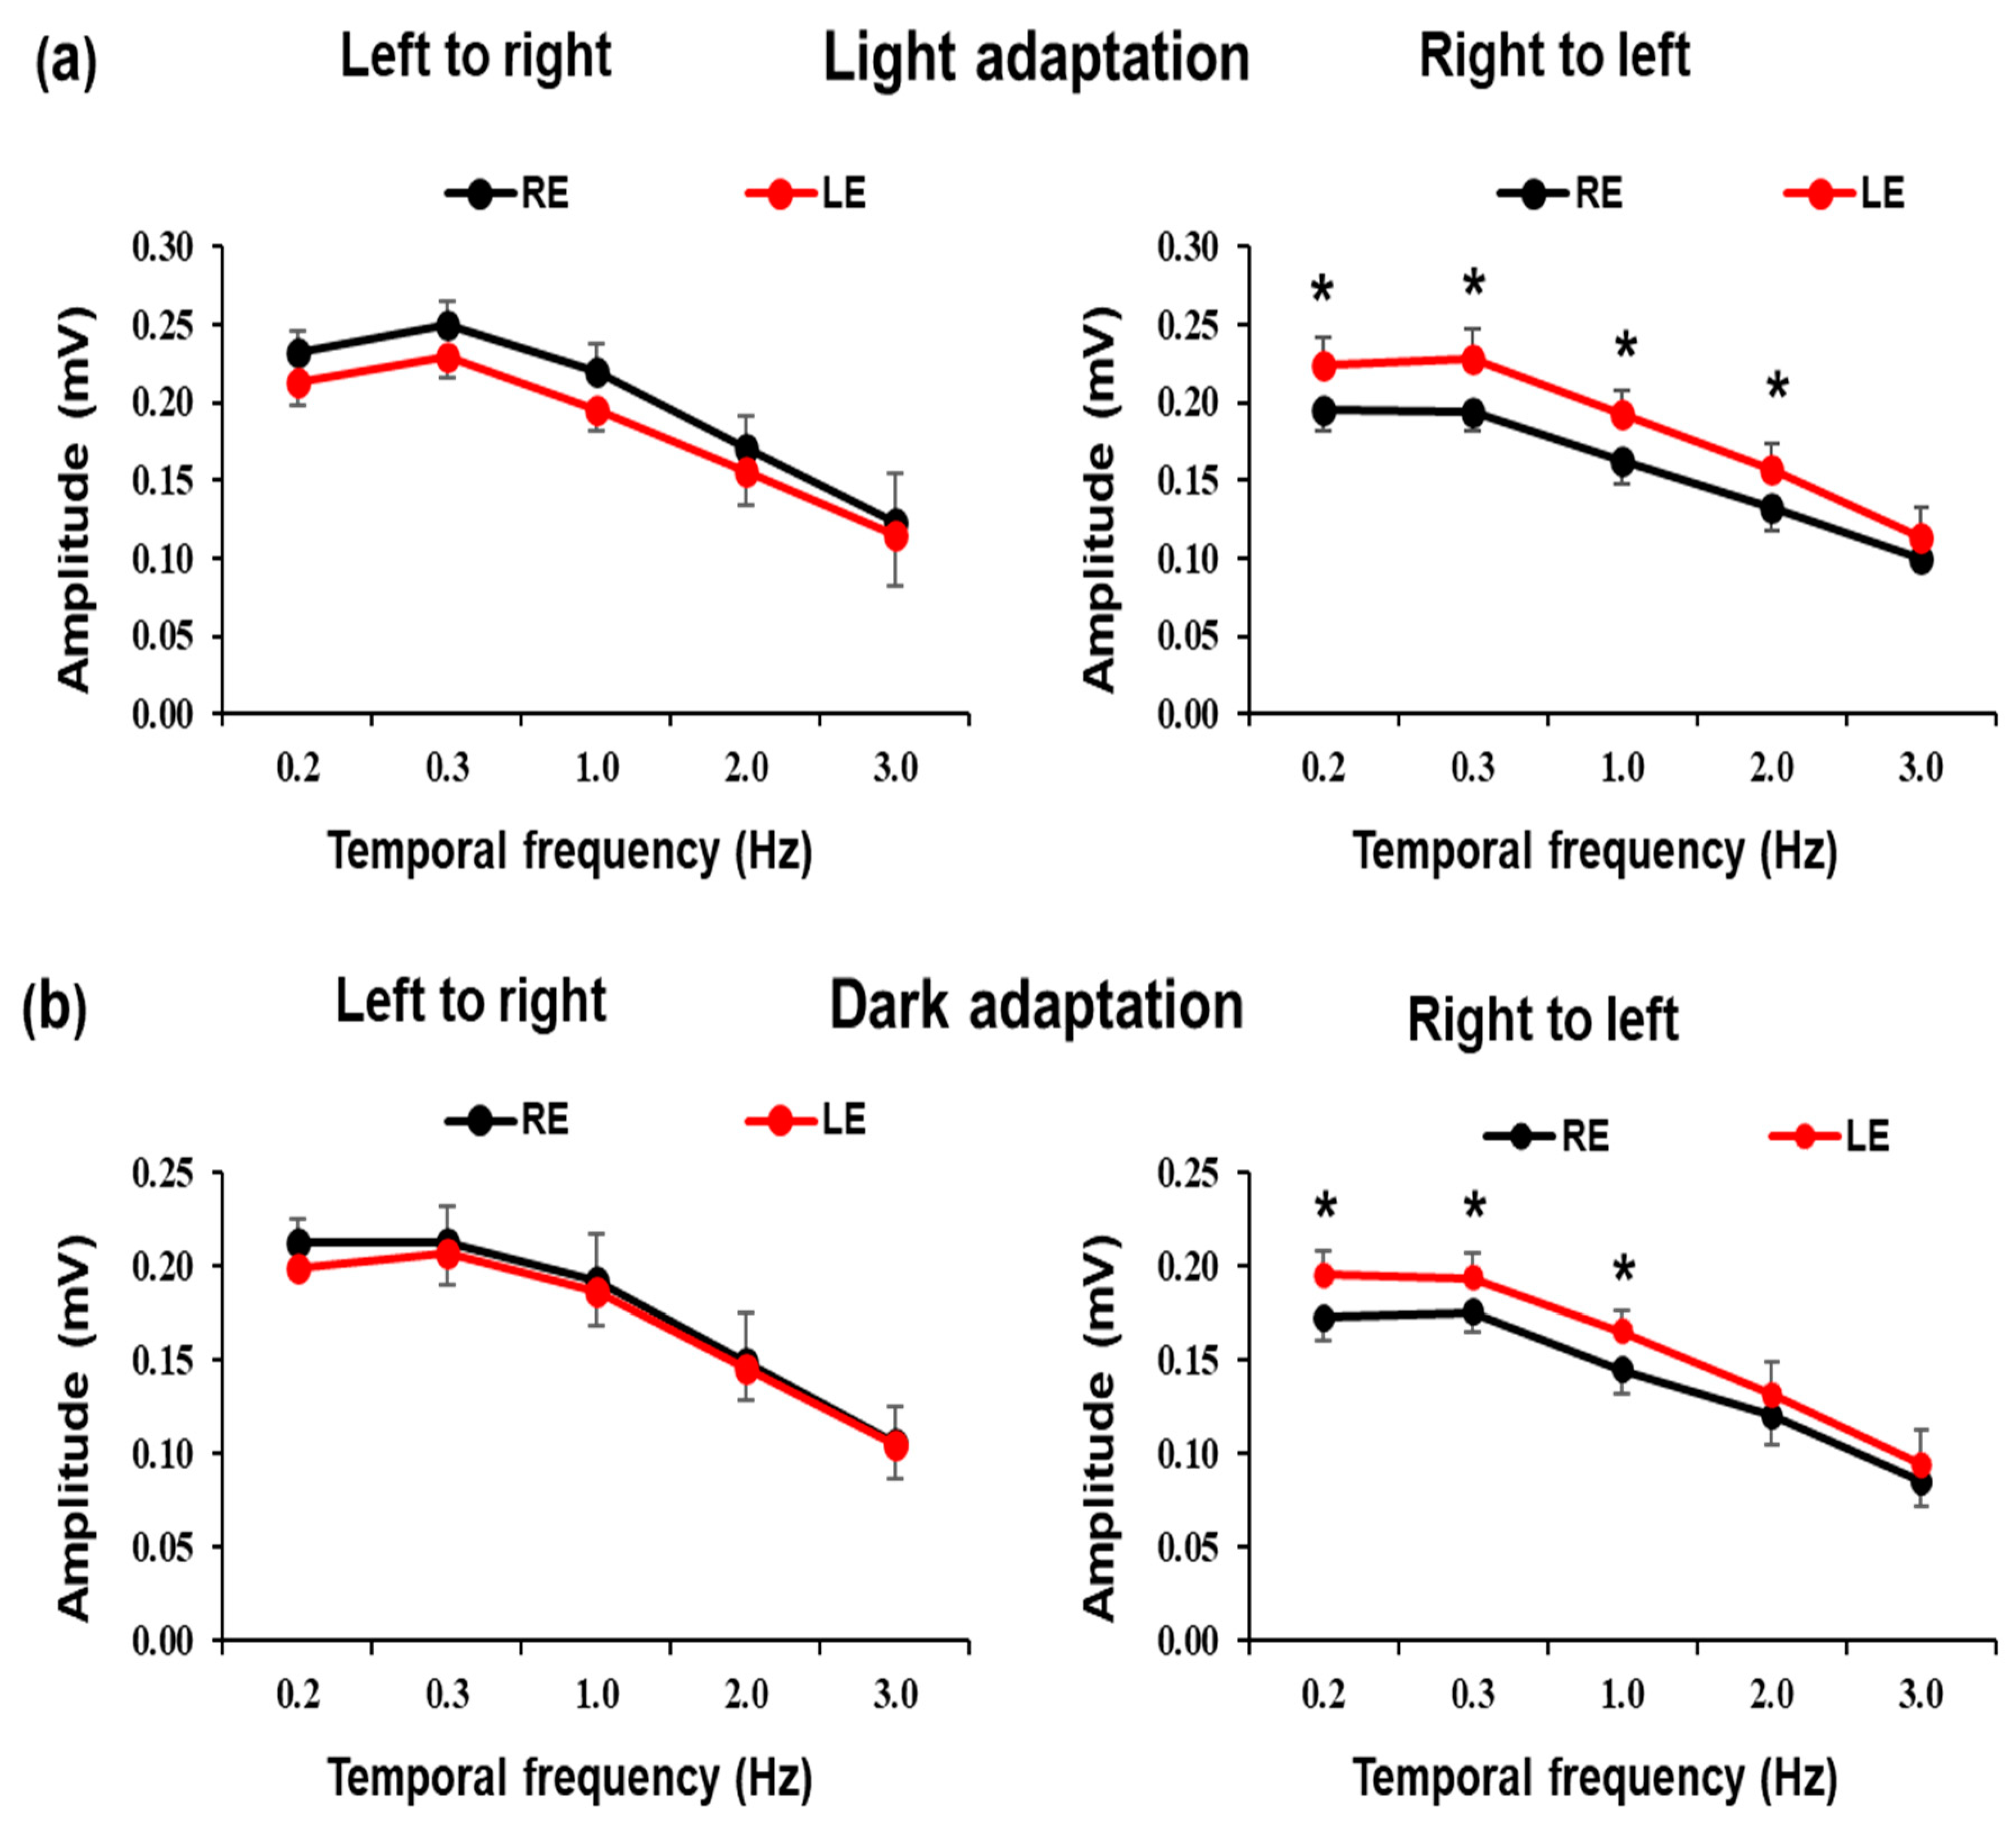
| Light Adaptation | Right to Left | 0.195 ± 0.013 | 0.224 ± 0.018 | 0.194 ± 0.012 | 0.228 ± 0.019 | 0.162 ± 0.015 | 0.192 ± 0.016 | 0.132 ± 0.020 | 0.157 ± 0.019 | 0.100 ± 0.008 | 0.114 ± 0.018 |
| Left to Right | 0.232 ± 0.015 | 0.213 ± 0.015 | 0.249 ± 0.015 | 0.224 ± 0.013 | 0.220 ± 0.018 | 0.196 ± 0.015 | 0.171 ± 0.020 | 0.156 ± 0.023 | 0.123 ± 0.031 | 0.114 ± 0.032 | |
| Up to Down | 0.287 ± 0.020 | 0.290 ± 0.024 | 0.281 ± 0.020 | 0.281 ± 0.024 | 0.232 ± 0.016 | 0.236 ± 0.018 | 0.186 ± 0.017 | 0.184 ± 0.016 | 0.149 ± 0.023 | 0.139 ± 0.016 | |
| Down to Up | 0.256 ± 0.027 | 0.275 ± 0.030 | 0.257 ± 0.030 | 0.269 ± 0.030 | 0.244 ± 0.030 | 0.235 ± 0.028 | 0.201 ± 0.033 | 0.196 ± 0.031 | 0.159 ± 0.028 | 0.160 ± 0.032 | |
| Clockwise | 0.112 ± 0.007 | 0.120 ± 0.008 | 0.133 ± 0.011 | 0.147 ± 0.017 | 0.100 ± 0.013 | 0.100 ± 0.016 | 0.059 ± 0.012 | 0.063 ± 0.011 | |||
| Counter-clockwise | 0.108 ± 0.009 | 0.114 ± 0.011 | 0.129 ± 0.009 | 0.135 ± 0.011 | 0.090 ± 0.010 | 0.096 ± 0.012 | 0.050 ± 0.010 | 0.046 ± 0.006 | |||
| Dark Adaptation | Right to Left | 0.173 ± 0.015 | 0.196 ± 0.019 | 0.181 ± 0.017 | 0.194 ± 0.020 | 0.145 ± 0.018 | 0.161 ± 0.019 | 0.121 ± 0.015 | 0.132 ± 0.018 | 0.086 ± 0.014 | 0.094 ± 0.019 |
| Left to Right | 0.213 ± 0.019 | 0.192 ± 0.026 | 0.214 ± 0.023 | 0.207 ± 0.025 | 0.192 ± 0.024 | 0.187 ± 0.031 | 0.150 ± 0.021 | 0.146 ± 0.030 | 0.106 ± 0.019 | 0.105 ± 0.021 | |
| Up to Down | 0.255 ± 0.027 | 0.251 ± 0.025 | 0.280 ± 0.026 | 0.274 ± 0.025 | 0.212 ± 0.022 | 0.203 ± 0.020 | 0.140 ± 0.020 | 0.137 ± 0.016 | 0.126 ± 0.026 | 0.113 ± 0.024 | |
| Down to Up | 0.232 ± 0.024 | 0.231 ± 0.027 | 0.245 ± 0.025 | 0.239 ± 0.028 | 0.207 ± 0.024 | 0.203 ± 0.028 | 0.145 ± 0.019 | 0.145 ± 0.016 | 0.087 ± 0.014 | 0.082 ± 0.021 | |
| Clockwise | 0.106 ± 0.009 | 0.116 ± 0.011 | 0.115 ± 0.009 | 0.128 ± 0.012 | 0.094 ± 0.010 | 0.086 ± 0.013 | 0.051 ± 0.005 | 0.052 ± 0.006 | |||
| Counter-clockwise | 0.120 ± 0.010 | 0.119 ± 0.011 | 0.123 ± 0.012 | 0.119 ± 0.013 | 0.087 ± 0.010 | 0.089 ± 0.010 | 0.044 ± 0.008 | 0.050 ± 0.007 | |||
| Bar Displacement | Frequency | ||||||
|---|---|---|---|---|---|---|---|
| 0.2 Hz | 0.3 Hz | 1 Hz | 2 Hz | 3 Hz | |||
| Light Adaptation | White bar on black background | Right to Left | 0.210 ± 0.012 | 0.211 ± 0.012 | 0.177 ± 0.011 | 0.145 ± 0.014 | 0.106 ± 0.009 |
| Left to Right | 0.222 ± 0.010 | 0.237 ± 0.010 | 0.208 ± 0.012 | 0.163 ± 0.015 | 0.118 ± 0.012 | ||
| Up to Down | 0.289 ± 0.015 | 0.281 ± 0.015 | 0.234 ± 0.012 | 0.185 ± 0.011 | 0.144 ± 0.013 | ||
| Down to Up | 0.265 ± 0.020 | 0.263 ± 0.021 | 0.240 ± 0.020 | 0.199 ± 0.022 | 0.159 ± 0.020 | ||
| Clockwise | 0.111 ± 0.007 | 0.132 ± 0.007 | 0.093 ± 0.008 | 0.048 ± 0.005 | |||
| Counterclockwise | 0.116 ± 0.005 | 0.140 ± 0.010 | 0.100 ± 0.010 | 0.061 ± 0.008 | |||
| Dark Adaptation | Gray bar on black background | Right to Left | 0.184 ± 0.012 | 0.188 ± 0.013 | 0.153 ± 0.013 | 0.126 ± 0.011 | 0.090 ± 0.012 |
| Left to Right | 0.202 ± 0.016 | 0.211 ± 0.017 | 0.189 ± 0.019 | 0.148 ± 0.018 | 0.105 ± 0.014 | ||
| Up to Down | 0.253 ± 0.018 | 0.277 ± 0.018 | 0.207 ± 0.014 | 0.139 ± 0.012 | 0.119 ± 0.017 | ||
| Down to Up | 0.232 ± 0.017 | 0.242 ± 0.018 | 0.205 ± 0.018 | 0.145 ± 0.012 | 0.085 ± 0.012 | ||
| Clockwise | 0.120 ± 0.007 | 0.121 ± 0.008 | 0.088 ± 0.007 | 0.047 ± 0.005 | |||
| Counterclockwise | 0.111 ± 0.007 | 0.122 ± 0.007 | 0.090 ± 0.008 | 0.051 ± 0.004 | |||
Publisher’s Note: MDPI stays neutral with regard to jurisdictional claims in published maps and institutional affiliations. |
© 2021 by the authors. Licensee MDPI, Basel, Switzerland. This article is an open access article distributed under the terms and conditions of the Creative Commons Attribution (CC BY) license (https://creativecommons.org/licenses/by/4.0/).
Share and Cite
Liu, H.; Liao, F.; de la Villa, P. Ocular Asymmetry in Electrooculographic Responses. Symmetry 2021, 13, 1809. https://doi.org/10.3390/sym13101809
Liu H, Liao F, de la Villa P. Ocular Asymmetry in Electrooculographic Responses. Symmetry. 2021; 13(10):1809. https://doi.org/10.3390/sym13101809
Chicago/Turabian StyleLiu, Haitao, Fei Liao, and Pedro de la Villa. 2021. "Ocular Asymmetry in Electrooculographic Responses" Symmetry 13, no. 10: 1809. https://doi.org/10.3390/sym13101809
APA StyleLiu, H., Liao, F., & de la Villa, P. (2021). Ocular Asymmetry in Electrooculographic Responses. Symmetry, 13(10), 1809. https://doi.org/10.3390/sym13101809