Abstract
In order to adapt to the rapid development of network technology and network security detection in different scenarios, the generalization ability of the classifier needs to be further improved and has the ability to detect unknown attacks. However, the generalization ability of a single classifier is limited to dealing with class imbalance, and the previous ensemble methods inevitably increase the training cost. Therefore, in this paper, a novel network intrusion detection algorithm combined with group convolution is proposed to improve the generalization performance of the model. The basic classifier uses group convolution with symmetric structure instead of ordinary convolution neural network, which is trained by the cyclic cosine annealing learning rate. Through snapshot ensemble, the generalization ability of the integration model is improved without increasing the training cost. The effectiveness of this method is proved on NSL-KDD and UNSW-NB15 datasets compared to six other ensemble methods, the classification accuracy can achieve 85.82% and 80.38%, respectively.
1. Introduction
In recent years, with the rapid development of science and technology, communication, big data, cloud computing and other devices, network technology provides convenience in people’s livelihood, economy, politics and many other aspects of popularization. However, countless network devices, applications and explosive growth of network information bring huge hidden dangers to network security. In the face of massive Internet data and constantly evolving network attacks, traditional network security technology has been unable to effectively deal with the current severe network security situation. Therefore, studying the intrusion detection technology with active defense function is vital.
Intrusion detection system (IDS) is a network in a security management system used to detect network intrusions. It is an indispensable part of a network security system [1], and greatly compensates for the shortcomings of traditional network security maintenance methods [2]. In order to adapt to the rapid development of network technology and network security detection in different scenarios, the generalization ability of the classifier needs to be further improved, particularly in detecting unknown attacks. However, the generalization ability of a single classifier is limited, and the previous ensemble methods have inevitably increased the training cost. Therefore, we will explore a snapshot ensemble method to improve the generalization performance of the model without increasing the training costs. The basic classifier uses group convolution instead of ordinary convolution. Through a snapshot ensemble, the generalization ability of the ensemble model was improved without increased training costs. The effectiveness of this method has been proved by several experiments.
2. Related Work
Intrusion detection mechanisms, based on deep learning, have continued to develop malicious network attack behaviors, which can be effectively detected and captured, further ensuring network security [3,4]. In 2014, Gao et al. established a deep neural network classifier by combining back propagation network and deep confidence network, and proved the effectiveness of this method by using KDD99 data set [5]. In 2016, Kim used a long-term and short-term memory network to establish a network intrusion detection model [6]. Since then, the use of a sequential network to complete intrusion detection has attracted the attention of researchers. In 2018, Xu constructed a deep network model with an automatic feature extraction by using gated loop unit, multi-layer perceptron and softmax module [7]. In 2018, Wu et al. transformed the vector format of the original data into a data format, and set the weight coefficient of the cost function according to the number of categories, which can improve the impact of data imbalance on classification by using lower calculation cost [8]. In 2019, Zhang combined convolutional neural networks (CNN) with multi-granularity cascaded forest, and proposed a multi-layer representation learning model for end-to-end network intrusion detection. The model can accurately classify unbalanced data and small-scale data with fewer super parameters [9].
However, the generalization ability of a single classifier is insufficient. As a result, these algorithms have low accuracy in detecting some network intrusion behaviors. Ensemble learning can effectively improve the generalization ability of the model, as well as the final classification accuracy through the integration of multiple models [10,11]. As an effective deep learning model, ensemble learning has also achieved remarkable results in the field of network intrusion detection [12]. Tan Aiping used SVM as the base classifier and AdaBoost ensemble method for iterative training, and obtained a highly adaptable network intrusion detection model [13]. Tao used Bagging method to integrate spectrum clustering algorithms and deep neural networks, which can effectively detect intrusions in large networks [14]. Huang Jinchao used the gradient boosting decision tree and logistic regression algorithm ensemble, and greatly simplified the parameter tuning process of the model [15]. GAO used a decision tree, random forest, K-nearest neighbors and DNN as the base classifiers to design an adaptive ensemble model, which used a majority voting strategy to obtain the final classification result [16]. Liu Jinping used Bagging to ensemble the kernel extreme learning machine, and obtained an integrated classifier with strong generalization ability and high efficiency [17]. In this process, the base classifier is selected by the marginal minimization criterion to ensure the integration effect. Ding Longbin constructed a random forest layer to analyze the hidden layer structure of CNN and the Bagging integration strategy of ensemble learning. He trained the randomly selected features in each layer to establish an ensemble deep forest network [18]. The model has some calculation involved and a fast convergence speed, but it is difficult to find the optimal number of forest nodes, and this issue can lead to unstable model performance.
3. Proposed Method
The overall framework of the intrusion detection method, based on group convolution network snapshot ensemble (GCNSE), which is proposed in this paper, is shown in Figure 1. The method mainly consists of two parts: Group convolutional network model and the snapshot ensemble model. First, the preprocessed data is sent to the group convolutional network model. Then, multiple snapshot models are obtained by training the group convolutional network. These models are used as base classifiers, and the final classification results are obtained through ensemble. The implementation process of this method is as follows:
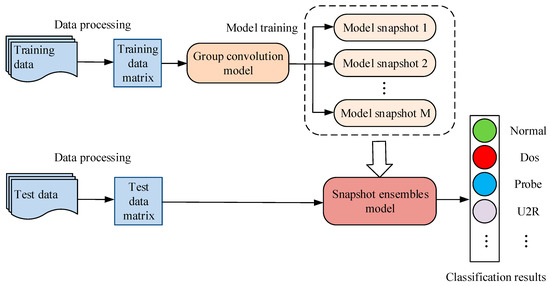
Figure 1.
The overall framework of group convolution snapshot ensemble method.
- The data must be preprocessed first. The data preprocessing includes digitization, normalization and conversion of numerical matrix [19]. Input the numerical matrix into the group convolution network model.
- Group convolution is used instead of normal convolution, and the base classifier is constructed by means of multi-channel fusion. This paper uses the cosine annealing learning rate to train the model to periodically reach multiple local optimal points of the model, and save these models.
- Use the method of averaging to ensemble the saved models to obtain the classification results. The parameters of each model are the best local parameters during training, and they all have a high classification accuracy rate.
- The preprocessed test data is input into the snapshot ensemble model, and the classification result of the test data is obtained through the ensemble model.
3.1. Group Convolution
Generally, increasing the number of feature maps can improve the performance of the model, but a larger parameter scale will cause the model to overfit, and part of the convolution kernel is redundant. Group Convolution first appeared in AlexNet, the purpose is to segment the network, so that it can run on two GPUs at the same time, in order to solve the problem of insufficient video memory and further optimize in the ResNeXt network [20]. The same convolution operation, group convolution requires fewer parameters than ordinary convolution, and it is not easy to overfit [21]. Therefore, this paper introduces group convolution instead of normal convolution. The difference between normal convolution and group convolution is shown in Figure 2. The upper part is normal convolution, and the lower part is group convolution.
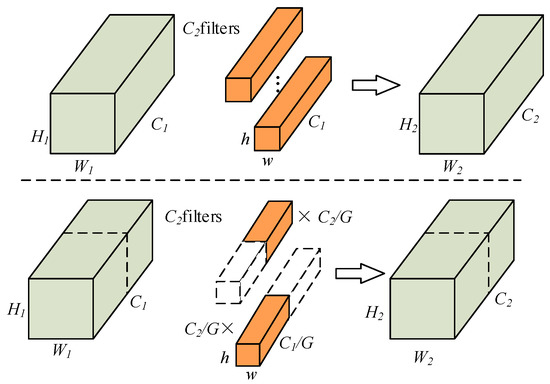
Figure 2.
Normal convolution and group convolution.
Group convolution needs to group the input data first, and then convolve each group of data separately. When performing group convolution, divide the input feature maps into group, then:
where is the input feature map divided into groups. Each group has feature maps of size . represents the convolution kernel of each group, the number is , and the size is . Then, all the output feature maps are combined by channel to get the final output of the convolutional layer .
If the input and output feature maps of the above grouped convolution are equal and symmetric, that is, , then the number of parameters are calculated as follows:
In the same situation, the parameter number of the ordinary convolution can be calculated by Formula (4):
By comparing and , it can be clearly seen that the parameter amount of the grouped convolution is 1/G of the standard convolution, and the degree of reduction of the parameter amount depends on the number of groups G. When G is larger, the parameter efficiency is higher and the complexity is lower.
3.2. Group Convolution Multi-Channel Fusion
Since each group in grouped convolution performs convolution operations independently, the input feature map grouping leads to incomplete input information, and the output feature map cannot contain all the information of the input feature map. This may result in a lack of information exchange between the output of each group [22]. In this paper, group convolution is used instead of normal convolution to reduce the redundant parameters, and the method of multi-channel fusion is used to strengthen the information exchange of feature maps between channels and enrich feature information.
In this article, the multi-channel fusion method is used to enrich the feature information of each stage, and increase the information exchange between the output feature maps of each layer in the network. Each convolution block in the network is merged in pairs, so that each convolution block in the network accepts the input after all the features in front of it are merged. The feature fusion of each module is realized through the connection operation on the feature channel.
As shown in Figure 3, the entire group convolutional network model structure consists of 3 group convolutional blocks, a global pooling layer, and a fully connected layer, and finally the final classification result is obtained through softmax. Therefore, after each convolution operation, batch normalization (BN) processing is performed, and the ReLU activation function is used for non-linear processing.
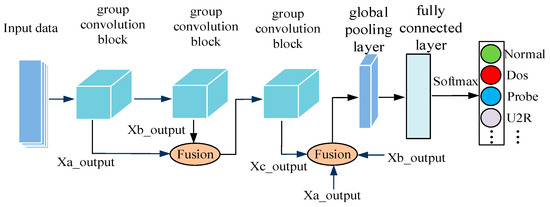
Figure 3.
Group convolution multi-channel fusion model.
The specific structure of the group convolution block is shown in Figure 4. First, a 1 × 1 convolution is used to reduce the channel dimension of the input feature map. The output feature map is calculated by a 3 × 3 group convolution, and feature fusion is performed through cross-layer connection to ensure that the dimensions of the input and output features are consistent. Finally, the convolution result of the group convolution block is obtained.
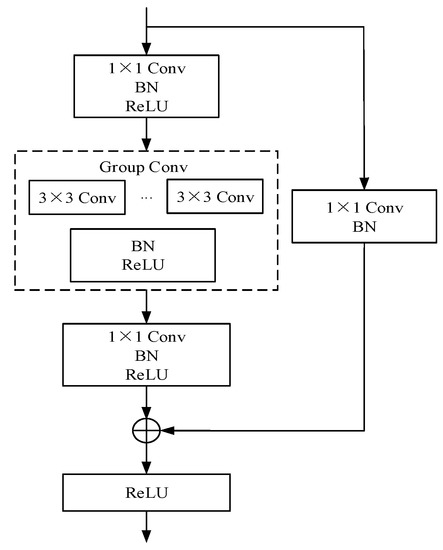
Figure 4.
Structure diagram of group convolution block.
In the convolution process, using a large number of small convolution kernels is more effective than using fewer large convolution kernels, and requires fewer parameters [23]. The 1 × 1 convolution kernel has the ability to cross-channel information integration, which makes the network expressive ability better, and can realize the dimension increase or reduction of the characteristic channel. From the perspective of feature maps, multi-scale problems are handled by combining multi-level feature maps, which not only combines the two major advantages of information flow and feature reuse. It reduces the amount of network parameters, but also alleviates gradient disappearance to a certain extent.
In this section, three different group convolution blocks are designed. The main difference between these three grouping blocks is the different output dimensions of the modules. The number of output feature maps of the three feature extraction modules is sequentially set to 32, 64 and 128. Using the global average pooling layer to replace the traditional connection layer can minimize model parameters and improve training speed on the basis of fusing global information.
3.3. Snapshot Ensemble
By using the ensemble learning method, a model with higher generalization ability than a single model can be obtained, thereby improving the classification performance of the model. Traditional ensemble methods generate significant training costs, while a snapshot ensemble can adjust the learning rate through cosine annealing without increasing training costs. This section studies the principle of snapshot ensemble, analyzes the change process of the cosine annealing learning rate, and the training and testing principles of the model.
3.3.1. Principles of Snapshot Ensemble
Snapshot Ensemble can generate a set of accurate and diverse models through a training process. The core of snapshot ensemble is an optimization process, which visits multiple local minima before converging to the final minimum. Saving the model parameters derived from these different local minima is equivalent to taking a snapshot of the model at these different local minima [24,25].
In the optimization process of snapshot ensemble, stochastic gradient descent (SGD) is used, and its calculation processing is shown in Formulas (5) and (6):
where represents the learning rate, and represents the gradient. Sometimes the trained network model will not converge to the global minimum, but for generalization ability, the relatively flat local minimum often has better generalization ability. When using SGD for optimization, if the learning rate is too high, the convergence speed is hindered which makes it oscillate near the extreme point. If the learning rate is low, the convergence speed will slow down, but it will often converge to the best local minimum. This radically different behavior of SGD can be exploited at different stages of optimization. At the beginning of the optimization, keep the learning rate at a high level, entering a relatively flat local minimum. Once the gradient is not updated further, the learning rate will drop, enter a lower learning rate level and finally converge to a local minimum.
The comparison between the snapshot ensemble optimization process and the traditional model optimization process is shown in Figure 5. The traditional model converges to the minimum at the end of the optimization. In the snapshot ensemble, the model converges to multiple local minima during the optimization process and escapes.
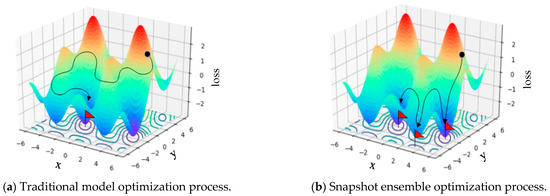
Figure 5.
Comparison of traditional model and snapshot ensemble optimization process.
3.3.2. Cyclic Cosine Annealing Learning Rate
Cyclic learning rate is one of the important methods for adjusting the learning rate. This method must set an upper limit and lower limit to the learning rate so that the value of the learning rate changes periodically between the upper limit and the lower limit. The cyclic learning rate can effectively train CNN, as the model generated in each cycle is more competitive than the model optimized by the traditional learning rate, and requires fewer training times. Therefore, the cyclic learning rate is a very efficient for model training.
In the process of model optimization, a relatively low learning rate can ensure the loss function value of the model is closer to the local minimum, while a relatively large learning rate helps the loss function to jump out of the current local minimum or saddle point. In the cosine function, as the abscissa value increases, the change trend of the cosine value slowly decreases first, then accelerates to decrease, and finally decreases slowly. If this declining method is combined with the learning rate, the change trend of the learning rate can be effectively adjusted, thereby producing good results.
Therefore, in the process of a snapshot ensemble, this paper uses the cyclic cosine annealing learning rate. At the beginning of model training, the learning rate is reduced according to the changing trend of the cosine function, so that the model converges to the first local minimum after the 50th epoch of training. Then, the learning rate is adjusted to the initial value, and the optimization continues with a larger learning rate, thereby perturbing the model and making it jump out of the local minimum point. This process is repeated many times to obtain multiple convergent local minimum points. The learning rate calculation formula is as follows:
where represents the number of iterations, represents the total number of training, and represents a monotonically decreasing function. The entire training process is divided into cycles, each cycle starts with the same initial learning rate, and then it is annealed to a smaller learning rate in one cycle. The initial learning rate is , which can make the model jump out of the current local minimum point. The smaller learning rate, , optimizes the model to another local minimum point. Figure 6 depicts the change rule of the cosine annealing learning rate when the initial learning rate is , the total number of training times is and the period is .
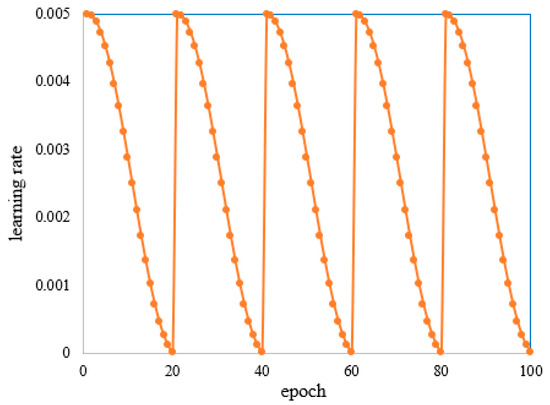
Figure 6.
The changing process of cyclic cosine learning rate.
In this paper, is set as a shifted cosine function, and the adjustment calculation method of the learning rate is expressed as follows:
where is the initial learning rate. It can also be seen from the formula that this function anneals the learning rate from to from its initial value during a cycle.
3.3.3. Snapshot Integration Training and Testing
In the snapshot ensemble process, the cosine annealing learning rate is used to set a maximum initial learning rate to train the model. As training levels increase, the learning rate continues to decrease. At the end of a training period, the learning rate reaches a minimum, and the loss function value of the model also reaches a local minimum, that is, the model converges to a local optimum. Here, we explain this process. Prior to the next training cycle, a snapshot of the model is taken, the model parameters are saved, and then the learning rate is readjusted to the maximum initial learning rate. Then, optimizing and identifying the next local optimum is continued. After training for cycles, a total of snapshot models are obtained from to . In this process, the training times of snapshot models are the same as the times of training a network model in traditional methods, and there is no additional training cost. Therefore, using the snapshot ensemble method can save significant training costs, obtain a model with higher generalization ability and improve the accuracy of classification.
In the testing phase, the prediction result of the model is the average of the softmax output of the last m snapshot models. Let be a test sample and the output value of the softmax of the snapshot model, the output result of the snapshot integration is the average of the last m snapshot models, and the expression is shown as Formula (9):
4. Experimental Results and Analysis
In the comparative experiments of this paper, the four classic models of the decision tree, Naive Bayesian (NB) and CNN are used as base classifiers, and they are integrated through the two commonly used ensemble methods of Bagging and Boosting, and a total of six methods are set. These six methods are compared with the method in this paper to prove the effectiveness of the proposed method in this paper. Experiments used the TensorFlow under Windows10 operating system as the backend, encoded with Keras2.2 and Python3.6. The experimental environment is i3-7100 U CPU processor, 12GB running memory (RAM), NVIDIA GeForce GTX 1060 GPU.
4.1. Processing of Experimental Datasets
As the input of the model is a numerical matrix, the one-hot coding method is used to map the data with symbolic features into digital feature vectors. For example, in the NSL-KDD dataset, protocol_ Type, service and flag, which contain 3, 70 and 11 symbol features respectively. The three attributes of the protocol type, TCP, UDP and ICMP are coded as binary vectors (1,0,0), (0,1,0), and (0,0,1), respectively.
In the continuous attribute type feature, the value range of data varies greatly. In order to facilitate the algorithm processing and eliminate the dimension difference, the logarithmic data adopt the normalization method to map the value range of each feature uniformly and linearly in the [0,1] interval. The normalized calculation formula is:
where represents the maximum value of the feature attribute and represents the minimum value of the feature attribute.
In order to make the data meet the input format requirements of CNN, it is necessary to convert the original one-dimensional data into a two-dimensional matrix form. The data in the data set are read one-by-one and the normalized data are converted into a matrix format. For example, 121 eigenvectors are adjusted to 11 × 11 numerical matrix in NSL-KDD dataset.
4.2. Analysis of Experimental Results on NSL-KDD
In the classification problem, most methods aim to improve the overall accuracy of the classifier and strive to maximize the accuracy of model classification. The classification results are often inclined to most classes, which is easy to cause classification errors of a few classes, that is, when classifying unbalanced data, it will produce a high error rate for a few classes. In the NSL-KDD data set, as shown in Table 1, there are about 250,000 data records in the training set, of which the number of normal is about 1300 times that of R2L. The number of categories in the data set is seriously unbalanced. The number of normal, dos and probes is much higher than that of U2R and R2L. There is a serious imbalance in the distribution of data categories.

Table 1.
Distribution of NSL-KDD dataset.
During the experiment, the initial learning rate of the GCNSE model is set to 0.0001, with 50 epoch as a training cycle, and a total of 5 training cycles are set. On the NSL-KDD data set, seven different methods were used for experiments. The results of the four classification indicators of accuracy, precision, recall, and F1-Measure are shown in Table 2, and the results are compared in the form of a histogram, as shown in Figure 7.

Table 2.
Classification performance comparison by different methods on NSL-KDD.
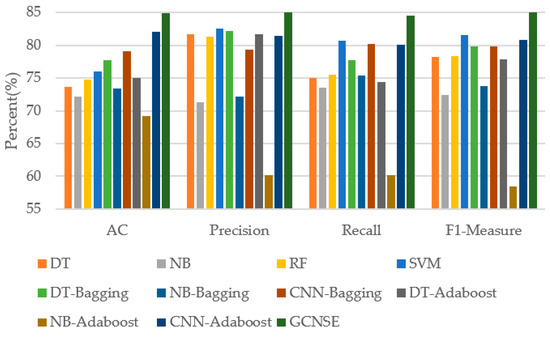
Figure 7.
Classification results comparison on NSL-KDD.
From Table 2, it can be seen that the overall classification effect of the GCNSE model proposed in this paper is the best. The accuracy, precision, recall and F1-Measure can reach 84.95%, 85.82%, 84.49%, 85.15%, respectively, on the NSL-KDD data set. Compared with the network model, which is based on CNN as the base classifier, the accuracy of this method is 5.85% higher than CNN-Bagging and 2.91% higher than CNN-Adaboost. On the F1-Measure index, the method in this paper is 5.28% and 4.39% higher than DT-Bagging and CNN-Adaboost, respectively.
Taking F1-Measure as the measurement index, statistics of the classification of each class by different methods, the experimental results are shown in Table 3. Figure 8 shows a comparison of the F1-Measure results of different methods.

Table 3.
F1-Measure for each class of different methods on NSL-KDD(%).
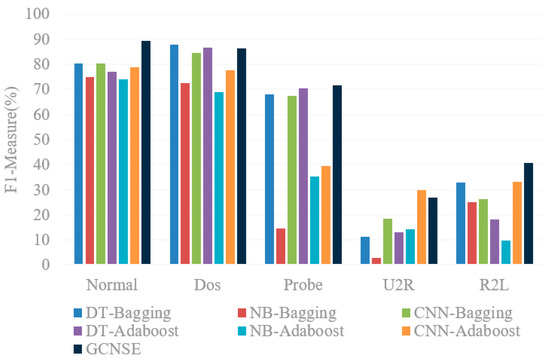
Figure 8.
Comparison of F1-Measure for each class on NSL-KDD.
It can be seen from the experimental results that in the same method, the classification results of each category are different. On the NSL-KDD data set, the F1-Measure of this method on Normal can reach 89.23%, followed by the DT-Bagging method with 80.44%, and the NB-Bagging method has the lowest result, and F1-Measure is 74.96%. In the F1-Measure index, the method in this paper is 8.79% higher than DT-Bagging and 14.27% higher than NB-Bagging. In the U2R category which is relatively difficult to classify, the method in this paper is also 15.77%, 24.04%, 8.52%, 14.02%, 12.62% higher than DT-Bagging, NB-Bagging, CNN-Bagging, DT-Adaboost, and NB-Adaboost, respectively.
At the same time, another group of experiments compare the running-time of the model. The proposed method, in this paper, is compared with CNN-Bagging and CNN-Adaboost deep models. All models are set to run 200 epoch and the statistical results are shown in Table 4. Compared with the other two methods, the running time of GCNSE is significantly shorter, 491.35s shorter than CNN-Adaboost and 3044.62s shorter than CNN-Bagging.

Table 4.
Running time comparison by different methods on NSL-KDD.
4.3. Analysis of Experimental Results on UNSW-NB15
The cyber security research team of Australian Centre for Cyber Security (ACCS) has introduced a new data called as UNSW-NB15 dataset. A partition of full connection records which is composed of 175,343 train connection records and 82,337 test connection records confined, including 9 attack categories and 1 normal category. The partitioned dataset consists of 42 features with their parallel class labels. The information regarding the simulated attacks category and its detailed statistics are described in Table 5.

Table 5.
Distribution of UNSW-NB15 dataset.
The experimental results are shown in Table 3 in comparison with other methods on UNSW-NB15. The accuracy rate of this method can reach 79.59%, the precision rate is 80.38% and the recall rate is 81.27%. In terms of accuracy, the method used in this paper is 9.7% higher than the NB-Bagging method and 5.4% higher than CNN-Adaboost. On the F1-Measure index, the method in this paper is 12.87% higher than CNN-Adaboost and 2.58% higher than CNN-Bagging. In terms of recall index, the method used in this paper is 10.18% higher than CNN-Adaboost and 6.61% higher than DT-Bagging. From the results of the four classification indicators, the method used in this paper has an accuracy rate slightly lower than DT-Bagging by 1.65%, and other indicators are improved compared to the comparison method. It can be seen that the proposed method effectively improves the overall performance of the model and obtains a better classification effect. The histogram representation is shown in Figure 9.
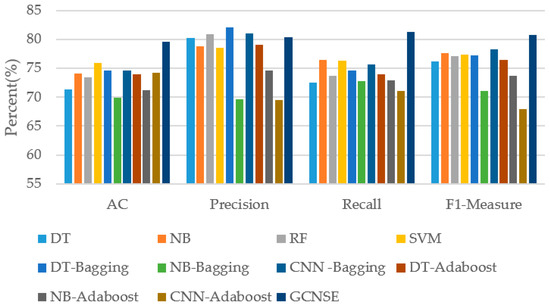
Figure 9.
Classification results comparison on UNSW-NB15.
Table 6 counts the F1-Measure of different categories of UNSW-NB15, and Figure 10 compares the results in the form of a histogram. It can be seen from the results that the method used in this paper leads to better results than other methods in 9 out of 10 different categories on the F1-Measure indicator. In the Generic category, F1-Measure can reach 98.83%, which is slightly lower than CNN-Adaboost by 0.02%. However, in other categories, the F1-Measure of this method is better than CNN-Adaboost. In particular, in the classification of Backdoor, Shellcode and Exploits, the proposed method is 7.78%, 19.42% and 7.32% higher than CNN-Adaboost, respectively.

Table 6.
Classification performance comparison by different methods on UNSW-NB15.
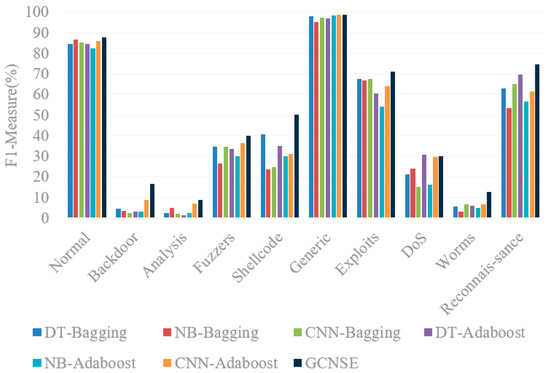
Figure 10.
Comparison of F1-Measure for each class on UNSW-NB15.
In the classification results of Worms, the F1-Measure of other methods are all lower than 10%, while the F1-Measure of this method reaches 12.76%. The method proposed in this paper is 7.19%, 9.59%, 5.91%, 6.92%, 7.81% and 5.92% higher than DT-Bagging, NB-Bagging, CNN-Bagging, DT-Adaboost, NB-Adaboost and CNN-Adaboost, respectively. In Backdoor, Analysis, Fuzzers, Reconnaissance and other categories, the classification results of this method are also higher than other methods, showing advantages in the classification results of each category.
Table 7 counts the F1-Measure of different categories of UNSW-NB15, and Figure 10 compares the results in the form of a histogram. It can be seen from the results that the method in this paper has better results than other methods in 9 out of 10 different categories on the F1-Measure indicator. In the Generic category, F1-Measure can reach 98.83%, which is slightly lower than CNN-Adaboost by 0.02%. However, in other categories, the F1-Measure of this method is better than CNN-Adaboost. In particular, in the classification of Backdoor, Shellcode, and Exploits, the proposed method is 7.78%, 19.42% and 7.32% higher than CNN-Adaboost, respectively.

Table 7.
F1-Measure for each class of different methods on UNSW-NB15(%).
On UNSW-NB15 dataset, CNN-Bagging, CNN-Adaboost and GCNSE models are set to run 200 epoch. The statistical experimental results are shown in Table 8. The running-time of the proposed method model is 10750.54s, and AC is 79.03%. Compared with CNN-Bagging and CNN-Adaboost, the running-time is shortened by 25.68% and 13.85%, respectively, and the accuracy is improved by 5.08% and 5.02%, respectively.

Table 8.
Running time comparison by different methods on NSL-KDD.
To compare the results of the two data sets, the efficiency rate is higher using the KDD99 dataset than the UNSW-NB15 dataset. In UNSW-NB15 dataset, the features of the training and the testing sets highly correlate, and the training and the testing sets have the same distribution, which is non-linear and non-normal. As a result, the two perspectives demonstrate the major reasons of the complexity of the UNSWNB15 dataset compared to the KDD99 dataset, which means UNSWNB15 dataset can be used to evaluate the existing and the novel methods of network intrusion detection in a reliable way.
5. Conclusions
This paper introduces the method of ensemble learning, using group convolution instead of normal convolution, and establishes a group convolution network model to establish a base classifier. The base classifier is trained using the cyclic cosine annealing learning rate, and multiple snapshot models are obtained. An ensemble model with high generalization ability is obtained through the ensemble. On the NSL-KDD data set, the accuracy rate is 2.91% higher than that of CNN-Adaboost; on the UNSWNB-15 data set, the accuracy rate is 5.4% higher than that of CNN-Adaboost, which proves that this method is better than other ensemble methods’ classification effect.
In the real network environment, all kinds of unpredictable emergencies are uncontrollable. Further research and solutions are needed to further enhance the stability of the network intrusion detection model in the real environment.
Author Contributions
Methodology, W.W.; software, W.W. and H.Z.; writing—original draft preparation, A.W.; writing—review and editing, J.Z. All authors have read and agreed to the published version of the manuscript.
Funding
This work was funded by the National Natural Science Foundation of China under Grant NSFC-61671190.
Institutional Review Board Statement
Not applicable.
Informed Consent Statement
Not applicable.
Data Availability Statement
The data are available at: GitHub-vinayakumarr/Network-Intrusion-Detection: Network Intrusion Detection KDDCup ‘99’, NSL-KDD and UNSW-NB15.
Acknowledgments
We thank Kaiyuan Jiang and Haibin Wu for their valuable comments.
Conflicts of Interest
The authors declare no conflict of interest.
References
- Sharma, S.; Gupta, R.K. Intrusion Detection System: A Review. Int. J. Softw. Eng. Its Appl. 2015, 9, 69–76. [Google Scholar] [CrossRef][Green Version]
- He, M.; Qin, R.; Liu, J. Network Intrusion Detection Model Based on Adam-BNDNN. Comput. Meas. Control 2020, 257, 63–67. [Google Scholar]
- Shone, N.; Ngoc, T.N.; Phai, V.D.; Shi, Q. A Deep Learning Approach to Network Intrusion Detection. IEEE Trans. Emerg. Top. Comput. Intell. 2018, 2, 41–50. [Google Scholar] [CrossRef]
- Tang, C.; Luktarhan, N.; Zhao, Y. An Efficient Intrusion Detection Method Based on LightGBM and Autoencoder. Symmetry 2020, 12, 1458. [Google Scholar] [CrossRef]
- Gao, N.; Gao, L.; Gao, Q.; Wang, H. An intrusion detection model based on deep belief networks. In Proceedings of the 2014 Second International Conference on Advanced Cloud and Big Data, Huangshan, China, 20–22 November 2014; pp. 247–252. [Google Scholar]
- Kim, J.; Kim, J.; Thu, H.L.; Kim, H. Long short-term memory recurrent neural network classifier for intrusion detection. In Proceedings of the 2016 International Conference on Platform Technology and Service (PlatCon), Jeju, Korea, 15–17 February 2016; Volume 3, pp. 1–5. [Google Scholar]
- Xu, C.; Shen, J.; Du, X.; Zhang, F. An intrusion detection system using a deep neural network with gated recurrent units. IEEE Access 2018, 6, 48697–48707. [Google Scholar] [CrossRef]
- Wu, K.; Chen, Z.; Li, W. A novel intrusion detection model for a massive network using convolutional neural networks. IEEE Access 2018, 6, 50850–50859. [Google Scholar] [CrossRef]
- Zhang, X.; Chen, J.; Zhou, Y. A multiple-layer representation learning model for network-based attack detection. IEEE Access 2019, 7, 91992–92008. [Google Scholar] [CrossRef]
- Wu, Z.; Lin, W.; Ji, Y. An Integrated Ensemble Learning Model for Imbalanced Fault Diagnostics and Prognostics. IEEE Access 2018, 6, 8394–8402. [Google Scholar] [CrossRef]
- Gu, J.; Wang, L.; Wang, H.; Wang, S. A novel approach to intrusion detection using SVM ensemble with feature augmentation. Comput. Secur. 2019, 86, 53–62. [Google Scholar] [CrossRef]
- Rajadurai, H.; Gandhi, U.D. A stacked ensemble learning model for intrusion detection in wireless network. Neural Comput. Appl. 2020, 1–9. [Google Scholar] [CrossRef]
- Tan, A.; Chen, H.; Wu, B. Network Intrusion Detection Algorithm Based on SVM Ensemble Learning. Comput. Sci. 2014, 41, 197–200. [Google Scholar]
- Ma, T.; Wang, F.; Cheng, J.; Yu, Y.; Chen, X. A hybrid spectral clustering and deep neural network ensemble algorithm for intrusion detection in sensor networks. Sensors 2016, 16, 1701. [Google Scholar] [CrossRef] [PubMed]
- Huang, J.; Ma, Y. An Intrusion Detection Algorithm Based on Ensemble Learning. J. Shanghai Jiaotong Univ. 2018, 52, 1382–1387. [Google Scholar]
- Gao, X.; Shan, C.; Hu, C.; Niu, Z.; Liu, Z. An adaptive ensemble machine learning model for intrusion detection. IEEE Access 2019, 7, 82512–82521. [Google Scholar] [CrossRef]
- Liu, J.; He, J.; Ma, T. Intrusion detection in complex network environment based on selective integration of KELM. Electron. J. 2019, 47, 1070–1078. [Google Scholar]
- Ding, L.; Wu, Z.; Su, J. Intrusion detection method based on Ensemble deep forest. Comput. Eng. 2020, 46, 144–150. [Google Scholar]
- Jiang, K.; Wang, W.; Wang, A.; Wu, H. Network Intrusion Detection Combined Hybrid Sampling With Deep Hierarchical Network. IEEE Access 2020, 8, 32464–32476. [Google Scholar] [CrossRef]
- Qin, B.; Gu, N.; Zhang, X. Image verification code recognition based on convolutional neural network. Comput. Syst. Appl. 2018, 27, 144–150. [Google Scholar]
- Yan, X.; Huang, S. Lightweight target detection network based on grouped heterogeneous convolution. Comput. Sci. 2020, 47, 114–117. [Google Scholar]
- Zhang, X.; Zhou, X.; Lin, M.; Sun, J. ShuffleNet: An extremely efficient convolutional neural network for mobile devices. In Proceedings of the IEEE conference on computer vision and pattern recognition, Salt Lake City, UT, USA, 18–22 June 2018; pp. 6848–6856. [Google Scholar]
- Szegedy, C.; Vanhoucke, V.; Ioffe, S. Rethinking the inception architecture for computer vision. In Proceedings of the IEEE conference on computer vision and pattern recognition, Las Vegas, NV, USA, 26 June–1 July 2016; pp. 2818–2826. [Google Scholar]
- Zhang, W.; Jiang, J.; Shao, Y.; Cui, B. Snapshot boosting: A fast ensemble framework for deep neural networks. Sci. China Inf. Sci. 2020, 63, 77–88. [Google Scholar] [CrossRef]
- Chang, D.; Li, X.; Xie, J.; Ma, Z.; Guo, J.; Cao, J. SSE: A New Selective Initialization Strategy for Snapshot Ensembling. In Proceedings of the 2018 5th IEEE International Conference on Cloud Computing and Intelligence Systems, Nanjing, China, 23–25 November 2018; pp. 23–25. [Google Scholar]
Publisher’s Note: MDPI stays neutral with regard to jurisdictional claims in published maps and institutional affiliations. |
© 2021 by the authors. Licensee MDPI, Basel, Switzerland. This article is an open access article distributed under the terms and conditions of the Creative Commons Attribution (CC BY) license (https://creativecommons.org/licenses/by/4.0/).