Symmetric Nature of Stress Distribution in the Elastic-Plastic Range of Pinus L. Pine Wood Samples Determined Experimentally and Using the Finite Element Method (FEM)


Abstract
1. Introduction
2. Materials and Methods
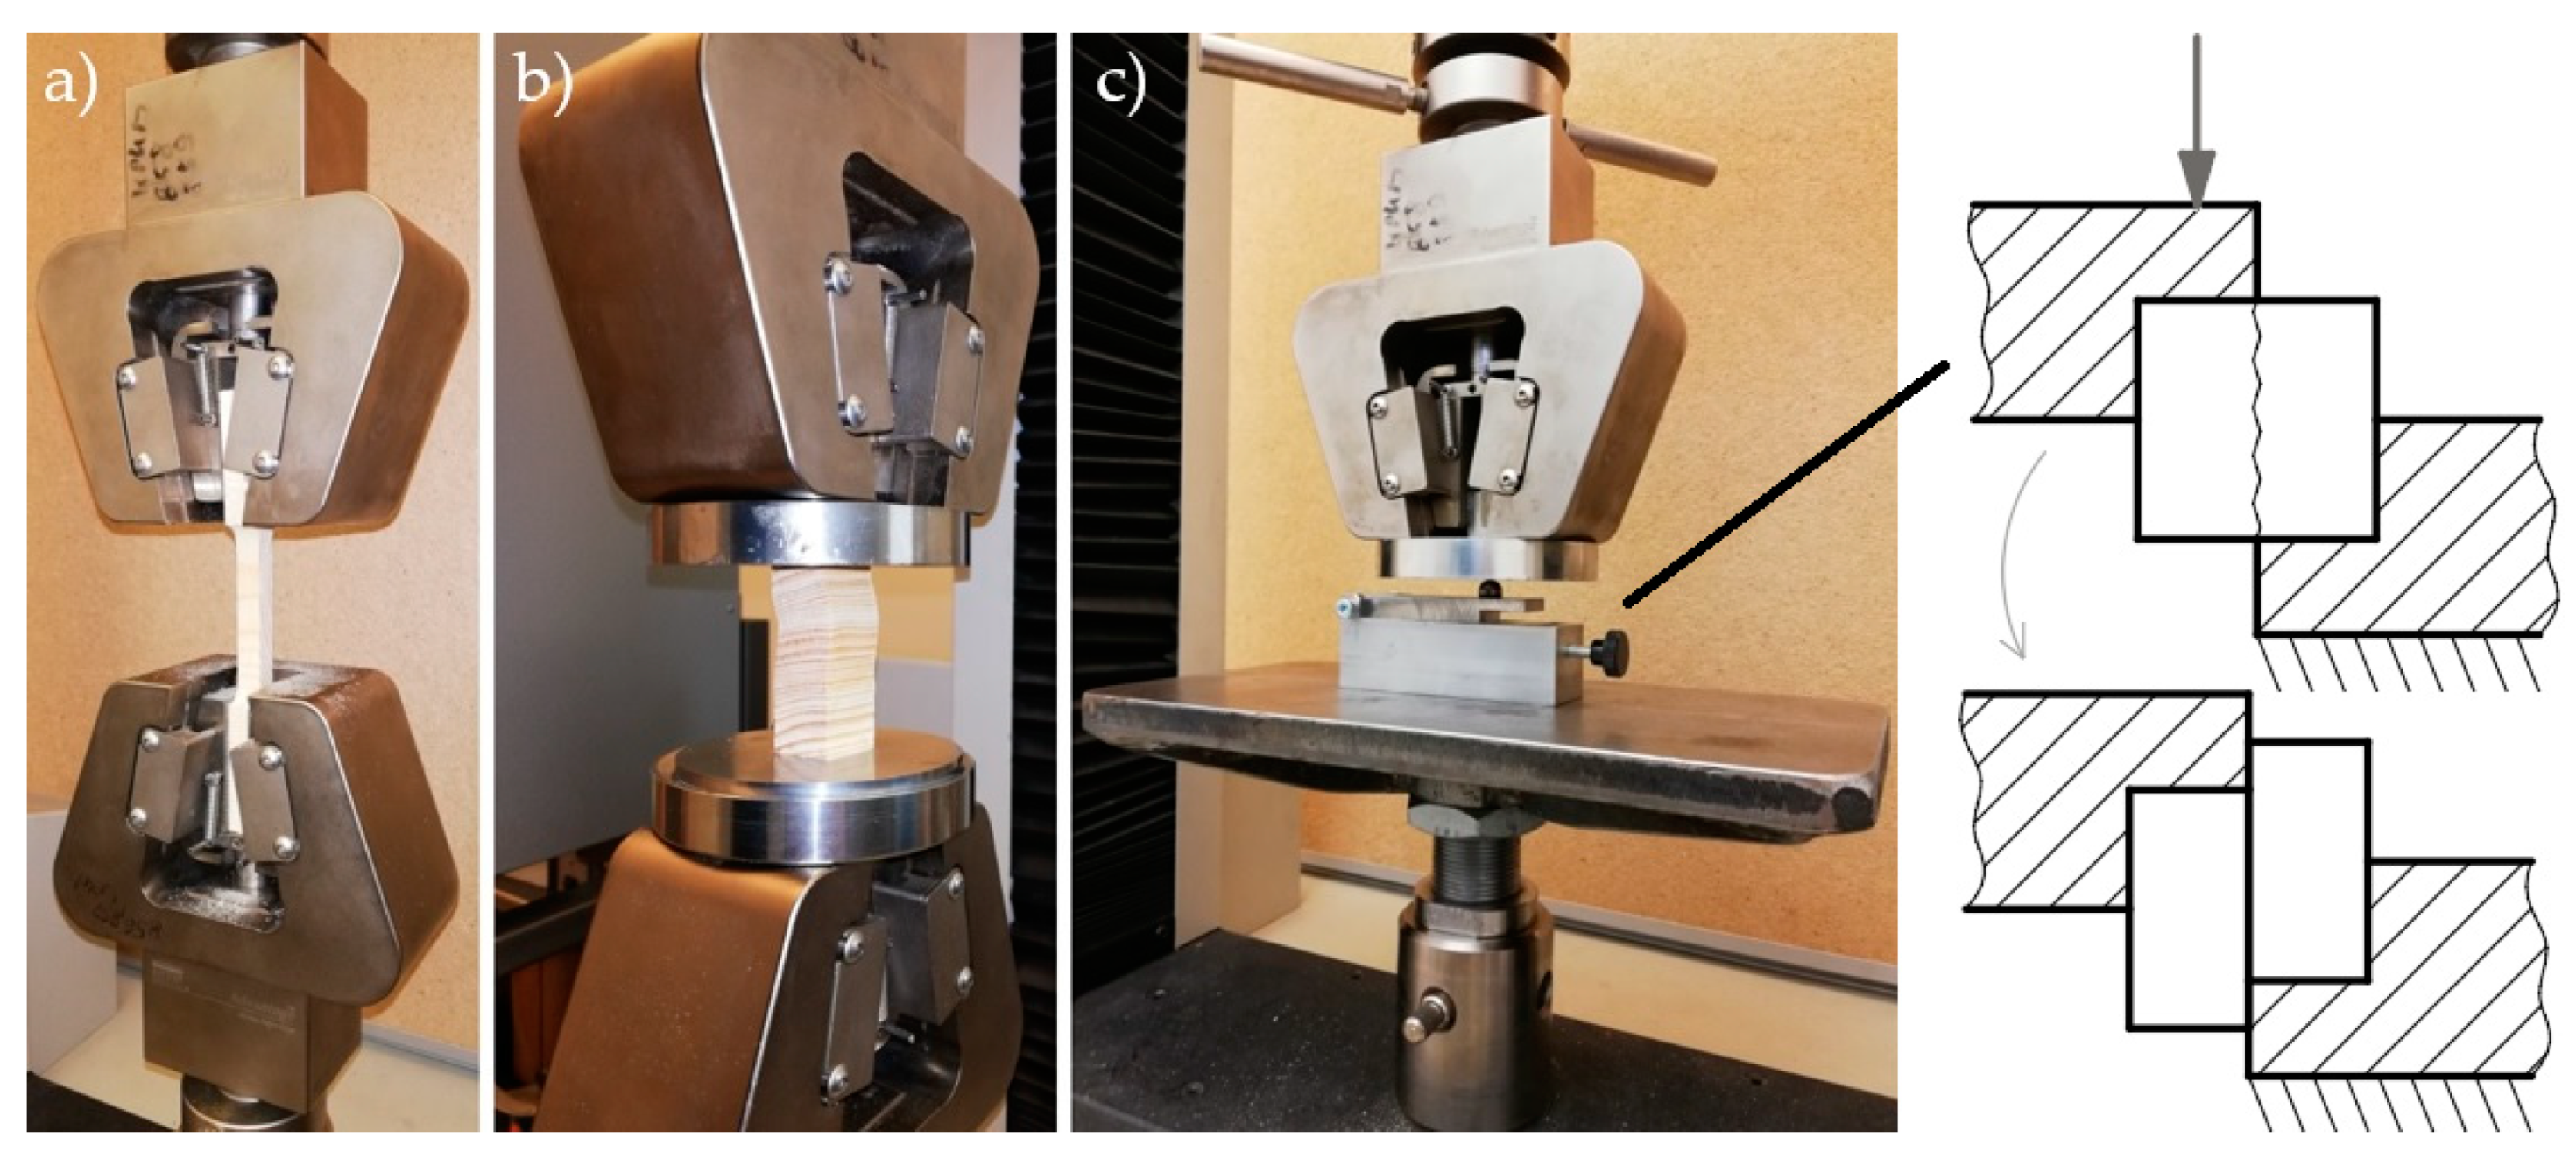
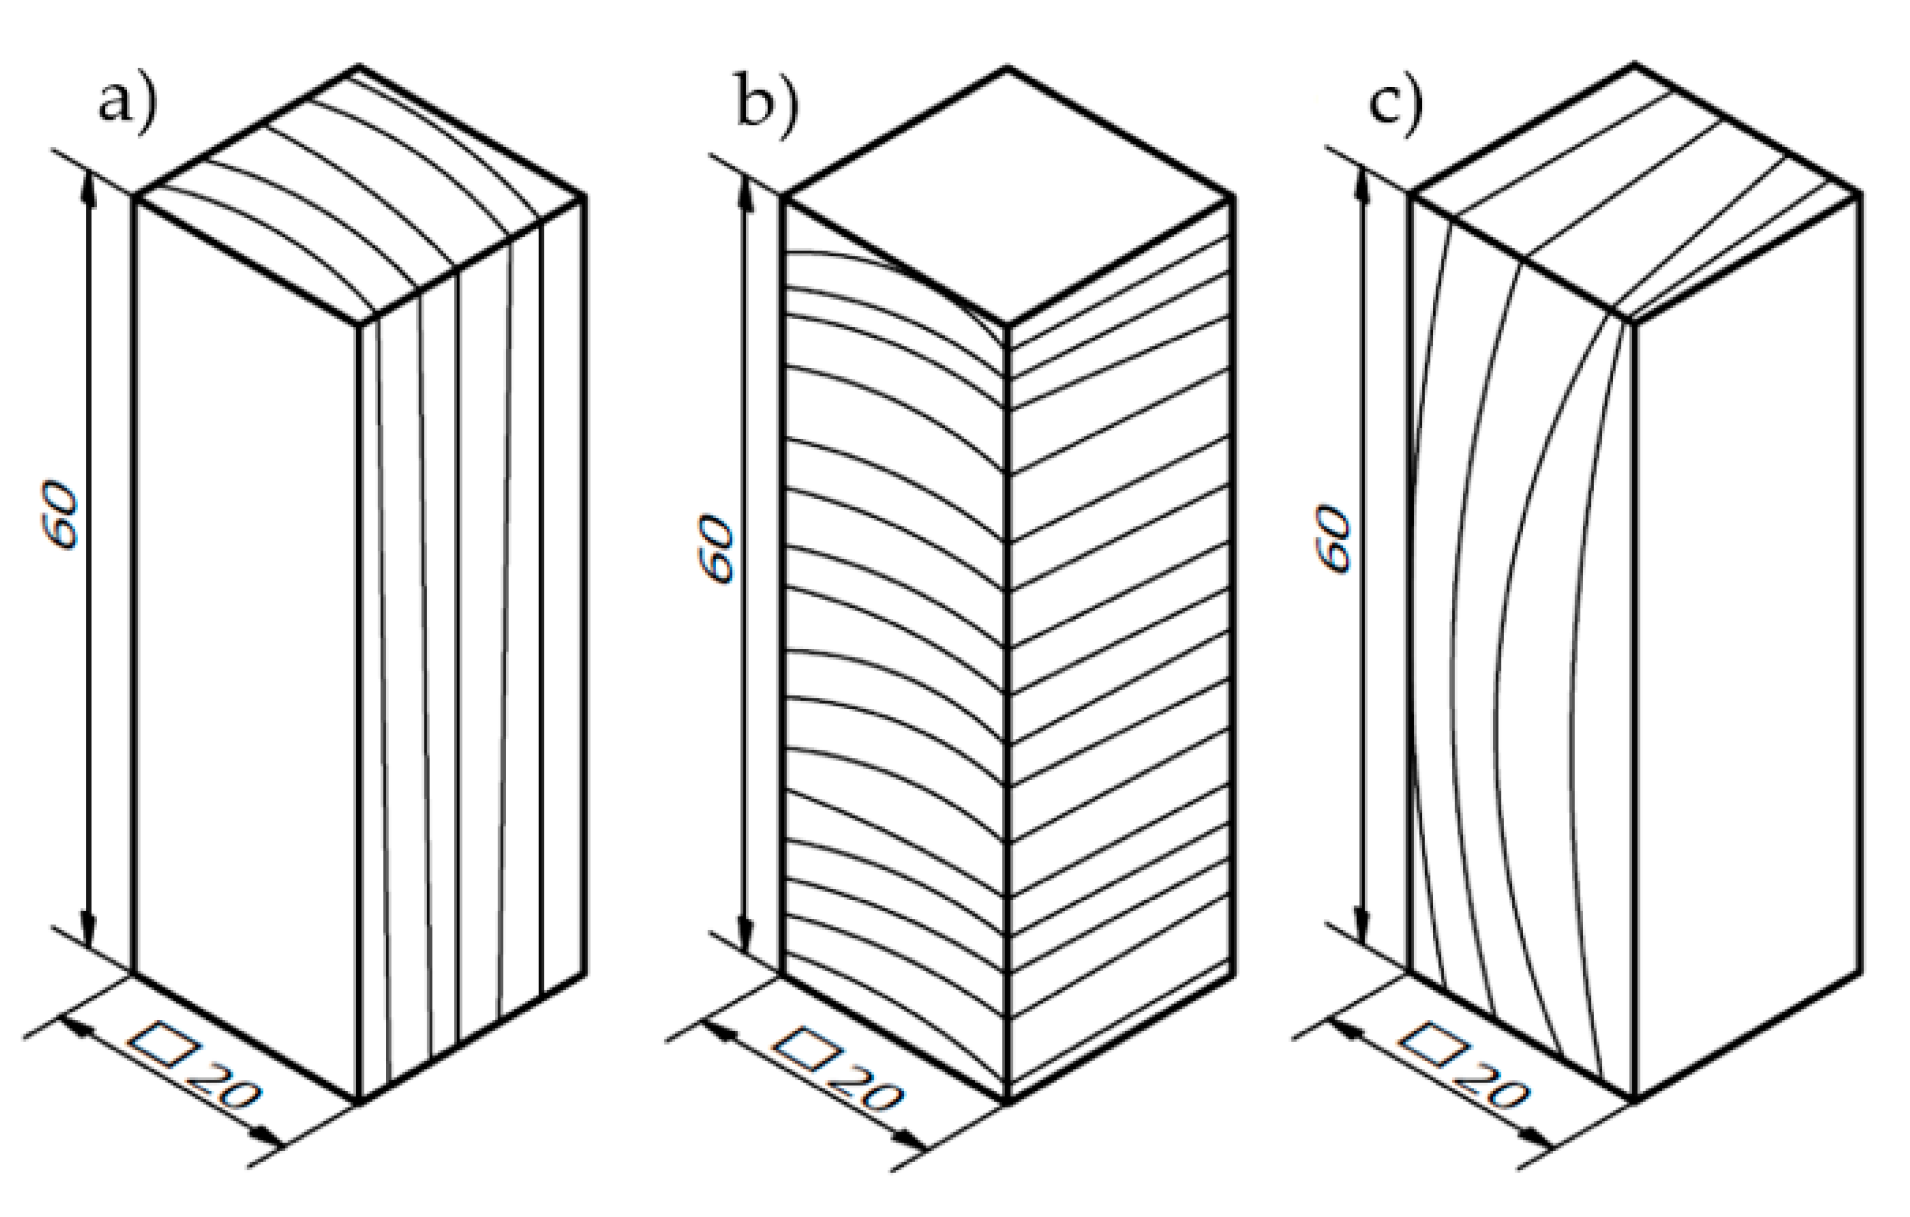
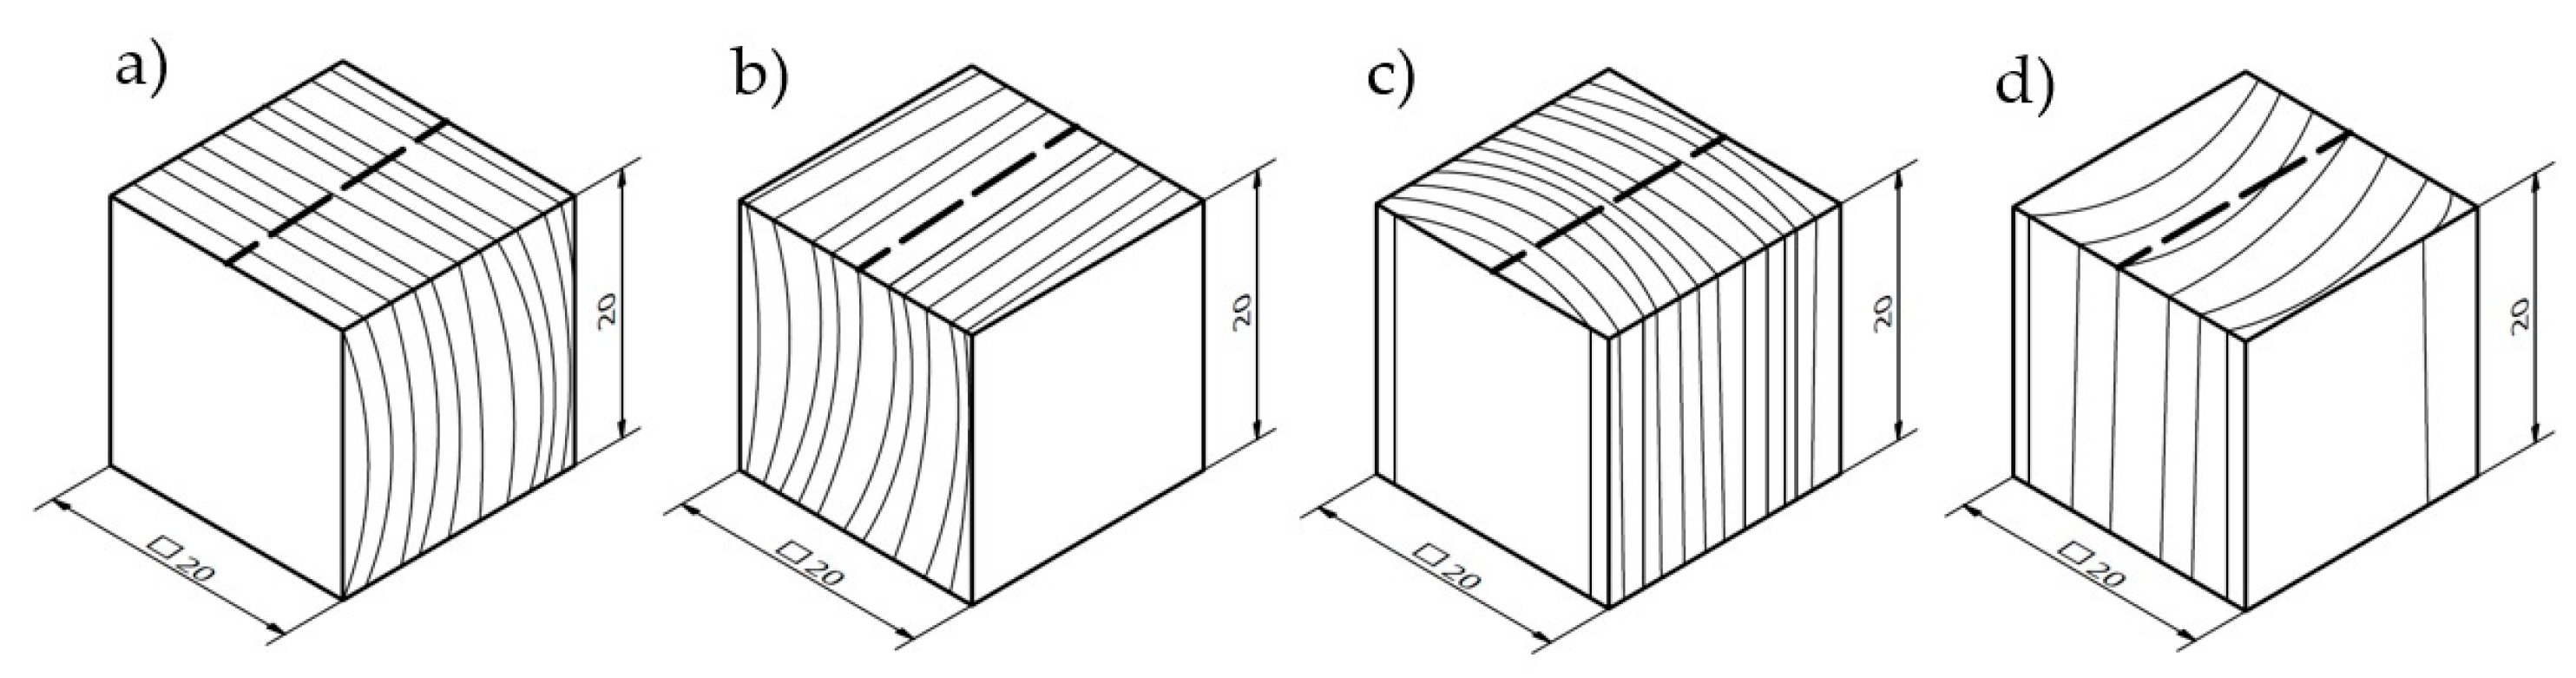
2.1. Methodology of Strength Tests
2.2. Model Finite Element Method (FEM)
3. Results
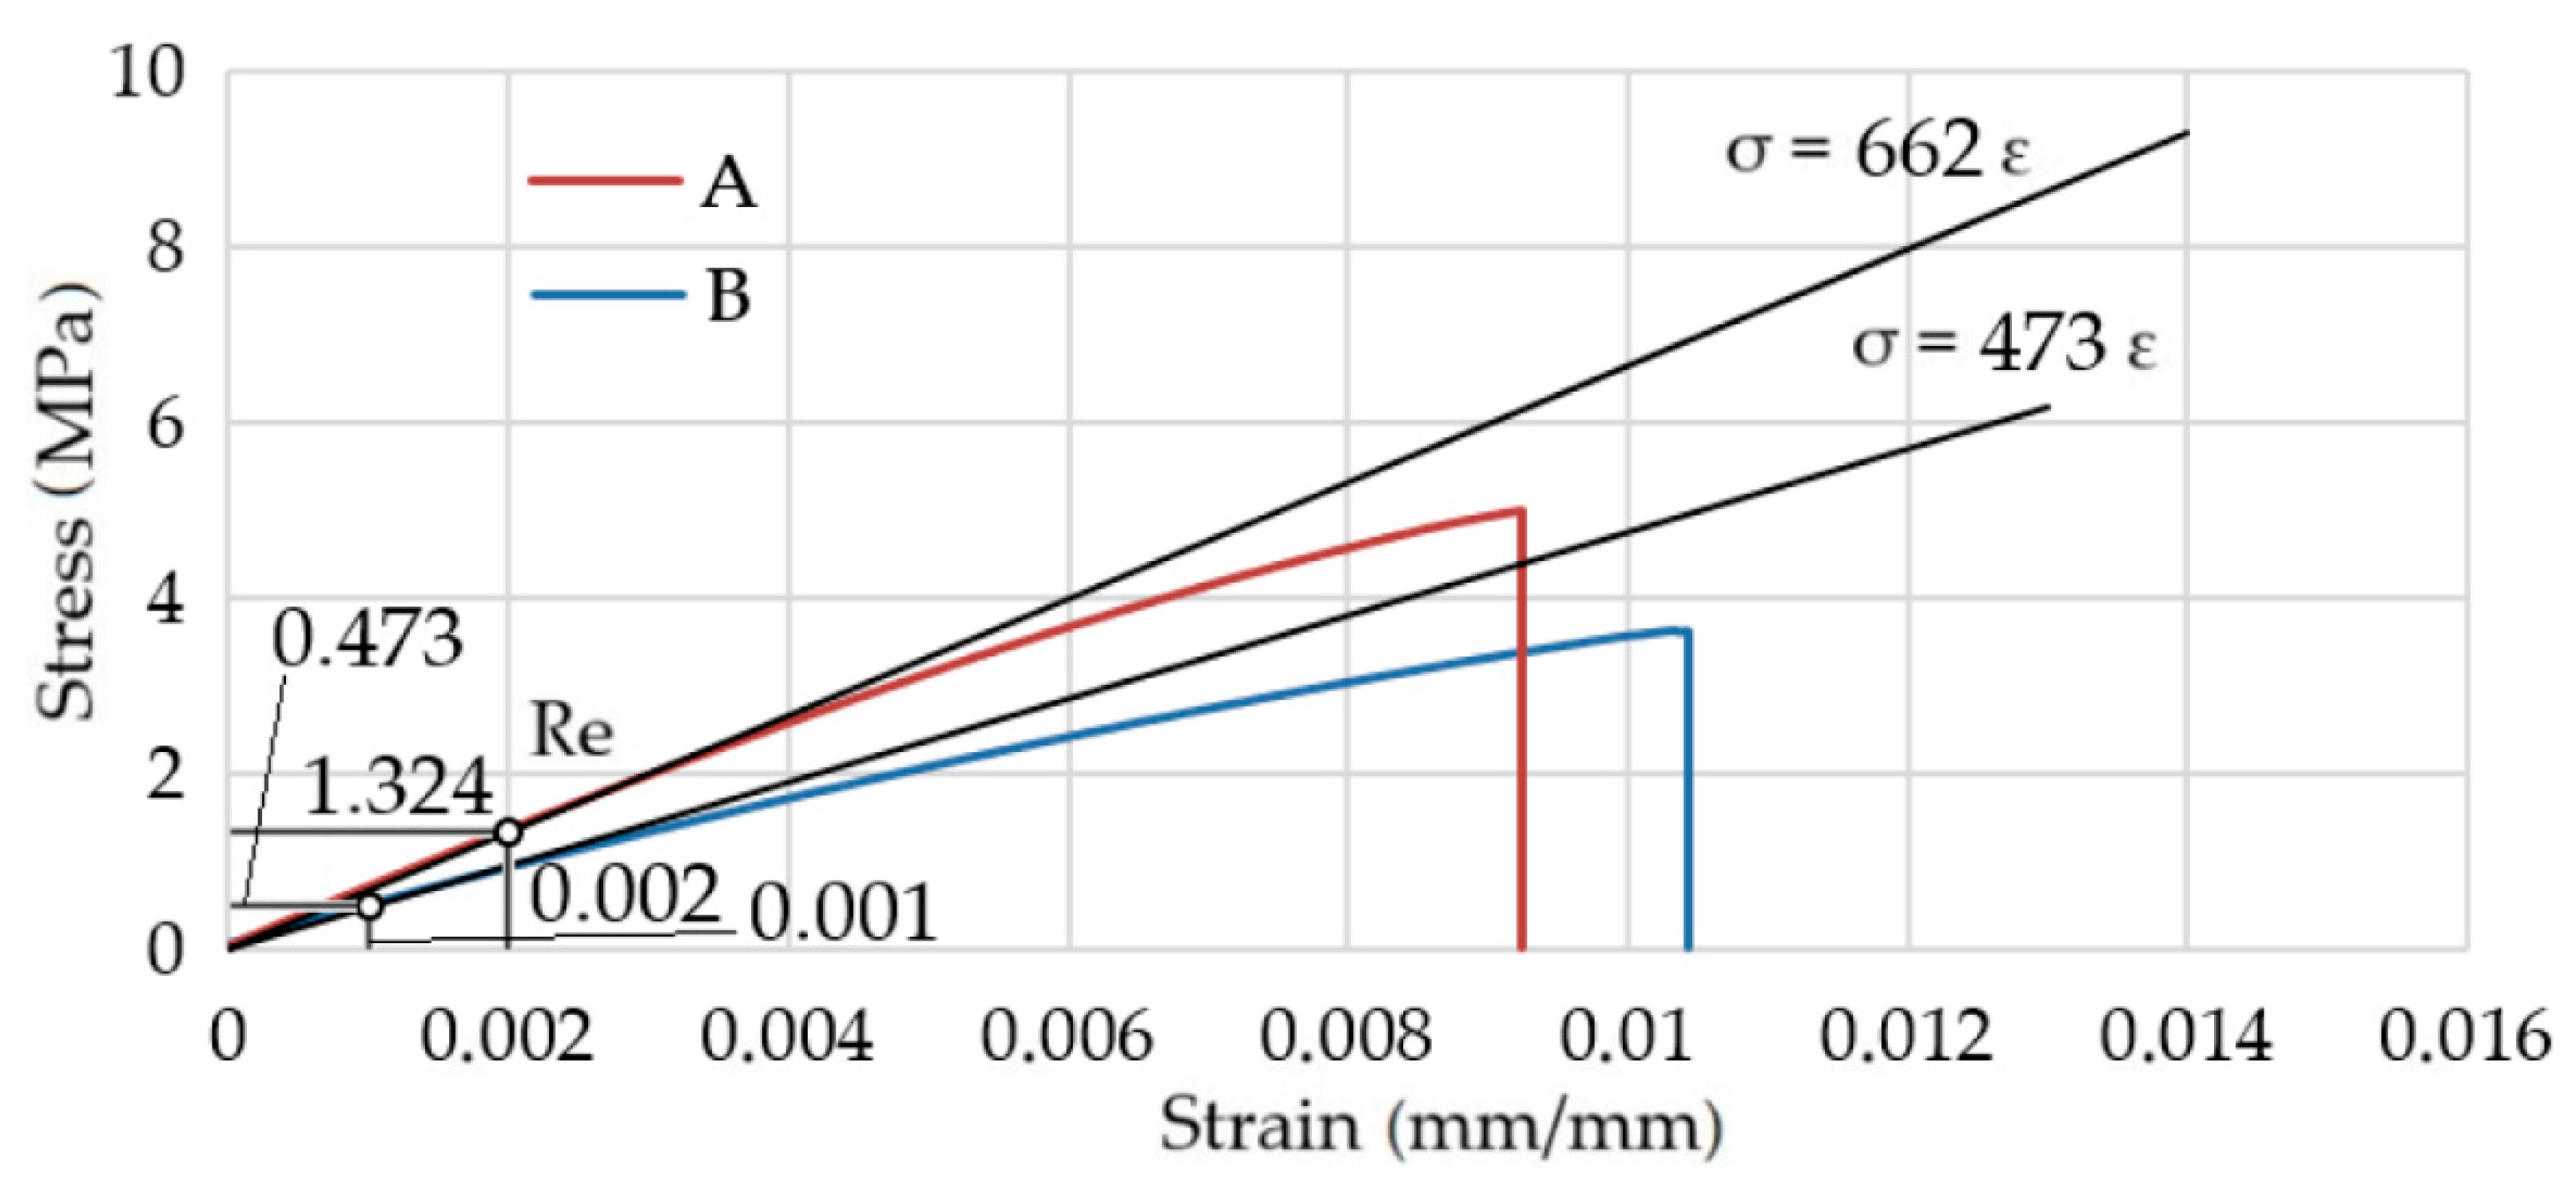
Material Strength Test Results
4. Engineering Constants Used in FEM Modeling of the Wood Test
5. Discussion
5.1. Analysis of the Results of Strength Tests of Tested Samples
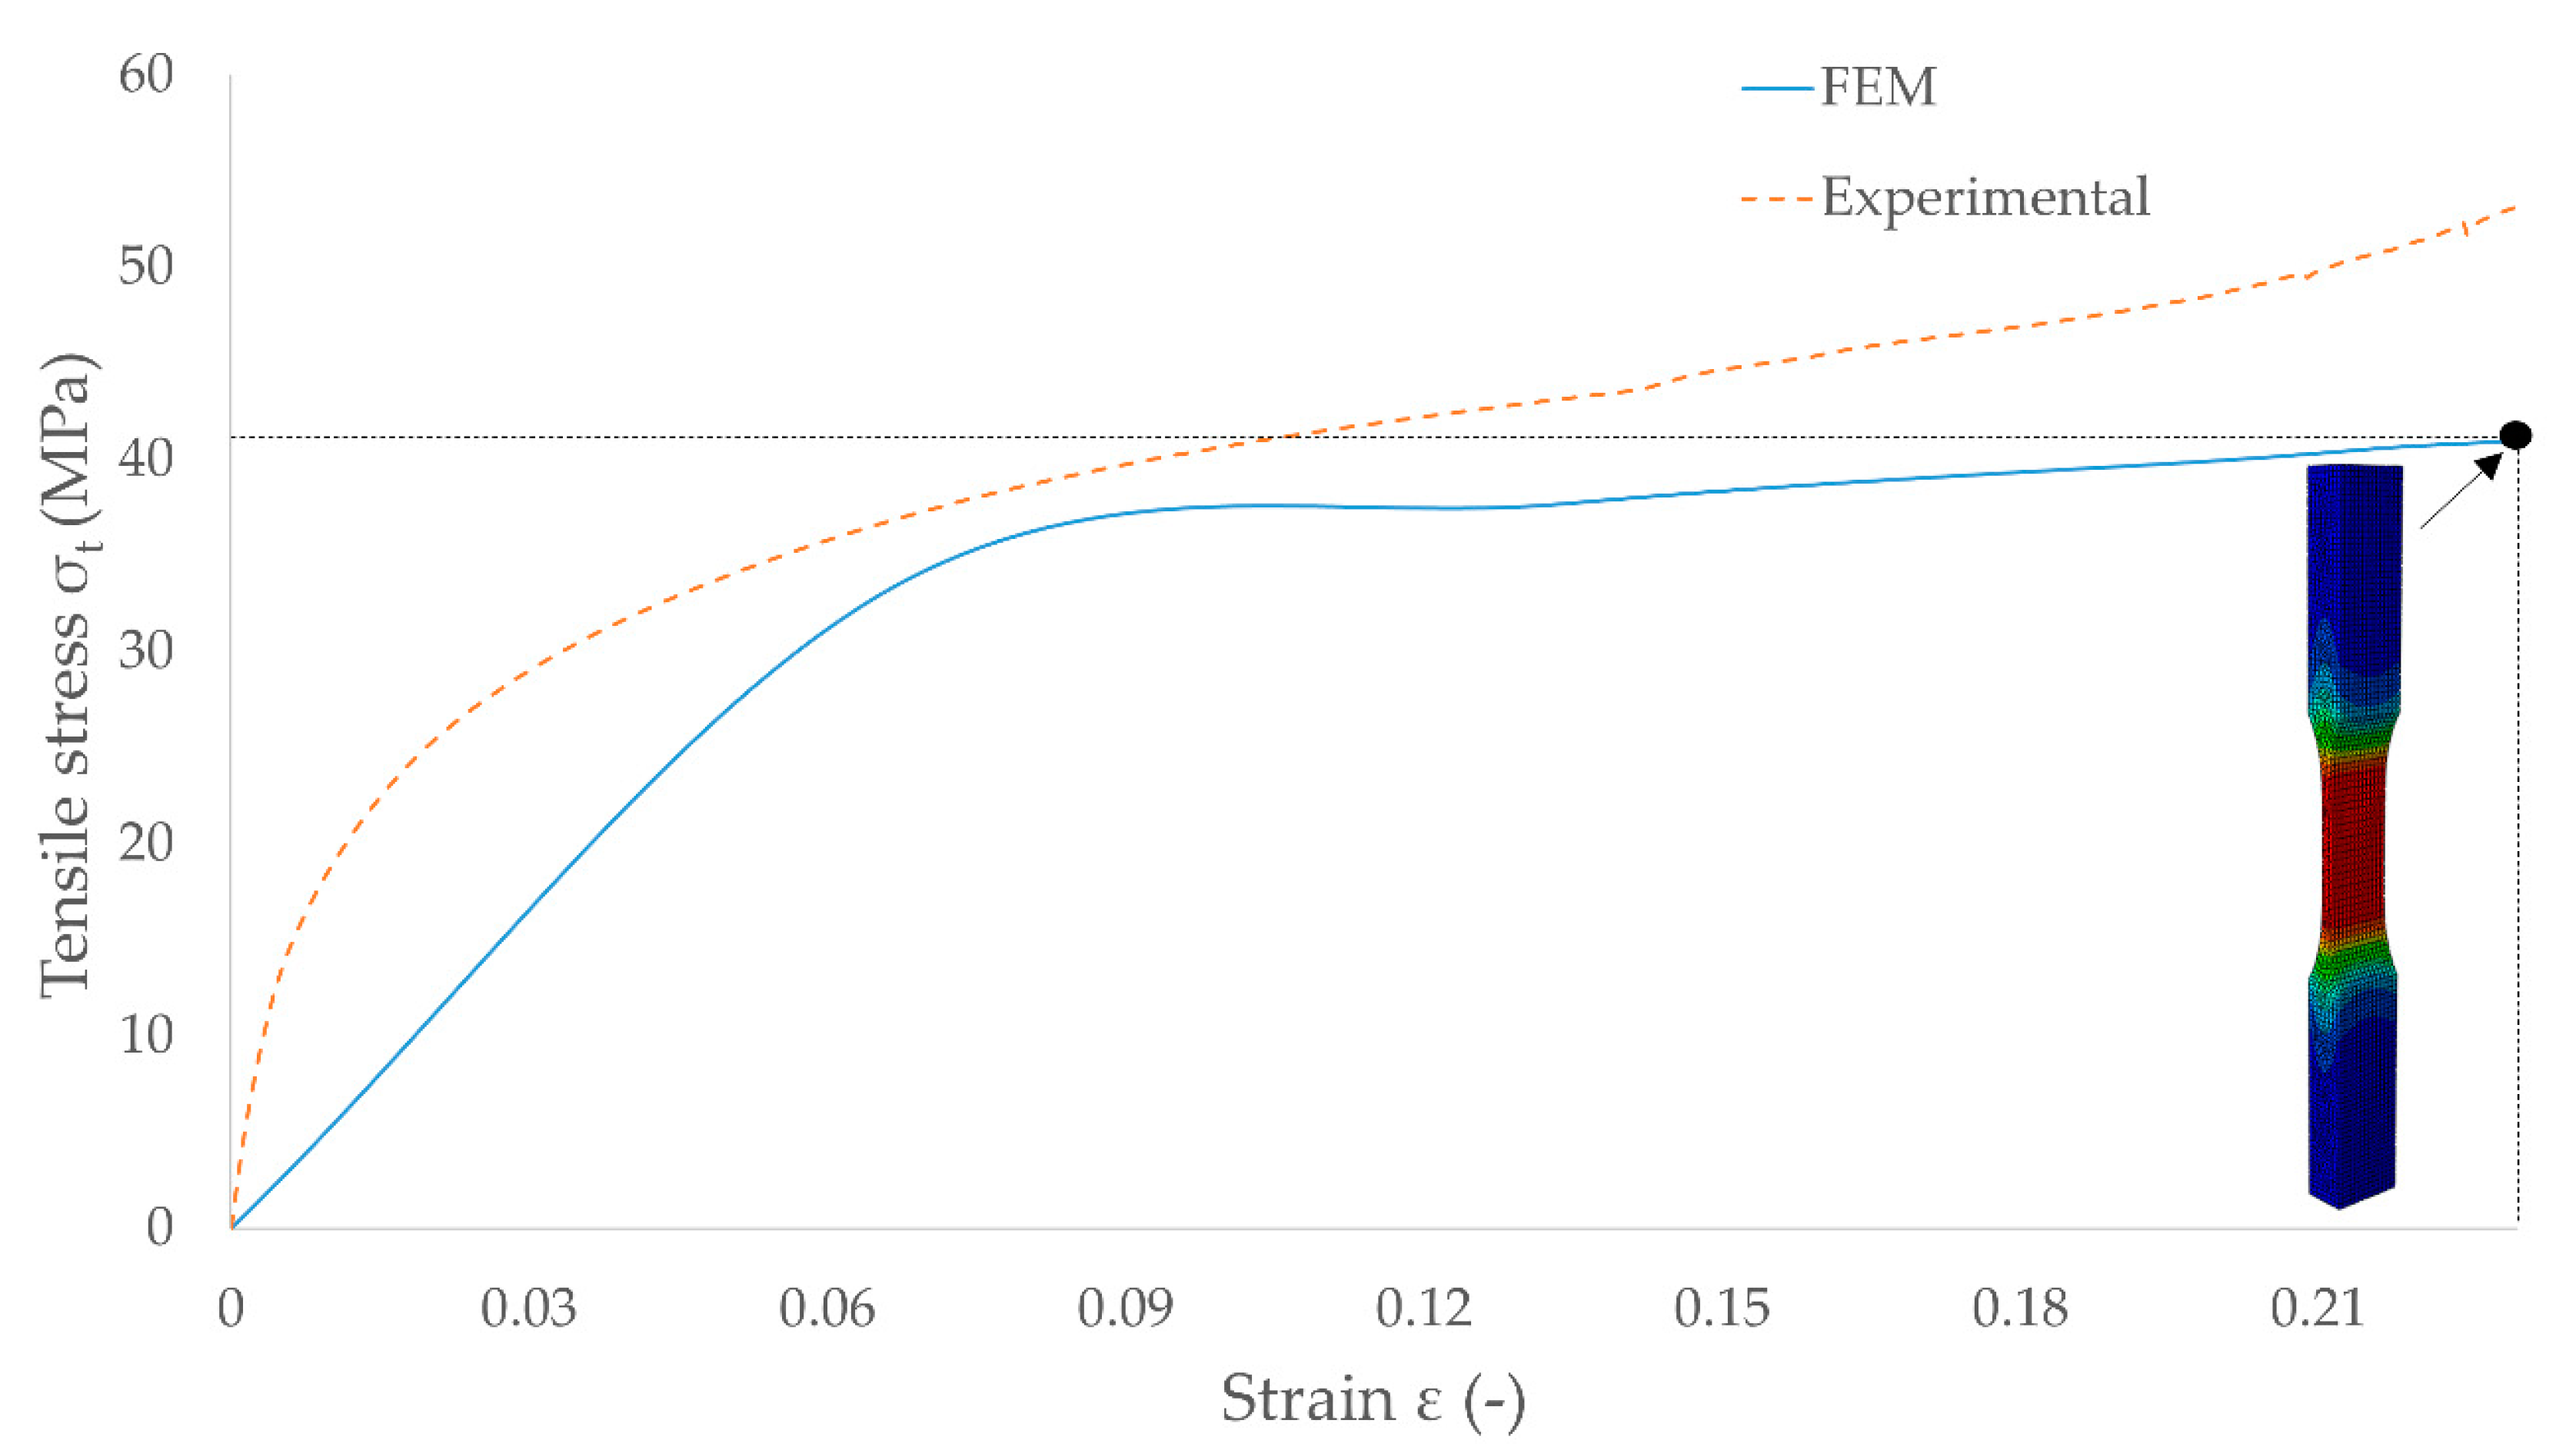
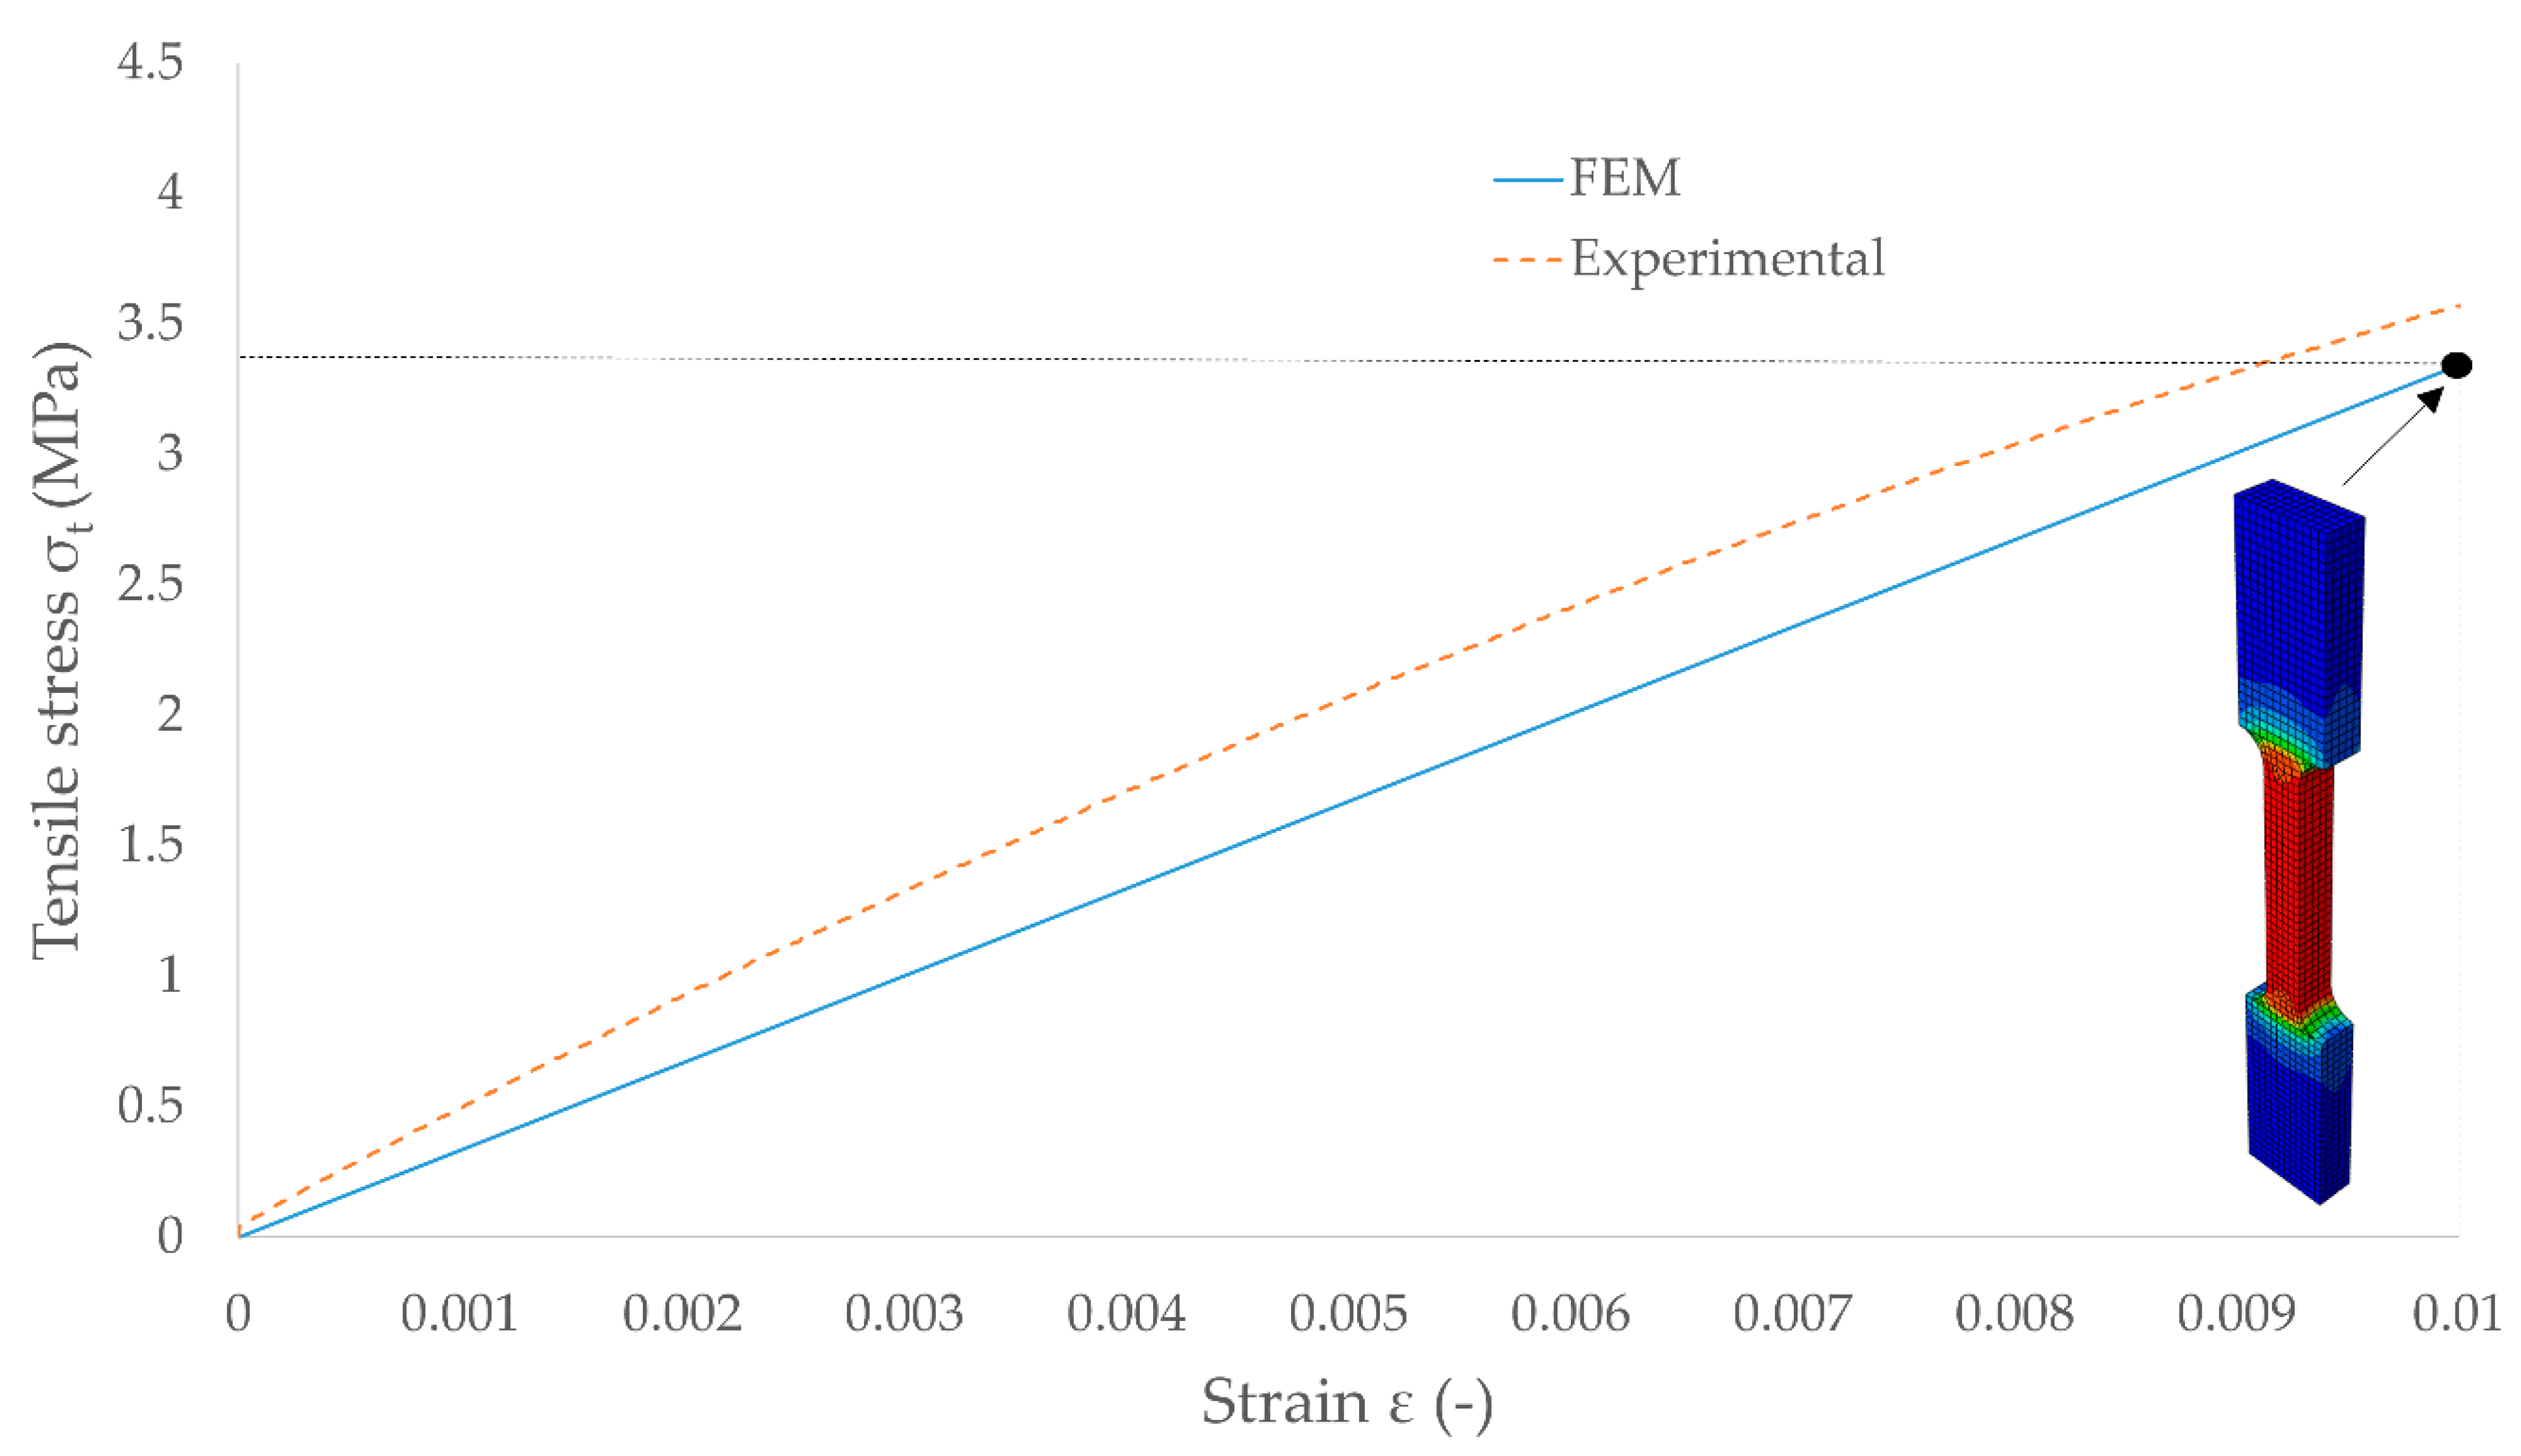
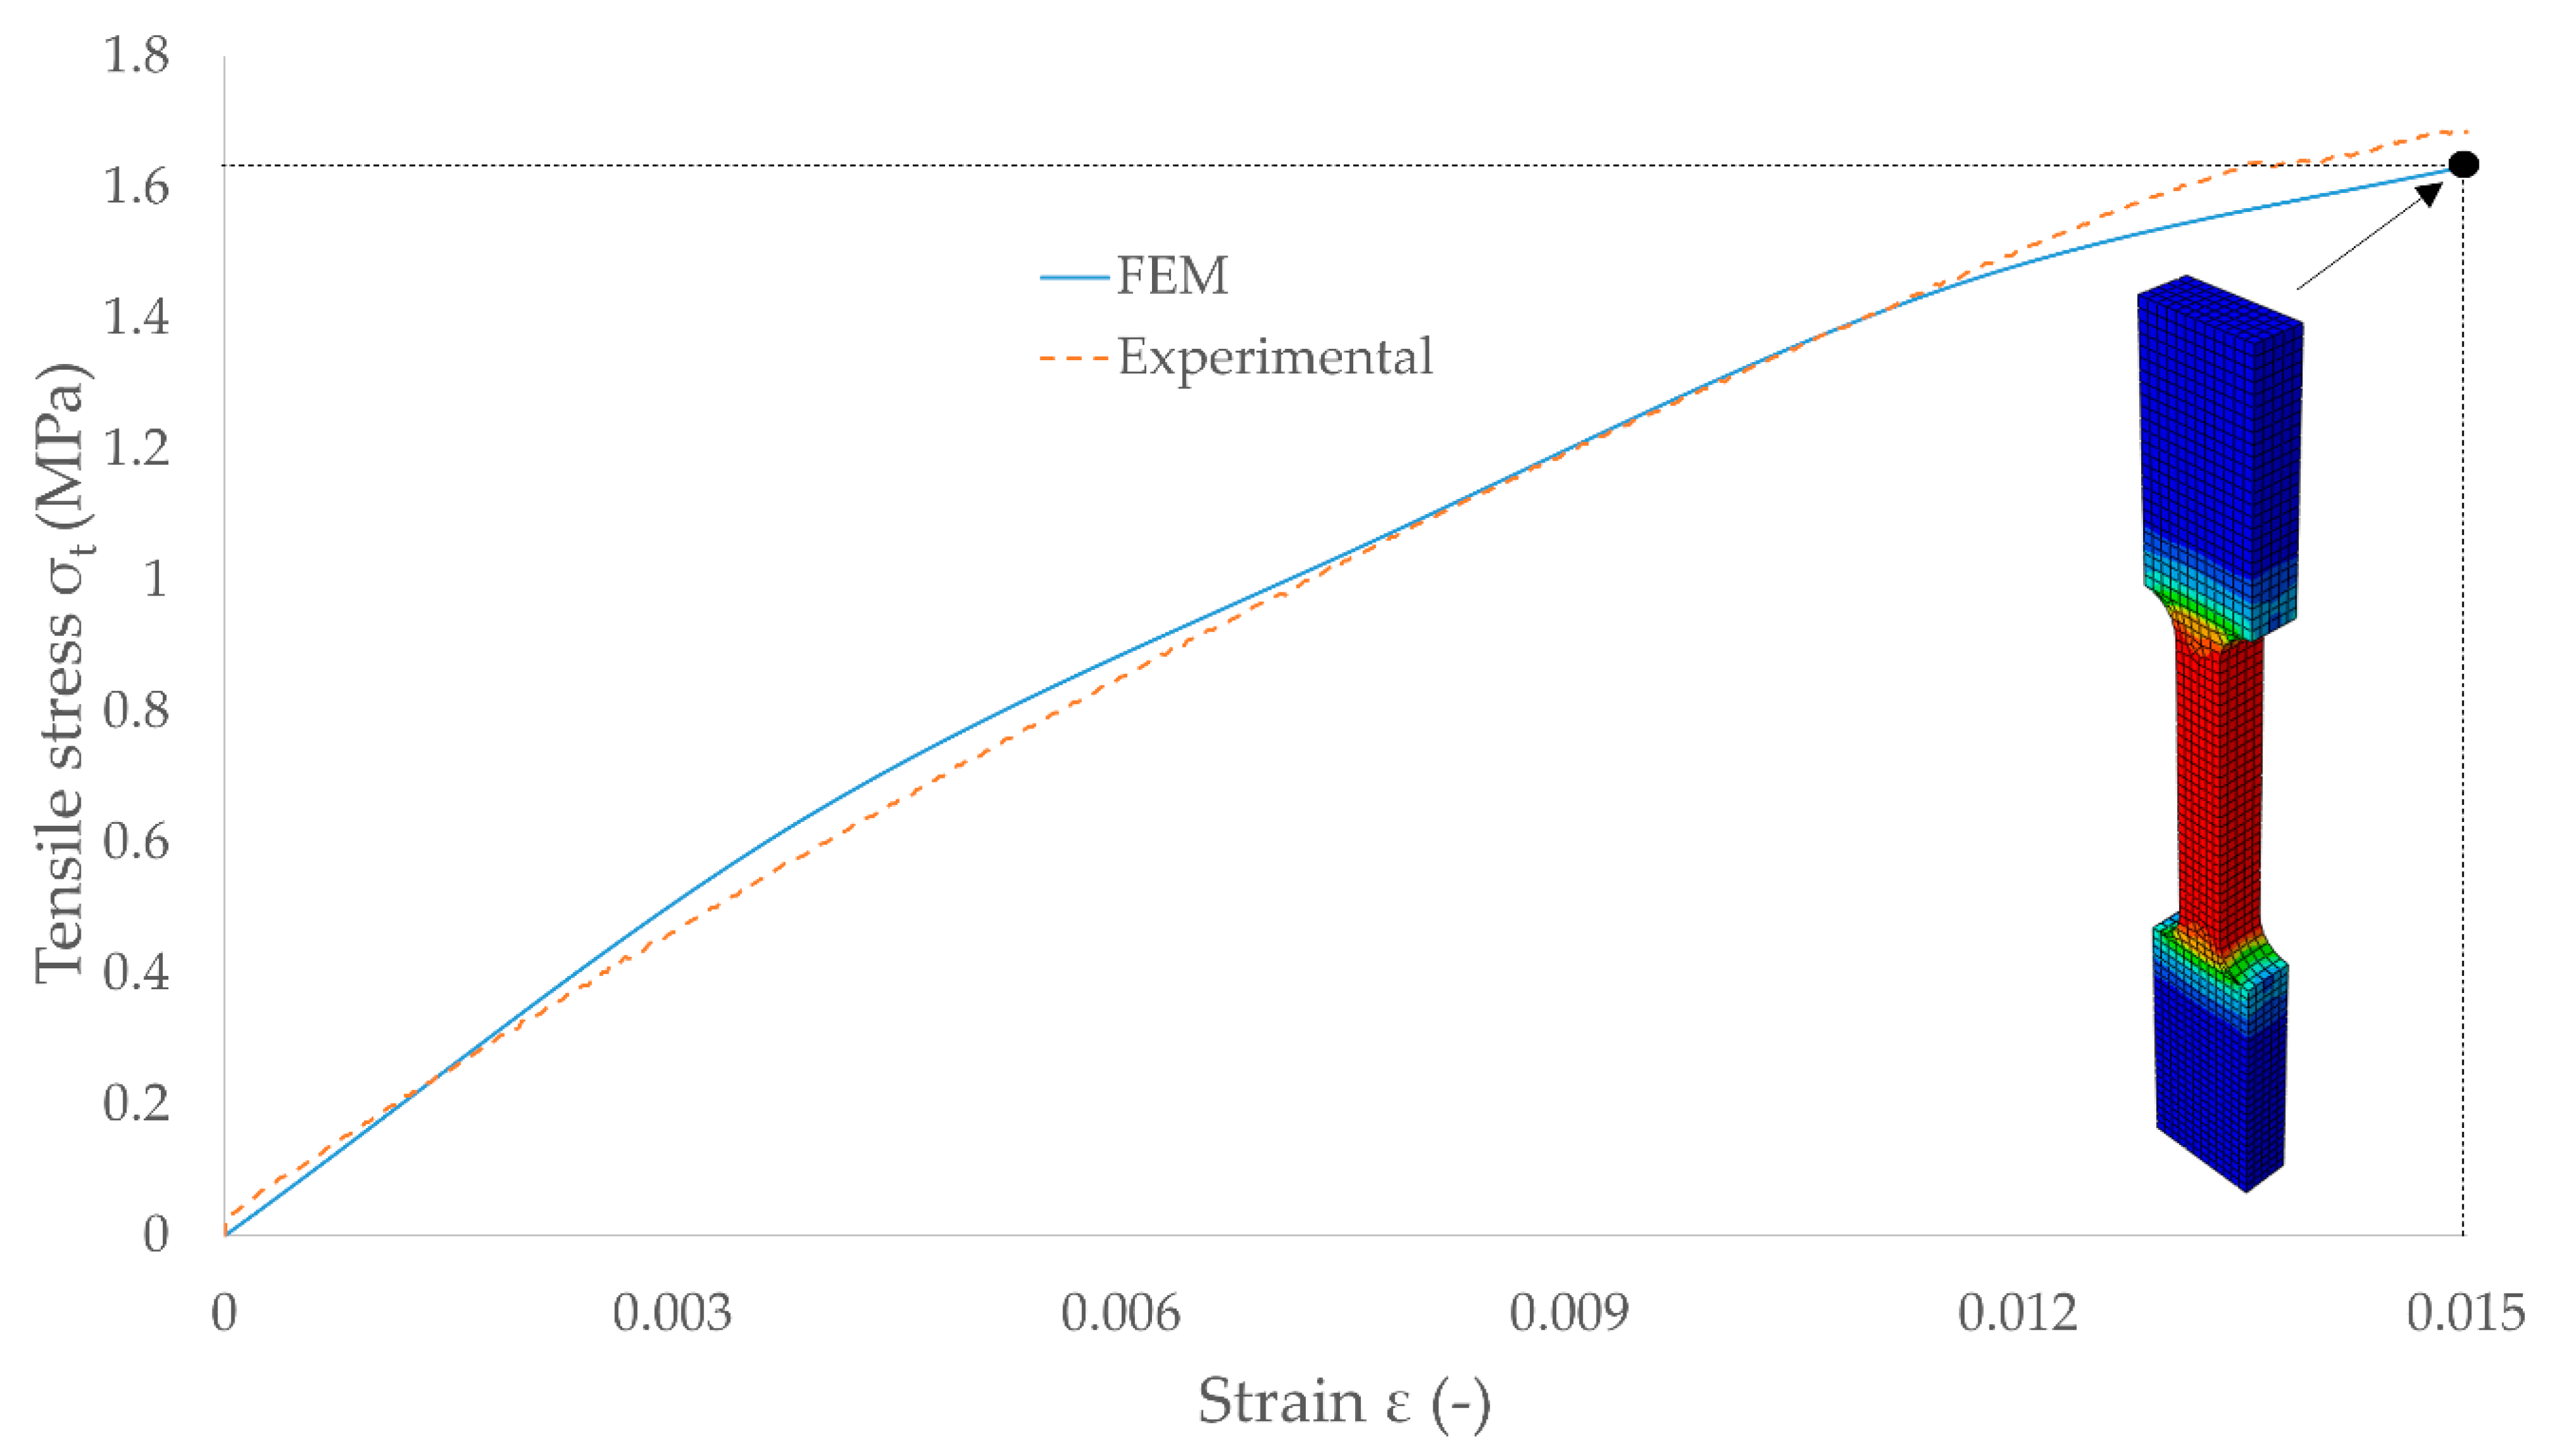
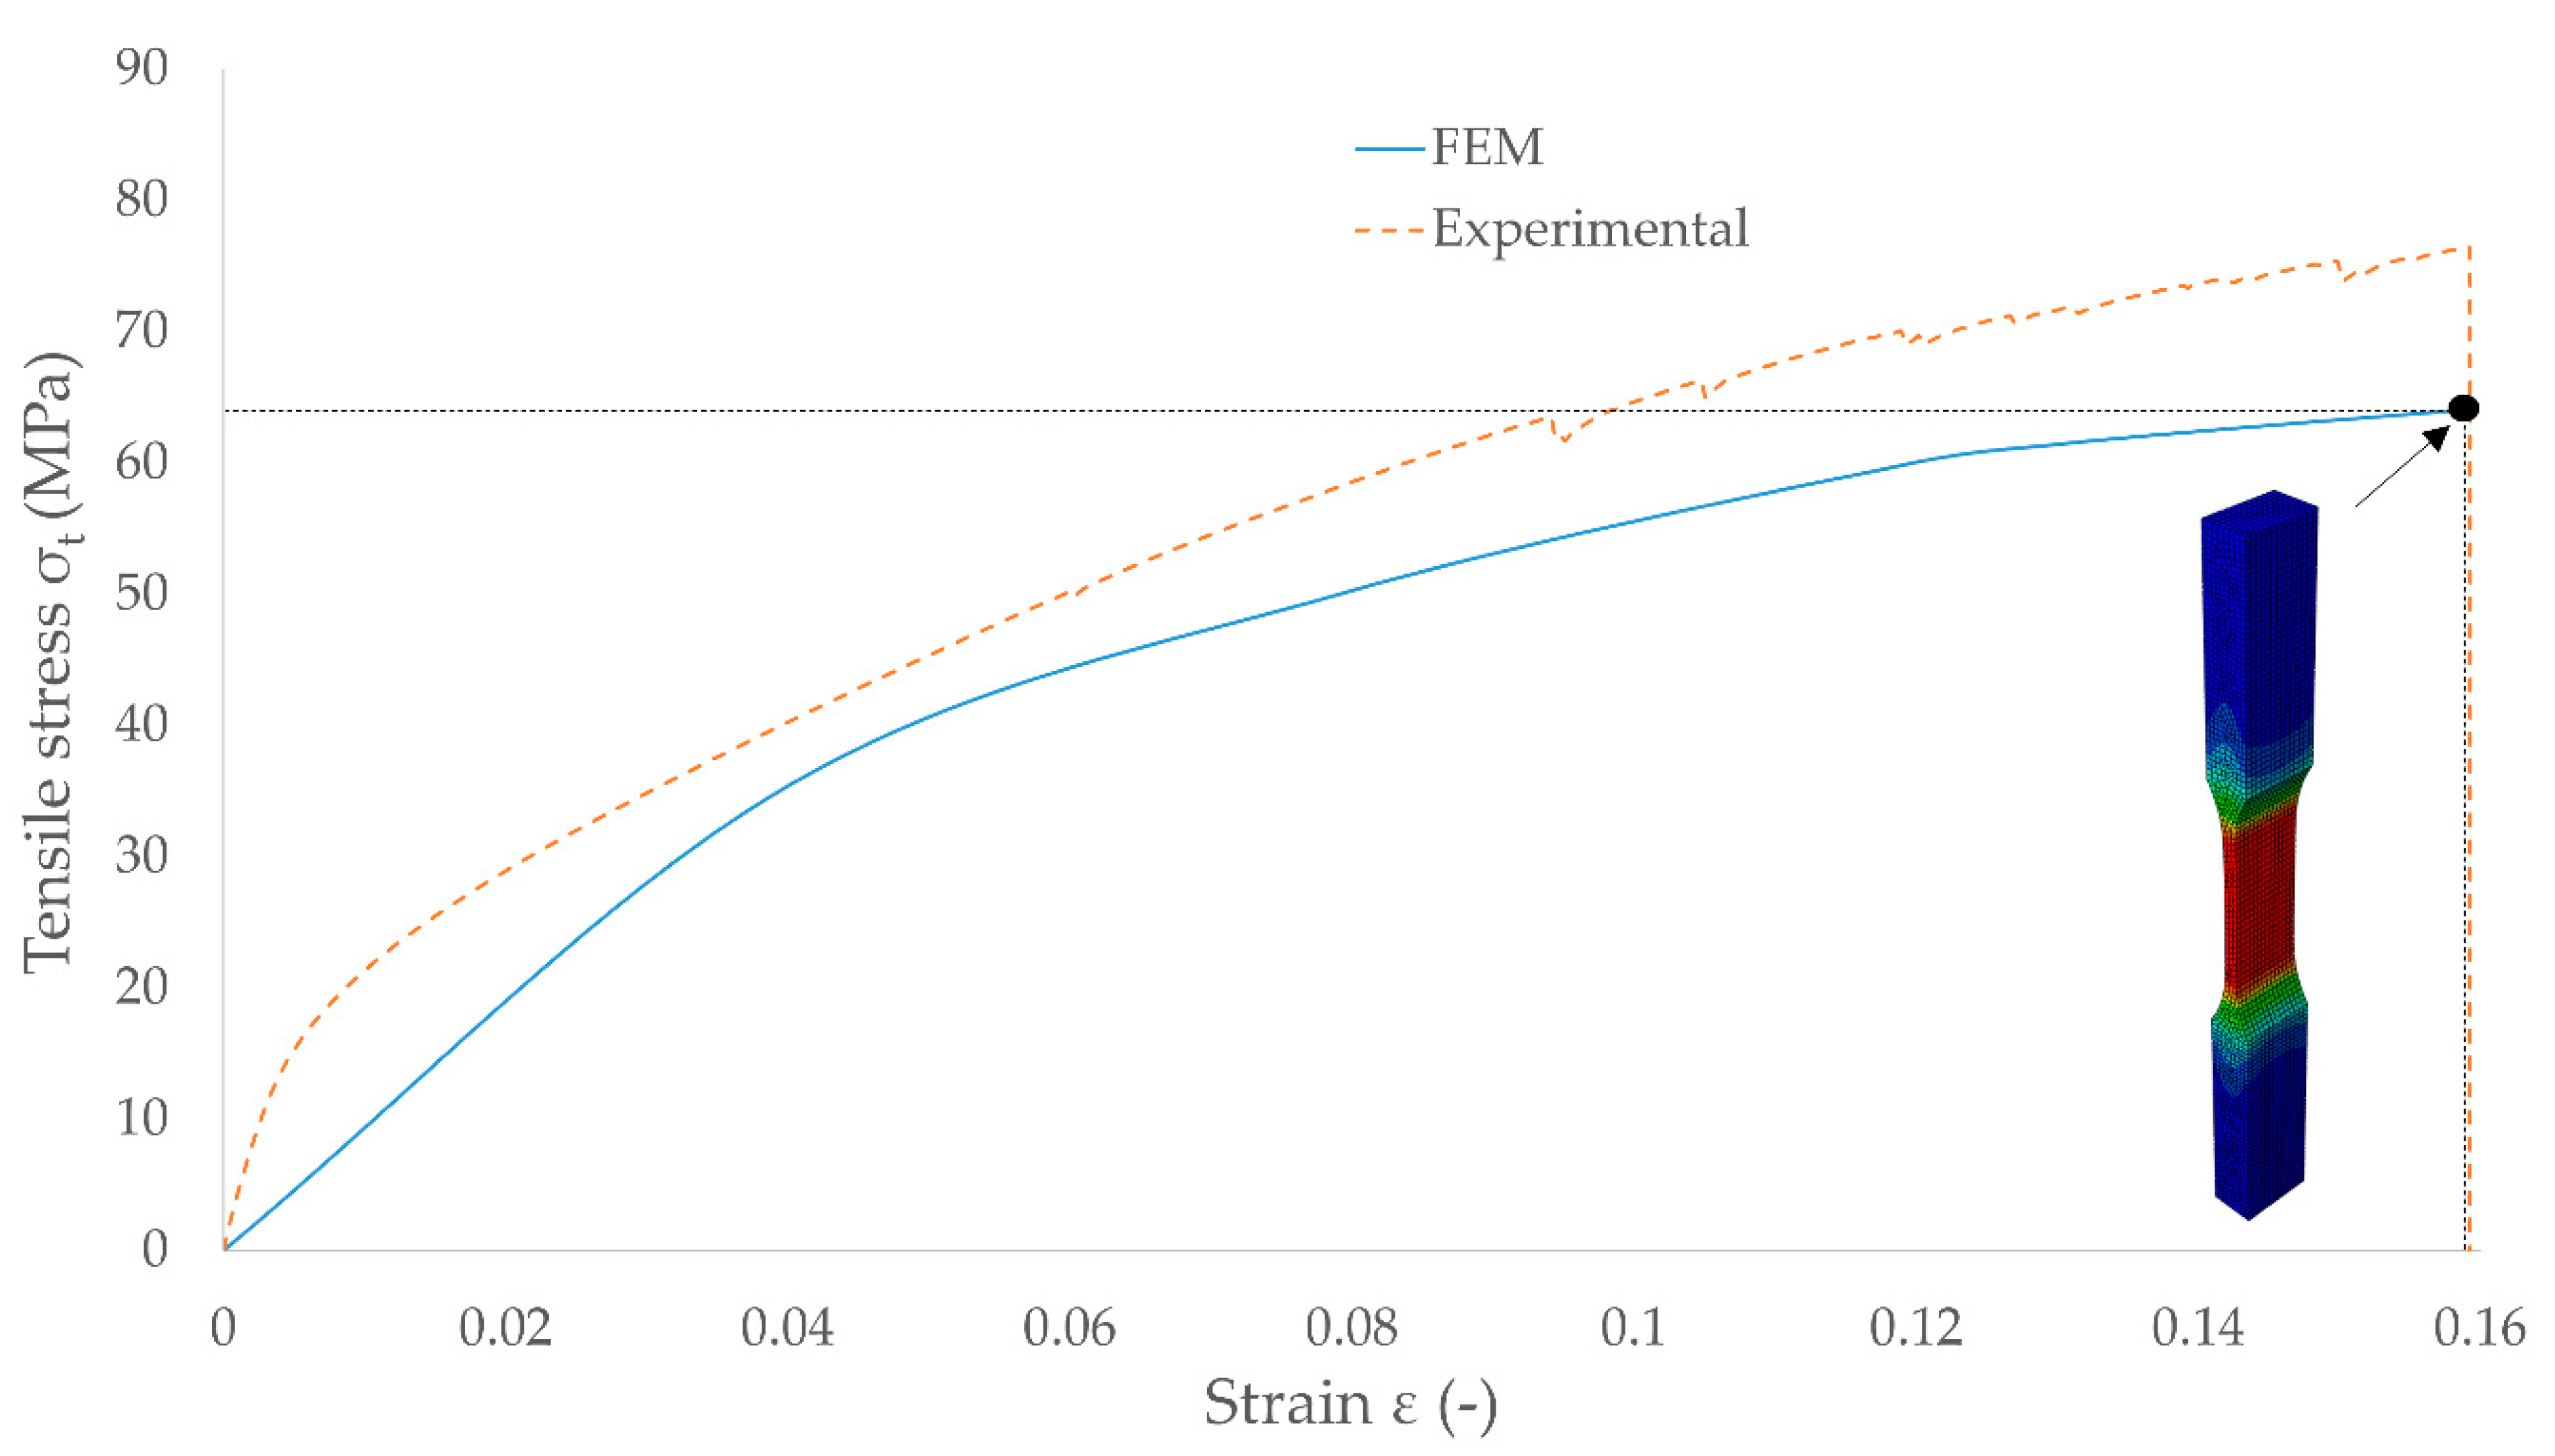
5.2. Analysis of FEM Model Results and Strength Test Results
5.3. Aspects of Symmetry in the Tested Samples
6. Conclusions
Author Contributions
Funding
Conflicts of Interest
References
- Frumkin, H. Beyond toxicity: Human health and the natural environment. Am. J. Prev. Med. 2001, 20, 234–240. [Google Scholar] [CrossRef]
- Baró, F.; Chaparro, L.; Baggethun, E.G.; Langemeyer, J.; Nowak, D.J.; Terradas, J. Contribution of ecosystem services to air quality and climate change mitigation policies: The case of urban forests in Barcelona, Spain. Ambio 2014, 43, 466–479. [Google Scholar] [CrossRef] [PubMed]
- Mullaney, J.; Lucke, T.; Trueman, S.J. A review of benefits and challenges in growing street trees in paved urban environments. Landsc. Urban Plan. 2015, 134, 157–166. [Google Scholar] [CrossRef]
- Selmi, W.; Weber, C.; Rivière, E.; Blond, N.; Mehdi, L.; Nowak, D. Air pollution removal by trees in public green spaces in Strasbourg city, France. Urban For. Urban Green. 2016, 17, 192–201. [Google Scholar] [CrossRef]
- Song, C.; Lee, W.K.; Choi, H.A.; Kim, J.; Jeon, S.W.; Kim, J.S. Spatial assessment of ecosystem functions and services for air purification of forests in South Korea. Environ. Sci. Policy 2016, 63, 27–34. [Google Scholar] [CrossRef]
- Sawidis, T.; Breuste, J.; Mitrovic, M.; Pavlovic, P.; Tsigaridas, K. Trees as bioindicator of heavy metal pollution in three European cities. Environ. Pollut. 2011, 159, 3560–3570. [Google Scholar] [CrossRef]
- Prada, M.; Alonso, C.M.; García, S.S.; Canga, E. Analysis of three forest chippers: Productivity, costs and GHG emissions in Northern Spain. J. Clean. Prod. 2015, 101, 238–244. [Google Scholar] [CrossRef]
- Manzone, M. Energy consumption and CO2 analysis of different types of chippers used in wood biomass plantations. Appl. Energy 2015, 156, 686–692. [Google Scholar] [CrossRef]
- Niinikoski, J.; Ewalds, J.; Heikkinen, E.; Kotilainen, J.; Kääriäinen, M.; Tammi, K.; Kiviluoma, P.; Korhonen, A.; Kuosmanen, P. Methods for reducing emissions of small internal combustion engines. In Proceedings of the 11th International DAAAM Baltic Conference, Industrial Engineering, Tallinn, Estonia, 20–22 April 2016. [Google Scholar]
- Warguła, Ł.; Krawiec, P.; Waluś, K.J.; Kukla, M. Fuel Consumption Test Results for a Self-Adaptive, Maintenance-Free Wood Chipper Drive Control System. Appl. Sci. 2020, 10, 2727. [Google Scholar] [CrossRef]
- Szpica, D. Coefficient of engine flexibility as a basis for the assessment of vehicle tractive performance. Chin. J. Mech. Eng. 2019, 32, 9. [Google Scholar] [CrossRef]
- Szpica, D.; Czaban, J. Operational assessment of selected gasoline and LPG vapour injector dosage regularity. Mechanika 2014, 20, 480–489. [Google Scholar] [CrossRef]
- Li, L.; Liu, Z.; Wang, H.; Deng, B.; Wang, Z.; Xiao, Z.; Su, Y.; Jiang, B. Development of a gas-phase LPG injection system for a small SI engine. SAE Technol. Pap. 2003, 1–9. [Google Scholar] [CrossRef]
- Patil, C.; Varade, S.; Wadkar, S. A review of engine downsizing and its effects. Int. J. Curr. Eng. Technol. 2017, 7, 319–324. [Google Scholar]
- Warguła, Ł.; Adamiec, J.M.; Waluś, K.J.; Krawiec, P. The Characteristics Analysis of Torque and Rotation Speed of Working Unit of Branch Grinder-Introductory Research. In Proceedings of the MATECWeb of Conferences, Proceedings of the Machine Modelling and Simulations, Sklené Teplice, Slovak Republic, 5–8 September 2017; Volume 157. [Google Scholar]
- Warguła, Ł.; Krawiec, P. The research on the characteristic of the cutting force while chipping of the Caucasian Fir (Abies nordmanniana) with a single-shaft wood chipper. IOP Conf. Ser. Mater. Sci. Eng. 2020, 776, 012012. [Google Scholar] [CrossRef]
- Macko, M.; Tyszczuk, K.; Śmigielski, G.; Mroziński, A. Utility of an Unitary-Shredding Method to Evaluate the Conditions and Selection of Constructional Features during Grinding. In Proceedings of the MATECWeb of Conferences, Proceedings of the Machine Modelling and Simulations, Sklené Teplice, Slovak Republic, 5–8 September 2017; Volume 157. [Google Scholar]
- Macko, M.; Tyszczuk, K.; Śmigielski, G.; Flizikowski, J.; Mroziński, A. The Use of CAD Applications in the Design of Shredders for Polymers. In Proceedings of the MATECWeb of Conferences, Proceedings of the Machine Modelling and Simulations, Sklené Teplice, Slovak Republic, 5–8 September 2017; Volume 157. [Google Scholar]
- Kaygin, B.; Yorur, H.; Uysal, B. Simulating Strength Behaviors of Corner Joints of Wood Constructions by Using Finite Element Method. Wood Ind. Drv. Ind. 2016, 67, 133–140. [Google Scholar] [CrossRef]
- Ilic, S.; Hackl, K. Application of the multiscale FEM to the modeling of nonlinear multiphase materials. J. Theor. Appl. Mech. 2009, 47, 537–551. [Google Scholar]
- Jeong, G.Y.; Hindman, D.P. Modeling differently oriented loblolly pine strands incorporating variation of intraring properties using a stochastic finite element method. Wood Fiber Sci. 2010, 42, 51–61. [Google Scholar]
- Pétrissans, A.; Hamada, J.; Chaouch, M.; Petrissans, M.; Gerardin, P. Modeling and numerical simulation of wood torrefaction. Innov. Woodwork. Ind. Eng. Des. 2015, 5, 26–32. [Google Scholar]
- Hansson, L.; Lundgren, N.; Antti, A.L.; Hagman, O. Finite element modeling (FEM) simulation of interactions between wood and microwaves. J. Wood Sci. 2006, 52, 406–410. [Google Scholar] [CrossRef]
- Staneva, N.; Genchev, Y.; Hristodorova, D. FEM analysis of deformations and stresses of upholstered furniture skeleton made of scots pine and OSB. Int. J. Wood Des. Technol. 2017, 6, 31–37. [Google Scholar]
- Tankut, N.; Tankut, A.N.; Zor, M. Finite element analysis of wood materials. Drv. Ind. Znan. Casopis Pitanja Drv. Tehnol. 2014, 65, 159–171. [Google Scholar] [CrossRef]
- Kurata, Y. A Comparison of the Loading Direction for Bending Strength with Different Wood Measurement Surfaces Using Near-Infrared Spectroscopy. Forests 2020, 11, 644. [Google Scholar] [CrossRef]
- Fajdiga, G.; Rajh, D.; Nečemer, B.; Glodež, S.; Šraml, M. Experimental and Numerical Determination of the Mechanical Properties of Spruce Wood. Forests 2019, 10, 1140. [Google Scholar] [CrossRef]
- Hu, W.; Wan, H.; Guan, H. Size Effect on the Elastic Mechanical Properties of Beech and Its Application in Finite Element Analysis of Wood Structures. Forests 2019, 10, 783. [Google Scholar] [CrossRef]
- Kawecki, B.; Podgórski, J. 3D Abaqus Simulation of Bent Softwood Elements. Arch. Civ. Eng. 2020, 3, 323–337. [Google Scholar]
- Malujda, I.; Talaśka, K. Identification of phenomena accompanying the process of compressing natural polymers. Procedia Eng. 2017, 177, 369–374. [Google Scholar] [CrossRef]
- Mania, P.; Siuda, F.; Roszyk, E. Effect of Slope Grain on Mechanical Properties of Different Wood Species. Materials 2020, 13, 1503. [Google Scholar] [CrossRef]
- Mohammadabadi, M.; Jarvis, J.; Yadama, V.; Cofer, W. Predictive Models for Elastic Bending Behavior of a Wood Composite Sandwich Panel. Forests 2020, 11, 624. [Google Scholar] [CrossRef]
- Yan, W.; Fu, W.; Zhang, B.; Zhou, J. Hygrothermal Effect on Axial Compressive Properties of Bionic Bamboo Element. Wood Res. 2020, 65, 37–50. [Google Scholar] [CrossRef]
- Beery, W.H.; Ifju, G.; McLain, T.E. Quantitative wood anatomy—Relating anatomy to transverse tensile strength. Wood Fiber Sci. 2007, 15, 395–407. [Google Scholar]
- Bahmani, M.; Fathi, L.; Koch, G.; Kool, F.; Aghajani, H.; Humar, M. Heartwood and Sapwood Features Of Sorbus Torminalis Grown in Iranian Forests. Wood Res. 2020, 65, 195–204. [Google Scholar] [CrossRef]
- Dudík, R.; Borůvka, V.; Zeidler, A.; Holeček, T.; Riedl, M. Influence of Site Conditions and Quality of Birch Wood on Its Properties and Utilization after Heat Treatment. Part II—Surface Properties and Marketing Evaluation of the Effect of the Treatment on Final Usage of Such Wood. Forests 2020, 11, 556. [Google Scholar] [CrossRef]
- Chuchała, D.; Orłowski, K.; Ochrymiuk, T. The forecasted values of cutting power for sawing on band sawing machines for Polish Scots pine wood (Pinus sylvestris L.) in a function of its provenance. Ann. WULS For. Wood Technol. 2017, 99, 81–87. [Google Scholar]
- Tomczak, K.; Tomczak, A.; Jelonek, T. Effect of Natural Drying Methods on Moisture Content and Mass Change of Scots Pine Roundwood. Forests 2020, 11, 668. [Google Scholar] [CrossRef]
- Taghiyari, H.R.; Bayani, S.; Militz, H.; Papadopoulos, A.N. Heat Treatment of Pine Wood: Possible Effect of Impregnation with Silver Nanosuspension. Forests 2020, 11, 466. [Google Scholar] [CrossRef]
- Bal, B.C. A comparative study of some of the mechanical properties of pine wood heat treated in vacuum, nitrogen, and air atmospheres. BioResources 2018, 13, 5504–5511. [Google Scholar]
- Mannaa, M.; Han, G.; Jeon, H.W.; Kim, J.; Kim, N.; Park, A.R.; Kim, J.-C.; Seo, Y.-S. Influence of Resistance-Inducing Chemical Elicitors against Pine Wilt Disease on the Rhizosphere Microbiome. Microorganisms 2020, 8, 884. [Google Scholar] [CrossRef]
- Khanova, E.; Konovalov, V.; Timeryanov, A.; Isyanyulova, R.; Rafikova, D. Genetic and Selection Assessment of The Scots Pine (Pinus Sylvestris L.) In Forest Seed Orchards. Wood Res. 2020, 65, 283–292. [Google Scholar] [CrossRef]
- Özgüven, F.; Vursavuş, K. Some physical, mechanical and aerodynamic properties of pine (Pinus pinea) nuts. J. Food Eng. 2005, 68, 191–196. [Google Scholar]
- Esteves, B.; Marques, A.V.; Domingos, I.; Pereira, H. Influence of steam heating on the properties of pine (Pinus pinaster) and eucalypt (Eucalyptus globulus) wood. Sci. Technol. 2007, 41, 193. [Google Scholar] [CrossRef]
- Grazide, C.; Coureau, J.L.; Cointe, A.; Morel, S. Mechanical performance curves for the strength grading of maritime pine. Eur. J. Wood Wood Prod. 2018, 76, 877–888. [Google Scholar] [CrossRef]
- Groom, L.H.; Mott, L.; Shaler, S. Mechanical properties of individual southern pine fibers. Part I. Determination of variability of stress-strain curves with respect to tree height and juvenility. Wood Fiber Sci. 2002, 34, 14–27. [Google Scholar]
- Singha, A.S.; Thakur, V.K. Mechanical, morphological and thermal properties of pine needle-reinforced polymer composites. Int. J. Polym. Mater. 2008, 58, 21–31. [Google Scholar] [CrossRef]
- Orlowski, K.A.; Ochrymiuk, T.; Atkins, A.; Chuchala, D. Application of fracture mechanics for energetic effects predictions while wood sawing. Wood Sci. Tech. 2013, 47, 949–963. [Google Scholar] [CrossRef]
- Porankiewicz, B.; Axelsson, B.; Grönlund, A.A.; Marklund, B. Main and normal cutting forces by machining wood of Pinus sylvestris. BioResources 2011, 6, 3687–3713. [Google Scholar]
- Kopecký, Z.; Hlásková, L.; Orlowski, K.A. An innovative approach to prediction energetic effects of wood cutting process with circular-saw blades. Wood Res. 2014, 59, 827–834. [Google Scholar]
- Orlowski, K.A.; Ochrymiuk, T.; Hlaskova, L.; Chuchala, D.; Kopecky, Z. Revisiting the estimation of cutting power with different energetic methods while sawing soft and hard woods on the circular sawing machine: A Central European case. Wood Sci. Technol. 2020, 54, 457–477. [Google Scholar] [CrossRef]
- Orlowski, K.A.; Ochrymiuk, T. A newly-developed model for predicting cutting power during wood sawing with circular saw blades. Maderas Cienc. Tecnol. 2017, 19, 149–162. [Google Scholar] [CrossRef]
- Kuvik, T.; Krilek, J.; Kovác, J.; Štefánek, M.; Dvorak, J. Impact of the selected factors on the cutting force when using a chainsaw. Wood Res. 2017, 62, 807–814. [Google Scholar]
- Yu, S.T.; Yang, C.M.; Ren, C.Q.; Luo, G. Cutting force analysis of large branch crusher based on the finite element. Appl. Mech. Mater. 2012, 152, 900–905. [Google Scholar] [CrossRef]
- Džinčić, I.; Skakić, D. Determing the parameters of wood machinability as a function of tangential cutting force during the process of machining wood by routing. Wood Res. 2012, 57, 161–172. [Google Scholar]
- Mandić, M.D.; Porankiewicz, B.; Danon, G.J. An attempt at modelling of cutting forces in oak peripheral milling. BioResources 2015, 10, 5489–5502. [Google Scholar] [CrossRef][Green Version]
- Krauss, A.; Piernik, M.; Pinkowski, G. Cutting Power during Milling of Thermally Modified Pine Wood. Wood Ind./Drvna. Ind. 2016, 67, 215–222. [Google Scholar] [CrossRef]
- Durković, M.; Mladenović, G.; Tanović, L.; Danon, G. Impact of feed rate, milling depth and tool rake angle in peripheral milling of oak wood on the cutting force. Maderas. Cienc. Tecnol. 2018, 20, 25–34. [Google Scholar]
- Colantoni, A.; Mazzocchi, F.; Laurendi, V.; Grigolato, S.; Monarca, F.; Monarca, D.; Cecchini, M. Innovative solution for reducing the run-down time of the chipper disc using a brake clamp device. Agriculture 2017, 7, 71. [Google Scholar] [CrossRef]
- Choi, Y.S.; Cho, M.J.; Paik, S.H.; Mun, H.S.; Kim, D.H.; Han, S.K.; Oh, J.H. Factors affecting the chipping operation based on the screen size of the drum chipper. Forests 2019, 10, 1029. [Google Scholar] [CrossRef]
- Manzone, M.; Balsari, P. Productivity and woodchip quality of different chippers during poplar plantation harvesting. Biomass Bioenergy 2015, 83, 278–283. [Google Scholar] [CrossRef]
- Kuptz, D.; Hartmann, H. Throughput rate and energy consumption during wood chip production in relation to raw material, chipper type and machine setting. In Proceedings of the 22nd European Biomass Conference and Exhibition, Hamburg, Germany, 23–26 June 2014. [Google Scholar]
- Ihnat, V.; Lübke, H.; Balbercak, J.; Kuňa, V. Size Reduction Downcycling of Waste Wood. Review. Wood Res. 2020, 65, 205–220. [Google Scholar] [CrossRef]
- Dudziak, M.; Malujda, I.; Talaśka, K.; Łodygowski, T.; Sumelka, W. Analysis of the process of wood plasticization by hot rolling. J. Theor. Appl. Mech. 2016, 54, 503–516. [Google Scholar] [CrossRef][Green Version]
- Talaśka, K.; Malujda, I. Identification of thermo-mechanical properties of natural polymers with a hybrid method. Eng. Trans. 2016, 64, 635–641. [Google Scholar]
- Ritschel, F.; Brunner, A.J.; Niemz, P. Nondestructive evaluation of damage accumulation in tensile test specimens made from solid wood and layered wood materials. Compos. Struct. 2013, 95, 44–52. [Google Scholar] [CrossRef]
- Kokociński, W. Wood Physical and Chemical Properties Measurements. Drewno Pomiry Właściwości Fizycznych Ichemicznych; PRODRUK: Poznań, Poland, 2004; ISBN 83-88518-75-52004. (In Polish) [Google Scholar]
- Bodig, J.; Jayne, B. Mechanics of Wood and Wood Composites; Krieger Publishing Company: Malabar, FL, USA, 1993. [Google Scholar]
- Bachtiar, E.V. Material Characterization of Wood, Adhesive and Coating of Cultural Heritage Under Various Climatic Conditions. Ph.D. Thesis, Dresden University of Technology, Dresden, Germany, 2017. [Google Scholar]
- Keunecke, D. Elasto-Mechanical Characterisation of Yew and Spruce Wood with Regard to Structure-Property Relationships. Ph.D. Thesis, University of Hamburg, Hamburg, Germany, 2008. [Google Scholar]
- Aira, J.R.; Arriaga, F.; Íñiguez-González, G.; Crespo, J. Static and kinetic friction coefficients of Scots pine (Pinus sylvestris L.), parallel and perpendicular to grain direction. Mater. Construcción 2014, 64, e030. [Google Scholar] [CrossRef]
- Kretschmann, D. Mechanical Properties of Wood. Wood Handbook: Wood as an Engineering Material: Chapter 5; General Technical Report FPL.; GTR-190; Centennial, Ed.; Department of Agriculture, Forest Service, Forest Products Laboratory: Madison, WI, USA, 2010; pp. 5.1–5.46. [Google Scholar]
- Holmberg, S.; Persson, K.; Petersson, H. Nonlinear mechanical behaviour and analysis of wood and fibre materials. Comput. Struct. 1999, 72, 459–480. [Google Scholar] [CrossRef]
- Garcia, J.J.; Rangel, C.; Ghavami, K. Experiments with rings to determine the anisotropic elastic constants of bamboo. Constr. Build. Mater. 2012, 31, 52–57. [Google Scholar] [CrossRef]
- Vasic, S.; Smith, I.; Landis, E. Finite element techniques and models for wood fracture mechanics. Wood Sci. Technol. 2005, 39, 3–17. [Google Scholar] [CrossRef]
- Torres, L.A.; Ghavami, K.; Garcia, J.J. A transversely isotropic law for the determination of the circumferential youngs modulus of bamboo with diametric compression tests. Latin Am. Res. 2007, 37, 255–260. [Google Scholar]
- Roszyk, E.; Moliński, W.; Fabisiak, E. Radial variation of mechanical properties of pine wood (Pinus sylvestris L.) determined upon tensile stress. Wood Res. 2013, 58, 329–342. [Google Scholar]
- Roszyk, E.; Moliński, W.; Kamiński, M. Tensile properties along the grains of earlywood and latewood of Scots pine (Pinus sylvestris L.) in dry and wet state. BioResources 2016, 11, 3027–3037. [Google Scholar] [CrossRef][Green Version]
- Krauss, A.; Moliński, W.; Kúdela, J.; Čunderlík, I. Differences in the mechanical properties of early and latewood within individual annual rings in dominant pine tree (Pinus sylvestris L.). Wood Res. 2011, 56, 1–12. [Google Scholar]
- van Beerschoten, W.A.; Carradine, D.M.; Palermo, A. Compressive strength and stiffness of Radiata Pine laminated veneer lumber. Eur. J. Wood Wood Prod. 2013, 71, 795–804. [Google Scholar] [CrossRef]
- Yapıcı, F.; Esen, R.; Erkaymaz, O.; Baş, H. Modeling of compressive strength parallel to grain of heat treated scotch pine (Pinus sylvestris L.) wood by using artificial neural network. Drv. Ind. Znan. Casopis Pitanja Drv. Tehnol. 2015, 66, 347–352. [Google Scholar]
- Tasdemir, C.; Hiziroglu, S. Measurement of various properties of Southern pine and aspen as function of heat treatment. Measurement 2014, 49, 91–98. [Google Scholar] [CrossRef]
- Sága, M.; Majko, J.; Handrik, M.; Vaško, M.; Sapietová, A. Proposal of Physical Model for Damage Simulation of Composite Structures Produced by 3D Printing. Acta Phys. Pol. A 2020, 138, 245–248. [Google Scholar] [CrossRef]
- Sága, M.; Blatnický, M.; Vaško, M.; Dižo, J.; Kopas, P.; Gerlici, J. Experimental Determination of the Manson−Coffin Curves for an Original Unconventional Vehicle Frame. Materials 2020, 13, 4675. [Google Scholar] [CrossRef]
- Hu, W.; Liu, N.; Guan, H. Experimental and Numerical Study on Methods of Testing Withdrawal Resistance of Mortise-and-Tenon Joint for Wood Products. Forests 2020, 11, 280. [Google Scholar] [CrossRef]
- Kilikevičius, A.; Bačinskas, D.; Selech, J.; Matijošius, J.; Kilikevičienė, K.; Vainorius, D.; Ulbrich, D.; Romek, D. The Influence of Different Loads on the Footbridge Dynamic Parameters. Symmetry 2020, 12, 657. [Google Scholar] [CrossRef]
- Jancar, L.; Pagac, M.; Mesicek, J.; Stefek, P. Design Procedure of a Topologically Optimized Scooter Frame Part. Symmetry 2020, 12, 755. [Google Scholar] [CrossRef]
- Pravilonis, T.; Sokolovskij, E.; Kilikevičius, A.; Matijošius, J.; Kilikevičienė, K. The Usage of Alternative Materials to Optimize Bus Frame Structure. Symmetry 2020, 12, 1010. [Google Scholar] [CrossRef]
- Kilikevičius, A.; Skeivalas, J.; Kilikevičienė, K.; Matijošius, J. Analysis of Dynamic Parameters of a Railway Bridge. Appl. Sci. 2019, 9, 2545. [Google Scholar] [CrossRef]
- Krawiec, P.; Grzelka, M.; Kroczak, J.; Domek, G.; Kołodziej, A. A proposal of measurement methodology and assessment of manufacturing methods of nontypical cog belt pulleys. Measurement 2019, 132, 182–190. [Google Scholar] [CrossRef]
- Krawiec, P.; Różański, L.; Czarnecka-Komorowska, D.; Warguła, Ł. Evaluation of the Thermal Stability and Surface Characteristics of Thermoplastic Polyurethane V-Belt. Materials 2020, 13, 1502. [Google Scholar] [CrossRef] [PubMed]
- Zhou, Y.; Sun, Y.; Huang, T. Impact-Damage Equivalency for Twisted Composite Blades with Symmetrical Configurations. Symmetry 2019, 11, 1292. [Google Scholar] [CrossRef]
- Hu, W.; Liu, N. Numerical and Optimal Study on Bending Moment Capacity and Stiffness of Mortise-and-Tenon Joint for Wood Products. Forests 2020, 11, 501. [Google Scholar] [CrossRef]
- Wojtkowiak, D.; Talaśka, K.; Malujda, I.; Domek, G. Estimation of the perforation force for polymer composite conveyor belts taking into consideration the shape of the piercing punch. Int. J. Adv. Manuf. Technol. 2018, 98, 2539–2561. [Google Scholar] [CrossRef]
- Gonzalo, O.; Jauregi, H.; Uriarte, L.G.; de Lacalle, L.L. Prediction of specific force coefficients from a FEM cutting model. Int. J. Adv. Manuf. Technol. 2009, 43, 348. [Google Scholar] [CrossRef]
- Handrik, M.; Sága, M.; Pecháč, P.; Kopas, P. Analysis of force conditions of the hot forming machine in rolling-out of bearing ring. Manuf. Technol. 2015, 15, 821–825. [Google Scholar] [CrossRef]
- Wojtkowiak, D.; Talaśka, K. Determination of the effective geometrical features of the piercing punch for polymer composite belts. Int. J. Adv. Manuf. Technol. 2019, 104, 315–332. [Google Scholar] [CrossRef]


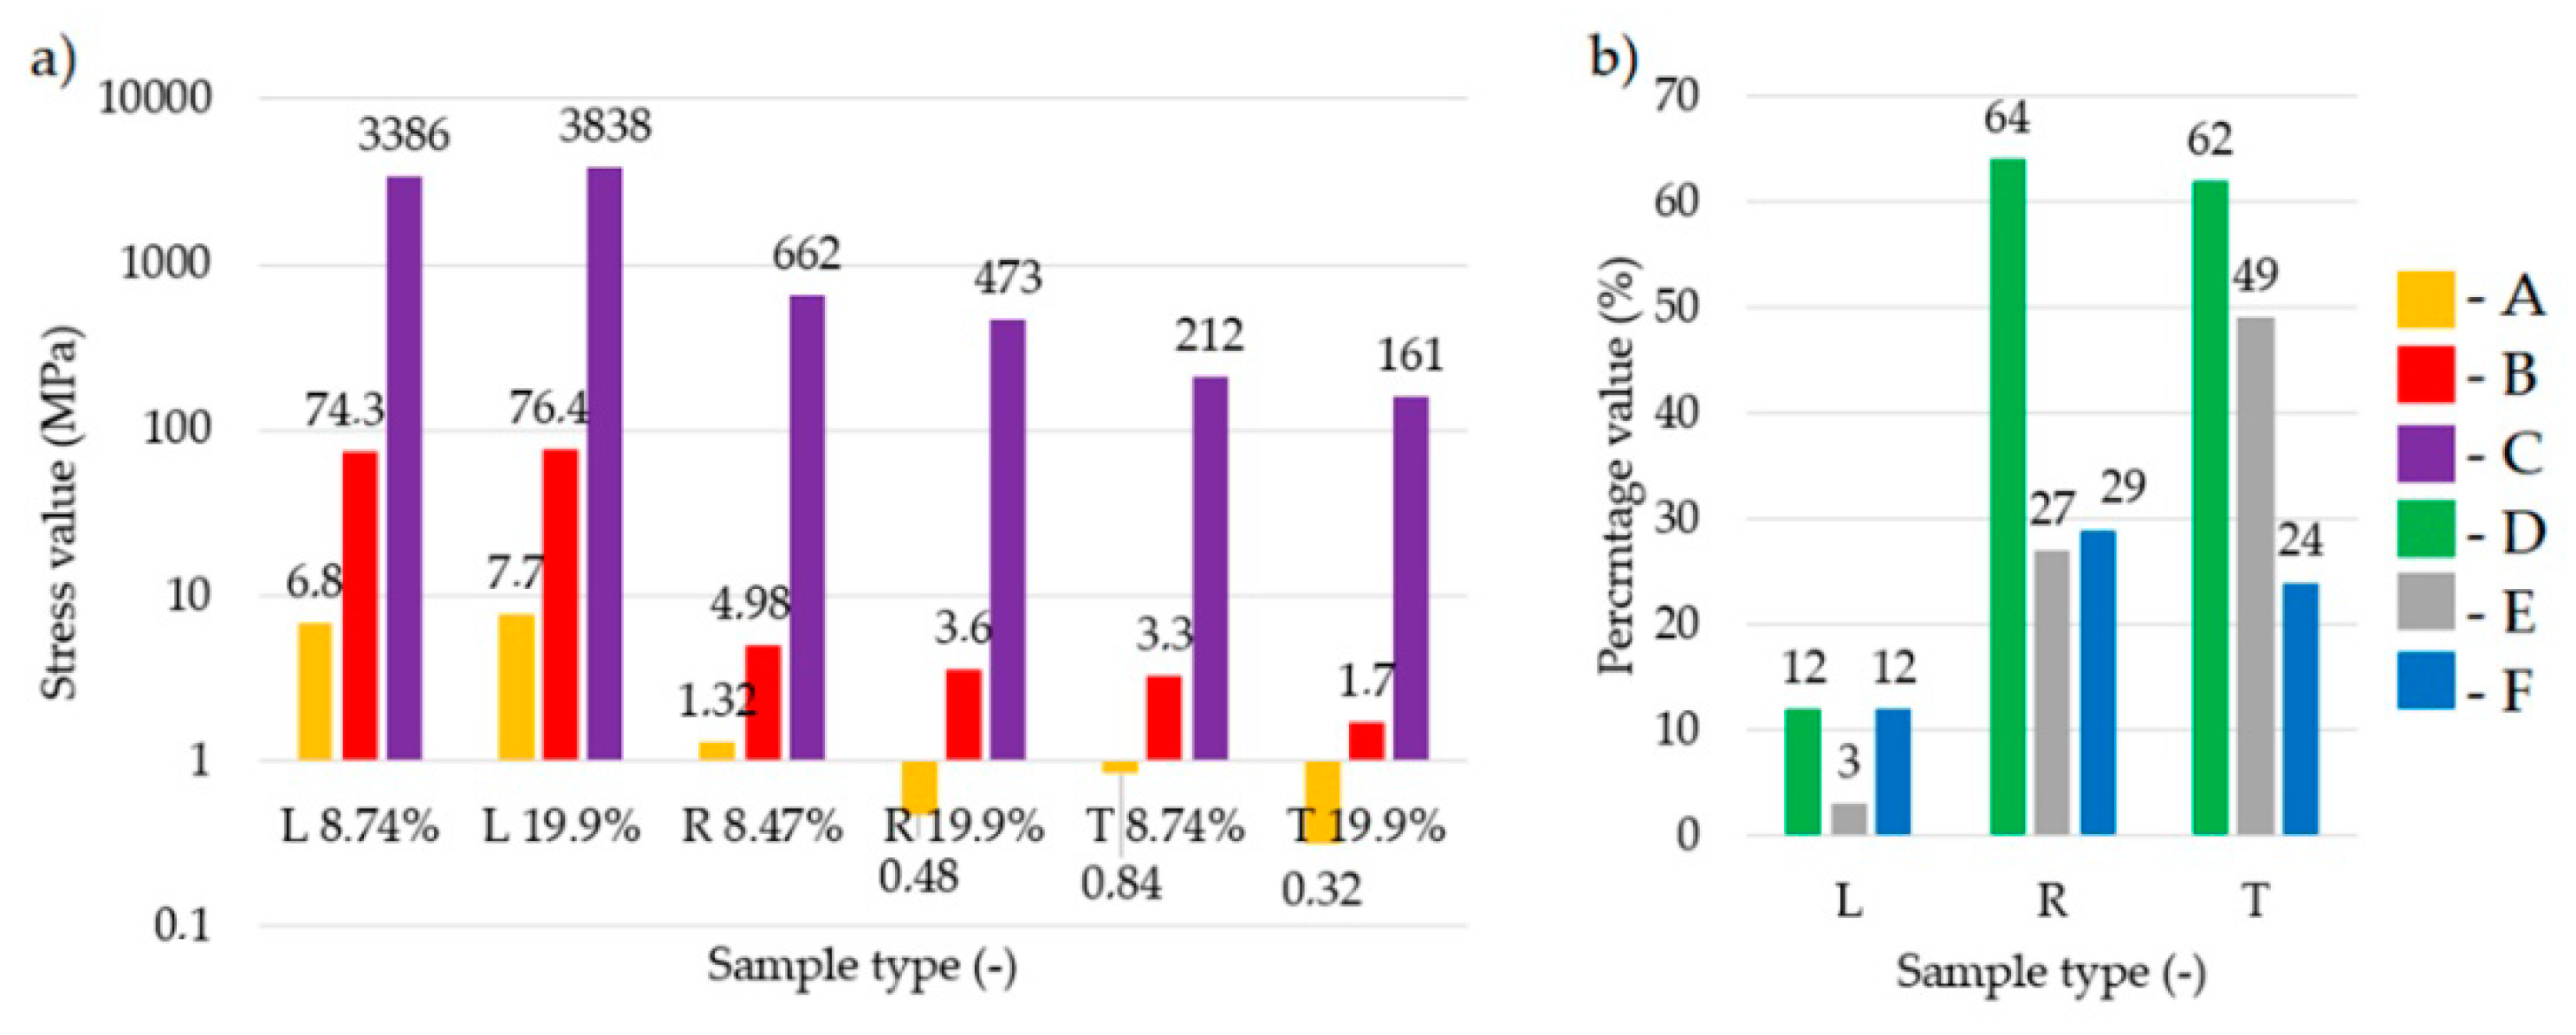
| Direction (Tensile) | L | R | T | |||
|---|---|---|---|---|---|---|
| Sample Type | 1 | 2 | 1 | 2 | 1 | 2 |
| Moisture content [%] | 8.74 | 19.90 | 8.74 | 19.90 | 8.74 | 19.90 |
| Cross-section area [mm2] | 80 | 80 | 100 | 100 | 100 | 100 |
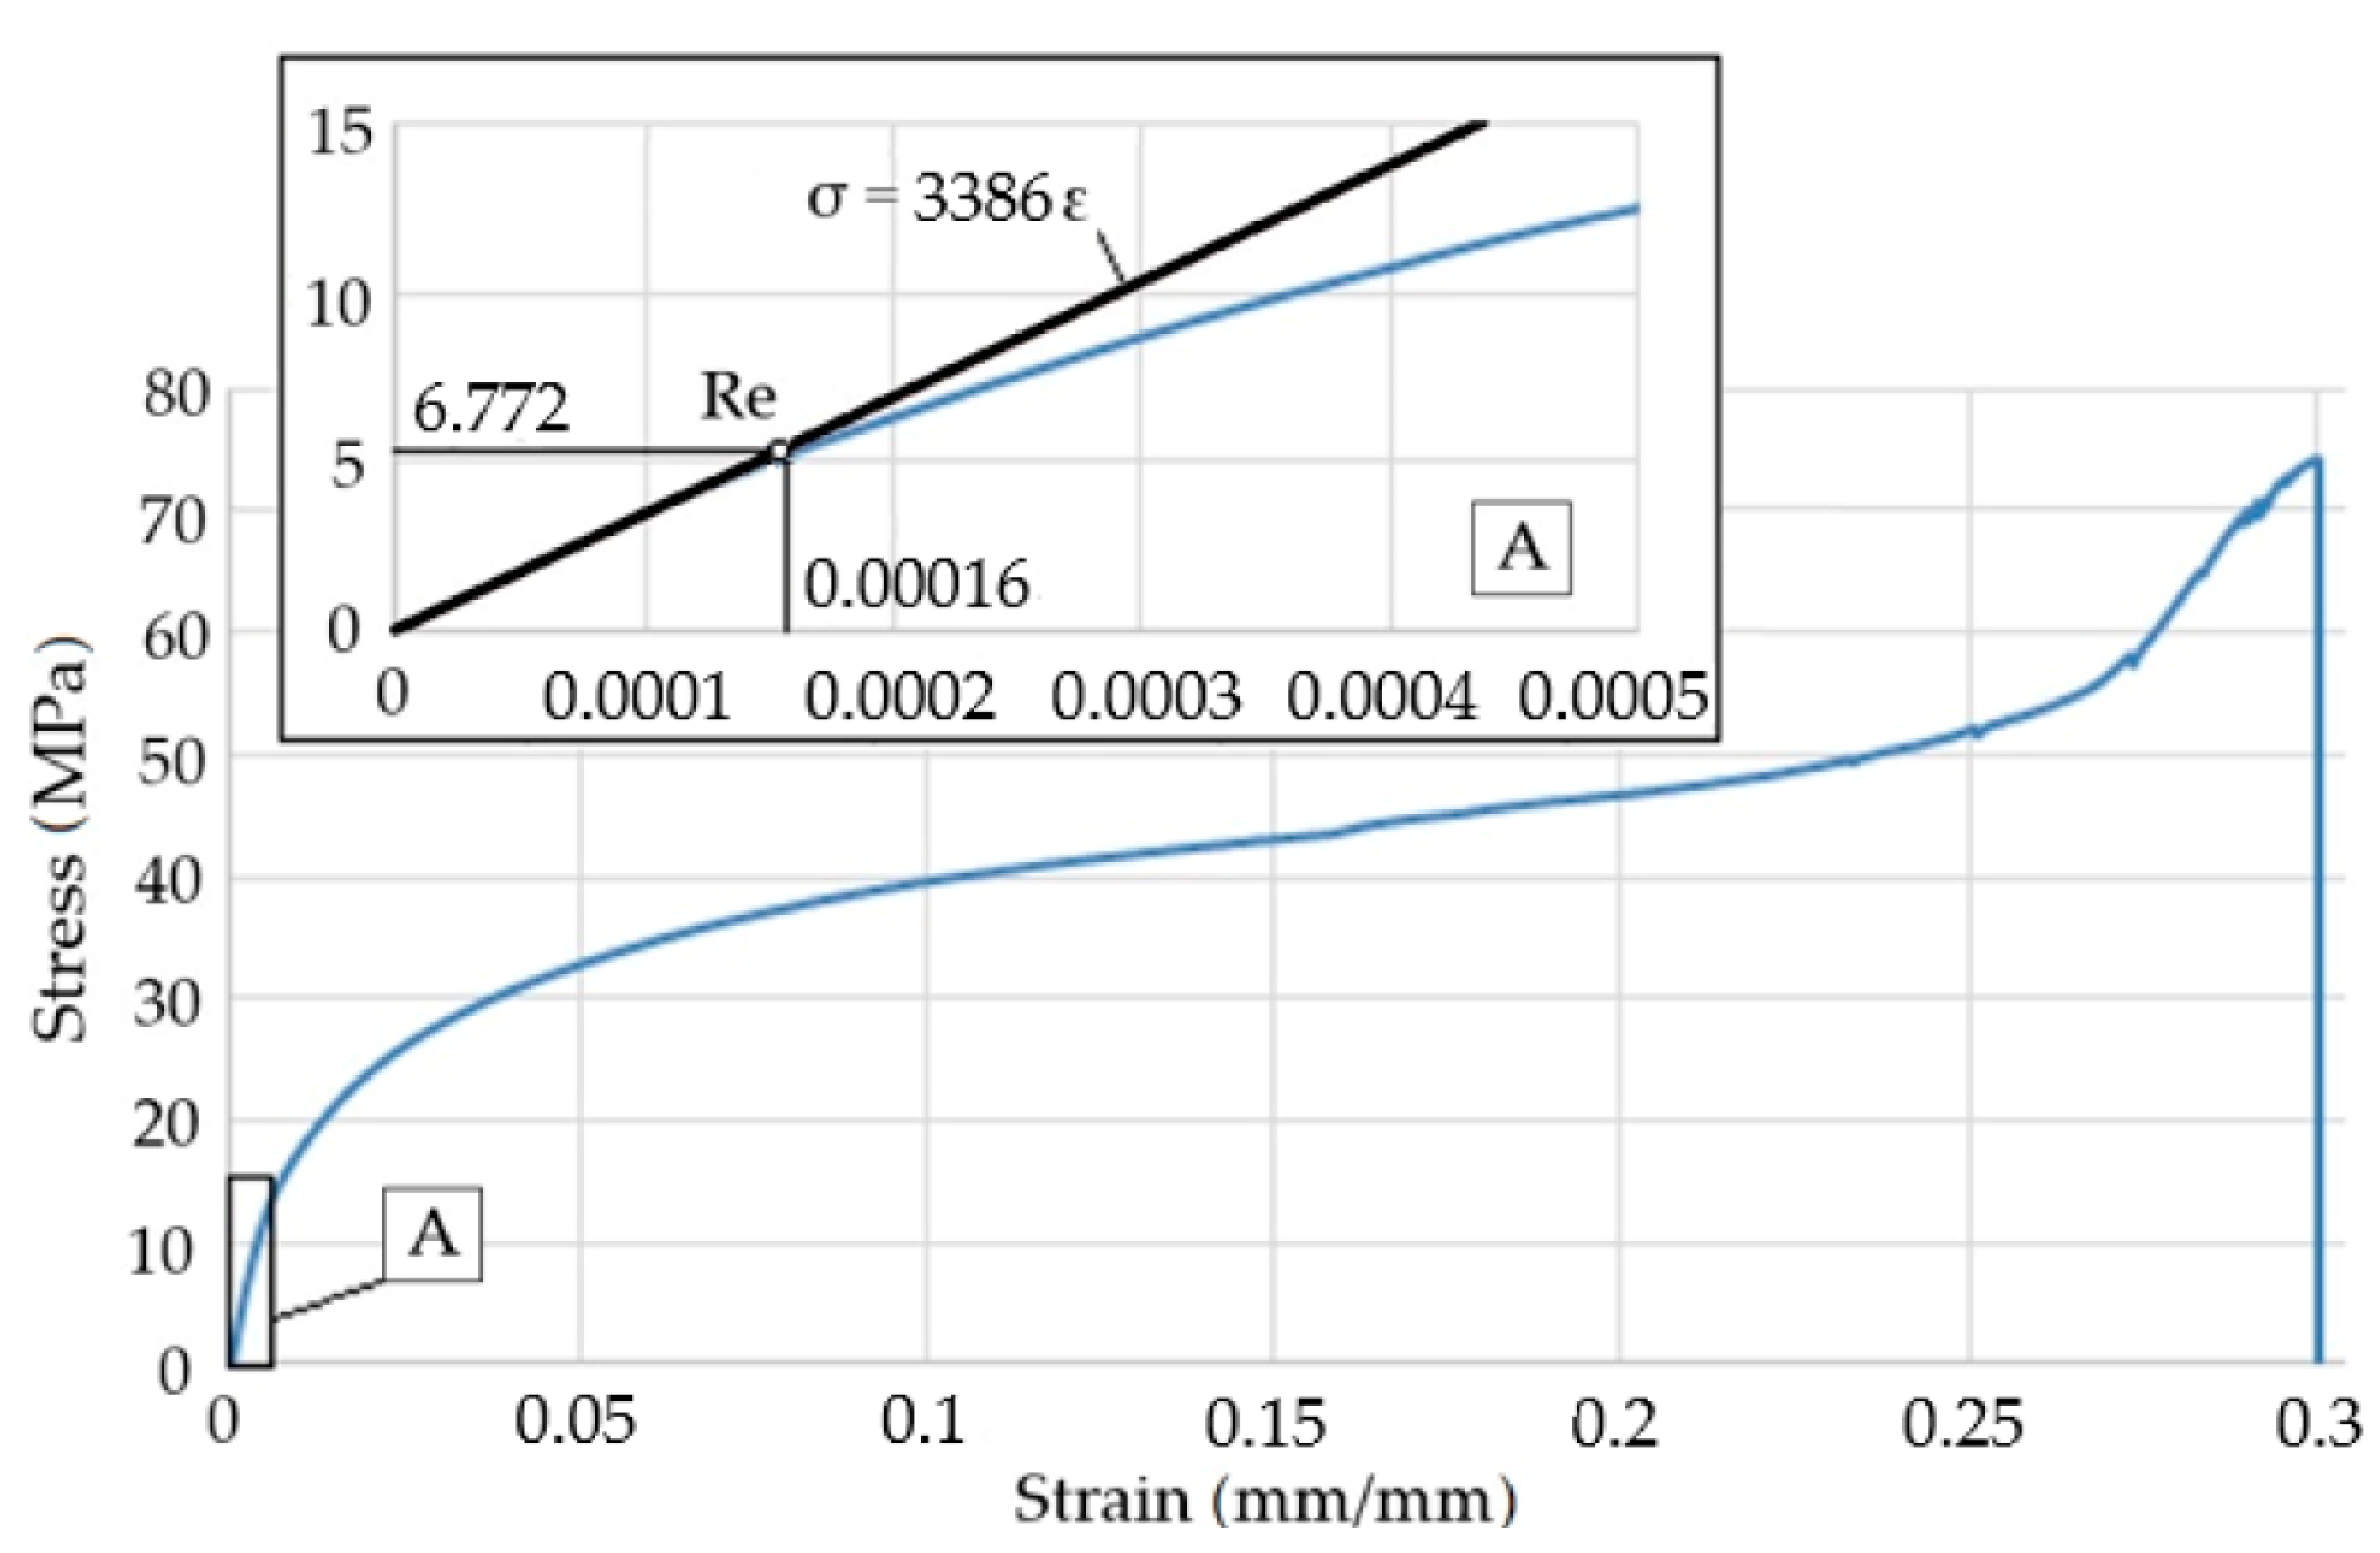
| Yield point [MPa] | 7.675 | 6.772 | 1.324 | 0.473 | 0.84 | 0.32 |
| Standard deviation | 0.25 | 0.21 | 0.09 | 0.03 | 0.02 | 0.02 |
| Deformation [%] | 0.0022 | 0.0018 | 0.0028 | 0.0018 | 0.0048 | 0.0030 |
| Standard deviation | 0.0002 | 0.0002 | 0.0002 | 0.0002 | 0.0002 | 0.0002 |
| Tensile strength [MPa] | 76.39 | 74.28 | 4.98 | 3.63 | 3.28 | 1.68 |
| Standard deviation | 18.64 | 19.32 | 0.55 | 0.25 | 0.43 | 0.22 |
| Deformation [%] | 0.16 | 0.27 | 0.009 | 0.011 | 0.018 | 0.015 |
| Standard deviation | 0.03 | 0.04 | 0.0004 | 0.0005 | 0.0018 | 0.0007 |
| Modulus of elasticity [MPa] | 3838 | 3386 | 662 | 473 | 212 | 161 |
| Standard deviation | 5.66 | 4.52 | 2.34 | 2.55 | 2.71 | 3.12 |
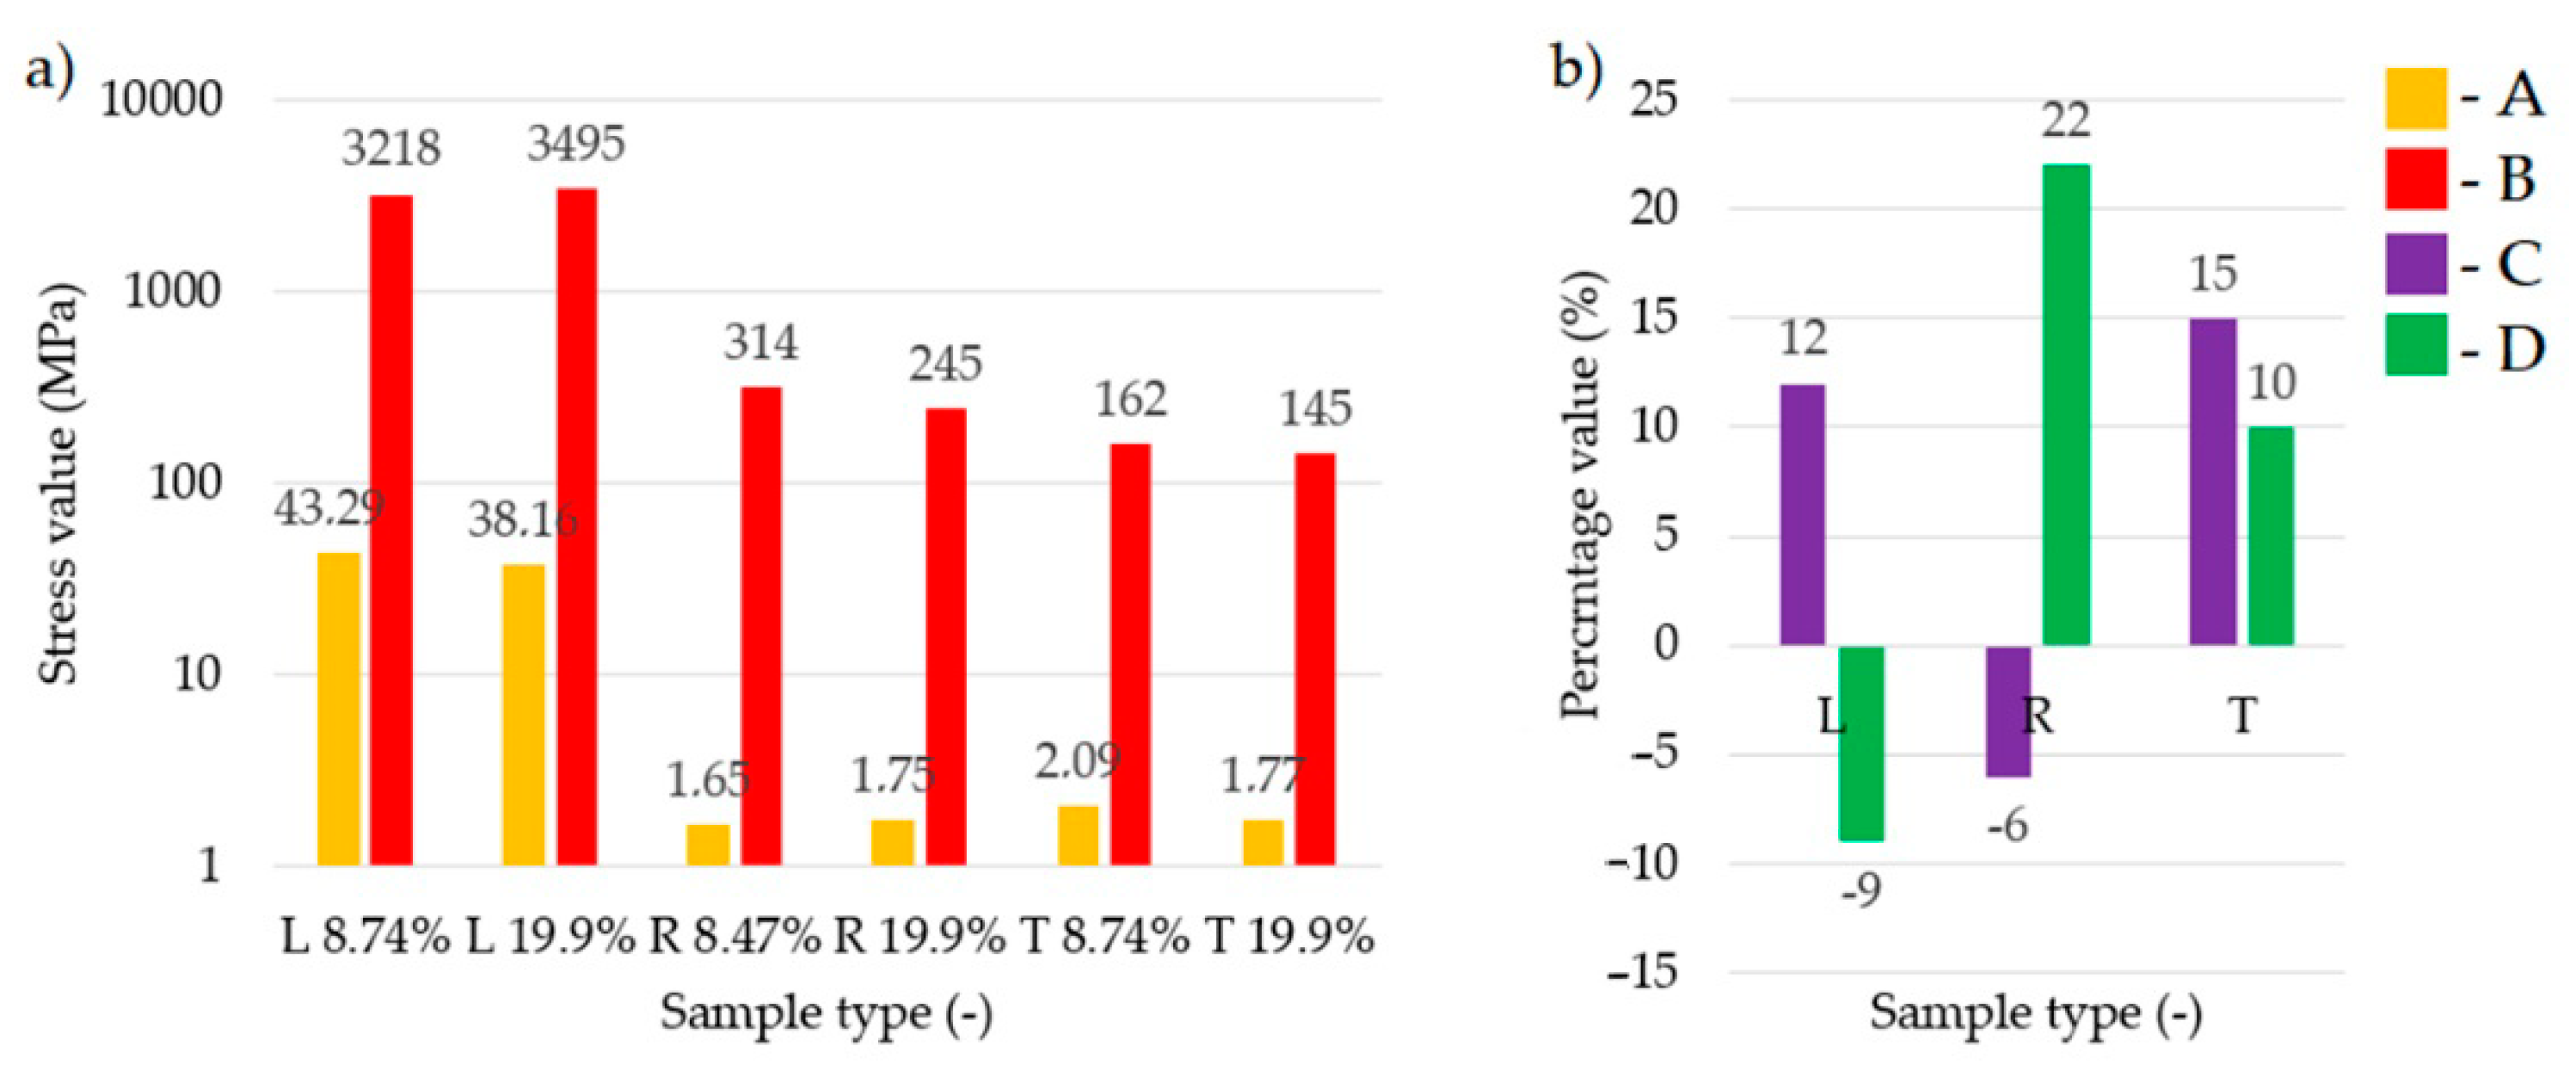
| Direction (Compression) | L | R | T | |||
|---|---|---|---|---|---|---|
| Sample Type | 1 | 2 | 1 | 2 | 1 | 2 |
| Moisture content [%] | 8.74 | 19.90 | 8.74 | 19.90 | 8.74 | 19.90 |
| Cross-section area [mm2] | 400 | 400 | 400 | 400 | 400 | 400 |
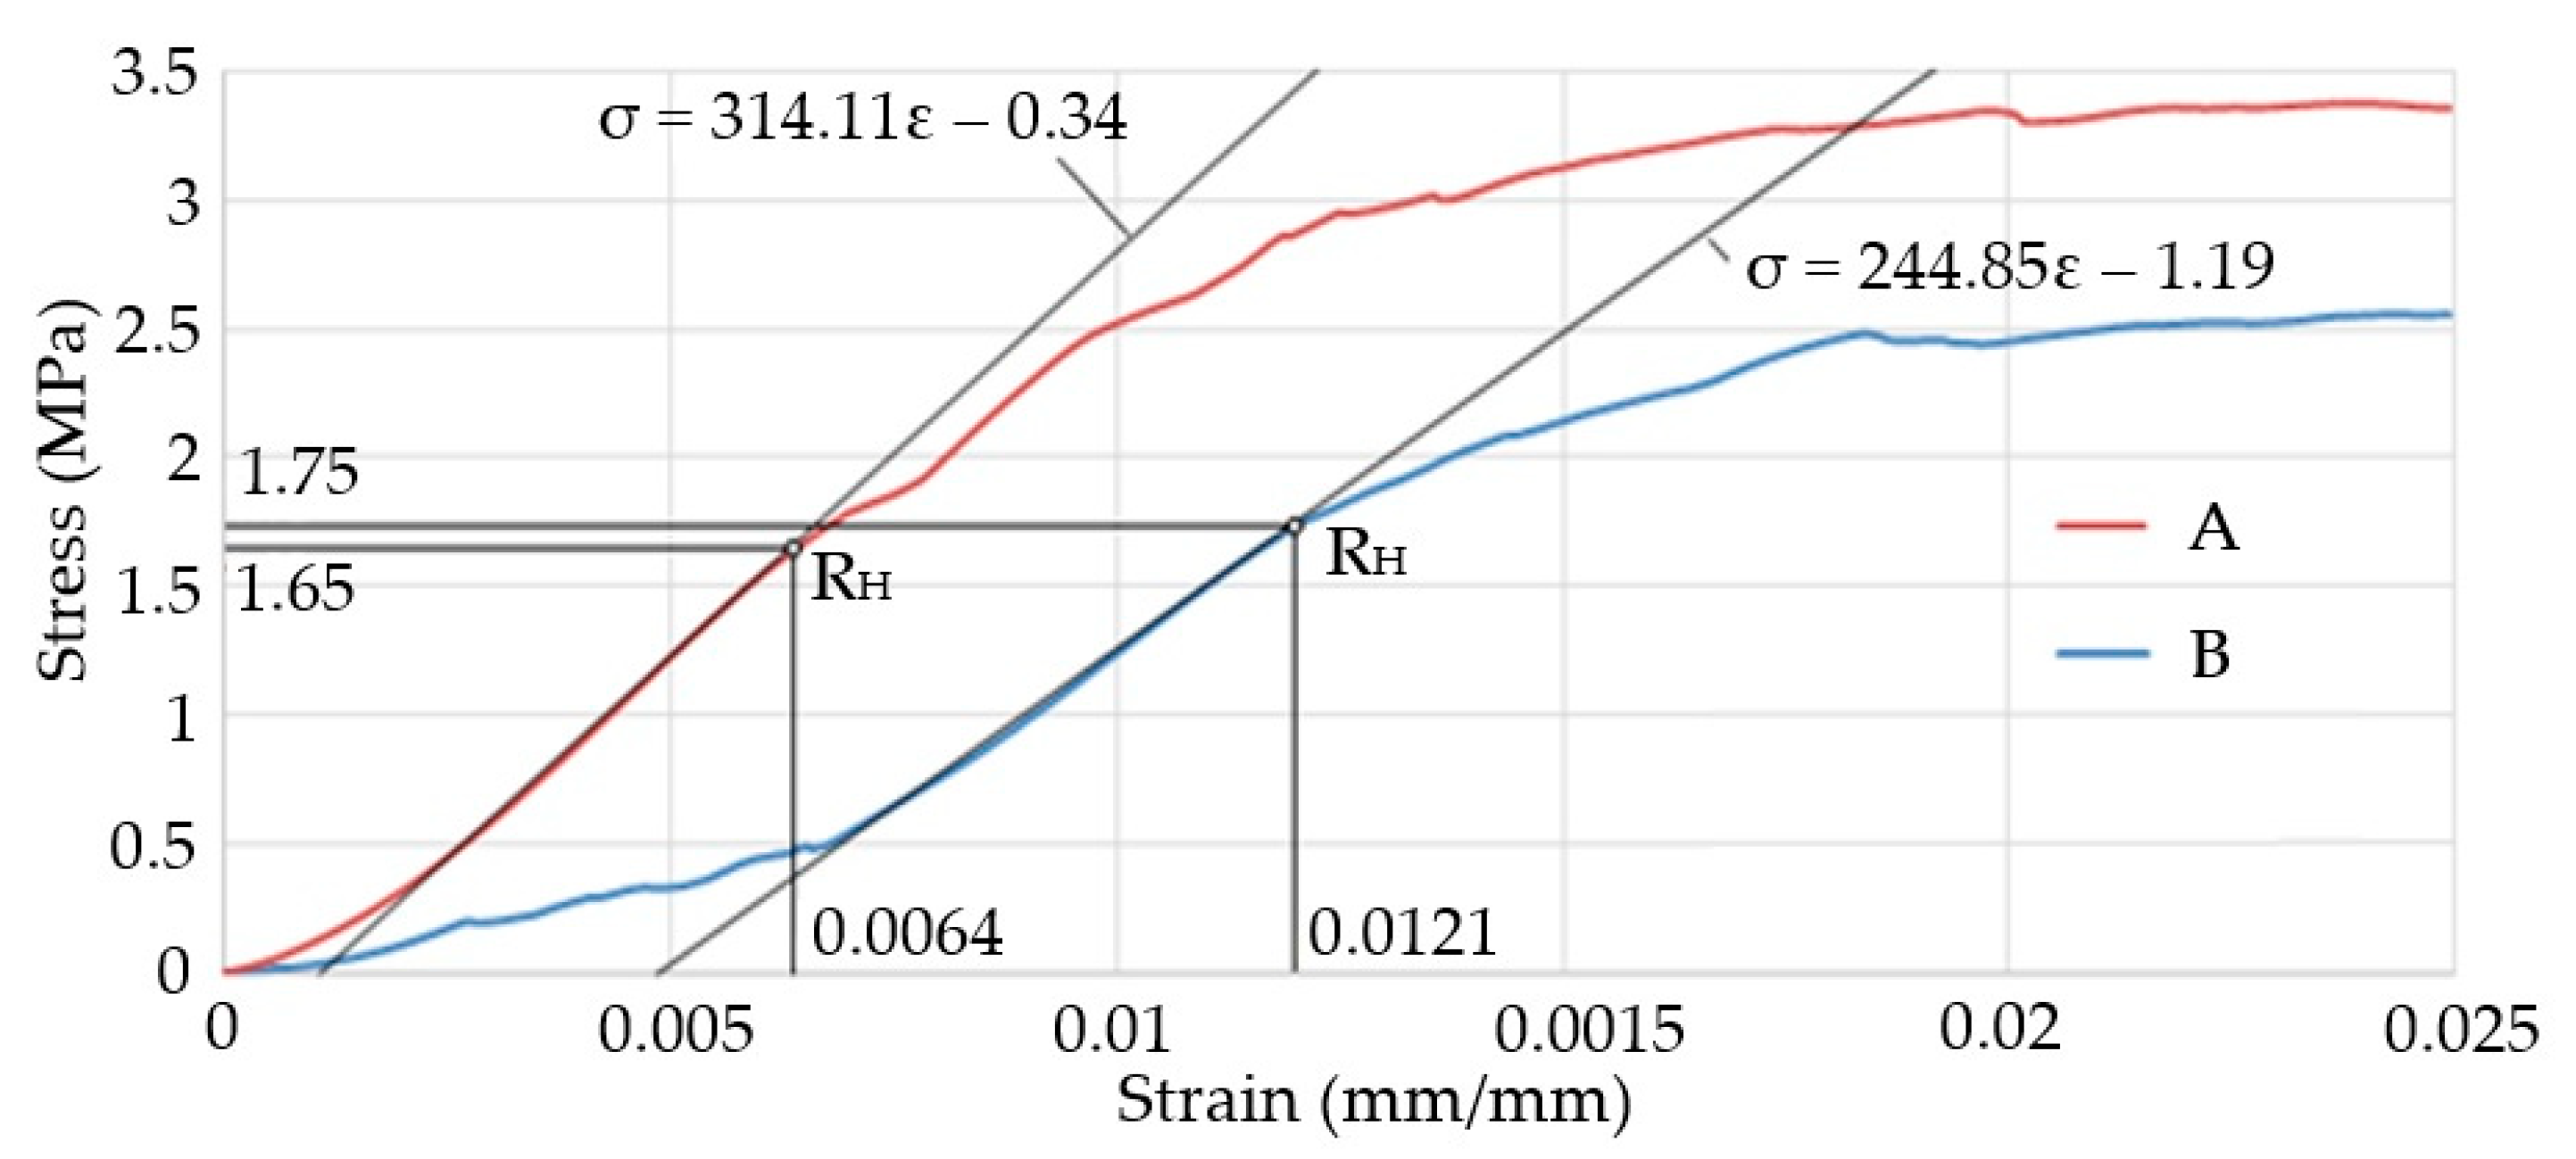
| The limit of proportionality [MPa] | 43.29 | 38.16 | 1.65 | 1.75 | 2.09 | 1.77 |
| Standard deviation | 5.1 | 2.8 | 0.24 | 0.33 | 0.19 | 0.15 |
| Deformation [%] | 1.86 | 1.63 | 0.64 | 1.21 | 1.72 | 1.78 |
| Standard deviation | 5.1 | 2.8 | 0.24 | 0.33 | 0.19 | 0.15 |
| Modulus of elasticity [MPa] | 3218 | 3495 | 314 | 245 | 162 | 145 |
| Standard deviation | 5.1 | 2.8 | 0.24 | 0.33 | 0.19 | 0.15 |
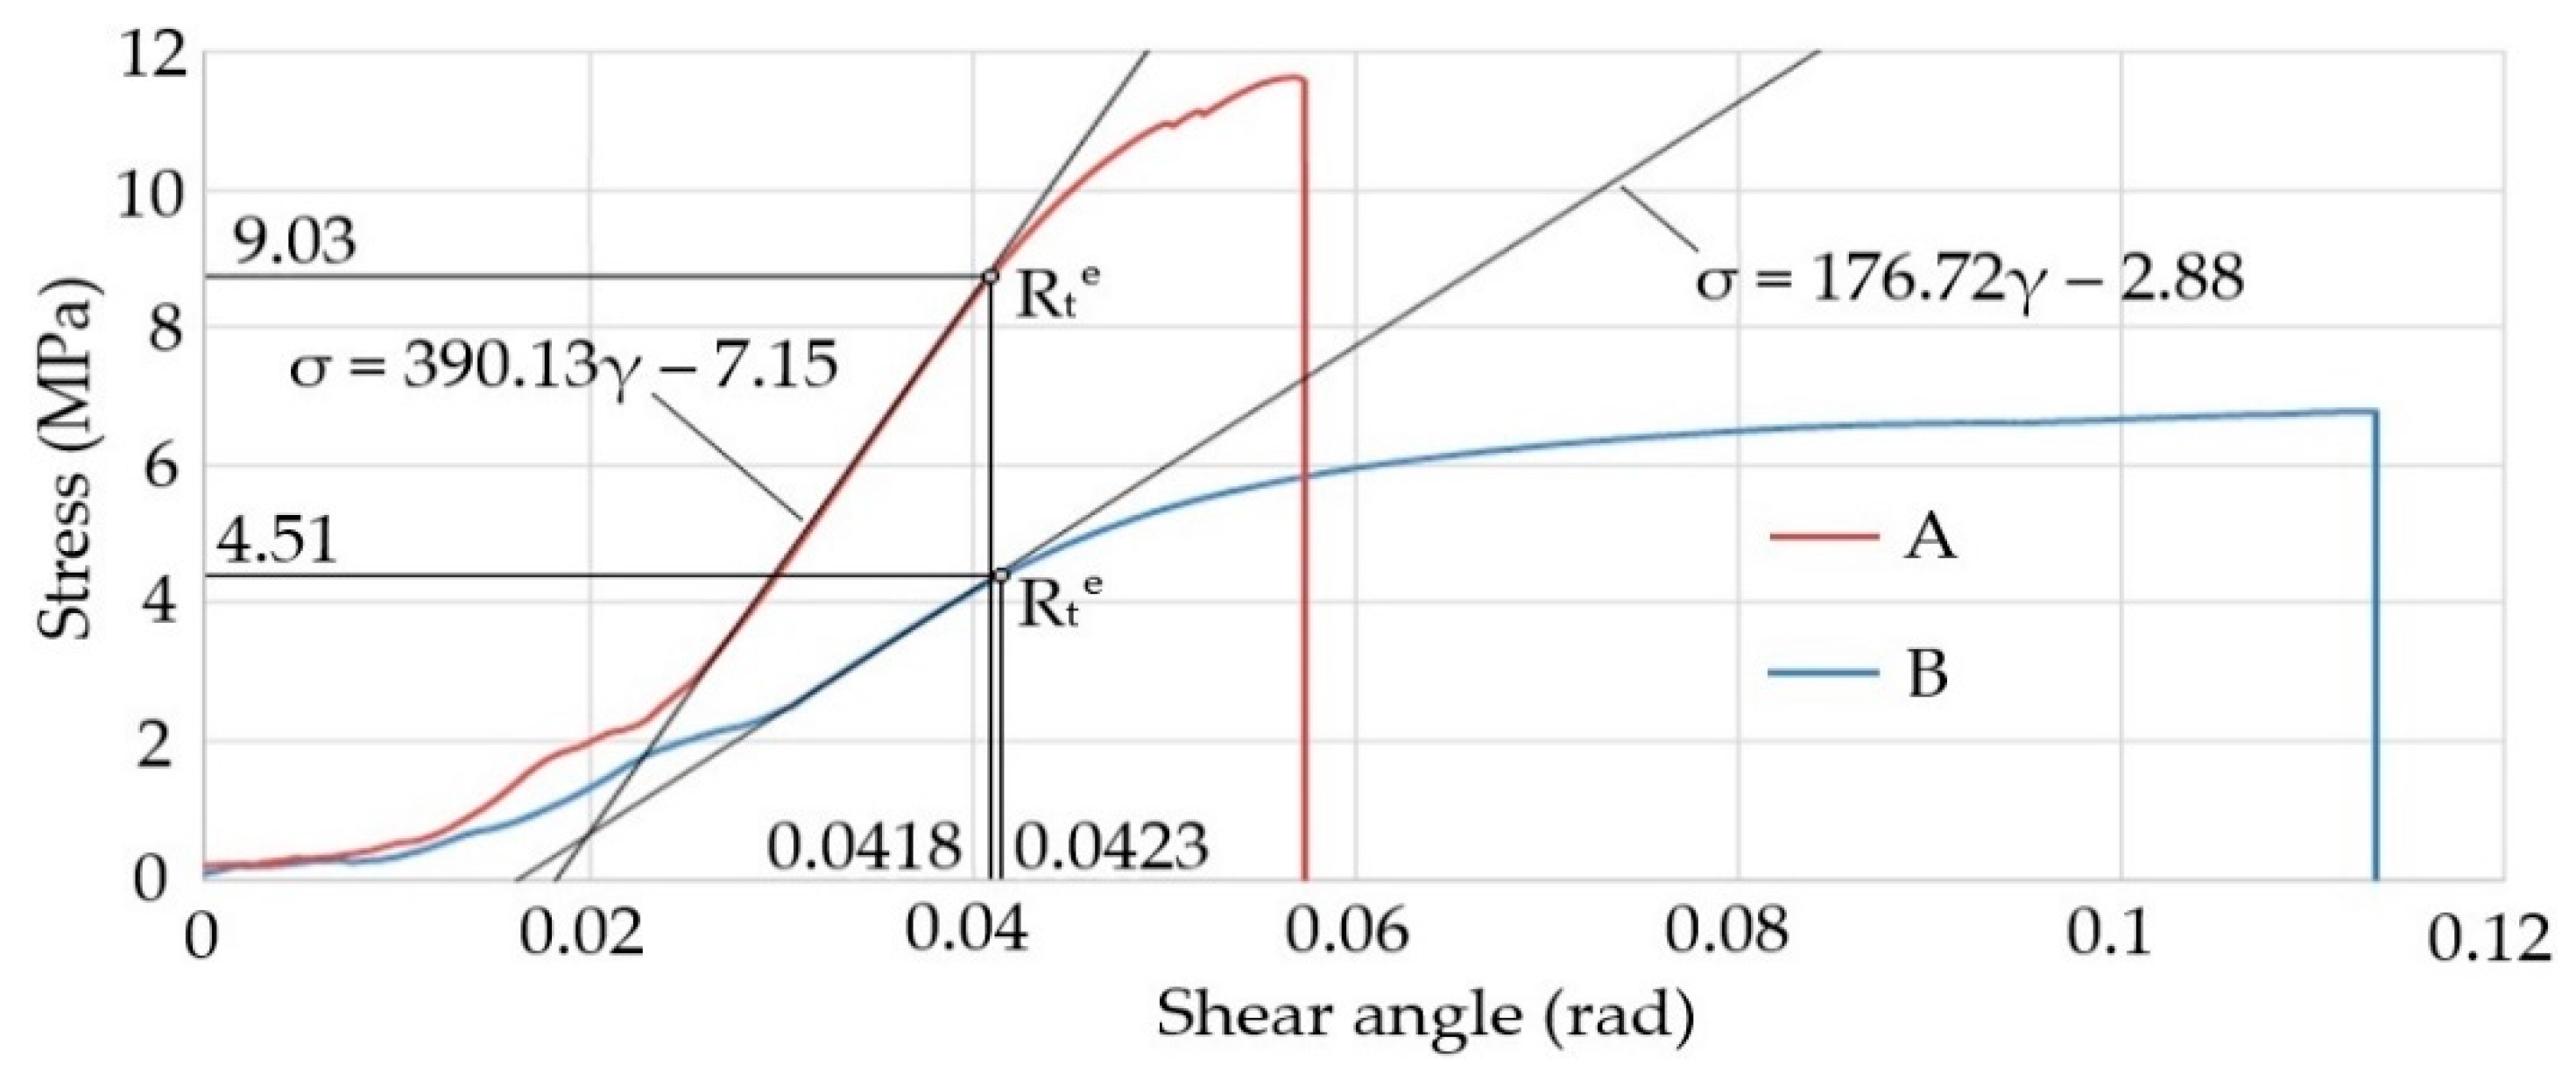
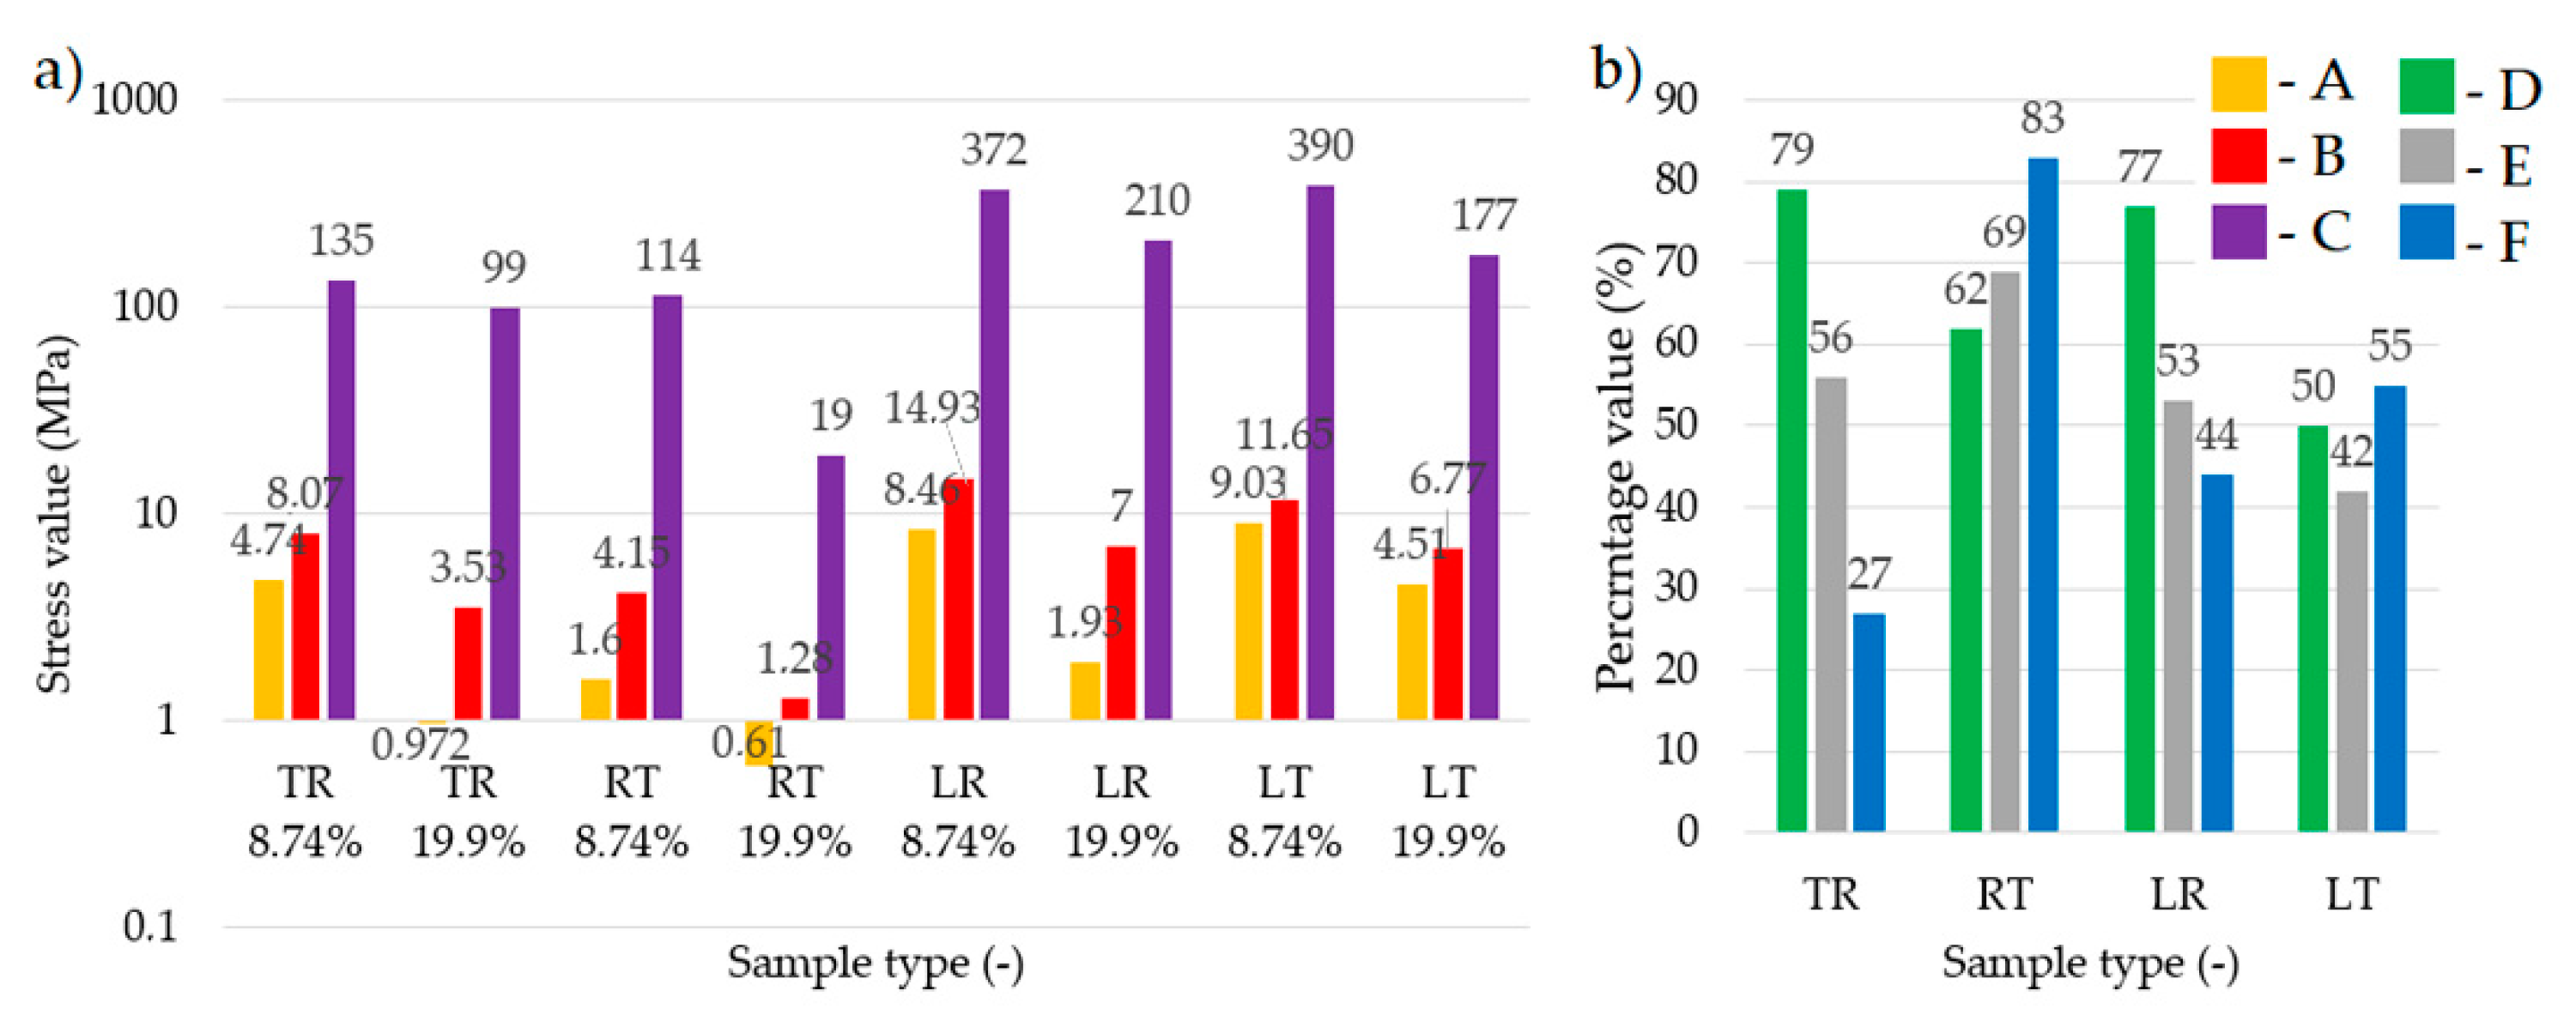
| Direction (Shear) | TR | RT | LR | LT | ||||
|---|---|---|---|---|---|---|---|---|
| Sample Type | 1 | 2 | 1 | 2 | 1 | 2 | 1 | 2 |
| Moisture content [%] | 8.74 | 19.90 | 8.74 | 19.90 | 8.74 | 19.90 | 8.74 | 19.90 |
| Cross section area [mm2] | 400 | 400 | 400 | 400 | 400 | 400 | 400 | 400 |
| Yield point for shearing test [MPa] | 4.74 | 0.972 | 1.60 | 0.61 | 8.46 | 1.93 | 9.03 | 4.51 |
| Standard deviation | 0.14 | 0.21 | 0.23 | 0.28 | 0.12 | 0.11 | 0.21 | 0.24 |
| Deformation [%] | 9.95 | 1.74 | 2.49 | 4.88 | 3.88 | 1.88 | 4.18 | 4.23 |
| Standard deviation | 0.19 | 0.20 | 0.22 | 0.43 | 0.16 | 0.33 | 0.22 | 0.23 |
| Shear strength | 8.07 | 3.53 | 4.15 | 1.28 | 14.93 | 7.01 | 11.65 | 6.77 |
| Standard deviation | 0.54 | 0.61 | 1.04 | 0.34 | 1.09 | 0.71 | 1.32 | 0.92 |
| Deformation [%] | 18.30 | 12.76 | 12.33 | 17.78 | 9.51 | 10.43 | 5.74 | 11.32 |
| Standard deviation | 1.73 | 2.81 | 2.45 | 3.03 | 2.52 | 0.74 | 0.75 | 2.98 |
| Shear modulus [MPa] | 135 | 99 | 114 | 19 | 372 | 210 | 390 | 177 |
| Standard deviation | 2.14 | 3.21 | 4.67 | 8.9 | 5.13 | 4.48 | 2.12 | 5.61 |
| Mechanical Parameters | Moduli of Elasticity | Poisson’s Ratios | Shear Moduli | ||||||
|---|---|---|---|---|---|---|---|---|---|
| Engineering Constants | E1 [MPa] | E2 [MPa] | E3 [MPa] | ν12 [-] | ν13 [-] | ν23 [-] | G12 [MPa] | G13 [MPa] | G23 [MPa] |
| Extension 8.74% (MC) | 3838 | 662 | 212 | 0.332 | 0.365 | 0.384 | 272.5 | 230.3 | 46.1 |
| Extension 19.9% (MC) | 3386 | 473 | 161 | 0.392 | 0.444 | 0.447 | 186.2 | 179.5 | 33.9 |
| Mechanical Parameters | Moduli of Elasticity | Poisson’s Ratios | Shear Moduli | ||||||
|---|---|---|---|---|---|---|---|---|---|
| Engineering Constants | E1 [MPa] | E2 [MPa] | E3 [MPa] | ν12 [-] | ν13 [-] | ν23 [-] | G12 [MPa] | G13 [MPa] | G23 [MPa] |
| Compression 8.74% (MC) | 3218 | 314 | 162 | 0.332 | 0.365 | 0.384 | 372 | 390 | 114 |
| Compression 19.9% (MC) | 3495 | 245 | 145 | 0.28 | 0.364 | 0.389 | 210 | 177 | 19 |
| Mechanical Parameters | Moduli of Elasticity | Poisson’s Ratios | Shear Moduli | ||||||
|---|---|---|---|---|---|---|---|---|---|
| Engineering Constants | E1 [MPa] | E2 [MPa] | E3 [MPa] | ν12 [-] | ν13 [-] | ν23 [-] | G12 [MPa] | G13 [MPa] | G23 [MPa] |
| Shear B 8.74% (MC) | 314 | 162 | - | 0.384 | - | - | 114 | 372 | 390 |
| Shear B 19.9% (MC) | 245 | 145 | - | 0.389 | - | - | 19 | 210 | 177 |
| Shear C 8.74% (MC) | 3218 | 314 | - | 0.332 | - | - | 372 | 390 | 114 |
| Shear C 19.9% (MC) | 3495 | 245 | - | 0.28 | - | - | 210 | 177 | 19 |
| Shear D 8.74% (MC) | 3218 | 162 | - | 0.365 | - | - | 390 | 372 | 114 |
| Shear D 19.9% (MC) | 3495 | 145 | - | 0.364 | - | - | 177 | 210 | 19 |
| Direction | L | R | T | |||
|---|---|---|---|---|---|---|
| Moisture content [%] | 8.74 | 19.9 | 8.74 | 19.9 | 8.74 | 19.9 |
| FEM model [MPa] | 64 | 41 | 4.38 | 3.48 | 3.27 | 1.68 |
| Strength tests [MPA] | 76 | 74 | 4.98 | 3.57 | 3.04 | 1.65 |
| Error [%] | 16 | 44 | 12 | 2.5 | 7.5 | 2 |
| Direction | L | R | T | |||
|---|---|---|---|---|---|---|
| Moisture content [%] | 8.74 | 19.9 | 8.74 | 19.9 | 8.74 | 19.9 |
| FEM model [MPa] | 51 | 44 | 3.4 | 2.4 | 4.6 | 3.6 |
| Strength tests [MPA] | 51 | 43.5 | 3.4 | 2.5 | 4.4 | 3.4 |
| Error [%] | 0 | 1 | 0 | 4 | 4.5 | 5.5 |
| Direction | RT | LR | LT | |||
|---|---|---|---|---|---|---|
| Moisture content [%] | 8.74 | 19.9 | 8.74 | 19.9 | 8.74 | 19.9 |
| FEM model [MPa] | 4.3 | 1.5 | 16 | 7.5 | 11.9 | 7.4 |
| Strength tests [MPA] | 4.1 | 1.3 | 15 | 7.1 | 11.6 | 6.8 |
| Error [%] | 5 | 13 | 6 | 5 | 3 | 8 |
| Direction | L | R | T | |||
|---|---|---|---|---|---|---|
| Moisture content [%] | 8.74 | 19.9 | 8.74 | 19.9 | 8.74 | 19.9 |
| Error 15% [%] | 25 | 31 | 100 | 100 | 100 | 100 |
| Direction | L | R | T | |||
|---|---|---|---|---|---|---|
| Moisture Content [%] | 8.74 | 19.9 | 8.74 | 19.9 | 8.74 | 19.9 |
| Error 15% [%] | 95 | 94 | 100 | 22 | 96 | 97 |
| Direction | RT | LR | LT | |||
|---|---|---|---|---|---|---|
| Moisture Content [%] | 8.74 | 19.9 | 8.74 | 19.9 | 8.74 | 19.9 |
| Error 15% [%] | 94 | 5 | 96 | 99 | 51 | 85 |
Publisher’s Note: MDPI stays neutral with regard to jurisdictional claims in published maps and institutional affiliations. |
© 2020 by the authors. Licensee MDPI, Basel, Switzerland. This article is an open access article distributed under the terms and conditions of the Creative Commons Attribution (CC BY) license (http://creativecommons.org/licenses/by/4.0/).
Share and Cite
Warguła, Ł.; Wojtkowiak, D.; Kukla, M.; Talaśka, K. Symmetric Nature of Stress Distribution in the Elastic-Plastic Range of Pinus L. Pine Wood Samples Determined Experimentally and Using the Finite Element Method (FEM). Symmetry 2021, 13, 39. https://doi.org/10.3390/sym13010039
Warguła Ł, Wojtkowiak D, Kukla M, Talaśka K. Symmetric Nature of Stress Distribution in the Elastic-Plastic Range of Pinus L. Pine Wood Samples Determined Experimentally and Using the Finite Element Method (FEM). Symmetry. 2021; 13(1):39. https://doi.org/10.3390/sym13010039
Chicago/Turabian StyleWarguła, Łukasz, Dominik Wojtkowiak, Mateusz Kukla, and Krzysztof Talaśka. 2021. "Symmetric Nature of Stress Distribution in the Elastic-Plastic Range of Pinus L. Pine Wood Samples Determined Experimentally and Using the Finite Element Method (FEM)" Symmetry 13, no. 1: 39. https://doi.org/10.3390/sym13010039
APA StyleWarguła, Ł., Wojtkowiak, D., Kukla, M., & Talaśka, K. (2021). Symmetric Nature of Stress Distribution in the Elastic-Plastic Range of Pinus L. Pine Wood Samples Determined Experimentally and Using the Finite Element Method (FEM). Symmetry, 13(1), 39. https://doi.org/10.3390/sym13010039