Article

Application of Acoustic Agglomeration Technology to Improve the Removal of Submicron Particles from Vehicle Exhaust

by
Inga Garbarienė
1,
Vadimas Dudoitis
1,
Vidmantas Ulevičius
1,
Kristina Plauškaitė-Šukienė
1,
Artūras Kilikevičius
2,
Jonas Matijošius
2,*,
Alfredas Rimkus
3,
Kristina Kilikevičienė
2,
Darius Vainorius
2,
Algirdas Maknickas
2,
Sergejus Borodinas
4 and
Steigvilė Byčenkienė
1
1
State Research Institute Center for Physical Sciences and Technology, Saulėtekio av. 3, LT-10257 Vilnius, Lithuania
2
Institute of Mechanical Science, Vilnius Gediminas Technical University, J. Basanavičiaus g. 28, LT-03224 Vilnius, Lithuania
3
Department of Automobile Engineering, Transport Engineering Faculty, Vilnius Gediminas Technical University, J. Basanavičiaus g. 28, LT-03224 Vilnius, Lithuania
4
Department of Applied Mechanics, Civil Engineering Faculty, Vilnius Gediminas Technical University, J. Basanavičiaus g. 28, LT-03224 Vilnius, Lithuania
*
Author to whom correspondence should be addressed.
Symmetry 2021, 13(7), 1200; https://doi.org/10.3390/sym13071200
Submission received: 3 June 2021 / Revised: 26 June 2021 / Accepted: 30 June 2021 / Published: 3 July 2021
(This article belongs to the Special Issue Mechanics and Filtering Technology of Waste Particles)

Abstract

:
The natural processes of interactions between aerosol particles in the ambient air through which they agglomerate is a vast area of chamber research and are inherent to many industries and are often inter-connected with transport engineering. Further improvement of symmetric methods for aerosol particle number and mass concentration reduction made it possible to create various synergic techniques. The study used a 1.9 TDI diesel internal combustion engine, which was supplied with diesel (D100) and second-generation biofuels (NExBTL100) with the EGR exhaust system on and off. Measurements were performed using a Bruel and Kjær “Type 9727” system for measurement of vibrations, a scanning mobility particle sizer (SMPS) and an original agglomeration chamber. The three modes of particle size distributions were observed in the size range from 10 to 470 nm for both D100 and NExBTL100 fuels with and without the use of the EGR system. The application of 21.3 kHz frequency sound with SPL 144.1 dB changed the NExBTL100 generated aerosol particle number concentration but did not sufficiently affect the concentration of D100 emitted particles. The greatest agglomeration effect (21.7 ± 10.0%) was observed in the range of extremely small NExBTL100 derived particles (10–70 nm) when used in combination with an EGR system.

1. Introduction

The transport sector has been regarded as the significant contributor of particulate matter (PM) pollution in modern cities [1,2]. Traffic related particle number size distribution mainly consist of submicron particles in the range of 20–400 nm [3]. Ultrafine particles (UFP, smaller than 100 nm) comprise a significant fraction of transport particle emissions. Solid particle number limits (SPN—equal to 6·× 1011 p/km) were introduced in 2011 in the EU for diesel light-duty vehicles due to adverse health effects and climate-warming potential. Use of diesel particle filters in light-duty vehicles is becoming standard in many countries in order to reduce the ill effects of diesel generated particles, which have a significant role in air pollution. Aerosol particle number and mass concentration symmetric reduction is at the core of transport engineering and manufacturing. Many technologies, such as EGR systems, diesel oxidation catalysts (DOCs), diesel particulate filters (DPFs) and closed crankcase ventilation (CCV) refer to those that deal with aerosol particle reduction.
Acoustic particle agglomeration is a natural processes-based mechanism to reduce the aerosol particle number concentration. Acoustic waves are used to act on the movement of particulate matter, thereby facilitating the particles’ collisions and leading to the formation of larger agglomerates. The newly formed agglomerates of particles then continue to collide with each other or with other particles, and this cascade of the agglomeration process leads to a significant reduction of the particle number concentration and shifts the particle size distribution towards larger sizes [4,5,6]. Comprehensive experimental studies have indicated the effects of acoustic agglomeration on particle size distribution and acoustic properties, such as acoustic frequency, intensity and residence time [7,8,9,10,11,12].
The particle agglomeration process itself is highly efficient (68.9%), but the recommended amount of atomization is 1.6–2.7 kg [13]. It is particularly important to mention that the agglomeration mass obtained from the exhaust gases of internal combustion engine PM has the same properties as soot agglomerates coated with condensed organic compounds, and the engine exhaust agglomerates consist of loosely attached units [14]. Turbulent agglomeration was found to improve with increasing flow rate and PM concentration, with the chemical agglomeration being most affected by PM size. Therefore, chemical agglomeration is more suitable for agglomeration using exhaust gases from internal combustion engines [15]. It was also found that the frequency of oscillations has a direct effect on the efficiency of PM agglomeration [16].
Our previous investigation demonstrated that a high frequency 24 kHz acoustic field with an intensity of 136 dB formed the proper conditions for the agglomeration of diesel related particles in the range of 0.3–10 µm [17]. In this study, the acoustic performance on the 10–400 nm particles in the exhaust from the internal combustion engines was investigated [18]. These sizes of particulates account for the largest share of emissions when diesel fuel is used
The selected frequency allows the efficiency of the PM agglomeration process of the exhaust gases of the average combustion engine to be ensured due to the predominant particle size. The selected sound pressure oscillation device operating in the set frequency range (21.3 kHz) allows, adapted to the PM agglomeration of internal combustion engines, the number of particles (PN) to be reduced and to qualitatively control its limits using various fuels. This is in line with the common EU transport policy and offers a relevant PN diagnostic tool to prevent car pollution based on EURO 7 standards. Another aspect is that analogues of such a device are expensive and complex for everyday use, so the proposed measurement method and device allow localization, which does not require special preparation, and which is particularly relevant in areas related to the transport sector where mobility is one of the key principles.

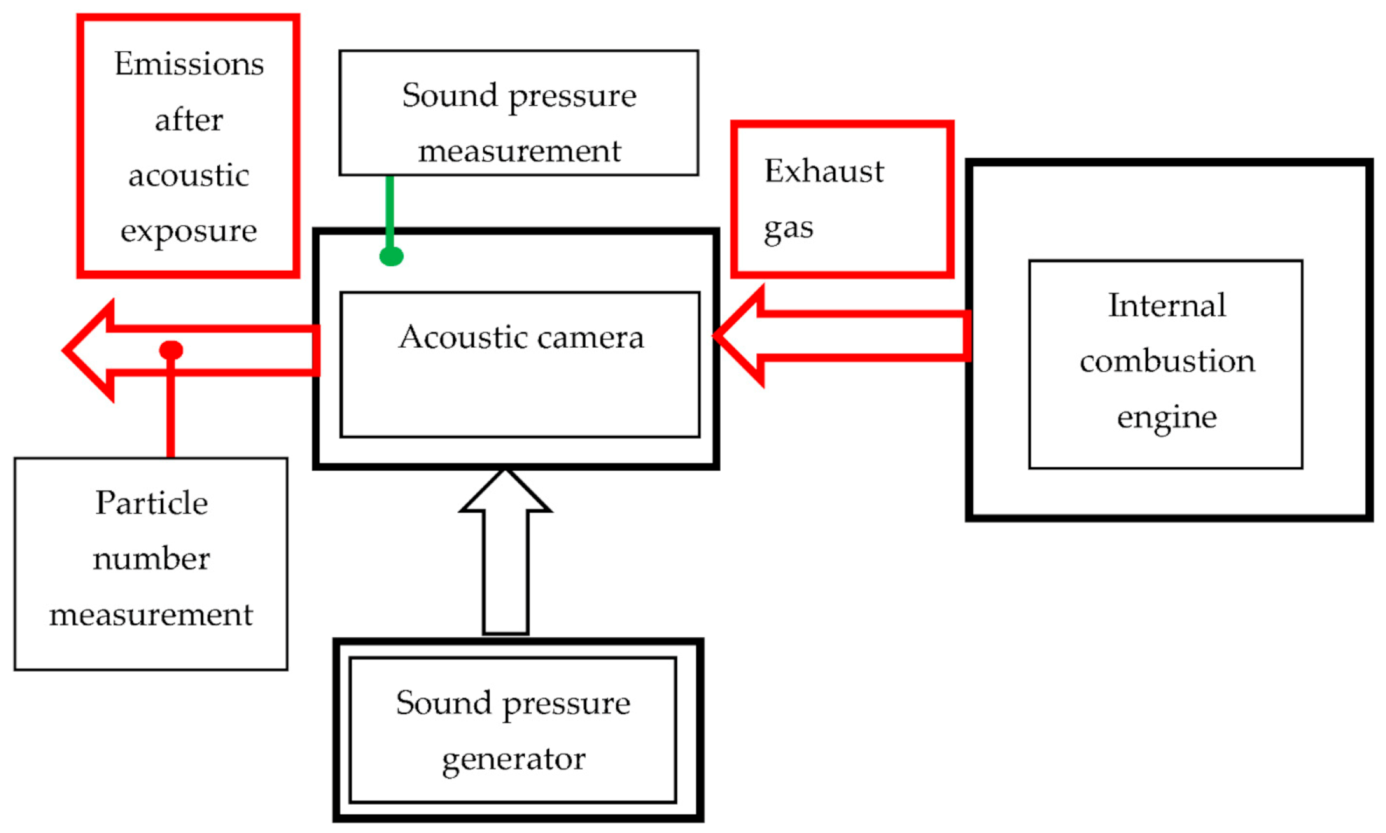
2. Materials and Methods

An experimental research protocol was created for experimental research at the laboratory of the VGTU Institute of Mechanical Science and the Department of Automotive Engineering of the Faculty of Transport.
The tests used pure fossil diesel fuel (D100) and pure biodiesel (NExBTL100), obtained by the hydrodeoxygenation process, which removes oxygen from biodiesel, enriches the fuel with hydrogen and results in reduced density and viscosity, increased fuel lower heating value and cetane number. The physical and chemical properties of the fuel were tested in the laboratory, and their properties are presented in Table 1.
A direct injection compression ignition (diesel) turbocharged 1.9 TDI engine was used for the tests. The engine power supply system was equipped with an engine electronic control unit (ECU) controlled distribution type fuel pump and single injection fuel injectors. The engine was equipped with an exhaust gas recirculation (EGR) system, and the intake air was cooled by an air cooler. The main parameters of the 1.9 TDI compression ignition engine are shown in Table 2.
The tests were performed by simulating the car speed at 50–70 km/h: engine speed n = 2000 rpm, brake torque MB = 45 Nm, power PB = 9.4 kW. Engine exhaust gas recirculation was on (mass fraction of returned gas (EGR rate) kEGR = 0.27) and off (EGR rate kEGR = 0) during the test. The motor load MB was developed using the KI-5543 electromagnetic load bench (measurement error ± 1.23 Nm). Fuel consumption was measured by SK-5000 electronic scales (measurement error 1 g) and stopwatch. The scheme of engine testing equipment is shown in Figure 1. A Type K thermocouple was used to measure the intake air and the exhaust gas temperature (accuracy 0.5%). To close the partial exhaust gas recirculation to the engine cylinders, the EGR valve was disconnected from the ECU and remained closed.
For the acoustic exposure parameters and particle number measurements, the equipment shown in Figure 2 was used. The block diagram of the test bench is presented in Figure 3.
During the gas pressure measurements, the sound pressure level (SPL) was measured, which is calculated according to the following formula:
S P L = 20 log p r m s 20 · 10 6 ,
where prms is root mean square, Pa.
During the studies, the emissions from the diesel engine were exposed to sound pressure in the acoustic chamber at 144.1 dB (Figure 2, Item 3). Sound pressure and temperature were measured in the acoustic chamber (temperature was 25 ± 0.5 °C during the measurement). After the acoustic chamber, the concentration of particles in the stream was measured when there was an acoustic effect in the acoustic chamber and when there was no effect (see Figure 3).
The Bruel and Kjær Type 9727 vibration measurement system (Figure 2, Item 4) was used to evaluate the acoustic field parameters, which consisted of Type 7910 universal software, a Type PULSE 3560-B multichannel data block, a portable Dell personal computer and a Bruel and Kjær 8104 hydrophone (sensitivity 211 dB 1 V/μPa ± 2 dB, frequency response from 0.1 Hz to 100 kHz + 1.5/–6.0 dB; from 0.1 Hz to 180 kHz + 3.5/–12.5 dB, in the horizontal direction (xy plane) ± 2 dB at 100 kHz, in the vertical direction (xz plane) ± 4 dB at 100 kHz).
For measurement of parameters of the acoustic field, a Bruel and Kjær “Type 9727” system of measurement of vibrations was used. It consists of “Type 7910” software, a “Type PULSE 3560—B” multi-channel block for data accumulation, a computer and a Bruel and Kjær 8104 hydrophone (sensitivity—211 dB 1 V/μPa ± 2 dB, frequency response from 0.1 Hz up to 100 kHz + 1.5/–6.0 dB; from 0.1 Hz up to 180 kHz + 3.5/−12.5 dB; in the horizontal direction (plane) ± 2 dB frequency 100 kHz; in the vertical direction (plane) ± 4 dB frequency 100 kHz).
An acoustic chamber was designed to investigate the acoustic agglomeration of particles (Figure 4). These two elements were designed and optimized using the Comslo Multiphysic software package. The full model included a piezoelectric effect multiphysics interface (fully coupled solid mechanical and electrostatic interfaces), and an acoustic–structure boundary interaction multiphysics interface, including pressure acoustics and solid mechanics interfaces. The piezoelectric effect physics interface achieved conversion of the electrical power to the mechanical vibrations on the resonance frequency. The maximum mesh element size in the current numerical simulation was 1/4 of the acoustic wave number based on the piezoelectric device resonance frequency (about 21.3 kHz). The minimum element size was 1/6 of the wave number. The design goal was to achieve a total acoustic pressure field up to 130–140 dB in the acoustic chamber, and a sound pressure level of at least 130 dB in the acoustic chamber. The obtained results are presented in Figure 4. Based on these calculations, an acoustic chamber was fabricated. The frequency domain formulation of the pressure acoustic interface used the inhomogeneous Helmholtz equation:
· 1 ρ c ρ t q d k e q 2 p t ρ c = Q m ,
p t = p + p b
where p b is the possible background pressure field and in our model is equal 0. Then the total pressure field is p t = p . Wave number k e q presented in this equation calculates as
k e q = ω c c .
Based on our pressure acoustic model for sound speed and density, we assume that c c = c and ρ c = ρ .
The multiphysics interface included fully coupled pressure–acoustic, frequency–domain and solid–mechanics interfaces, which intersected on the acoustic and structure boundary. The coupling included the fluid load on the structure and the structural acceleration as experienced by the fluid. The condition of the exterior boundaries reads as follows:
n 1 ρ p t q d = n · u t t
F A = p t n
where u t t is the structural acceleration, n is the surface normal, pt is the total acoustic pressure and F A is the load (force per unit area) experienced by the structure.
The external wall (pipe) has a sound hard boundary condition, which is a boundary at which the normal component of the acceleration (and thus the velocity) is zero:
n 1 ρ p t q d = 0
Both pipe’s outlets have a cylindrical wave radiation boundary condition. The cylindrical wave boundary condition is based on a series expansion of the outgoing wave in cylindrical coordinates, and it assumes that the field is independent of the axial coordinate.
In the acoustic chamber, the sound pressure level of the acoustic field reached 144.1 dB at 21.3 kHz when the piezoelectric generator was operating (Figure 5).
We have an internal boundary of the pipe as the sound reflecting surfaces. Figure 4a shows the standing wave based on this boundary condition. It is clear that the position of the piezoelectric actuator in the chamber will affect the stability of the standing wave condition.
Temperature, humidity and ambient pressure were not changed during the simulation. Another boundary condition for the proposed acoustic–structure interaction is periodic condition or open boundary of the pipe, as shown in Figure 4b, in longitudinal section view. The type of periodicity is continuous. The total pressure fields of the destination and source are equal:
p t ,   d s t = p t ,   s r c
n d s t 1 ρ p t q d d s t = n s r c 1 ρ p t q d s r c
The total acoustic pressure field can be rich, up to 860 Pa. The particle agglomeration active zones are longer in longitudinal cross section along the linear surface reflection (Figure 4b) compared with the cylindrical reflection zone (Figure 4a). Based on these calculations, an acoustic chamber was fabricated.
In the acoustic chamber, the sound pressure level of the acoustic field reached 144.1 dB at 21.3 kHz when the piezoelectric generator was operating (Figure 5).
The aerosol particle number size distribution was measured by using a scanning mobility particle sizer (SMPS, TSI model 3996). The possible detectable particle size range was from 0.003 to 1.0 µm. The detailed description of this SMPS model (Figure 2) is provided in [19,20]. The SMPS was set to the following working parameters: aerosol flow 1.0 ± 0.1 L·min−1, and sheath flow 5.0 ± 0.1 L·min−1. The SMPS measurement cycle lasted for 120 s, of which the actual measurement took 100 s. Up to three measurements were done for each fuel and EGR setting. Aerosol particles were neutralized by passing them through a radioactive 85 Kr neutralizer (TSI model 3077A). The measurement quality control was performed periodically during the experiment. It consisted of aerosol and sheath flow rate verification and CPC (condensation particle counter) zero checking. The differential mobility analyzer (DMA) maintenance was done using 70 and 150 nm polystyrene latex spheres or PSL particles.
The multiple charge correction was applied using the AIM software provided by TSI. The particle diffusion losses were handled in two steps. First, all obstructions (i.e., 90 degree bends, neutralizer, dilution system, etc.) in the aerosol particle sampling line were converted into the cylinder pipe equivalent [21]. Then, the particle losses to the inner walls of the sampling line were evaluated using the Gormley–Kennedy equation for a cylinder pipe [22]. We applied the Nikezic approach of the Gormley–Kennedy expression [23].
Aerosol particles were sampled from the exhaust chimney through a metal pipe that was 6 mm inner in diameter and diluted with the HEPA filtered air at a factor of 12.11. The conductive tubing was used for construction of the aerosol sampling line. There were two sampling lines used in the experiments. A shorter sampling line was used for characterization of exhaust particles from the fuel burning process. The longer sampling line had almost twice the length of the tubing in comparison to the first line and an acoustic chamber was embedded into the line. This line was used for testing acoustic agglomeration effects of aerosol particles. The test was repeated 3 times for each fuel type. To avoid cross contamination of the acoustic chamber, the measurements of background level of particle number concentration were performed prior to and after each test.
The aerosol particle size distributions were analyzed and fitted to log-normal modes [24,25]. The fitting was done in order to characterize the particles being emitted during the fuel burning process. The mode median diameter (Dm), the mode parameter (σg) and the particle number concentration within the mode were determined by using the least-squares method [26]. Aerosol particles with median diameters in the size range of 20–100 nm were classified as Aitken mode [27]. The accumulation mode was classified to particles in the size range of 100–1000 nm.

3. Results

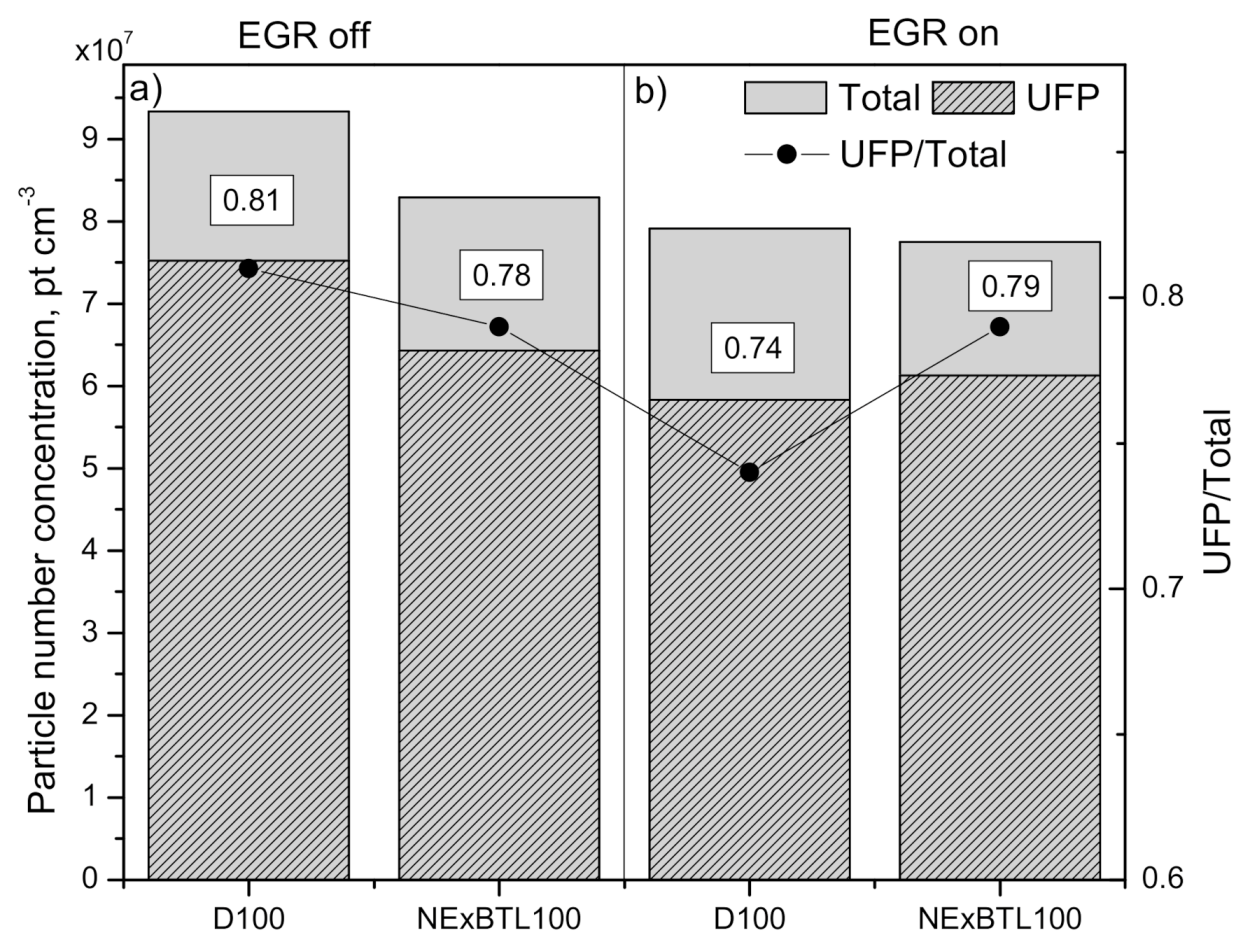
3.1. Exhaust Gas Recirculation (EGR) Effect on Particle Number Concentration and Size Distribution of the Tested Fuels

The influence of EGR on particle number size distribution for standard diesel (D100) and NExBTL100 (Neste Oil renewable diesel) is shown in Figure 6 and Table 3.
The three modes of aerosol particle number size distributions were observed in the size range from 10 to 470 nm for all investigated fuels, operating with and without EGR. The lognormal distribution of particle number concentration consisted of two modes in the ultrafine particle size range and one accumulation mode. As shown in Table 3, particle size classes were defined as follows: Aitken mode (20 < Dp < 100 nm) and the accumulation mode (100 < Dp < 1000 nm).
Without the use of the EGR (see Figure 6), the same particle number size distribution was registered for diesel and NExBTL100 in the ultrafine range. The ultrafine particle mode diameters were around 31 nm and 60 nm for both fuels. However, diesel resulted in the formation of slightly larger accumulation mode particles (178 nm) compared to NExBTL100 (165 nm) (Table 3).
Overall, the NExBTL100 emitted total particle number concentration was lower than diesel derived particle number concentration (Table 3). This finding could be associated with differences in the chemical compositions between these fuels. NExBTL100 has a lower quantity of sulfur and aromatic hydrocarbons, which leads to the formation of a lesser amount of particle [28]. The lower carbon concentration in biofuels also has an impact. These results coincide with other studies that demonstrated slightly reduction of PM/smoke emissions with increased NExBTL100 percentage in fuel blends [29,30,31,32].
Figure 6 represents the ratio of ultrafine particle number concentration to total particle number concentration (UFP/Total) of the tested fuels. The UFP fraction dominated in the total particle number concentration for both fuels with UFP/Total ratios of about 0.81 and 0.78 for D100 and NExBTL100, respectively.
In case of D100, the use of EGR reduced the number concentration of particles in Aitken mode I and II, but noticeably increased particle concentration in accumulation mode (Table 3). For NExBTL100, the EGR reduced particle number concentration in Aitken II and accumulation modes, but slightly increased the number concentration of the smallest particles (Aitken mode I). Overall, the engine operated with EGR resulted in lower total particle number concentrations than the ones operating without EGR for all tested fuels. The reduction in total particle number concentrations was observed by 15.2% and 6.5% for D100 and NExBTL100, respectively.
The EGR system, together with the exhaust gas, returns CO2 gas to the engine and reduces the amount of fresh air (oxygen). This inhibits the combustion process, forming larger particles but reducing the amount of particles. NExBTL100 fuel has a lower viscosity and density, better decomposition during injection and therefore better combustion. Lower concentrations of carbon and other compounds (e.g., sulfur) in fuels also have an impact.
Furthermore, the particle number size distribution of all tested fuels shifted toward larger particle sizes with the EGR (please see Table 3). The EGR led to condensation of volatile compounds on the primary particles due to lower in-cylinder temperature (during the combustion phase), which increased the diameter of particles. As shown in please see Table 3 a significant enhancement of accumulation mode diameter was observed for D100 fuel. However, the increase in both ultrafine particle mode diameters for D100 was smaller. Moreover, the reduced UFP/Total ratio (from 0.81 to 0.74) clearly indicates that EGR caused the formation of larger size particles (Figure 7). A similar observation was presented in previous studies [20,21].
We noticed that EGR has a negligible influence on particle size distribution profiles when NExBTL100 was used. UFP/Total ratio remained almost unchanged for different operation conditions (EGR off/on) for the same fuel used (Figure 7).

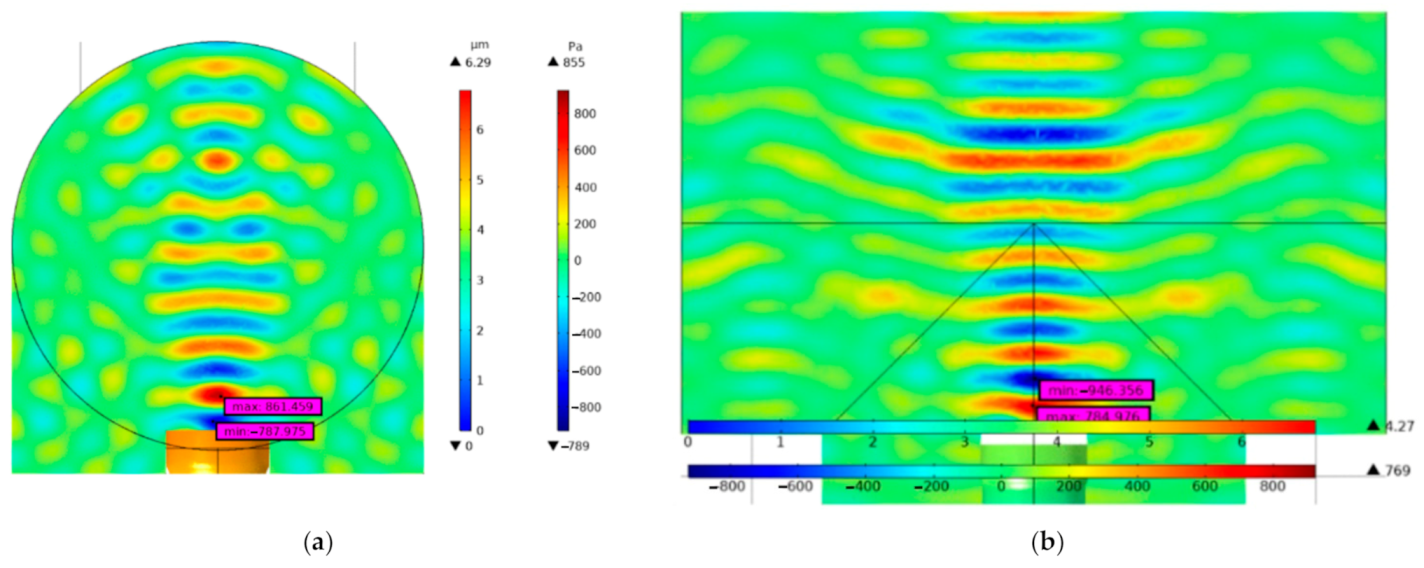
3.2. Acoustic Effect

The effect of acoustic field on particle agglomeration was determined by measurement of particle number concentration and size distribution after the agglomeration chamber (Figure 3) with and without acoustics. The main characteristics of the particle number concentration registered after the agglomeration chamber without the acoustic field are listed in Table 4. The three modes of particles size distribution were observed (40 nm, 72 nm, 170 nm) without the use of EGR. Using EGR, larger size particles, with mode diameters of approximately 62 nm, 101 nm and 174 nm, were detected. Our observation revealed some differences in particle number concentration and size distribution data during the exhaust measurements depicted by SMPS directly from the tailpipe (Section 3.1 Table 3) and through the acoustic chamber.
It is known that an engine’s emitted particle number concentration and size distribution depends on the exhaust gas sampling point. Direct sampling from the tailpipe was made using dilution and a relatively short sampling line was used (Figure 3). However, the measurements within the agglomeration chamber required a longer sampling line (Figure 3). It can be assumed that the main differences in the measurement data can be attributed to the residence time effect of aerosol in the system.
As shown in Figure 8, the application of 21.3 kHz frequency sound with SPL 144.1 dB changed the emitted aerosol particle number concentration from burning NExBTL100, but did not significantly affect the particle size distribution. However, the applied acoustic field did not have a sufficient effect on the D100 generated particle number concentration. Thus, it can be stated that under conditions of 21.3 kHz and SPL 144.1 dB, the agglomeration of D100 emitted particles is limited in the acoustic chamber.
In the case of NExBTL100, the total particle number concentration was reduced by 11.0% without the EGR. When the EGR was used, total particle number concentration was decreased only by 4.0%.To further clarify particle number concentration change, the size-segregated particles removal efficiency was calculated as follows:
η N i = N i 0 N i t N i 0 × 100 % ,
where Ni0 and Nit are particle number concentration in the initial stage and after agglomeration, respectively.
The positive η values indicated a decrease in particle number concentration, while the negative η values represented particle size regions with an increased number concentration after the acoustic treatment (Table 5).
As shown in Table 5 two distinct particle agglomeration regions were observed. Without the use of EGR, particle number concentration in the range of 10–90 nm was reduced by 15.5 ± 6.0%, due to collision, agglomeration and condensation growth, which on the other hand increased particle number concentration in the 90–120 size range. The particles of 120–180 nm also enlarged due to agglomeration in the 21.3 kHz frequency sound. The removal efficiency of 120–180 nm particles reached about 18.0 ± 11.4%.
In the case with EGR, the number concentration of the smaller size range (10–70 nm) decreased by 21.7 ± 10.0%. The agglomeration of these particles induced an increase in number concentration in the range of 70–100 nm. Another drop (8.2 ± 4.2%) in number concentration was registered in the 100–180 nm size range, which was accompanied with the significant increase in number concentration of the 180–360 nm size range, on average by 38.5%. The experimental results demonstrate that the combination of high-frequency acoustic treatment and EGR leads to a markedly reduced number concentration of particles smaller than 70 nm.
The high-frequency acoustic wave exhibited different agglomeration effects on 10–360 nm sized particles. Submicron particles are the subject for further experimental investigations with different operating parameters of the acoustic chamber.

4. Conclusions

This study shows that with using both D100 and NExBTL100 fuels, and with both EGR on and EGR off regimes, three modes of particle number size distribution in the range of 10 to 470 nm were observed. Accordingly, using the EGR system, larger D100 derived particles with a mode diameter of about 36 nm, 71 nm and 219 nm were formed compared to without EGR, where the mode diameter was 32 nm, 57 nm and 178 nm. In the case of NExBTL100, the EGR system had a negligible influence on particle size distribution profiles. However, the concentration of total number of particles with EGR was lower using both D100 (15.2%) and NExBTL100 (6.5%) fuels.
Acoustic agglomeration (21.3 kHz frequency and SPL 144.1 dB) gave a general particle number concentration effect using NExBTL100 fuel with both EGR on (4.0%) and EGR off (11.0%) regimes. Examining the effect of acoustic agglomeration, it can be stated that particles smaller than 70 nm agglomerate (concentration decreases by 21.7 ± 10.0% in the range of 10–70 nm, and concentration increases by 38.5% in the size range of 180–360 nm). It should also be noted that the agglomeration effect is also observed in the size range of 100–180 nm (8.2 ± 4.2%). All this means that the agglomeration process itself, by renewing high-frequency acoustics, is adapted to reduce the number of extremely small particles of an internal combustion engine’s exhaust, which has a negative effect on human health.
Thus, it can be stated that high-frequency sound affects 10–360 nm particles differently, so it is necessary to further improve the parameters of the acoustic chamber in order to obtain a higher agglomeration effect.

Author Contributions

Conceptualization, S.B. (Steigvilė Byčenkienė), V.U., K.P.-Š., A.K., J.M. and A.M.; methodology, V.D., K.K. and A.R.; software, I.G., D.V. and S.B. (Sergejus Borodinas); validation, V.D., K.P.-Š., A.M. and S.B. (Sergejus Borodinas); formal analysis, V.D. and S.B. (Steigvilė Byčenkienė); investigation, V.D., A.K., J.M., A.R. and K.K. resources, V.U., D.V. and A.M.; data curation, V.U., K.P.-Š., A.R., D.V. and S.B. (Steigvilė Byčenkienė); writing—original draft preparation, I.G., V.D., A.K., J.M., K.K. and D.V.; writing—review and editing, K.P.-Š., V.U, A.K., J.M. and A.R.; visualization, K.K., D.V., A.M., S.B. (Sergejus Borodinas) and S.B. (Steigvilė Byčenkienė); supervision, A.K., J.M. and S.B. (Steigvilė Byčenkienė); project administration, J.M.; funding acquisition, A.K. and J.M. All authors have read and agreed to the published version of the manuscript.

Funding

This research received no external funding.

Institutional Review Board Statement

Not applicable.

Informed Consent Statement

Not applicable.

Data Availability Statement

Not applicable.

Acknowledgments

Not applicable.

Conflicts of Interest

The authors declare no conflict of interest.

References

  1. Rajé, F.; Tight, M.; Pope, F.D. Traffic Pollution: A Search for Solutions for a City like Nairobi. Cities 2018, 82, 100–107. [Google Scholar] [CrossRef]
  2. Karagulian, F.; Belis, C.A.; Dora, C.F.C.; Prüss-Ustün, A.M.; Bonjour, S.; Adair-Rohani, H.; Amann, M. Contributions to Cities’ Ambient Particulate Matter (PM): A Systematic Review of Local Source Contributions at Global Level. Atmos. Environ. 2015, 120, 475–483. [Google Scholar] [CrossRef]
  3. Rönkkö, T.; Timonen, H. Overview of Sources and Characteristics of Nanoparticles in Urban Traffic-Influenced Areas. J. Alzheimers Dis. 2019, 72, 15–28. [Google Scholar] [CrossRef] [Green Version]
  4. Riera-Franco de Sarabia, E.; Gallego-Juárez, J.A.; Rodríguez-Corral, G.; Elvira-Segura, L.; González-Gómez, I. Application of High-Power Ultrasound to Enhance Fluid/Solid Particle Separation Processes. Ultrasonics 2000, 38, 642–646. [Google Scholar] [CrossRef]
  5. González, I.; Hoffmann, T.L.; Gallego, J.A. Precise measurements of particle entrainment in a standing-wave acoustic field between 20 and 3500 Hz. J. Aerosol Sci. 2000, 31, 1461–1468. [Google Scholar] [CrossRef]
  6. Dong, S.; Lipkens, B.; Cameron, T.M. The Effects of Orthokinetic Collision, Acoustic Wake, and Gravity on Acoustic Agglomeration of Polydisperse Aerosols. J. Aerosol Sci. 2006, 37, 540–553. [Google Scholar] [CrossRef]
  7. Liu, J.; Zhang, G.; Zhou, J.; Wang, J.; Zhao, W.; Cen, K. Experimental Study of Acoustic Agglomeration of Coal-Fired Fly Ash Particles at Low Frequencies. Powder Technol. 2009, 193, 20–25. [Google Scholar] [CrossRef]
  8. Wang, J.; Liu, J.; Zhang, G.; Zhou, J.; Cen, K. Orthogonal Design Process Optimization and Single Factor Analysis for Bimodal Acoustic Agglomeration. Powder Technol. 2011, 210, 315–322. [Google Scholar] [CrossRef]
  9. Hoffmann, T.L. Environmental Implications of Acoustic Aerosol Agglomeration. Ultrasonics 2000, 38, 353–357. [Google Scholar] [CrossRef]
  10. Riera-Franco de Sarabia, E.; Elvira-Segura, L.; González-Gómez, I.; Rodríguez-Maroto, J.J.; Muñoz-Bueno, R.; Dorronsoro-Areal, J.L. Investigation of the Influence of Humidity on the Ultrasonic Agglomeration of Submicron Particles in Diesel Exhausts. Ultrasonics 2003, 41, 277–281. [Google Scholar] [CrossRef]
  11. Yan, J.; Chen, L.; Li, Z. Removal of Fine Particles from Coal Combustion in the Combined Effect of Acoustic Agglomeration and Seed Droplets with Wetting Agent. Fuel 2016, 165, 316–323. [Google Scholar] [CrossRef]
  12. Zhang, G.; Zhou, T.; Zhang, L.; Wang, J.; Chi, Z.; Hu, E. Improving Acoustic Agglomeration Efficiency of Coal-Fired Fly-Ash Particles by Addition of Liquid Binders. Chem. Eng. J. 2018, 334, 891–899. [Google Scholar] [CrossRef]
  13. Liu, H.; Li, Z.; Tan, H.; Yang, F.; Feng, P.; Du, Y.; Ren, M.; Dong, M. Experimental Investigation on a Novel Agglomeration Device Based on Charged Ultrasonic Spray and Vortex Generators for Improving the Removal of Fine Particles. Fuel 2021, 287, 119549. [Google Scholar] [CrossRef]
  14. Yan, F.; Song, J.; Zhuang, Y.; Qiu, L.; Li, Z.; Meng, Z. Three-Dimension Soft X-Ray Tomographic Reconstruction of Particulates Emitted from a Diesel Engine. J. Aerosol Sci. 2021, 156, 105784. [Google Scholar] [CrossRef]
  15. Bin, H.; Yang, Y.; Cai, L.; Zhulin, Y.; Roszak, S.; Linjun, Y. Experimental Study on Particles Agglomeration by Chemical and Turbulent Agglomeration before Electrostatic Precipitators. Powder Technol. 2018, 335, 186–194. [Google Scholar] [CrossRef]
  16. Lin, W.-Y.; Hsiao, T.-C.; Hong, B.-L. Improving the Removal Efficiency of Fine Particulate Matters in Air Pollution Control Devices: Design and Performance of an Electrostatic Aerosol Particle Agglomerator. J. Taiwan Inst. Chem. Eng. 2020, 107, 110–118. [Google Scholar] [CrossRef]
  17. Kilikevičienė, K.; Kačianauskas, R.; Kilikevičius, A.; Maknickas, A.; Matijošius, J.; Rimkus, A.; Vainorius, D. Experimental Investigation of Acoustic Agglomeration of Diesel Engine Exhaust Particles Using New Created Acoustic Chamber. Powder Technol. 2020, 360, 421–429. [Google Scholar] [CrossRef]
  18. Jedliński, Ł.; Caban, J.; Krzywonos, L.; Wierzbicki, S.; Brumerčík, F. Application of Vibration Signal in the Diagnosis of IC Engine Valve Clearance. J. Vibroengineering 2015, 17, 175–187. [Google Scholar]
  19. Nasrabadi, A.M.; Todea, A.M.; Wolf, C.; Demirel, T.; Habryka, D.; Asbach, C. Investigation of the Effect of Aerosolized TiO2 Nanoparticles on the NO2 Concentrations under UVA Exposure. Aerosol Air Qual. Res. 2021, 21, 200612. [Google Scholar] [CrossRef]
  20. Dudoitis, V.; Mordas, G.; Byčenkienė, S.; Plauškaitė, K.; Pauraitė, J.; Jasinevičienė, D.; Marozas, V.; Pivoras, G.; Mozgeris, G.; Augustaitis, A.; et al. Aerosol Particle Formation in the Lithuanian Hemi-Boreal Forest. Lith. J. Phys. 2018, 58. [Google Scholar] [CrossRef]
  21. Wiedensohler, A.; Birmili, W.; Nowak, A.; Sonntag, A.; Weinhold, K.; Merkel, M.; Wehner, B.; Tuch, T.; Pfeifer, S.; Fiebig, M.; et al. Mobility Particle Size Spectrometers: Harmonization of Technical Standards and Data Structure to Facilitate High Quality Long-Term Observations of Atmospheric Particle Number Size Distributions. Atmos. Meas. Tech. 2012, 5, 657–685. [Google Scholar] [CrossRef] [Green Version]
  22. Gormley, P.G.; Kennedy, M. Diffusion from a Stream Flowing through a Cylindrical Tube. Proc. R. Ir. Acad. Sect. Math. Phys. Sci. 1948, 52, 163–169. [Google Scholar]
  23. Nikezic, D.; Haque, A.K.M.M.; Yu, K.N. Effects of Different Deposition Models on the Calculated Dose Conversion Factors from 222Rn Progeny. J. Environ. Radioact. 2002, 61, 305–318. [Google Scholar] [CrossRef]
  24. Šakalys, J.; Kvietkus, K.; Sucharová, J.; Suchara, I.; Valiulis, D. Changes in Total Concentrations and Assessed Background Concentrations of Heavy Metals in Moss in Lithuania and the Czech Republic between 1995 and 2005. Chemosphere 2009, 76, 91–97. [Google Scholar] [CrossRef]
  25. Kvietkus, K.; Šakalys, J.; Didžbalis, J.; Garbarienė, I.; Špirkauskaitė, N.; Remeikis, V. Atmospheric Aerosol Episodes over Lithuania after the May 2011 Volcano Eruption at Grimsvötn, Iceland. Atmos. Res. 2013, 122, 93–101. [Google Scholar] [CrossRef]
  26. Miller, S.J. Chapter 24. The Method of Least Squares. In The Probability Lifesaver; Princeton University Press: Princeton, NJ, USA, 2017; pp. 625–635. ISBN 978-1-4008-8538-1. [Google Scholar]
  27. Wu, Z.; Hu, M.; Lin, P.; Liu, S.; Wehner, B.; Wiedensohler, A. Particle Number Size Distribution in the Urban Atmosphere of Beijing, China. Atmos. Environ. 2008, 42, 7967–7980. [Google Scholar] [CrossRef]
  28. Walsh, M.P. PM2.5: Global Progress in Controlling the Motor Vehicle Contribution. Front. Environ. Sci. Eng. 2014, 8, 1–17. [Google Scholar] [CrossRef]
  29. Hunicz, J.; Matijošius, J.; Rimkus, A.; Kilikevičius, A.; Kordos, P.; Mikulski, M. Efficient Hydrotreated Vegetable Oil Combustion under Partially Premixed Conditions with Heavy Exhaust Gas Recirculation. Fuel 2020, 268, 117350. [Google Scholar] [CrossRef]
  30. Rimkus, A.; Žaglinskis, J.; Stravinskas, S.; Rapalis, P.; Matijošius, J.; Bereczky, Á. Research on the Combustion, Energy and Emission Parameters of Various Concentration Blends of Hydrotreated Vegetable Oil Biofuel and Diesel Fuel in a Compression-Ignition Engine. Energies 2019, 12, 2978. [Google Scholar] [CrossRef] [Green Version]
  31. Bortel, I.; Vávra, J.; Takáts, M. Effect of HVO Fuel Mixtures on Emissions and Performance of a Passenger Car Size Diesel Engine. Renew. Energy 2019, 140, 680–691. [Google Scholar] [CrossRef]
  32. Suarez-Bertoa, R.; Kousoulidou, M.; Clairotte, M.; Giechaskiel, B.; Nuottimäki, J.; Sarjovaara, T.; Lonza, L. Impact of HVO Blends on Modern Diesel Passenger Cars Emissions during Real World Operation. Fuel 2019, 235, 1427–1435. [Google Scholar] [CrossRef]
Figure 1. Engine testing equipment.
Symmetry 13 01200 g001
Figure 2. Test bench layout: 1—The scanning mobility particle sizer (SMPS, TSI model 3936), 2—Diesel engine, 3—Acoustic generation and measurement zone, 4—Bruel and Kjær data processing system “Type 9727”.
Symmetry 13 01200 g002
Figure 3. Block diagram of the test bench.
Symmetry 13 01200 g003
Figure 4. Far-field sound pressure level (Pa) in acoustic chamber: (a) cross section; (b) longitudinal section.
Symmetry 13 01200 g004
Figure 5. Acoustic field parameters. Frequency dependence of sound pressure level—piezoelectric sound generator 144.1 dB at 21.3 kHz: (a) by time line; (b) by frequency.
Symmetry 13 01200 g005
Figure 6. Particle number size distribution from diesel engine exhaust, operating with and without the EGR.
Symmetry 13 01200 g006
Figure 7. Comparison of particle number concentration of diesel and NExBTL100 with and without EGR.
Symmetry 13 01200 g007
Figure 8. Acoustic effect on aerosol particle number concentration and size distribution, emitted from the engine by burning NExBTL100 fuel with (a) and without EGR (b).
Symmetry 13 01200 g008
Table 1. The main physical and chemical properties of the fuels.
PropertiesD100NExBTL100
Density at 40 °C, g/mL0.8440.778
Dynamic viscosity, MPa·s3.2712.262
Kinematic viscosity, mm2/s3.9472.959
Water content acc. CF, %0.00330.002
Amount of hydrogen, %14.6316.75
Filtration temperature, °C−10−40
CFPP, °C−39−58
Poor point, °C−39−58
Cetane number50.974.5
Lower heating value, MJ/kg42.5743.45
Table 2. The main parameters of the 1.9 TDI compression ignition engine.
ParameterValue
Displacement, cm31896
Number of cylinders/gas distribution4/OHV
Compression ratio19.5
Bore, mm79.5
Stroke, mm95.5
Power, kW66 (4000 rpm)
Torque, Nm180 (2000–2500 rpm)
Injector opening pressure, bar190
Table 3. Parameterization of particle size distributions, originating from diesel engine exhausts, operating with and without EGR.
EGR OffEGR On
D100NE × BTL100D100NE × BTL100
Aitken mode (I)
median diameter (Dm), nm
32313639
Number concentration, pt cm−35.13 × 1074.43 × 1074.37 × 1074.46 × 107
Aitken mode (II) median
diameter (Dm), nm
57647164
Number concentration, pt cm−32.39 × 1072.00 × 1071.49 × 1071.67 × 107
Accumulation mode
median diameter (Dm), nm
178165219185
Number concentration, pt cm−31.81 × 1071.86 × 1072.05 × 1071.62 × 107
Total number concentration, pt cm−39.33 × 1078.29 × 1077.91 × 1077.75 × 107
Table 4. Characteristics of NExBTL100 generated particle size distributions measured through the agglomeration chamber (without acoustic field).
EGR OffEGR On
Aitken mode (I) median diameter (Dm), nm 4062
Number concentration, pt cm−34.41 × 1073.11 × 107
Aitken mode (II) median diameter (Dm), nm72103
Number concentration, pt cm−31.91 × 1071.33 × 107
Accumulation mode median diameter (Dm), nm170174
Number concentration, pt cm−32.22 × 1072.02 × 107
Total number concentration, pt cm−38.54 × 1076.46 × 107
Table 5. Removal efficiency (η) of size-segregated particle number concentrations.
Size Bins (nm)Without EGRWith EGR
η (%)η (%)
10–2020.336.0
20–3024.516.1
30–4015.324.7
40–507.928.0
50–6019.617.9
60–707.17.7
70–8017.1−7.8
80–9012.2−14.1
90–100−2.0−11.1
100–120−6.49.5
120–14029.210.3
140–16018.610.9
160–1806.42.0
180–200−11.3−9.6
200–240−21.6−27.7
240–280−20.9−69.2
280–32047.5−7.0
320–360−13.2−79.3
Publisher’s Note: MDPI stays neutral with regard to jurisdictional claims in published maps and institutional affiliations.

