1. Introduction
As the inventory of motor vehicles in China increases, it has brought a lot of convenience to people’s production and life. However, the huge traffic flow has also brought problems such as traffic jams, frequent traffic crime incidents, etc. Problems such as motor vehicle theft, traffic violation, fake plate vehicles, and license plate number covering, etc., have plagued the Traffic Control Department. The intelligent traffic system (ITS), being modern traffic management, urgently needs to solve these problems. It has become an important development direction for ITS to integrate intelligent image processing technology based on machine vision and pattern recognition into ITS closely with advanced hardware technology so as to improve the efficiency of traffic management [
1].
The traffic block port is a special facility with the nature of supervision established by the Traffic Control Department at important sections, junctions, and expressway exits and entrances of the city. The image collected by the camera is mainly used in the traffic block port system to recognize the license plate acquired and then lock the target vehicle [
2]. However, the current vehicle management system only contains information such as the license plate number, body color and driving speed, etc., of the vehicle, while other information of the vehicle, such as the front features of the vehicle body (also known as the vehicle face), is not stored. In many cases, when illegal and criminal vehicles are involved, criminal suspects often fake, cover, destroy, and even forge license plates to avoid traffic regulations. In such cases, the problem of invalid license plate recognition will occur, and hence effective information cannot be provided to the relevant administrative departments. Therefore, if the front image of the vehicle can be obtained through the traffic block port, and other characteristics of the vehicle (such as the vehicle face) can be used to achieve the multi-angle recognition of the passing vehicle and judge its relevant information [
3,
4]. This will undoubtedly bring great help to the work of the Traffic Security Department to prohibit illegal license plate vehicles and track down criminal suspects.
In extreme light conditions, low light image processing and enhancement composed of low contrast and brightness will be the focus of the paper. Then we will analyze the images collected at the traffic block port at the beginning, and summarize the imaging characteristics of different periods of time under low light images. Further, we will design the corresponding classifiers according to the characteristics, and then process them by using different image enhancement algorithms. We will also use objective image quality measurement indices to evaluate the enhanced images qualitatively and quantitatively. The experiment shows the rationality and effectiveness of the methods in the paper.
2. Image Classification
The image recognition algorithm at the traffic block port can be divided into two categories: traditional methods and algorithms based on deep learning. The former usually carries out binarization on the image while segmenting the characters. Because of the influence of light, there are many noise points in binary images, so how to reduce noise filtering is the most important part of this algorithm. For example, a hybrid license plate character segmentation algorithm is proposed in the paper [
5], combining the license plate character segmentation of connected areas and the character segmentation based on conditional random field, so as to solve the problem that the traditional license plate character segmentation is difficult to solve low image quality license plate. The improved high–low cap transformation is used in the paper [
6] to optimize the traditional fixed threshold binarization algorithm, and it is applied to the binarization algorithm of license plate image to moderate the effect of uneven light on license plate image. To eliminate the interference points around the license plate, the license plate color feature is firstly used in the paper [
7] to generate a gradation image and carry out binarization. Logic and operation are performed with binary images generated based on HIS (Hue, Saturation and Intensity) space. The image enhancement method is firstly used in the paper [
8] to increase the image contrast and weaken the effect of uneven light on positioning, and then the Canny arithmetic operators are used to detect the image edge. Although the above methods for noise reduction filtering of binary image improve the accuracy of character segmentation to a certain extent, they have little significance for license plate area detection and vehicle face recognition, especially after the advent of deep learning correlation algorithms. It uses the convolutional neural network to automatically extract the high-level semantic features of the image without binarization operation, and can directly design the network structure to complete the recognition task. Because of the difference between the algorithms, the corresponding enhancement algorithm should also be different.
Although the algorithm based on deep learning performs well in the data set, the recognition rate is reduced in the actual scene, which indicates that the reason for the low recognition rate has nothing to do with the selection of detection algorithm, but the robustness of the algorithm in complex scenes needs to be improved. To solve this problem, some special image preprocessing for the collected complex images is carried out in the paper [
9] according to the characteristics of complex scenes, including image defogging processing, light compensation processing, and demotion blur processing, and simulation tests for all the preprocessing methods are also conducted. The results show that image preprocessing (image enhancement) has a good effect on image sharpening. Although this method improves the accuracy of the recognition algorithm to a certain extent, it does not analyze the complex scene and its image characteristics in detail. For example, in the complex light condition, the contrast and brightness of images are different between day and night due to the characteristic of working around the clock and without interruption of the traffic block port system, so it is obviously unreasonable to adopt a unified image enhancement algorithm. To enhance the robustness of the algorithm, it is necessary to classify the processed images, so as to improve the image quality and then improve the accuracy of vehicle face recognition.
2.1. Image Analysis of Traffic Block Port
The data used in the paper comes from the vehicle images collected by a high-definition camera at the traffic block port of a Chinese city, and the sizes of the images are 1632 × 1232. Since these images are collected at different road sections around the clock, the license plate and vehicle face recognition algorithm developed by using this image source have certain universality and applicability. Through the analysis of the original images, it is found that low light exposure has a great influence on the clarity and quality of the images. For example, in some cases, the car body is dark due to the low light, with low contrast with the surrounding environment, or even completely out of sight.
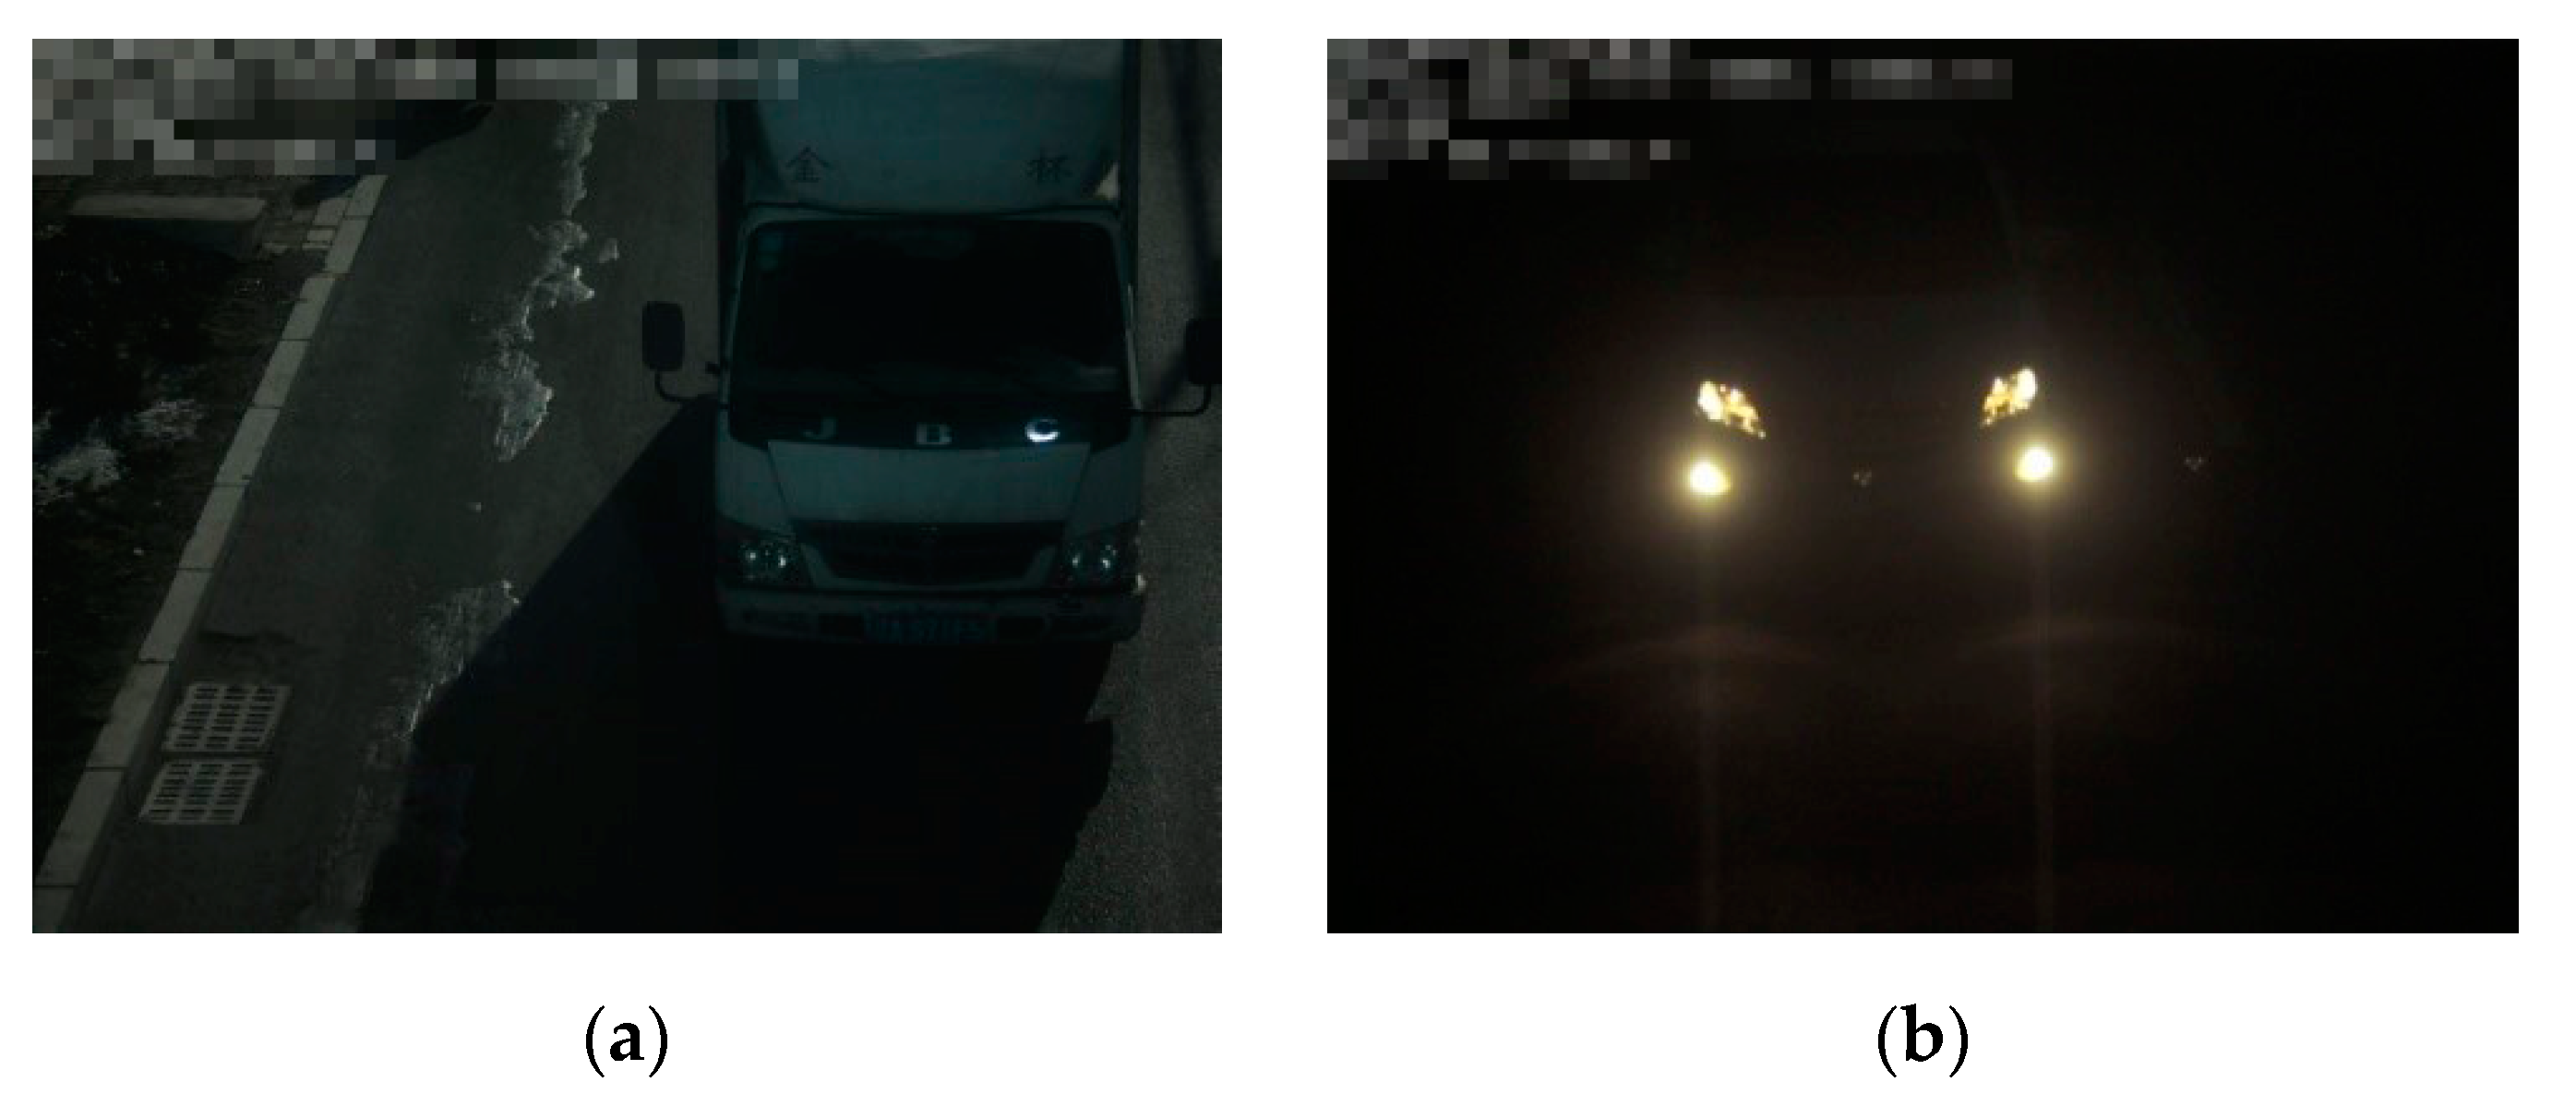
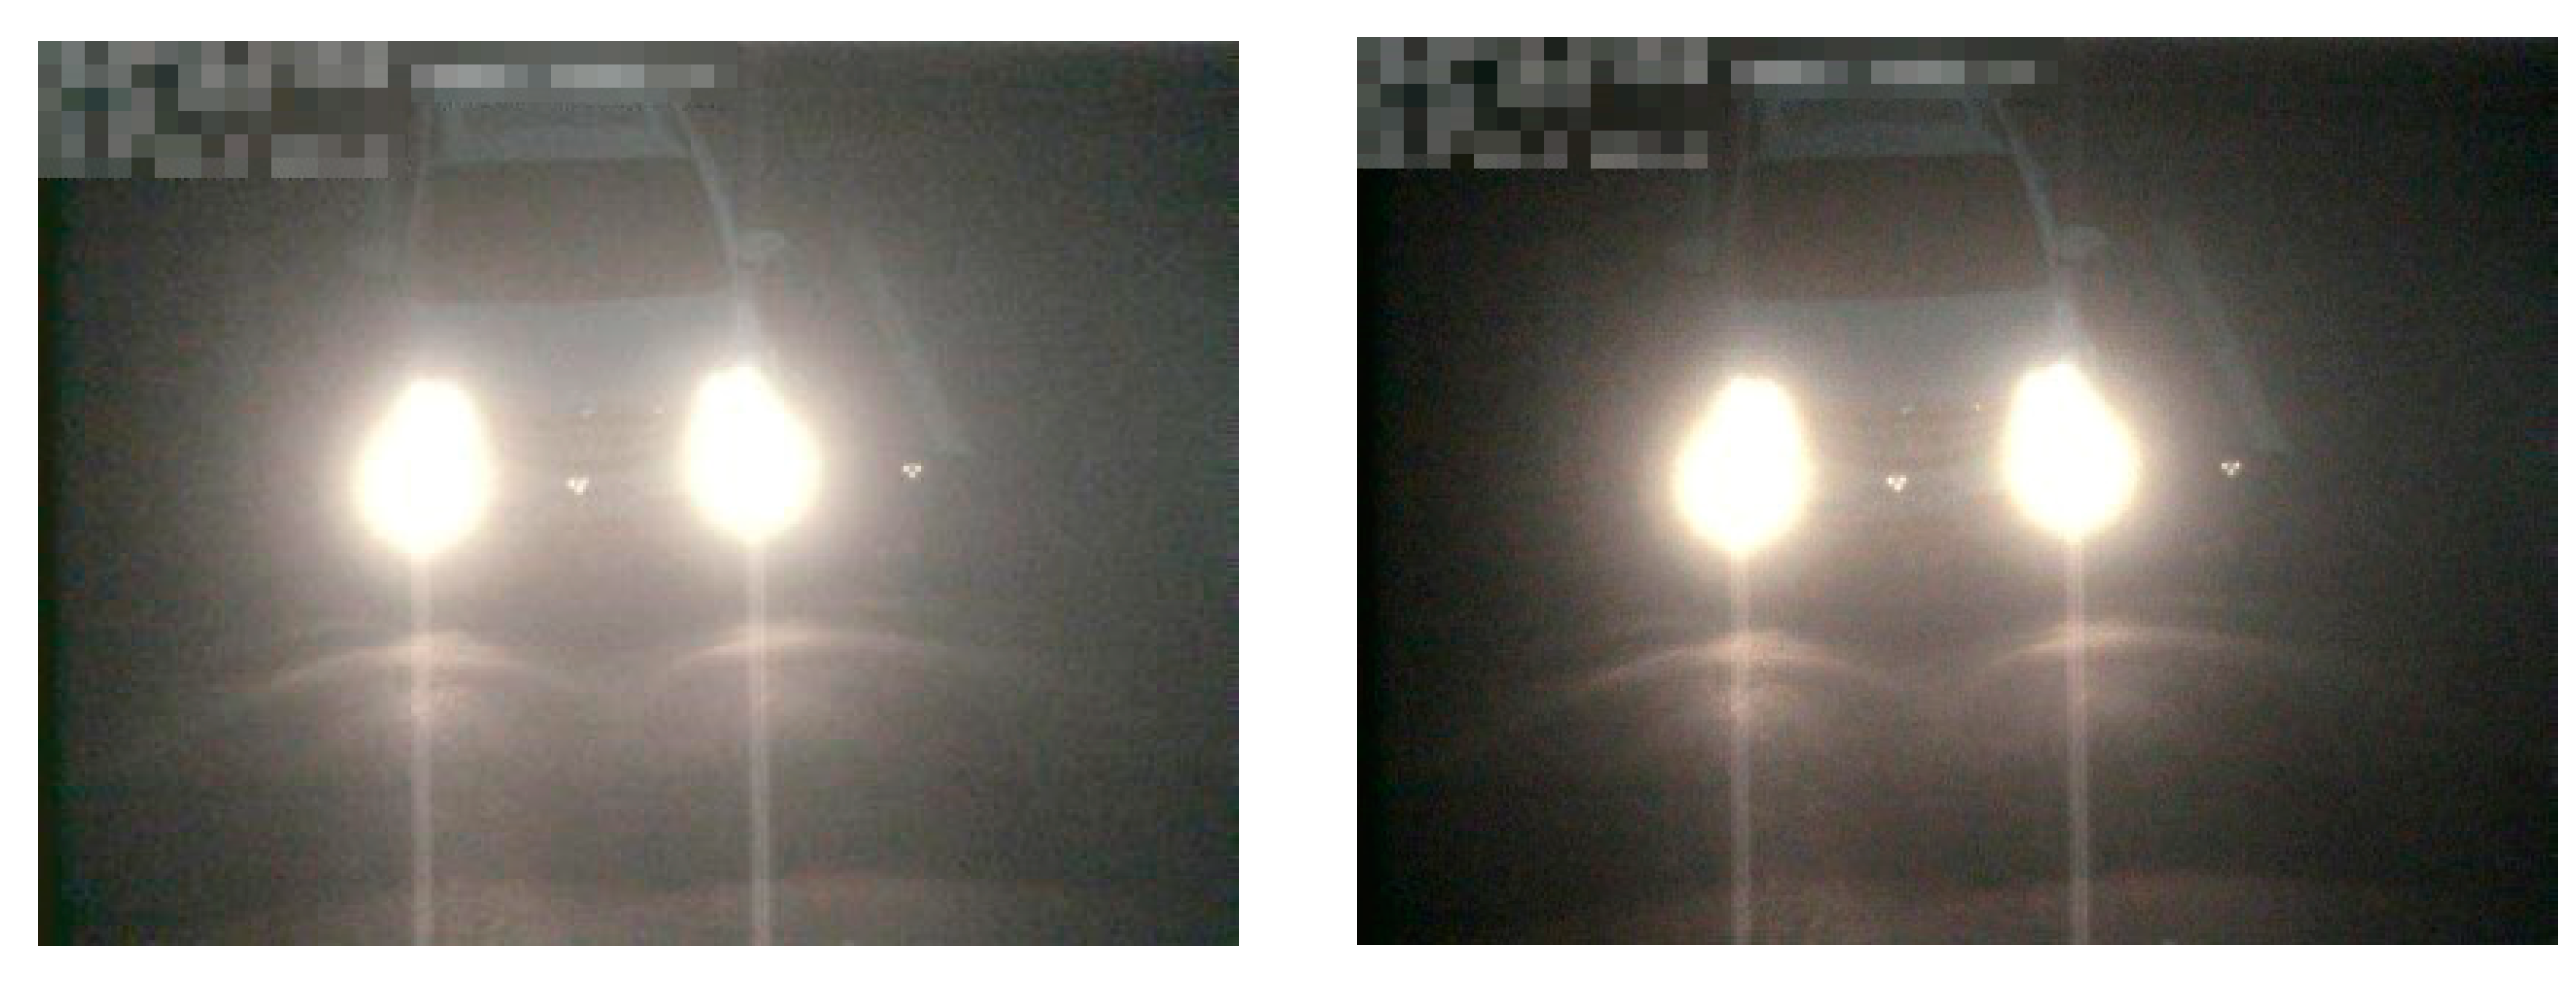
The low-light image at day refers to the fact that the brightness of the whole image is slightly lower, but the contrast of the image is extremely low as a result of the lack of light and the off of the supplementary light of the license plate recognition system or the unsatisfactory light supplementary effect in the morning, at dusk, on cloudy or rainy days, as shown in the
Figure 1a. Low-light image by night refers to the fact that the supplementary light of the license plate recognition system is not turned on at night or the effect is very poor after it is turned on, which makes the brightness and contrast of the whole image very low, but the headlights are extremely bright, and this is shown in the
Figure 1b. Therefore, low-light images can be divided into two categories according to different periods of time: low-light pictures by day and low-light pictures by night, and the classification standard is from 7:00 a.m. to 6:00 p.m.
Through the above low light image analysis, it can be further summarized that: the overall brightness of both day and night images is somewhat dark. For low-light images, because the contrast is extremely low, the license plate position cannot be recognized by the naked eye, so the operation of supplementary lighting should be carried out. Because of the difference in brightness and contrast between day and night images, different processing methods should be adopted.
2.2. Design of Image Classifier
To realize the classification of block port image difference, an image light intensity classification algorithm is proposed in the paper. Image features, which are often manually designed features or color and texture features, are extracted firstly in traditional image classification. According to the statistical features, a classifier is selected to achieve the corresponding purpose. These classifiers usually include support vector machine, random forest, neural network, etc. However, due to different shooting angles of traffic block the port, complex background and lighting, and other factors, traditional features often fail to meet the requirements, resulting in low classification accuracy [
10,
11].
Since 2012, the convolutional neural network has shown a strong advantage in image classification and its stronger feature presentation ability has also been recognized by more people [
12]. Different from the traditional manual feature extraction, the convolutional neural network can extract the high-level semantic feature of the image. With the deepening of the network structure, these features become more and more abstract. With the complexity and difference of license plate images collected under different lighting conditions being taken into consideration, Lenet5 convolutional neural network is designed to classify the enhanced images in the paper [
13]. The network schematic diagram is shown in
Figure 2, and it is composed of two convolution pooling layers and three fully connected layers, where the loss function is defined as the cross-entropy loss function. The stochastic gradient descent method is adopted to update and iterate the parameters. We have split the total 500 samples into 400 training samples and 100 testing samples, in which the training accuracy rate reached 99.3% after 1000 iterations of the training dataset and the testing accuracy rate reached 98.2% after 10 iterations of the testing dataset.
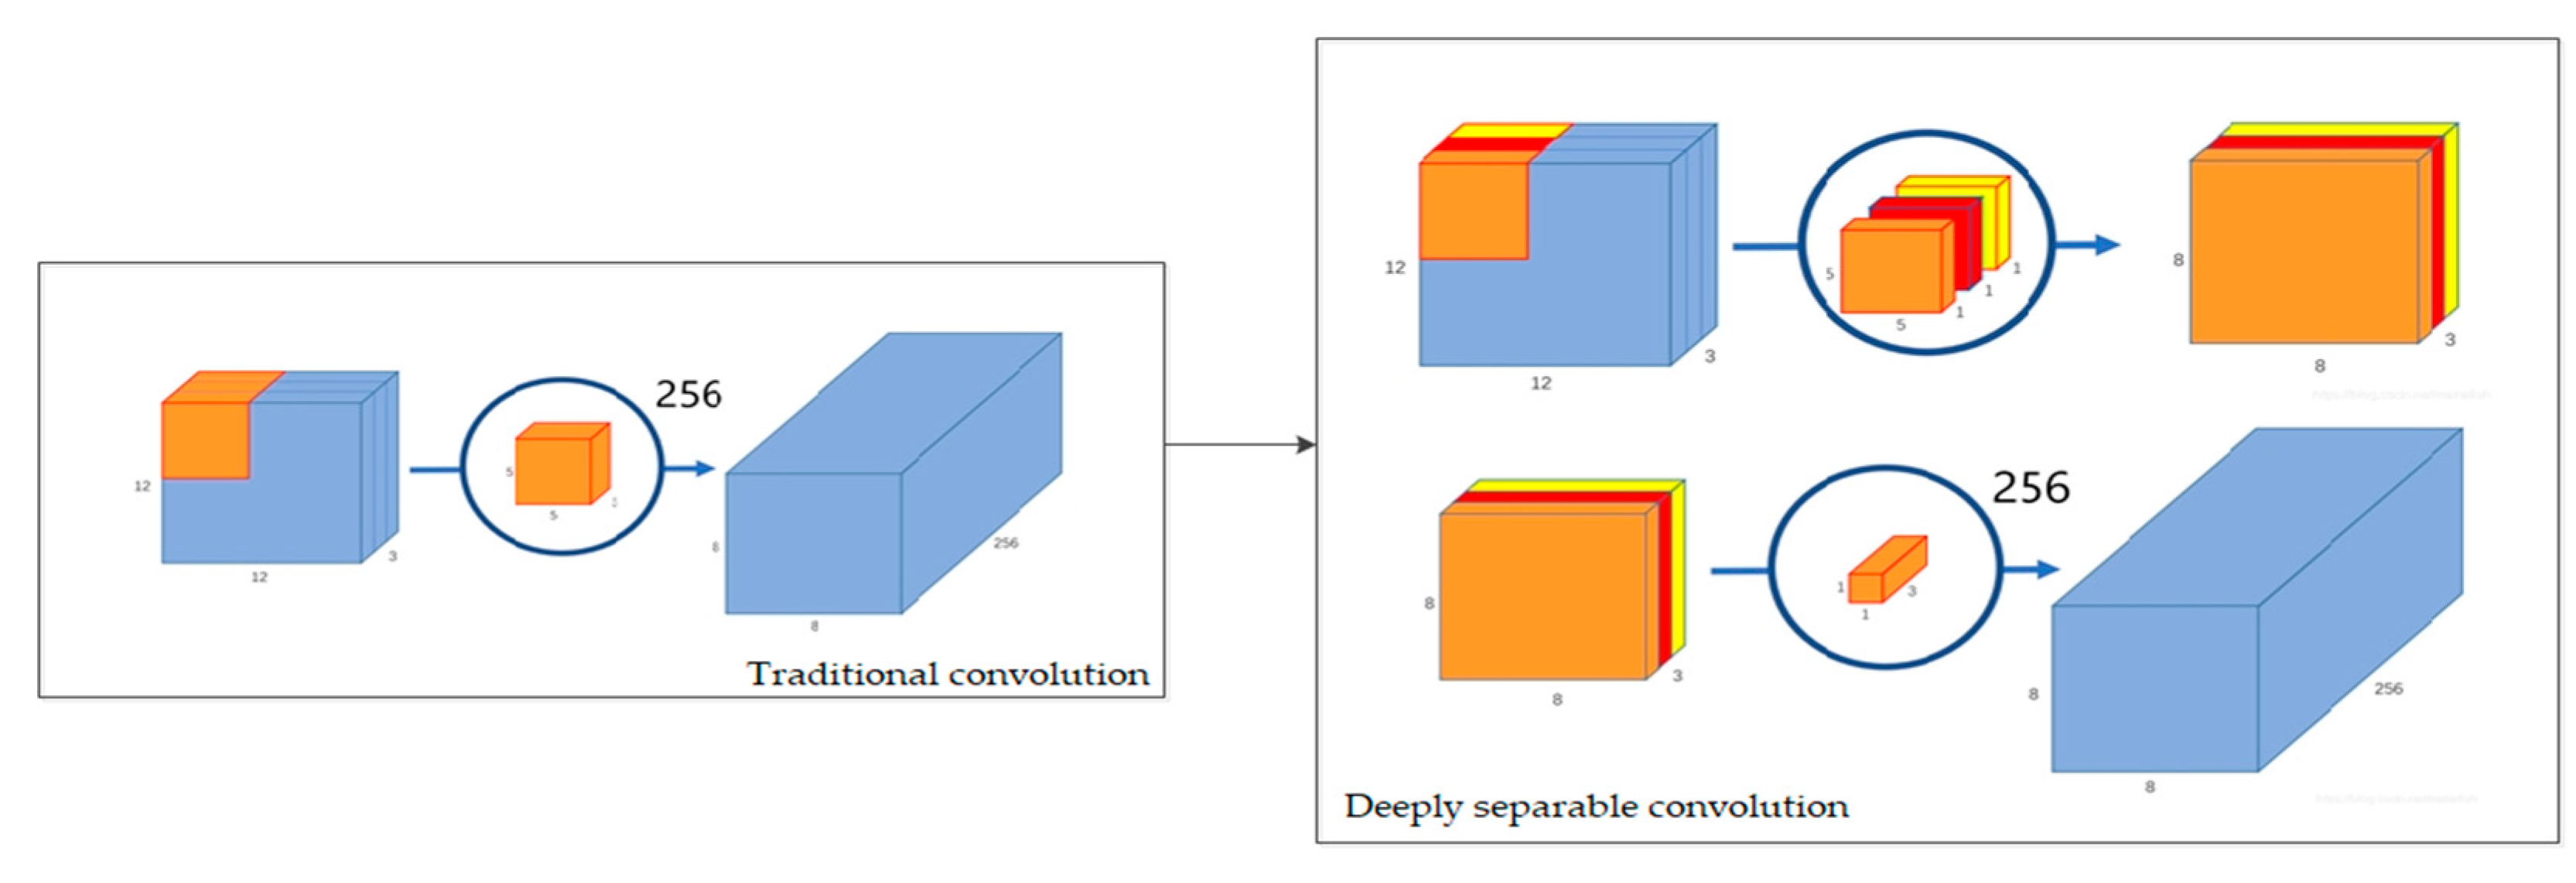
Compared with other convolutional neural networks, the Lenet5 network can be regarded as the basis of numerous convolutional neural networks, and only five layers of network structure can achieve high accuracy in this classification problem. However, with the real-time performance of the system being taken into consideration, a lightweight network structure is adopted in the paper: replace the original convolution with a deep separable convolution [
14,
15]. The schematic diagram of deeply separable convolution is shown in
Figure 3. Different from traditional convolution, this convolution core performs depth calculation firstly, that is, convolution computation is performed on each channel of the input image after separation on the channel; and then operates the dot convolution, that is, the computation is performed by using the 1 × 1 convolution core. In
Figure 3, the feature graph of 12 × 12 × 3 is taken as an example, and the convolution computation is carried out through convolution core of 5 × 5 with the output feature graph of 8 × 8 × 256. The traditional convolution can be regarded as 256 5 × 5 × 3 cores moving 8 × 8 times, with a computation burden of 5 × 5 × 3 × 256 × 8 × 8 = 1,228,800. In deep separable convolution, deep computation is when 3 5 × 5 × 1 convolution moves 8 × 8 times and the dot convolution is when 256 1 × 1 × 3 convolution cores moves 8 × 8 times. Its computation burden is 5 × 5 × 3 × 8 × 8 + 1 × 1 × 3 × 8 × 8 × 256 = 53,952. This shows that its computation burden has been reduced by nearly 23 times. In the experimental phase, the three convolution computations in Lenet5 are replaced by deep separable convolution, and the same hyper-parameters and training data are used to achieve the accuracy rate of 97.7%. At the same time, in order to demonstrate the effectiveness and accuracy of this method, three different algorithms of SVM (support vector machine), random forest and logic regression are also tested in the paper. After the same iterative training, the accuracy rates are 89.3%, 91.9% and 91.2% respectively. As shown in
Table 1, it indicates that the convolutional neural network is apparently superior to the traditional algorithms in the binary classification of low-light images.
In this section, we give a detailed background on the problem of license plate recognition under complex lighting conditions, research and analyzed the advantages and disadvantages in reference literature, and on the basis of the original algorithm, this article analyzes the characteristics of the image under low-light conditions in detail. At the same time, we proposed an algorithm that first classify different pictures, and then use different algorithms to enhance them according to their characteristics. After comparative experiments, separable convolution is used in the final image classification.
3. Research on Image Enhancement Algorithm under Low Light Condition
In a complex lighting system, there is a strong symmetry relationship between high light and low light illumination at night and day, so the research should be carried out separately. In this paper, the night and day images under low light illumination are studied. The overall block diagram of the image adaptive enhancement algorithm under low light conditions is shown in
Figure 4: the adaptive enhancement algorithm is composed of four parts, namely, fast image classification module, low-light image enhancement module by day, low-light image enhancement module by night and image quality evaluation module. Among them, the fast image classification module is introduced in detail in
Section 2.2. Its main feature is to replace traditional convolution with deep separable convolution, which reduces computation burden and improves speed based on relatively high classification accuracy; the difference between the image enhancement module and other algorithms is that different processing methods are adopted for different pathological images from the classification module. The selection of this part of the algorithm will be introduced in
Section 3, and the corresponding mathematical model will be described in
Section 4; the image quality evaluation module measures the loss of enhanced images from both subjective and objective perspectives. Its innovation lies in the adoption of a weighted comprehensive evaluation index.
3.1. Research on Enhancement Algorithm under Low Light Condition by Night
The main purpose of low-light image enhancement by night is to increase the contrast between characters in the license plate area and the background as much as possible without amplifying the noise and increase the overall brightness of the image at the same time.
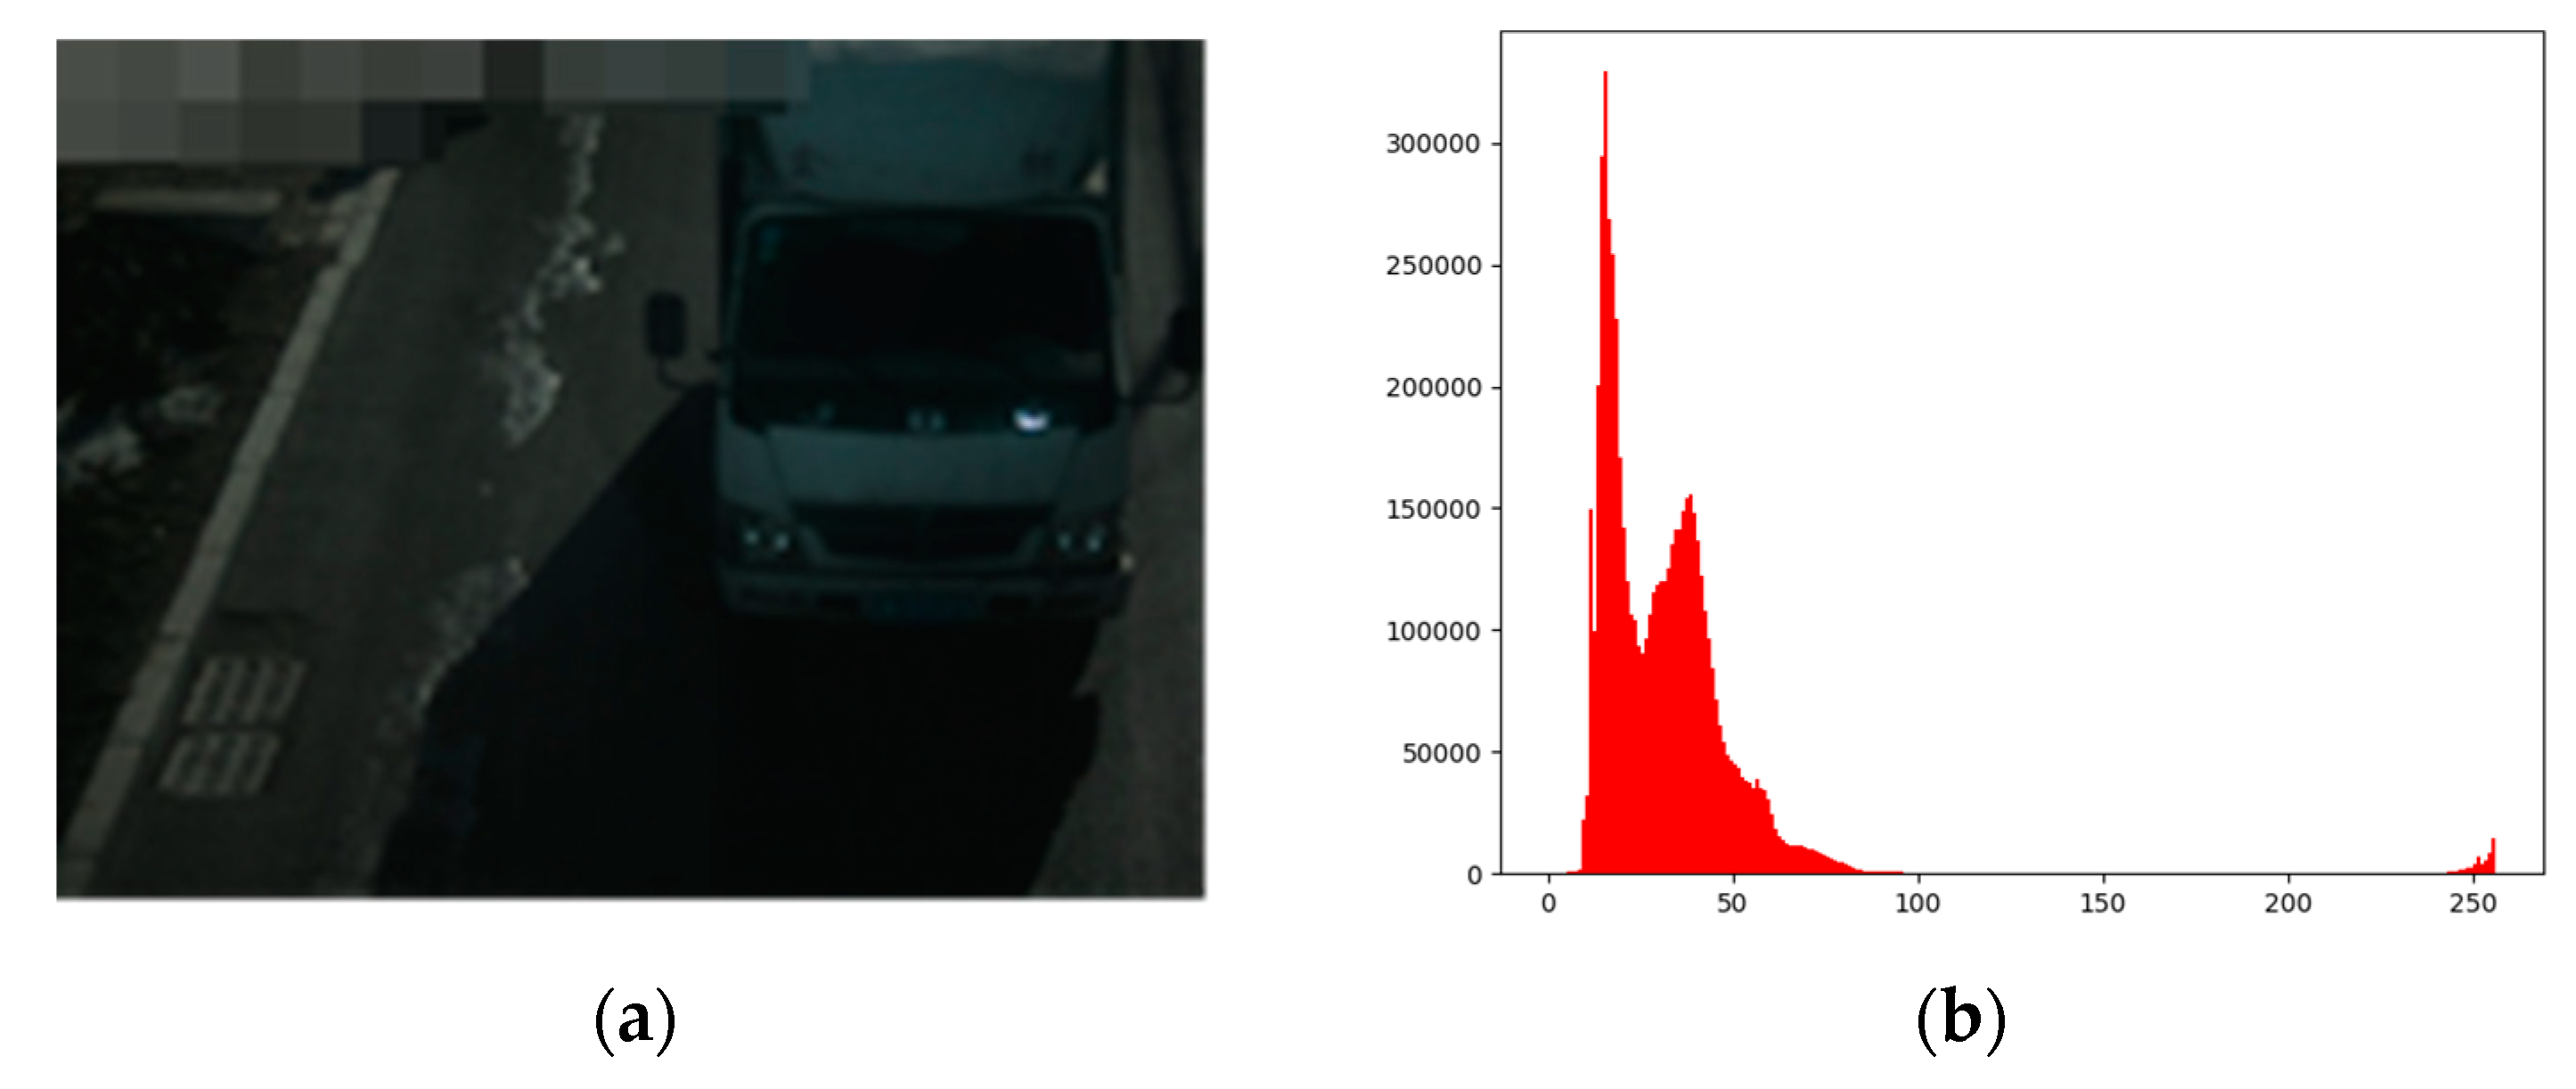
Figure 5a is an original image in low light by night, and
Figure 5b is a histogram of the gradation image of
Figure 5a. The basic characteristics of the low light image are that the dynamic range of image gradation is very narrow and accompanied by high random noise, the overall brightness of the image is very low, the gradation average is generally below 50, and its 2D chromaticity distribution histogram does not concentrate in a small range and is generally dispersed, but there is an obvious strong light in the position of the vehicle lamps in the image.
As can be seen from the gradation histogram in
Figure 5b, the gradation distribution of the entire image is within the range of [0–50]. The purpose of image enhancement is to extend the gradation level within this range. However, simple histogram equalization has a poor enhancement effect for low-light images by night, and piecewise linear transformation is difficult to realize self-adaptation in the selection of piecewise points. Although homomorphic filtering and wavelet transformation have a good processing effect, they cost a lot of computation burden and take a long time. In case the nonlinear transformation method (such as logarithmic transformation) is adopted, the enhancement of it will cause serious distortion and amplify noise due to the small dynamic range of gradation.
3.1.1. Enhancement Algorithm Based on Histogram
Figure 6a,b represent the effect of histogram equalization and global histogram equalization on the enhancement of the original image [
16]. After processing the original image, it can be found that after simple histogram equalization, the whole image is grayed out and the strong light part is amplified and cut, which leads to a lot of noise; the enhancement effect of global histogram equalization is not obvious.
3.1.2. Enhancement Algorithm Based on the Retina
Figure 7b,c represent the multi-scale retinal enhancement algorithm, color gain weighting algorithm, and color restoration multi-scale algorithm respectively. In contrast, the color gain weighting algorithm among the three methods has a better effect on the enhanced image. However, although the car observed in the dark in the original picture is recovered, a large amount of noise is introduced into the processed picture, and this part of noise cannot be filtered by the classical filtering algorithm [
17]. Meanwhile, this method is very time-consuming and costly, so this method is not used to enhance the picture.
3.1.3. Image Enhancement Algorithm Based on White Balance
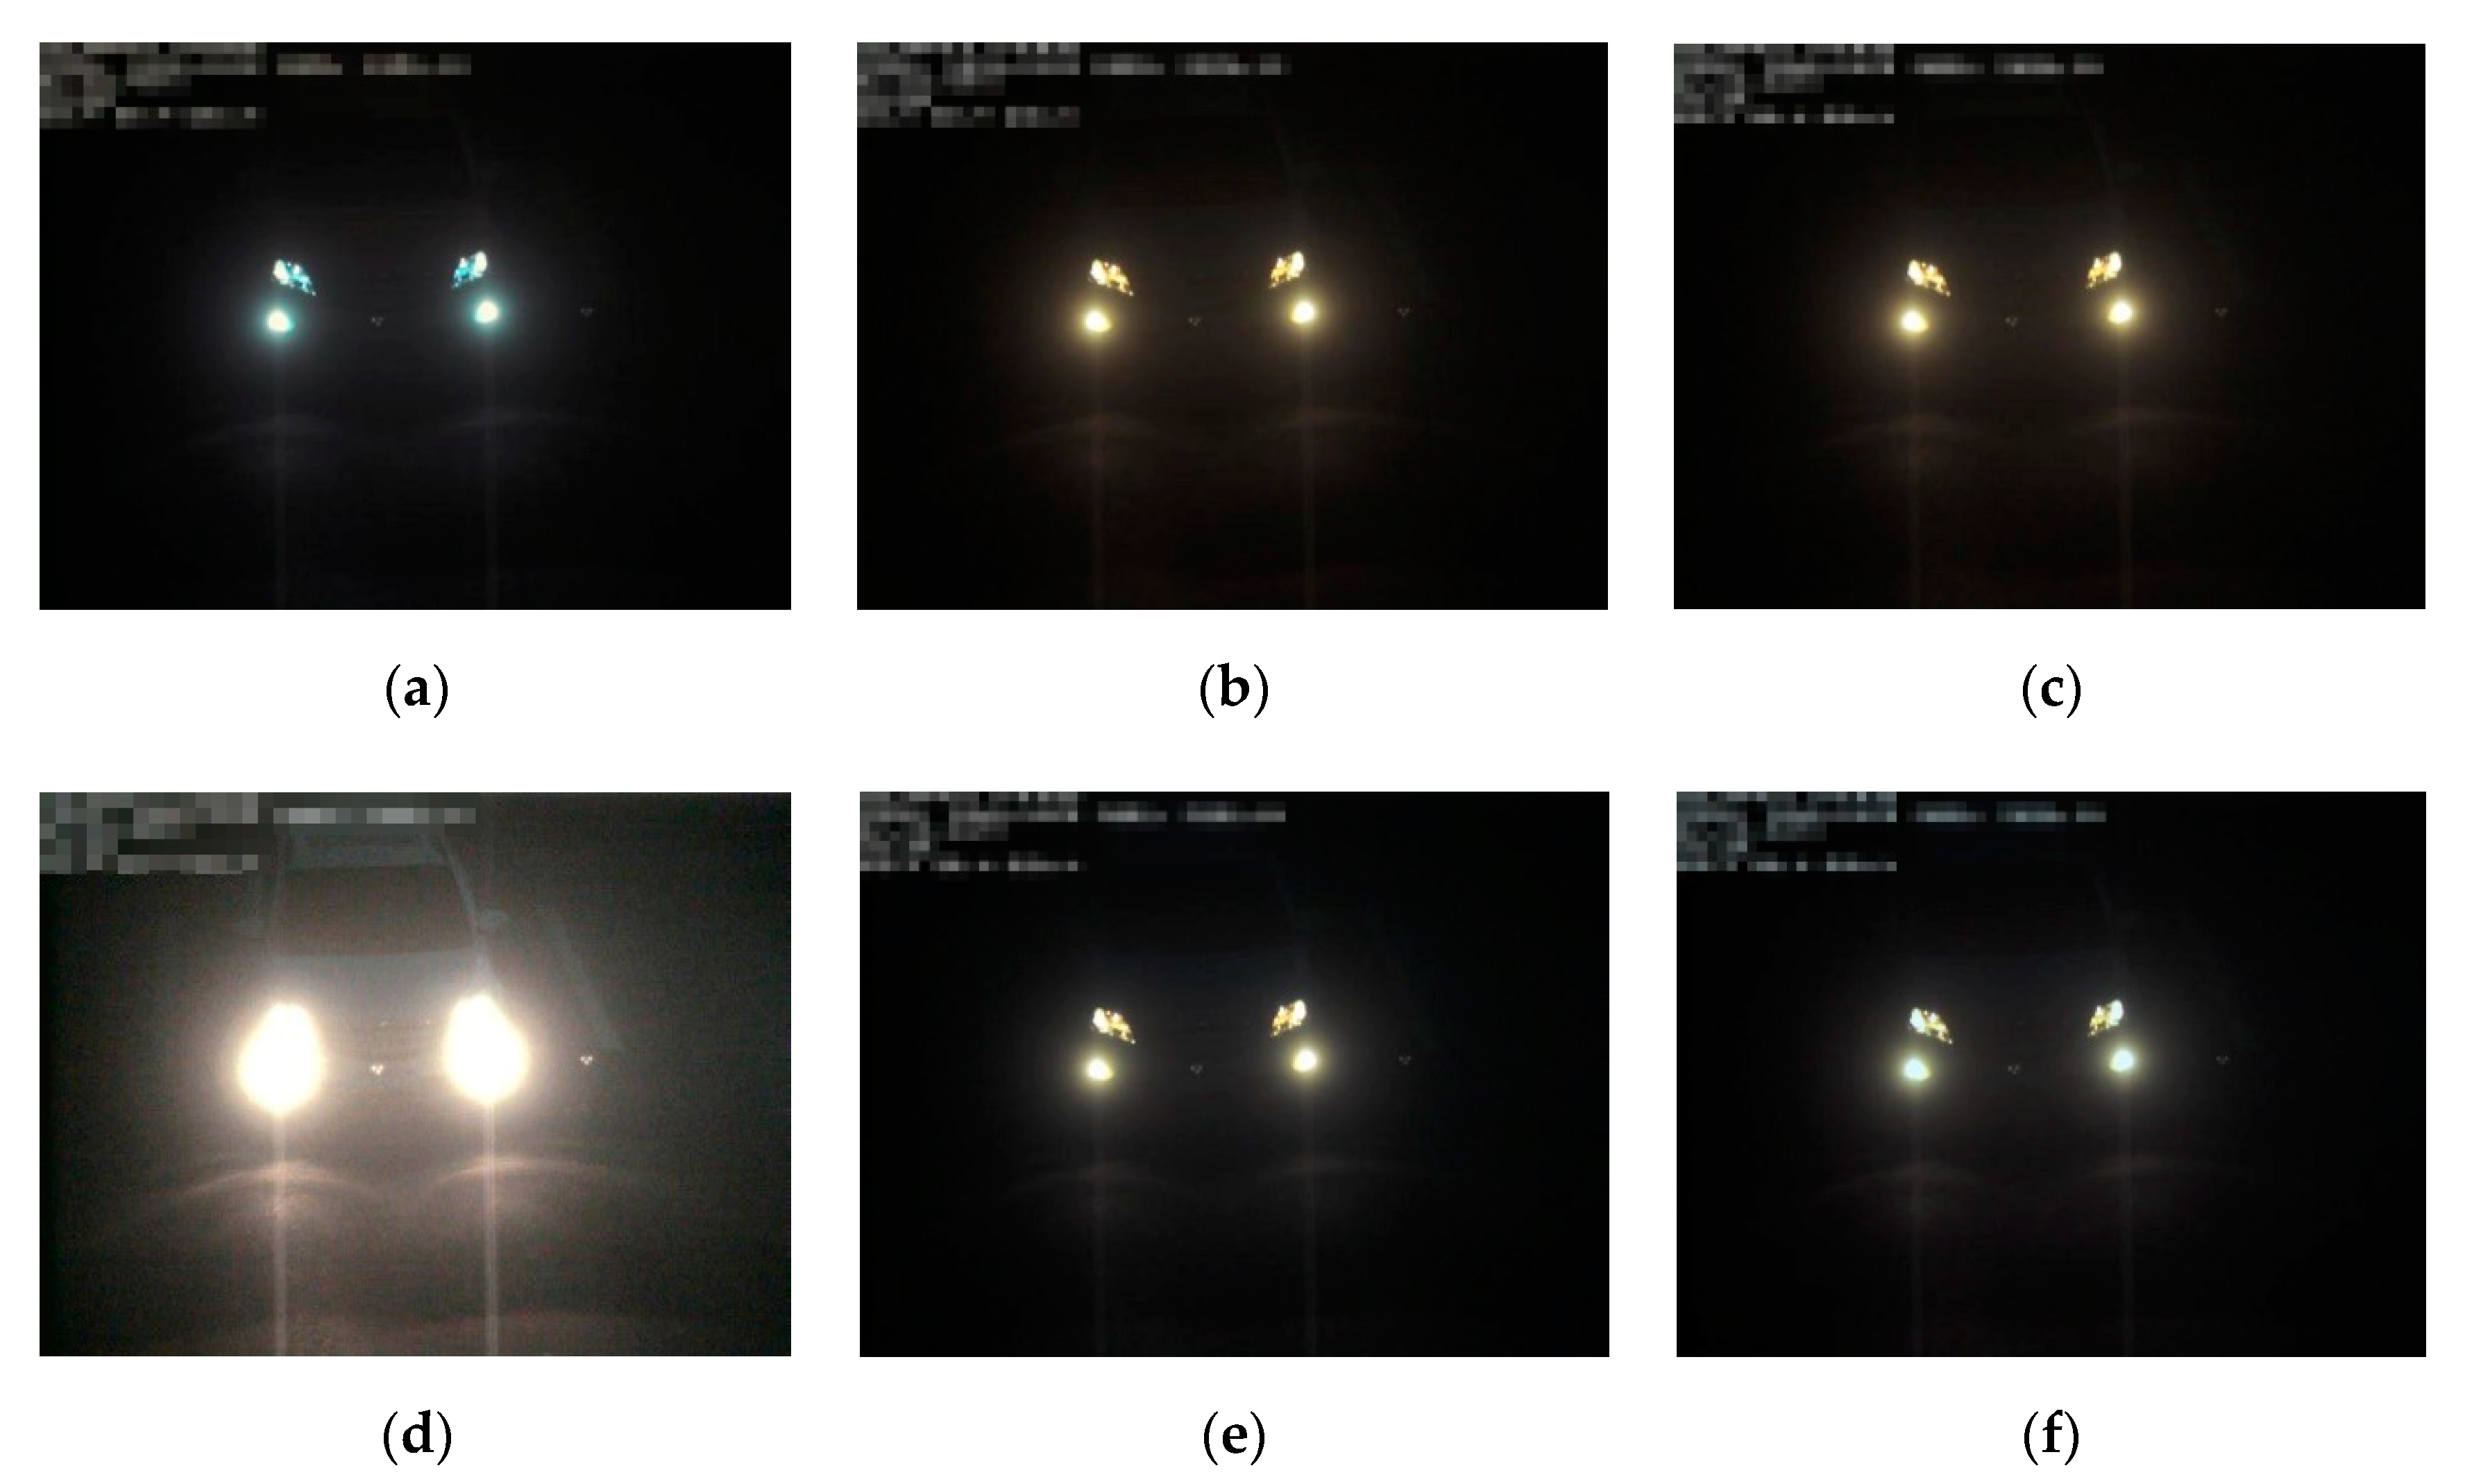
After the original picture is processed by the five different white balance algorithms in
Figure 8b–f in
Figure 8, only the dynamic threshold method will reveal the vehicles hidden in the overall black area [
18]. The other four methods cannot achieve the effect of image enhancement. However, due to the serious pathological conditions of the original image brightness and contrast, the overall brightness is still dark after the dynamic threshold method operation, and the highlight reflection part of the vehicle lamp is obvious, hence, the image should be enhanced a second time to further change the brightness [
19].
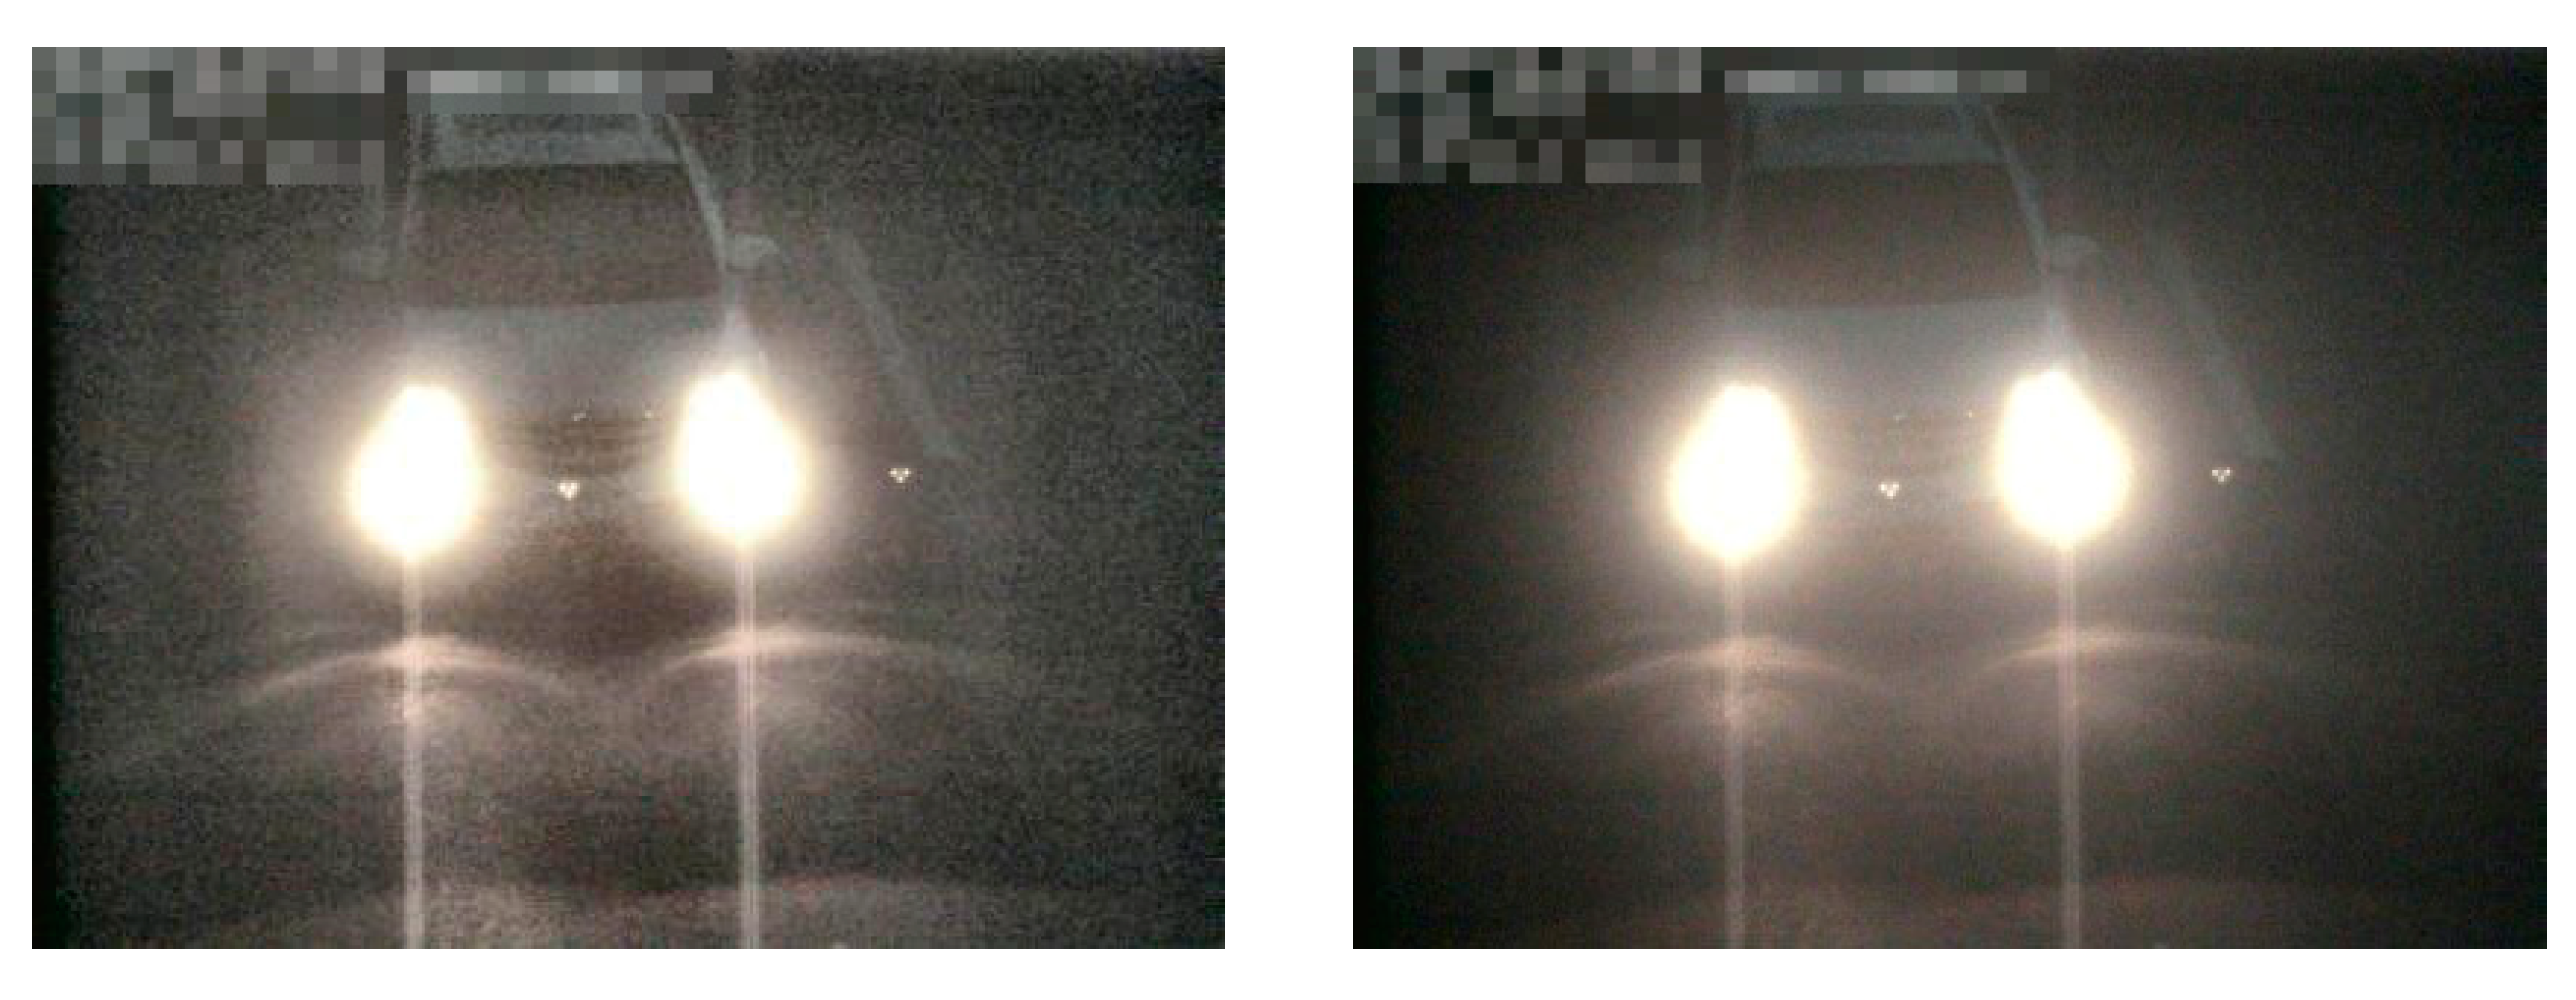
Figure 9 and
Figure 10 respectively represent the effect of secondary enhancement by adaptive histogram equalization and gamma transformation.
3.2. Research on Enhancement Algorithm under Low Light Condition by Day
The main purpose of low-light image enhancement by day is to enhance the brightness of the low-light image and stretch the image with moderate brightness. The low-light image mentioned in the paper refers to the overall low brightness of the image due to overcast days and rainy days, and the dynamic range of image gradation is concentrated in the area of medium and low brightness. The gradation average is generally within the range of [10–50], as shown in
Figure 11b.
Figure 12a–j represent different ways to enhance the low-light images by day. It can be found that the histogram equalization algorithm has an obvious enhancement effect on the image, but the overall image is white; in the white balance algorithm, the dynamic threshold method has a better effect, while the whole image is atomized after the retinal enhancement algorithm. Hence, the dynamic threshold method is intended to be used to enhance the original image. Unlike low-light images by night, low-light images by day can achieve good results without secondary enhancement.
In this section, we proposed the image enhancement algorithm under low light condition. Firstly, we experiment different enhancement algorithms in low light condition by day and night. After passing the subjective judgment of the enhancement effect, the dynamic threshold method, adaptive histogram equalization and gamma transformation are used in turn to enhance and improve the image quality of low light by night. By contrast, the dynamic threshold method is also intended to be used to enhance the original image of low light by day.
4. Mathematical Model of the Enhancement Algorithm
4.1. Dynamic Threshold Method of White Balance
The dynamic threshold method is divided into white point detection and white point adjustment [
20].
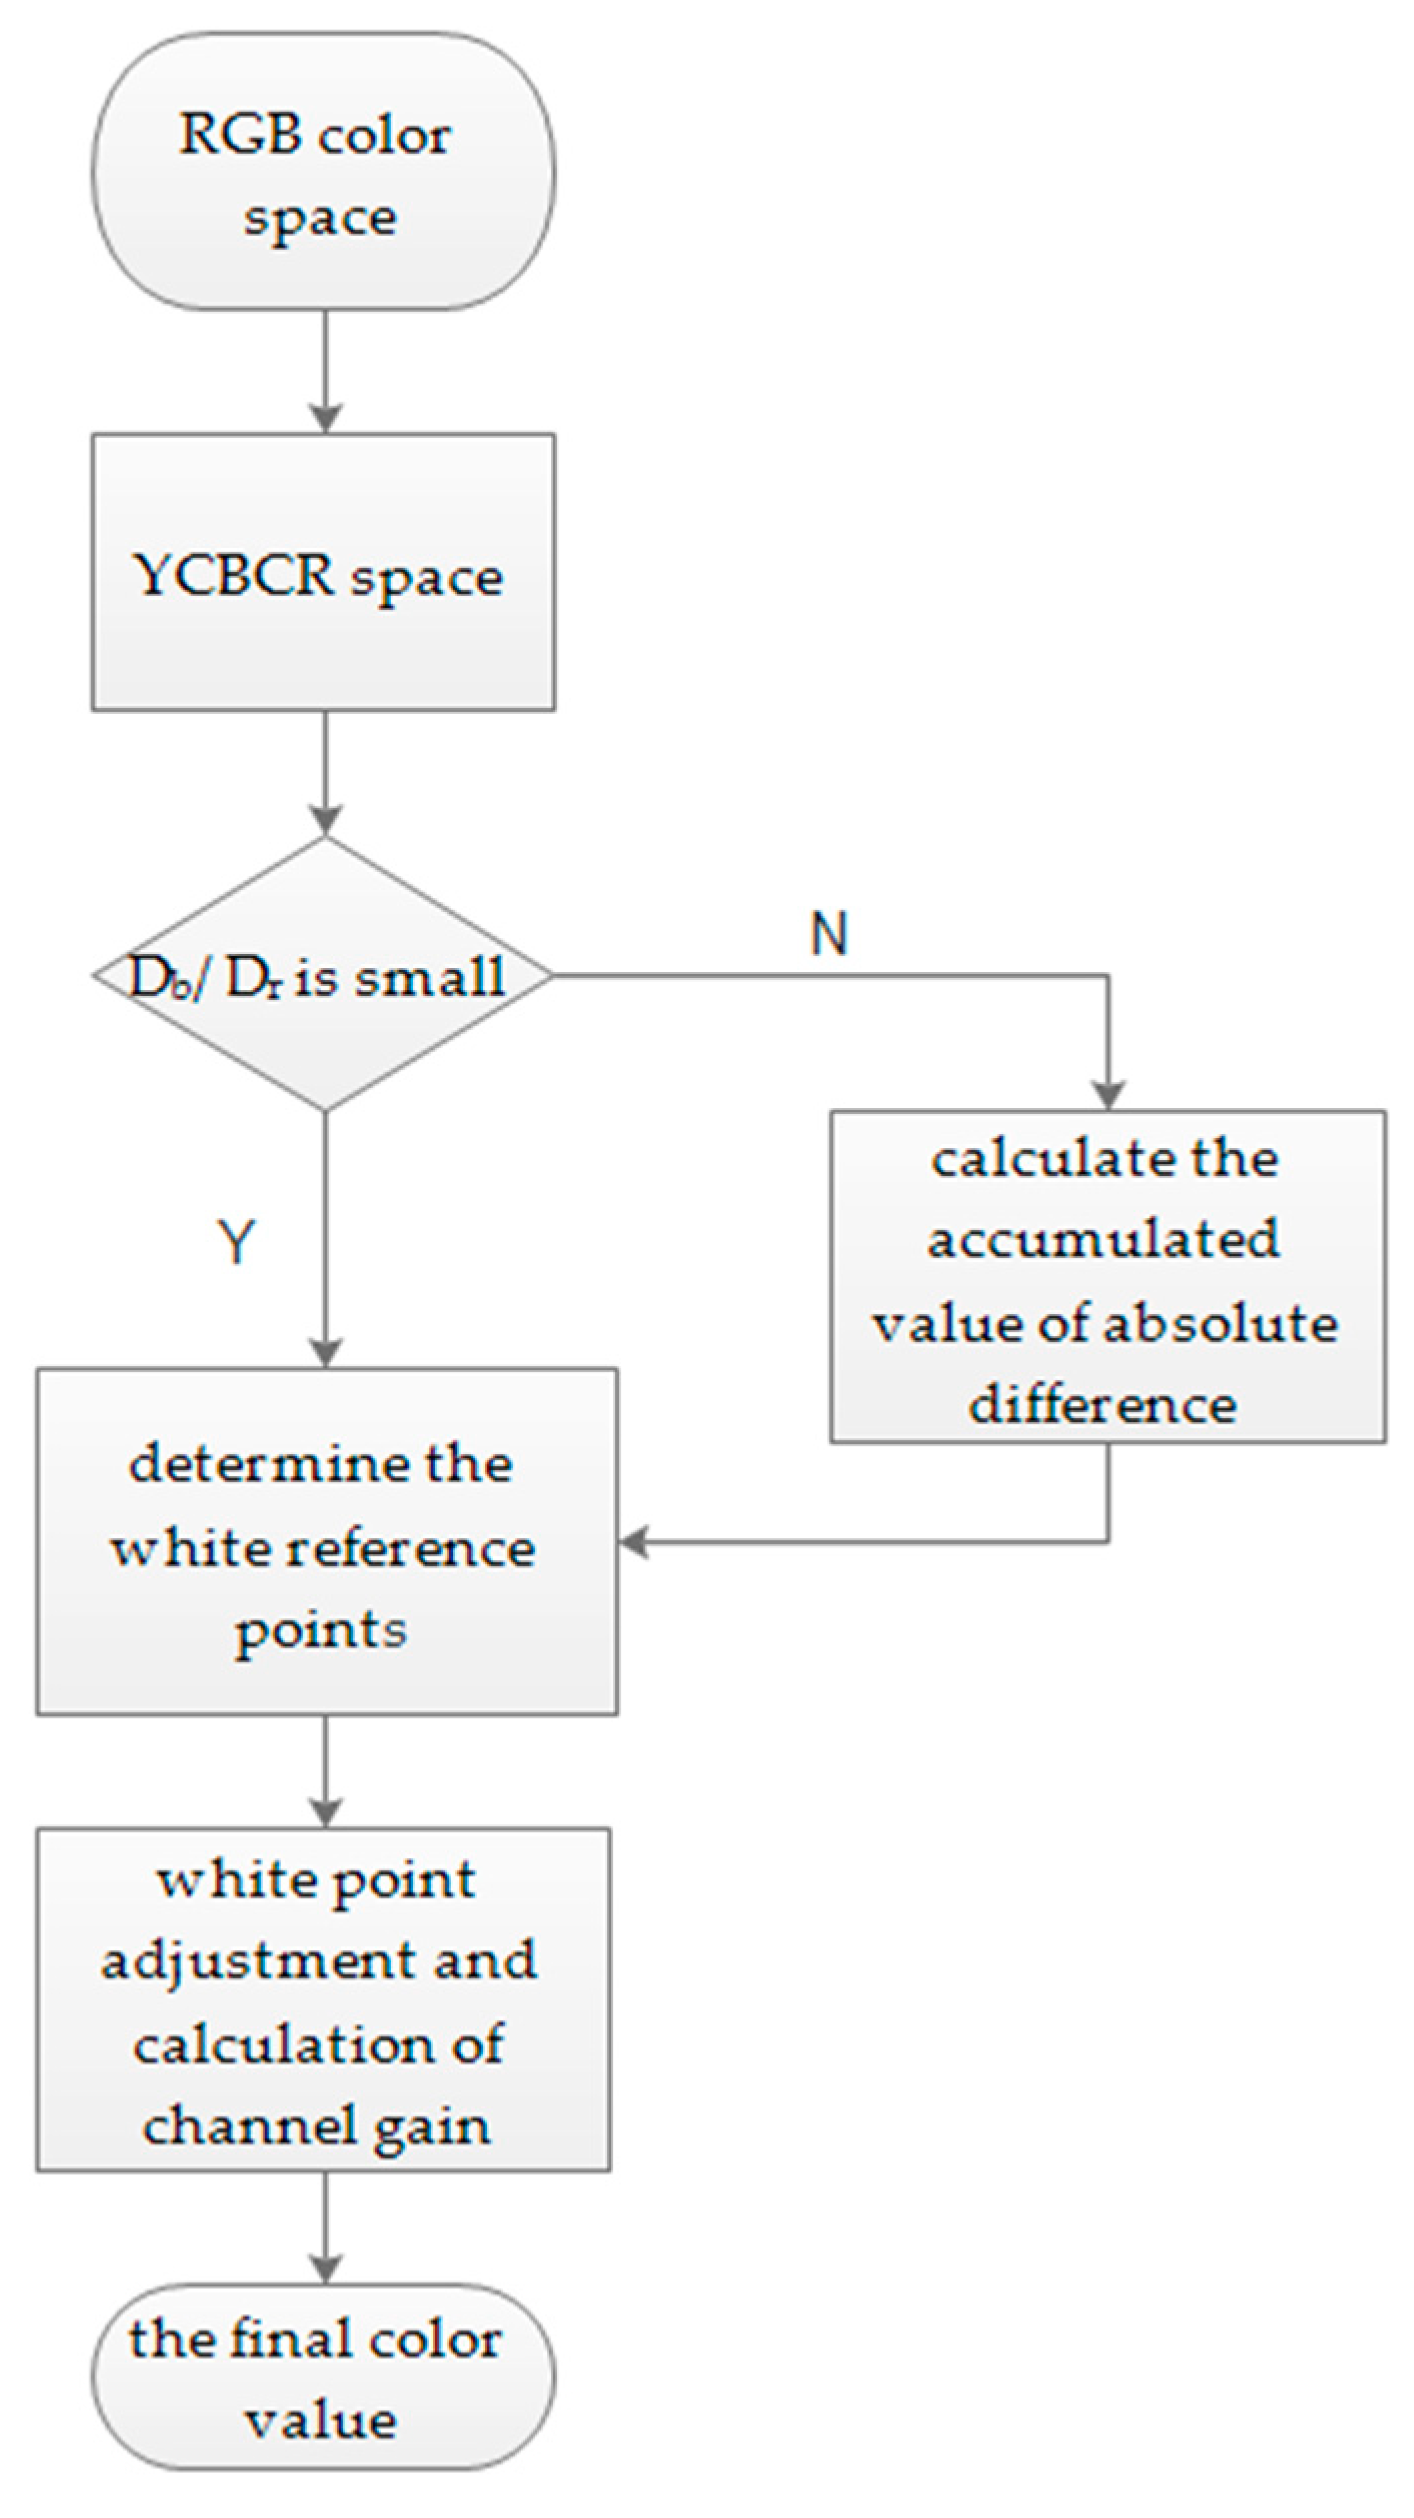
Figure 13 shows the calculation process of dynamic threshold method of white balance.
The function of white point detection is to enhance the robustness of the algorithm. The algorithm flow is as follows:
Step 1. The image is converted from RGB (Red Green Blue)color space to YCbCr color space and is divided into 12 parts. The average value Mb/Mr of the Component Cb/Rb in each area is calculated.
Step 2. The cumulative value D
b/D
r of the absolute difference of the Component C
b/R
b in each area is calculated according to the Equations (1) and (2):
Step 3. In case the value of Db/Dr is small, then this area will be ignored because it shows that this area is evenly distributed, but such an area is not good for white balance.
Step 4. The average values of M
b/M
r and D
b/D
r in all areas except the one in the previous step are counted as M
b/M
r and D
b/D
r of the whole image. Determine which points belong to the white reference points according to Equations (3) and (4):
Step 5. For the pixels that are preliminarily judged to belong to the white reference points, take the top 10% of its brightness value as the final white reference by size. Then make white point adjustment according to the Equations (5) to (7). In the equation, Ymax refers to the maximum value of the component y in the color space. First, we calculate the average value Raver, Gaver, and Baver of the brightness value of the white reference point. Then calculate the gain of each channel according to Equations (5)–(7):
Step 6. Calculate the final color value of each channel according to the Equations (8)–(10), where R/G/B is the value in the original color space.
4.2. Adaptive Histogram Equalization Algorithm
The essence of histogram equalization is gradation value mapping, in which the mapping function can be obtained from the distribution curve (cumulative histogram). In the Equation (11), A
0 refers to the total number of pixels (image area), D
max is the maximum gradation value, and D
A and D
B are respectively the gradation values before and after conversion, and Hi is the number of pixels of the gradation at the Level i.
Adaptive histogram equalization (AHE) is a computer image processing technique used to improve image contrast [
21]. Ordinary histogram equalization algorithm uses the same histogram transformation for the whole image pixel. For those images with more balanced pixel value distribution, the algorithm has a good effect. If the image includes areas that are significantly darker or brighter than the rest of the image, the contrast in those areas will not be enhanced effectively. The AHE algorithm changes the above problems by performing histogram equalization of the response to local areas. The simplest form of the algorithm is that each pixel is equalized by the histogram of the pixel in a rectangular range around it, that is, the transformation function is proportional to the cumulative histogram function around the pixel.
In this section, we conducted a detailed analysis of the mathematical model of the enhanced algorithm.
5. Image Quality Measurement Indexes
In image enhancement, it is usually necessary to measure the effect of processing after processing. In addition to subjective observation, objective measurement indexes are also needed. Because these objective indices are not mixed with subjective factors in the evaluation of image quality, they are more convincing for the accuracy of image quality. Usually, the indices to measure image similarity and loss degree include structural similarity measurement, normalized mutual information and perception hash algorithm, etc. On this basis, a comprehensive weighted image evaluation index is proposed in the paper.
5.1. Structural Similarity Measurement Algorithm
The structural similarity index (SSIM) is an index of measuring the similarity of two images. This index was first proposed by the Image and Video Engineering Laboratory of the University of Texas at Austin, as shown in the Equation (12). In the equation,
and
represent the average values of X and Y respectively;
and
represent the standard deviations of the two images respectively,
and
represent the variance of the two images respectively;
represents the covariance of the two images. C
1, C
2 and C
3 are constants, which maintain stability to keep the denominator from being 0. Usually,
is taken, among which K
1 = 0.01, K
2 = 0.03m, and L = 255. The final SSIM index is shown in the Equation (13). When it is set so that
, the equation can be reduced to Equation (14).
5.2. Normalized Mutual Information Algorithm
Normalized mutual information (NMI) is usually used as the judgment criterion or objective function in image registration, and the higher the value of it represents the higher similarity of two images. It has good registration accuracy and high reliability in the case of similar gradation series of two images [
22]; but at the same time, there are problems such as a large amount of computation burden and poor real-time performance [
23]. The principle is shown in Equations (15) to (18): among them,
and
represent the information entropy of the Image A and B respectively,
represents the joint information entropy of the two images, and
represents the normalized information entropy, that is, the normalized mutual information value of the final two images.
represents the probability of the Image A pixel value as a.
5.3. Perceptual Hash Algorithm
The perceptual hash algorithm (PHG) compares the degree of similarity of the two images by calculating the fingerprint information between them. The algorithm is characterized by a faster calculation speed. The algorithm is characterized by fast speed. Its algorithm flow is as below:
Step 1. Reduce the dimension of the image to 8 × 8 for a total of 64 pixels.
Step 2. Convert small 8 × 8 images into gradation images.
Step 3. Calculate the gradation average of all 64 pixels.
Step 4. Compare the gradation of each pixel with the average value. The gradation more than or equal to the average value is marked as 1; the gradation less than the average value is marked as 0.
Step 5. The combination of the 4 results to form a 64-bit integer is the image’s fingerprint (hash value).
Step 6. Calculate the hamming distance of different fingerprint information: a value of 0 indicates that the two images are very similar; if the Hamming distance is less than 5, it indicates that they are a little different, but are relatively close; if the hamming distance is more than 10, it indicates that these pictures are totally different.
5.4. Comprehensive Weighted Evaluation Indexes
A single image quality evaluation index can only measure the degree of image loss from a certain perspective, such as SSIM starts from the perspective of image pixel value; NMI starts from the perspective of information entropy; PHG starts from the hamming distance of the image after calculating the fingerprint information. To better measure the loss degree and similarity of images at different levels, a weighted comprehensive evaluation method is proposed in the paper. Its principle is shown in the Equation (19), where num represents the number of samples to be evaluated, i represents No. i sample to be processed, and w
1 = w
2 = w
3 = 3 represents the weights assigned to the three values. For the consistency of the trend of the three values, PHG index is inverted. The closer the final result is to 1, the smaller the image loss will be.
In this section, we have carried out a mathematical analysis on the related algorithms of image quality evaluation, and proposed a weighted algorithm based on it to increase the accuracy of measurement.
6. Experimental Results and Analysis
In the processing of low-light images, the method of dynamic threshold white balance is adopted in the first enhancement without distinguishing day from night. The difference between the two is that in the second enhancement, the low-light images by night will perform adaptive histogram equalization.
Figure 14 and
Figure 15 show the process of treating these two images and the visualization of the results. Among them,
Figure 14a shows a pathological low-light image by night. Pathosis refers to that the contrast and brightness of the images are both so low that the naked eye can only see the front lamp of the vehicle but cannot distinguish the vehicle face and license plate. For such pictures, face recognition of car license plate is not complete, but after second enhancement is conducted for the algorithm in the paper, the front part of the car can be revealed in the dark, although the license plate still cannot be seen, the vehicle face recognition can definitely be carried out.
Take the low-light picture in
Figure 15 as an example to show the processing flow of dynamic threshold white balance algorithm: first, after the image is converted from RGB color space to YCbCr space, the average
of the Component
in each area is calculated to be −0.023 and −1.176 respectively. Then, calculate the cumulative value
of the absolute difference of the Component
in each area to be 2.433 and 6.976 respectively according to the Equations (1) and (2). Then preliminarily determine which points belong to the white reference points and mark them in the image according to Equations (3) and (4), then take the top 10% of its brightness value as the final white reference by size. According to Equations (5)–(7), calculate the gain of the three channels of RGB to be 4.97, 4.67, and 4.70 respectively. Finally, the color value of each channel can be calculated according to Equations (8)–(10) to achieve the purpose of enhancement.
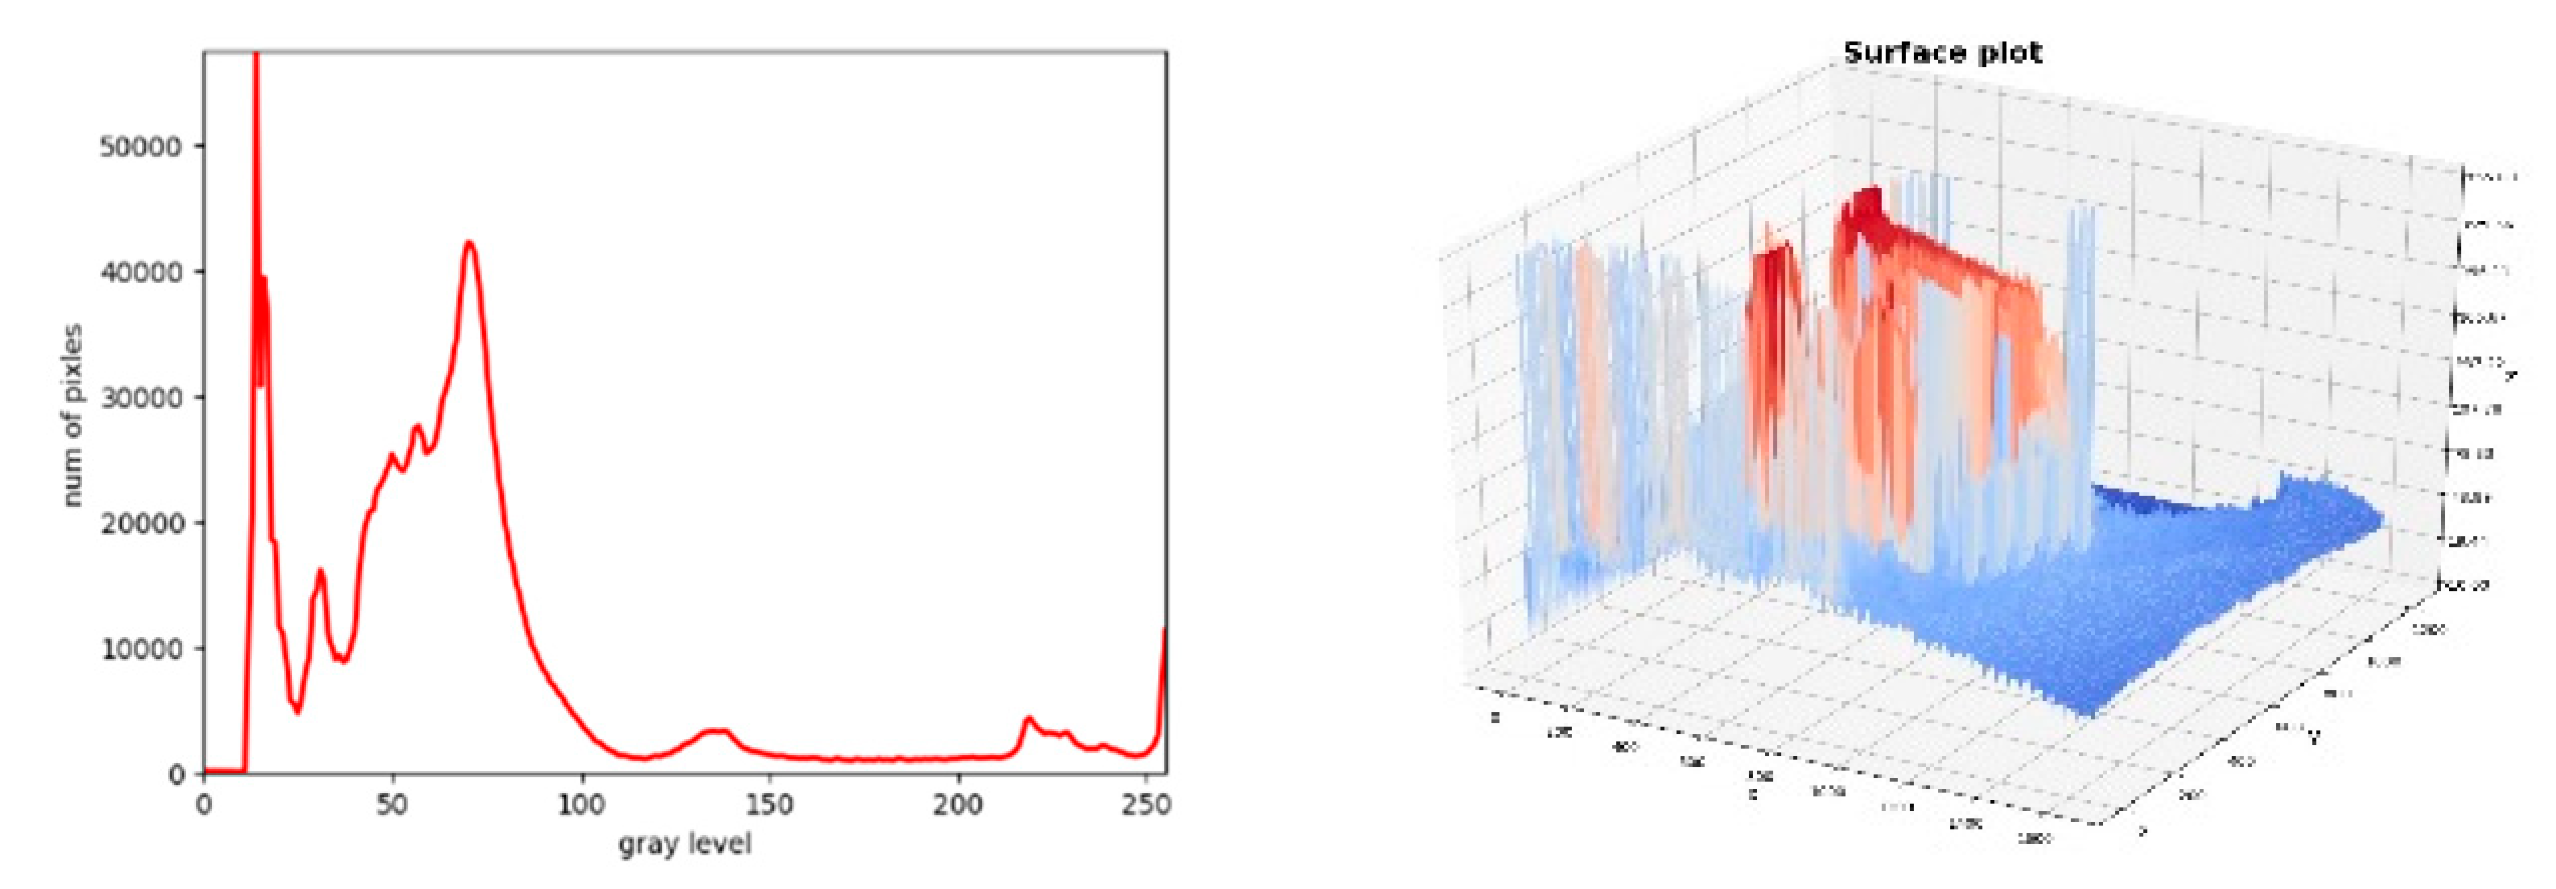
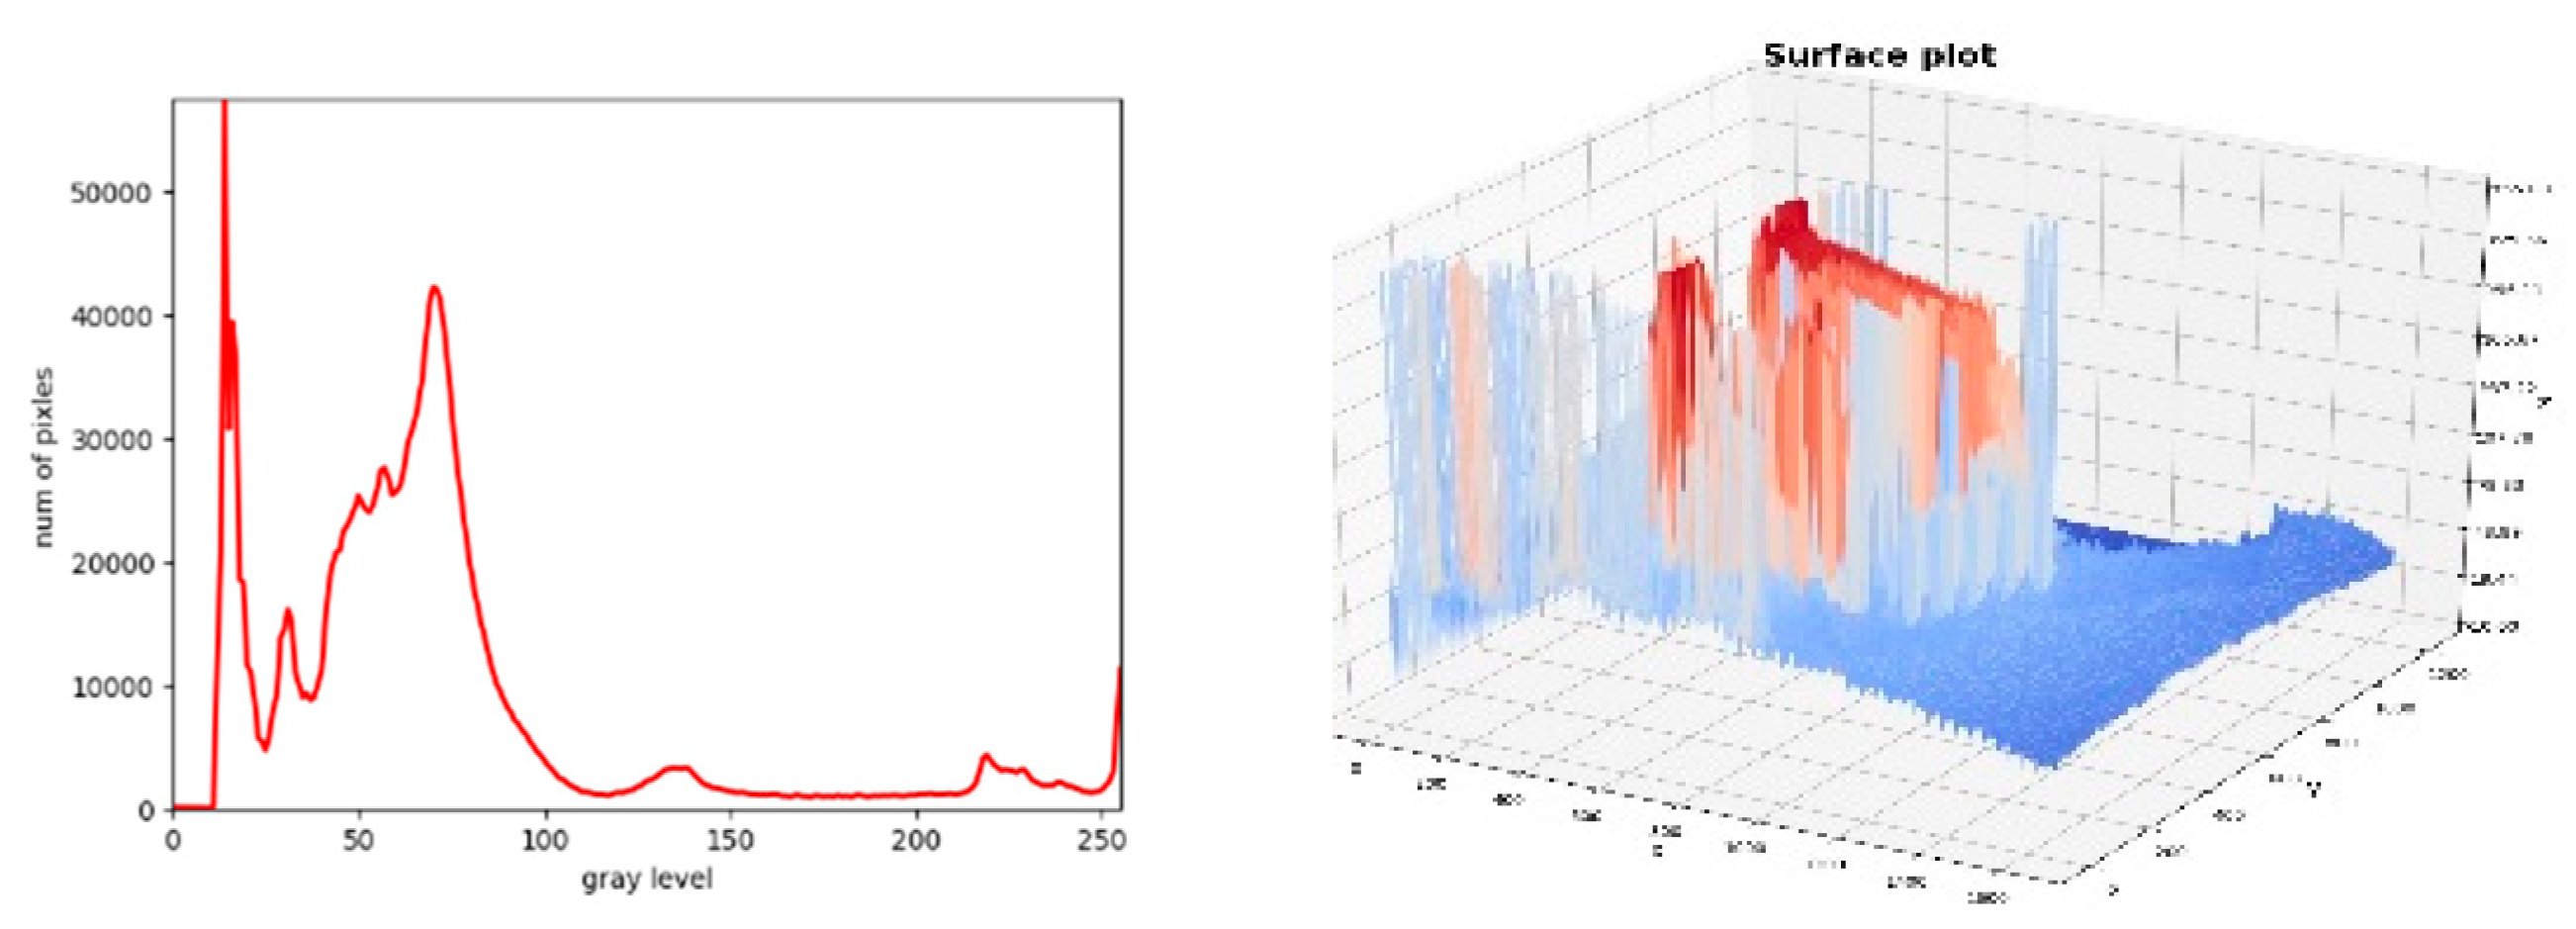
In the histogram and pixel analysis of low-light images before and after processing by day, the overall brightness of the image is adjusted and the contrast between the license plate and the background is enhanced in terms of sensory perception; as shown in
Figure 16 and
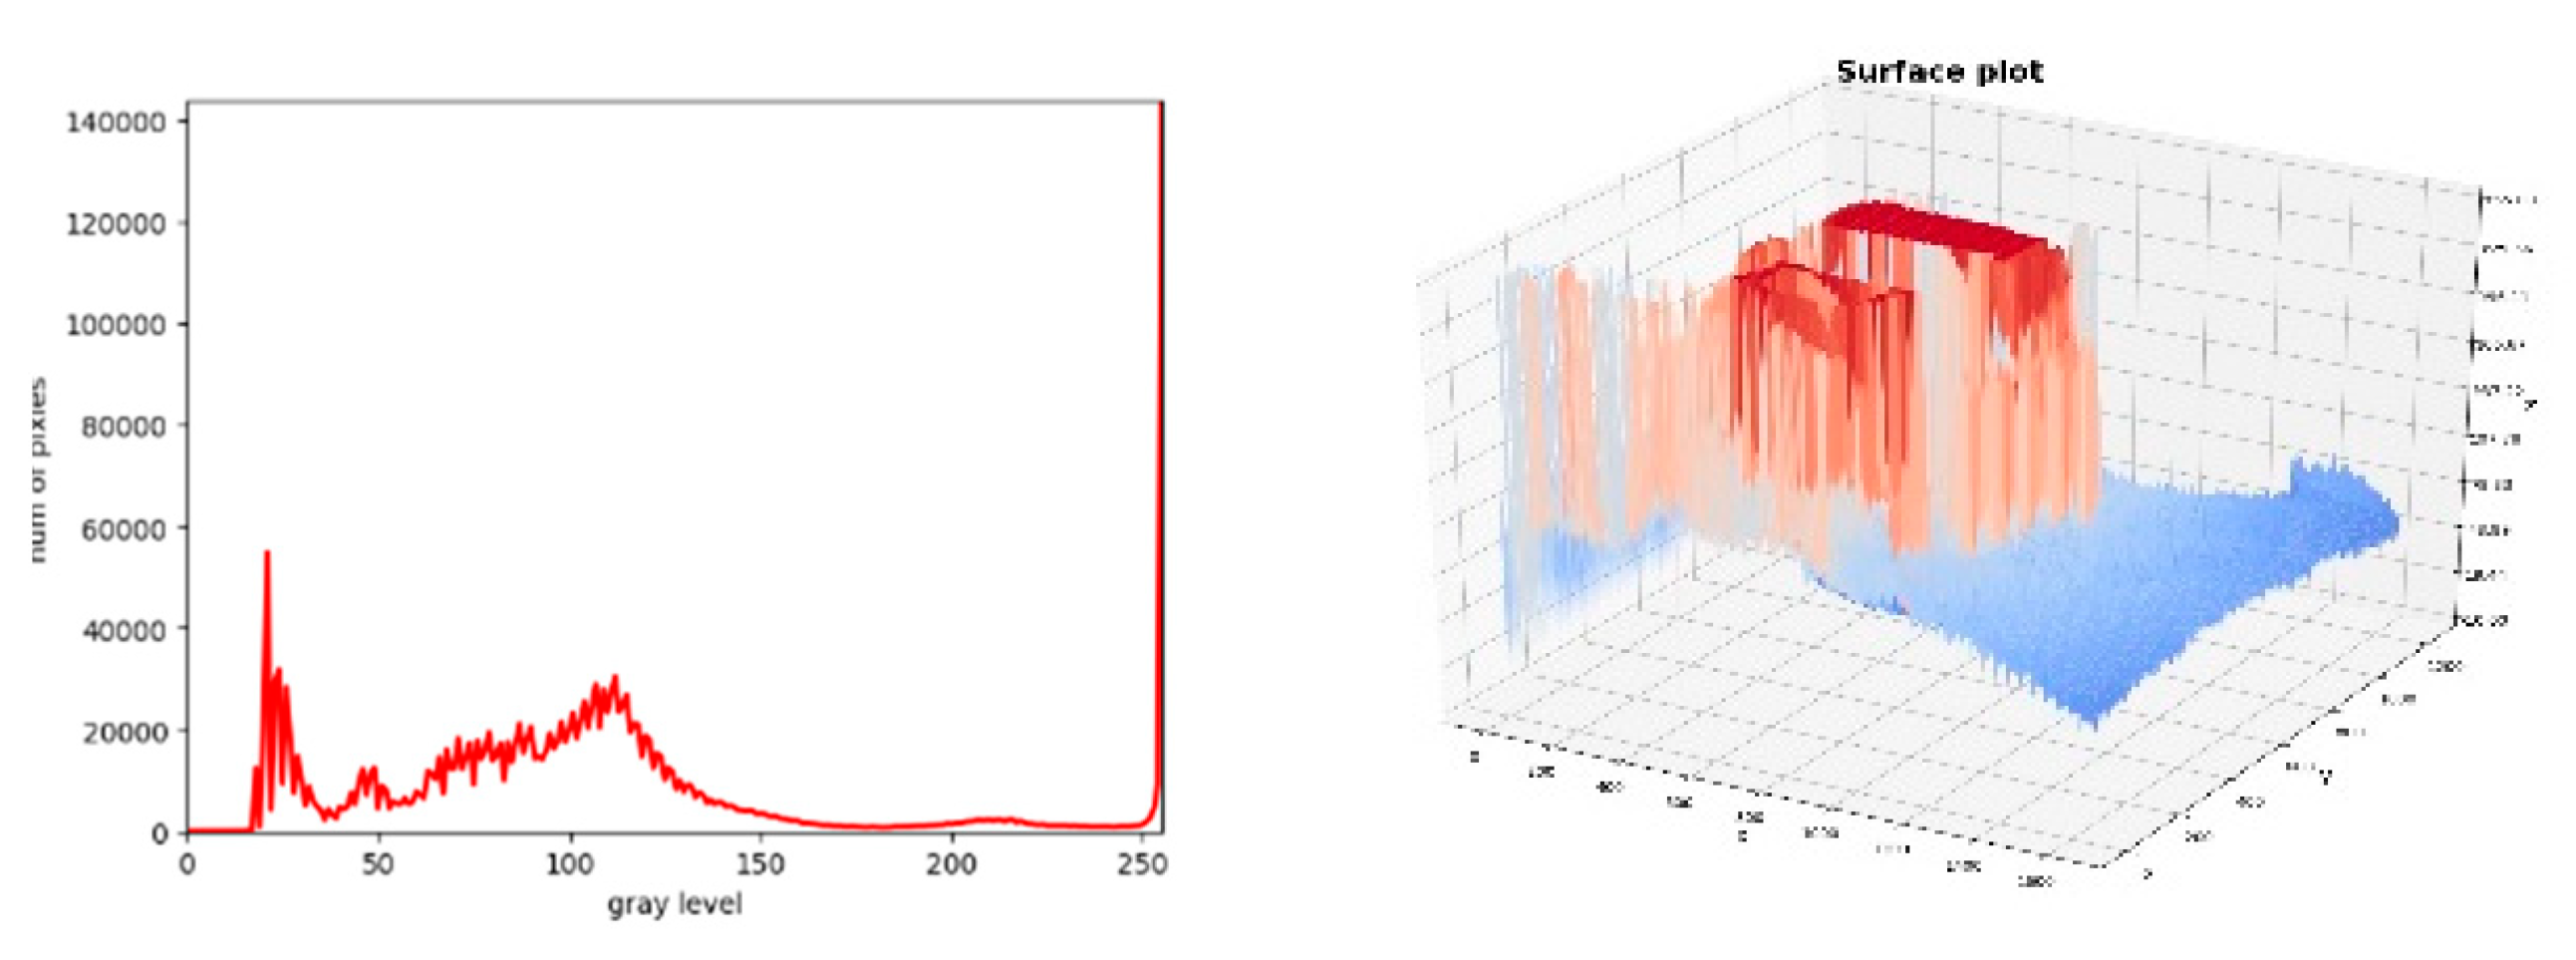
Figure 17, in terms of the histogram, the histogram of pixels after processing is stretched and the peak phenomenon in the histogram is reduced; in terms of 2D pixel distribution, the white pixels brought by white vehicles increase, and the pixel distribution of enhanced images is more even.
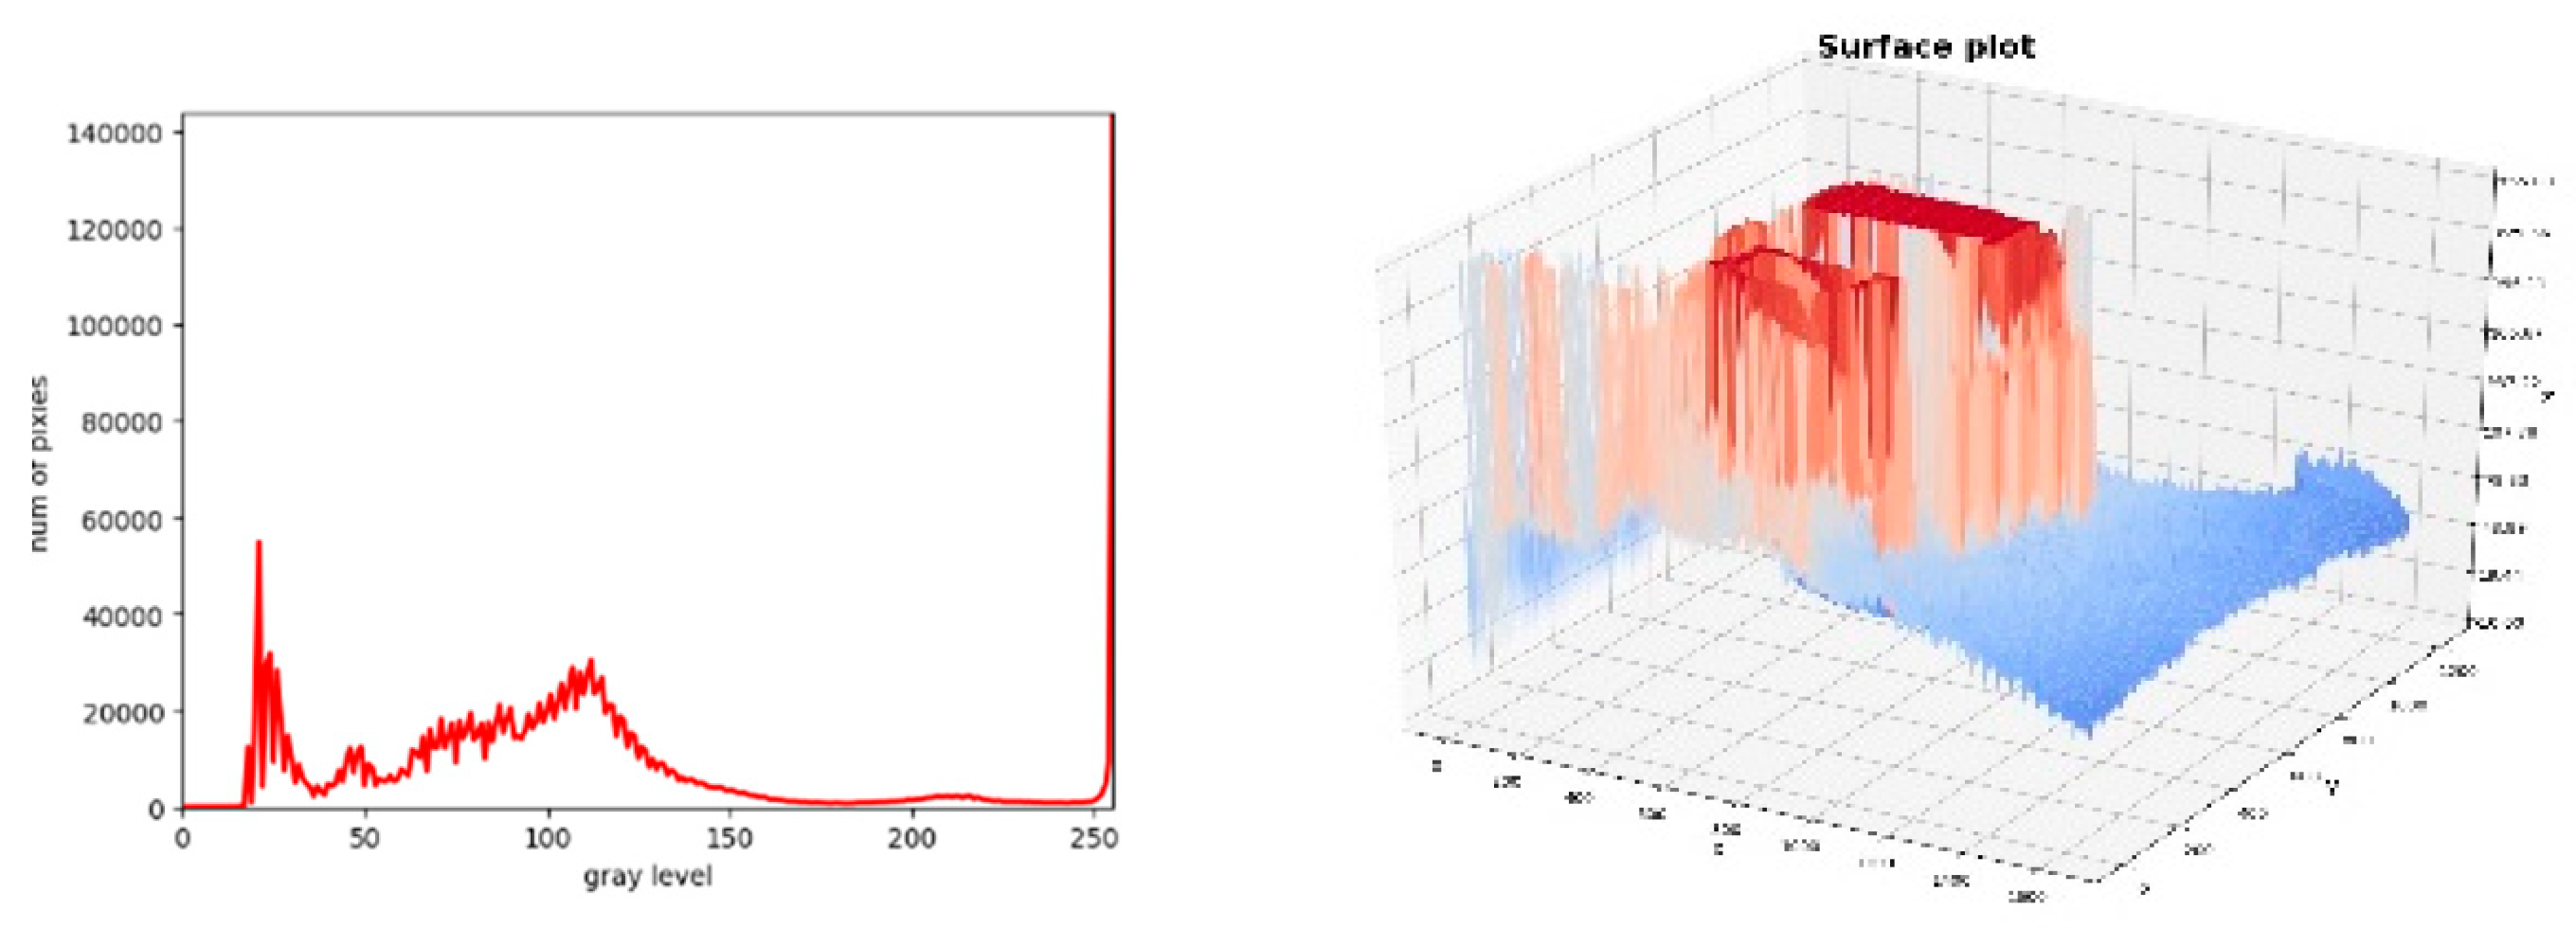
Secondly, for low-light images by night: in terms of sensory perception, vehicles hidden in the dark that cannot be observed by the naked eye are restored, and the overall brightness of the image is improved; as shown in
Figure 18 and
Figure 19, in terms of the histogram, its histogram distribution increases by a certain value; in terms of 2D pixel distribution, bimodal area increases, edge pixel points become sparse, and low pixel values increase.
Finally, in the paper, 200 low-light images by night and 200 low-light images by day are enhanced, and three different objective evaluation indexes are used to measure the loss degree of the images after processing. The structural similarity index and normalized mutual information value of the two kinds of images are both greater than 0.85, and the hamming distance of the fingerprint information calculated by the perceptive hash algorithm is less than 2.5. This shows that the images processed by the two algorithms have less loss and higher similarity than the original images. After the weighted comprehensive evaluation index is finally measured, it is found that both of them are greater than 0.83 and the comprehensive loss is small, as shown in
Table 2.
7. Conclusions
This paper proposes an adaptive image enhancement algorithm under low illumination. Firstly, the collected original images are analyzed. As the brightness and contrast of images at different time periods around the clock are different due to the influence of factors such as weather and light, it is not possible to adopt a unified enhancement algorithm for these images. Instead, processing and enhancement should be carried out separately according to the characteristics of each type of image. Secondly, according to contrast and brightness, all images are divided into low light by day and night. After comparing different image classification algorithms, the depth with higher accuracy and faster speed is finally selected to separate the convolutional neural network and the corresponding model is designed.
After the experiments and subjective evaluation of different enhancement algorithms are carried out, a white balance algorithm based on the dynamic threshold is adopted in the paper. After the processing of this method, both kinds of images have obviously been improved. Among them, the contrast and brightness of low-light images by day are enhanced, and the license plate part is more obvious; the low-light images by night reveal the hidden car body in the background. To make the whole pixel more even, adaptive histogram equalization is applied to the secondary enhancement of low-light images by night in the paper. The loss of multiple objective indicators is relatively small. For some pictures with low image quality and cannot be recognized by naked eyes, such as some pathological low-light images by night, they can also meet the recognition effect of the vehicle face after being processed by the algorithm in the paper. In the symmetry problem of illumination, we conducted a detailed analysis of high light illumination. Furthermore, for the other part: the problem of license plate and car face recognition under high light will be carried out in follow-up research.
In the actual AI(Artificial Intelligence) landing projects, we often use some very advanced deep learning algorithms, but these algorithms are difficult to implement, because there is a very big gap from the laboratory or specific scene to the application in the real scene. To make a model in the laboratory, the experts will first give a lot of restrictions. In real scenarios, these conditions are often absent, leading to complex business and data confusion. This article specifically addresses the complex problem of low light—that is, it analyzes the pictures in the real scene—and then specifically moves the sample space of the data set to the sample space of the training set; the future will be implemented and commercialized. In practical applications that are oriented, this view can undoubtedly greatly improve the accuracy of deep learning-related algorithms and achieve satisfactory results.
Author Contributions
C.S. was responsible for the software, validation, and writing. C.W. was responsible for the methodology. Y.G. was responsible for data collection and parts of the code. All authors have read and agreed to the published version of the manuscript.
Funding
This work was supported by the National Natural Science Foundation of China under Grant nos. U1713216, the National Key Robot Project grant number 2017YFB1300900.
Acknowledgments
The authors would like to thank the anonymous reviewers and editors for their constructive comments and suggestions, which helped to enhance the presentation of this paper.
Conflicts of Interest
The authors declare no conflict of interest. The funders had no role in the design of the study; in the collection, analyses, or interpretation of data; in the writing of the manuscript, or in the decision to publish the results.
References
- La, H.; Lim, R.; Du, J.; Zhang, S.; Yan, G.; Sheng, W. Development of a Small-Scale Research Platform for Intelligent Transportation Systems. IEEE Trans. Intell. Transp. Syst. 2012, 13, 1753–1762. [Google Scholar] [CrossRef]
- Zhao, N.; Yuan, J.B.; Xu, H. Survey on Intelligent Transportation System. Comput. Sci. 2014, 41, 7–11. [Google Scholar]
- Shi, C.H.; Wu, C.D. Vehicle Face Recognition Algorithm Based on Weighted Nonnegative Matrix Factorization with Double Regularization Terms. KSII Trans. Internet Inf. Syst. 2020, 14, 2171–2185. [Google Scholar]
- Shi, C.H.; Wu, C.D. Vehicle Face Recognition Algorithm Based on Weighted and Sparse Nonnegative Matrix Factorization. J. Northeast. Univ. Nat. Sci. 2019, 10, 1376–1380. [Google Scholar]
- Yang, S.; Zhang, J.; Bo, C.; Wang, M.; Chen, L. Fast vehicle logo detection in complex scenes. Opt. Laser Technol. 2019, 110, 196–201. [Google Scholar] [CrossRef]
- Al-Shemarry, M.S.; Li, Y.; Abdulla, S. An Efficient Texture Descriptor for the Detection of License Plates From Vehicle Images in Difficult Conditions. IEEE Trans. Intell. Transp. Syst. 2019, 21, 553–564. [Google Scholar] [CrossRef]
- Yonetsu, S.; Iwamoto, Y.; Chen, Y.W. Two-Stage YOLOv2 for Accurate License-Plate Detection in Complex Scenes. In Proceedings of the 2019 IEEE International Conference on Consumer Electronics (ICCE), Las Vegas, NV, USA, 11–13 January 2019. [Google Scholar] [CrossRef]
- Salau, A.O.; Yesufu, T.K.; Ogundare, B. Vehicle plate number localization using a modified GrabCut algorithm. J. King Saud Univ. Comput. Inf. Sci. 2019, 1–99. [Google Scholar] [CrossRef]
- Soon, F.C.; Khaw, H.Y.; Chuah, J.H.; Kanesan, J. Vehicle logo recognition using whitening transformation and deep learning. Signal Image Video Process. 2019, 13, 111–119. [Google Scholar] [CrossRef]
- Meyer, H.K.; Roberts, E.M.; Rapp, H.T.; Davies, A.J. Spatial Patterns of Arctic Sponge Ground Fauna and Demersal Fish are Detectable in Autonomous Underwater Vehicle (AUV) Imagery. Deep Sea Res. Part I Oceanogr. Res. Pap. 2019, 153, 103137. [Google Scholar] [CrossRef]
- Kim, J.B. Efficient Vehicle Detection and Distance Estimation Based on Aggregated Channel Features and Inverse Perspective Mapping from a Single Camera. Symmetry 2019, 11, 1205. [Google Scholar] [CrossRef]
- Xiaochu, W.; Guijin, T.; Xiaohua, L.; Ziguan, C.; Suhuai, L. Low-light Color Image Enhancement Based on NSST. J. China Univ. Posts Telecommun. 2019, 5, 6. [Google Scholar]
- Selmi, Z.; Halima, M.B.; Pal, U.; Alimi, A.M. DELP-DAR System for License Plate Detection and Recognition. Pattern Recognit. Lett. 2020, 129, 213–223. [Google Scholar] [CrossRef]
- Zhou, F.Y.; Jin, L.P.; Dong, J. Review of Convolutional Neural Network. Chin. J. Comput. 2017, 40, 1229–1251. [Google Scholar]
- Howard, A.G.; Zhu, M.; Chen, B.; Kalenichenko, D.; Wang, W.; Weyand, T.; Andreetto, M.; Adam, H. MobileNets: Efficient Convolutional Neural Networks for Mobile Vision Applications. arXiv 2017, arXiv:1704.04861. [Google Scholar]
- Wang, X.F.; Ma, Z. Research on Freight Train Number Identification Based on Convolutional Neural Network Lenet-5. Mod. Electron. Technol. 2016, 39, 63–66. [Google Scholar]
- Kim, J.-Y.; Kim, L.-S.; Hwang, S.-H. An Advanced Contrast Enhancement Using Partially Overlapped Sub-Block Histogram Equalization. IEEE Trans. Circuits Syst. Video Technol. 2001, 11, 475–484. [Google Scholar]
- Yoon, Y.H.; Marmor, M.F. Rapid Enhancement of Retinal Adhesion by Laser Photocoagulation. Ophthalmology 1988, 95, 1385–1388. [Google Scholar] [CrossRef]
- Fayad, L.M.; Jin, Y.; Laine, A.F.; Berkmen, Y.M.; Pearson, G.D.; Freedman, B.; Van Heertum, R. Chest CT Window Settings with Multiscale Adaptive Histogram Equalization: Pilot Study. Radiology 2002, 223, 845–852. [Google Scholar] [CrossRef]
- Yamashina, H.; Fukushima, K.; Kano, H. White balance in inspection systems with a neural network. Comput. Integr. Manuf. Syst. 1996, 9, 3–8. [Google Scholar] [CrossRef]
- Li, J.; Wang, X.X.; Liu, H. Auto White Balance Algorithm in Digital Camera. Appl. Mech. Mater. 2012, 182, 2080–2084. [Google Scholar] [CrossRef]
- Thejas, G.S.; Joshi, S.R.; Iyengar, S.S.; Sunitha, N.R.; Badrinath, P. Mini-Batch Normalized Mutual Information: A Hybrid Feature Selection Method. IEEE Access 2019, 7, 116875–116885. [Google Scholar] [CrossRef]
- Estévez, P.A.; Tesmer, M.; Perez, C.A.; Zurada, J.M. Normalized Mutual Information Feature Selection. IEEE Trans. Neural Netw. 2009, 20, 189–201. [Google Scholar] [CrossRef] [PubMed]
Figure 1.
Low-light image. (a) Low-light by day; (b) low-light by night.
Figure 1.
Low-light image. (a) Low-light by day; (b) low-light by night.
Figure 2.
Schematic diagram of convolutional neural network.
Figure 2.
Schematic diagram of convolutional neural network.
Figure 3.
Traditional convolution and deeply separable convolution.
Figure 3.
Traditional convolution and deeply separable convolution.
Figure 4.
General block diagram of image enhancement algorithm under low light condition.
Figure 4.
General block diagram of image enhancement algorithm under low light condition.
Figure 5.
Low-light image by night and gradation histogram of low-light image by night. (a) Low-light image by night; (b) gradation histogram of low-light image by night.
Figure 5.
Low-light image by night and gradation histogram of low-light image by night. (a) Low-light image by night; (b) gradation histogram of low-light image by night.
Figure 6.
Global and adaptive histogram equalization processing renderings. (a) Global histogram equalization; (b) adaptive histogram equalization.
Figure 6.
Global and adaptive histogram equalization processing renderings. (a) Global histogram equalization; (b) adaptive histogram equalization.
Figure 7.
Enhancement algorithm based on retina processing renderings processing renderings. (a) original image; (b) multiscale retinal enhancement algorithm; (c) color gain weighting; and (d) color restores multiple scales.
Figure 7.
Enhancement algorithm based on retina processing renderings processing renderings. (a) original image; (b) multiscale retinal enhancement algorithm; (c) color gain weighting; and (d) color restores multiple scales.
Figure 8.
Image enhancement algorithm based on white balance processing rendering. (a) Original image; (b) averaging method; (c) perfect reflection method; (d) gradation world hypothesis method; (e) color correction method of color cast detection; and (f) dynamic threshold method.
Figure 8.
Image enhancement algorithm based on white balance processing rendering. (a) Original image; (b) averaging method; (c) perfect reflection method; (d) gradation world hypothesis method; (e) color correction method of color cast detection; and (f) dynamic threshold method.
Figure 9.
Secondary enhancement by adaptive histogram equalization.
Figure 9.
Secondary enhancement by adaptive histogram equalization.
Figure 10.
Secondary enhancement by gamma transformation.
Figure 10.
Secondary enhancement by gamma transformation.
Figure 11.
Low-light image by day and gradation histogram. (a) Low-light image by day; (b) gradation histogram.
Figure 11.
Low-light image by day and gradation histogram. (a) Low-light image by day; (b) gradation histogram.
Figure 12.
Different enhancement algorithms in low light by day processing rendering. (a) Original image; (b) global histogram equalization; (c) adaptive histogram equalization; (d) gamma transformation; (e) averaging method; (f) perfect reflection method; (g) gradation world hypothesis method; (h) color cast detection method; (i) dynamic threshold method; and (j) retinal enhancement algorithm.
Figure 13.
The flow chart of dynamic threshold method of white balance.
Figure 13.
The flow chart of dynamic threshold method of white balance.
Figure 14.
Low-light treatment results by night: (a) original image; (b) first enhancement; (c) second enhancement.
Figure 14.
Low-light treatment results by night: (a) original image; (b) first enhancement; (c) second enhancement.
Figure 15.
Low-light treatment results by day.
Figure 15.
Low-light treatment results by day.
Figure 16.
Gradation images and 2D pixel distribution diagram before low-light processing by day.
Figure 16.
Gradation images and 2D pixel distribution diagram before low-light processing by day.
Figure 17.
Gradation images and 2D pixel distribution diagram after low-light processing by day.
Figure 17.
Gradation images and 2D pixel distribution diagram after low-light processing by day.
Figure 18.
Gradation images and 2D pixel distribution diagram before low-light processing by night.
Figure 18.
Gradation images and 2D pixel distribution diagram before low-light processing by night.
Figure 19.
Gradation images and 2D pixel distribution diagram after low-light processing by night.
Figure 19.
Gradation images and 2D pixel distribution diagram after low-light processing by night.
Table 1.
Results of different classifiers.
Table 1.
Results of different classifiers.
| Classifier | Lenet5 | Deep Separable Convolution | SVM | Random Forest | Logic Regression |
|---|
| Train accuracy | 99.30% | 98.90% | 90.60% | 94.50% | 93.70% |
| Test accuracy | 98.20% | 97.70% | 89.30% | 91.90% | 91.20% |
Table 2.
Low light image processing measurement indexes.
Table 2.
Low light image processing measurement indexes.
| Class | SSIM | NMI | PHG | Weighted Comprehensive |
|---|
| Low light by night | 0.872 | 0.857 | 1.27 | 0.838 |
| Low light by night | 0.853 | 0.882 | 1.18 | 0.861 |
© 2020 by the authors. Licensee MDPI, Basel, Switzerland. This article is an open access article distributed under the terms and conditions of the Creative Commons Attribution (CC BY) license (http://creativecommons.org/licenses/by/4.0/).
