1. Introduction
Rainfall is a meteorological parameter that presents high spatio-temporal variability [
1]. Rainfall can be measured through standard rain gauges, disdrometers, weather radars, meteorological satellites, and microwave signal attenuation. Rain gauges are the typical instrument for measuring rainfall and they present accurate in-situ measurements. Disdrometers also conduct in-situ measurements with further information regarding drops such as rainfall velocity, number of droplets, kinetic energy. Remote techniques include weather radars and meteorological satellites, with the main disadvantage being the inaccuracy of estimating rain amount at a ground level [
2].
It is well known that the more rainfall data we have from several measurement sources, the better the spatio-temporal rainfall measurement is. In remote sensing techniques is also included microwave rain attenuation with roots in the 1940s. Specifically, the first pioneering experimental studies of the signal attenuation by rain was carried from 1942 to 1962 [
3]. In their cutting edge work of 1947, Anderson et al. determined experimentally the attenuation of a 24 GHz microwave link over a distance of 2 km [
4]. In order to correlate uniform rainfall over the link with signal attenuation, nine rain gauges were used over the link path, and the received power was measured every 30 s. The measurements took place in Hilo, Hawaii and the transmitter-receiver equipment was based on 24-inch parabolic antennas with 50 mW of maximum transmitted power. Six uniform rainfall events from 5 to 41 mm/h where selected and analyzed. At that time, radar technology was used to estimate the attenuation of the transmitted signal during rain in contrast to the dry season [
5]. The distance between radar and reflector was 6.9 km, and along with the line of sight (LOS) path, eight typical rain gauges were used to give the rain rate. The radar wavelength was 6.8 mm (~34.8 GHz). The theoretical linear relationship between attenuation and rain rate has not been confirmed experimentally for 0.86 cm radar (34.8 GHz) for rain intensities lower than 2 mm/h. The calculated attenuations are not with good agreement for low rain intensities (<0.3 mm/h). Additionally, at higher wavelengths of about 3 cm, 5 cm, and 10 cm, the calculated attenuation is lower than the measured one compared with that of 0.86 cm, especially for low rain intensities.
Prediction of rain rate via radars is possible via two methods, by attenuation or by reflectivity, with the first being more suitable for wavelengths less than 3.21 cm and the latter for wavelengths higher than 3.21 cm (9.3 GHz) [
6]. Atlas and Ulbrich in 1977 [
7] showed that one-way methods between the transmitter and receiver are better than radar methods for measuring path average rainfall. In all the papers of Anderson et al. and the rest of the works until then, there was a significant difference in the experimental results concerning the theory. The measured attenuation of the signal due to rainfall was much more significant than the attenuation resulting from the theory [
2].
Generally, the rain attenuation is a complex function depending primarily on the signal wavelength and the drop size distribution. The latest statement has been also confirmed by measurements taken in three regions of India using a variety of techniques [
8]. It has been shown that signal attenuation due to rain exhibits significant variations and deviations from the theoretical models. Drop size distribution (DSD) plays an essential role in calculating signal attenuation due to rainfall. Considerable efforts have been made at the beginning of the millennium to measure rainfall through microwave links with high operating frequencies. A research team from Japan used a microwave link of 50 GHz to measure the average rain path [
9]. The measurements took place in 2003, and additional sensors were used for temperature corrections, water vapor, and wet antenna. The path was 820 m long, and the power data was recorded by sampling 50 Hz averaged one second. For data validation, a disdrometer (DSDm) Rd 69 was used next to the receiver as well as a tipping-gauge at a distance of 2 km north of the path. Data from tropical rainfall measuring mission (TRMM) satellite radar was also used, although these were not sufficient. Rincon and Lang used signal attenuation measurements at 25 and 38 GHz, and measured rainfall rate and DSD [
10]. The transceiver system was placed 20 m above the ground, and the used antennas were of horn type. The antennas were covered with a dielectric material to keep water out of the antennas. Along the 2.3 km link, there were six tipping buckets four optical rain gauge and DSDm. On the receiver side, there was a data system based on a PC with a built-in hard disk (HD) and a digital signal processor (DSP) on board. The power data were recorded continuously in real-time. The tipping buckets network validated the measurements with an accuracy of 0.254 mm. The data from the rain gauges were sampled every 3 s and stored together with the microwave data using the RS-485 bus.
Most of the work in the last fifteen years has focused on measurements from cellular backhaul networks due to the already existing but rapidly developing structures at frequencies between 10 to 38 GHz. The idea of measuring rainfall through commercial microwave links dates back to 2005 and to the work of Upton, where the basic requirements were determined so that the process of estimating rainfall through the attenuation of the signal to be accurate [
11]. Due to their work, measurements were presented from a dual-frequency link, in the Bolton area of England, with working frequencies of 13.9 and 22.9 GHz and path link 14 km. The future possibility was formulated towards using the links for online calibrations of radar as well as for real-time flood warning. Messer et al. in their groundbreaking work introduced the idea of using cellular links for environmental monitoring [
12]. Preliminary measurements took place in Tel Aviv and Haifa in Israel on 19 and 20 January 2005. The time resolution for microwave data was 15 min. Validation of the measurements was accomplished with weather radar and through rain gauges with integration times of 30 min in Tel Aviv and 10 min in Haifa. The measurements showed a possible contribution to the already existing techniques to have more accurate results. One of the first essential research works presenting rainfall measurement through cellular communication networks was published in 2007 by Leijnse et al. [
13]. Data were collected over two months from October to November 2003 in the Netherlands and from two cellular microwave links. Rainfall intensities estimated from microwave links were compared to the rainfall intensities acquired with the use of a rain gauge and two C band weather radars. The two communication links with path lengths 7.75 km and 6.72 km were nearly parallel. The operating frequency was 38.5 GHz, while the receiver was common to both links. The power resolution was of 1 dB, while the received power was measured once or twice every fifteen minutes at random intervals. Due to rainfall, signal attenuation was measured for a frequency of 27 GHz over a path-link of 4890 m [
14]. The experiment took place in the summer of 1999 from 28 May to 23 July in the central Netherlands. The experimental setup antennas had a diameter of 0.6 m and were mounted at 46 m and 19 m, respectively, above the ground. The received signal was sampled with a rate of approximately 18 Hz. Along the link, seven rain gauges with 0.2 mm resolution were used to estimate the path-average fall intensity. The results have shown that it is essential to limit as much as possible the errors on the transmitter and receiver. The possibility is that the protected antenna could eliminate wet-antenna effects. Furthermore, wet antenna correction functions to the link data show that the instrument was well-suited for the measurement of path-averaged rainfall. In work [
15], three well-known prediction models for the specific rain attenuation were used in order to calculate the attenuation of microwave links at different frequencies and path lengths. The models are namely the ITU-R, the Crane Global and Moupfouma model. Generally, the ITU-R model gives the lowest prediction values at all frequencies between 10 and 40 GHz, whereas the Moupfouma gives the highest at 10 GHz and the Crane model gives high values for the greatest frequency of 40 GHz. From measurements at 19.5 GHz it is shown that all three models fall inside measurement bounds for rain rates of up to 50 mm/h, while above 50 mm/h, only the ITU-R stays within the bounds. The presented work [
16] takes into account 22 microwave links at a frequency of about 20 GHz along with rain gauges covering an area of about 15 × 15 km
2. In the proposed method, the microwave links are divided into several equal intervals, forming a regular grid, assuming constant rain rate inside each of the grid cells. A novel iterative algorithm is applied in order to estimate the rain rate at any given point inside the area of interest, therefore generating a two-dimensional precipitation map. The algorithm may be applied in a network with arbitrary geometry and with different frequencies. The frequency range of the used links was 17–24 GHz. Concerning the attenuation model, the ITU-R power law is utilized. Results showed good similarity compared to rain gauges. Subsequently, the study named “Frontal Rainfall Observation by a Commercial Microwave Communication Network” introduces a technique of reconstructing the rainfall spatial-temporal conditions with the use of RSLs into wireless networks and extended Kalman filtering (EKF) [
17]. Specifically, the technique above was applied on a cellular system (network with star topology), which was constituted of 23 microwave links. Moreover, all the transmitter-receiver links (from 0.8 to 18 km) were vertically polarized with working frequency bands of 18, 22, and 23 GHz. Nevertheless, as gaps between links existed, a stochastic model (based on advection) was implemented in order to gather the data along the direction of rainfall motion; thus the theory of operation assumed that during short periods, the predominant rain cell’s force was advection. The temporal resolution was set at 1 min. In regard to the need for comparison, instantaneous rainfall estimations were tested in contrast to measurements originated from five rain gauges (RG). Additionally, this technique could be applied to thunderstorms nowcasting as, in this case, high accuracy is needed during measuring precipitation and rainstorm conditions [
18].
The estimation of rain rate through measurements of the signal attenuation which is caused by rainfall using microwave links is a research field of high interest which keeps growing during recent years. The remote techniques used so far (weather radars, meteorological satellites) do not provide accurate measurements for ground level rain rate. Besides, rain gauges can provide accurate in-situ measurements, and their high accuracy is limited in spatial points that are close to them due to the high spatio-temporal variation of rainfall. As a result, the idea of determining the rain rate through microwave attenuation gained much interest. Numerous papers which are focused in this direction have been published, presenting many different approaches and results. Some of the authors used backhaul cellular microwave links for their measurements, while others used customized experimental setups. This paper presents information gathered from works published during recent years. The literature is organized based on the technique used for conducting the measurements (backhaul cellular microwave links or customized experimental setups). The key points and results of each published work are outlined. The current paper can be beneficial, especially for new researchers in the field of rain rate determination via remote sensing. By reading this article, the reader can fully understand the recent progress made towards this direction, the main challenges stumbled upon, how they were partially overcome, and which challenges remain to be addressed. Having to investigate each published paper separately can be tedious because of its massive amount of data. Getting a general idea of the work done in this field can also be time-consuming for the same reason. The current survey makes possible for readers to find papers easier related to their interests. In other words, publications that match someone’s interests can be easily found through this paper so that they can be accessed for in-depth reading. Researchers can easily find similar approaches for their related ongoing works (measuring techniques used, path length, frequency, location, etc.). At the same time, they are able to determine which approach, or combination of approaches, best suits their needs, without having to go through the literature extensively.
Given the fact that this paper mentions and analyzes a considerable amount of information from recent literature relevant to earth-to-earth microwave rain attenuation, and thus with the need to avoid being chaotic, the organization of the paper is given below along with the explanation of its general structure. Consequently, this survey is organized with the following structure: In
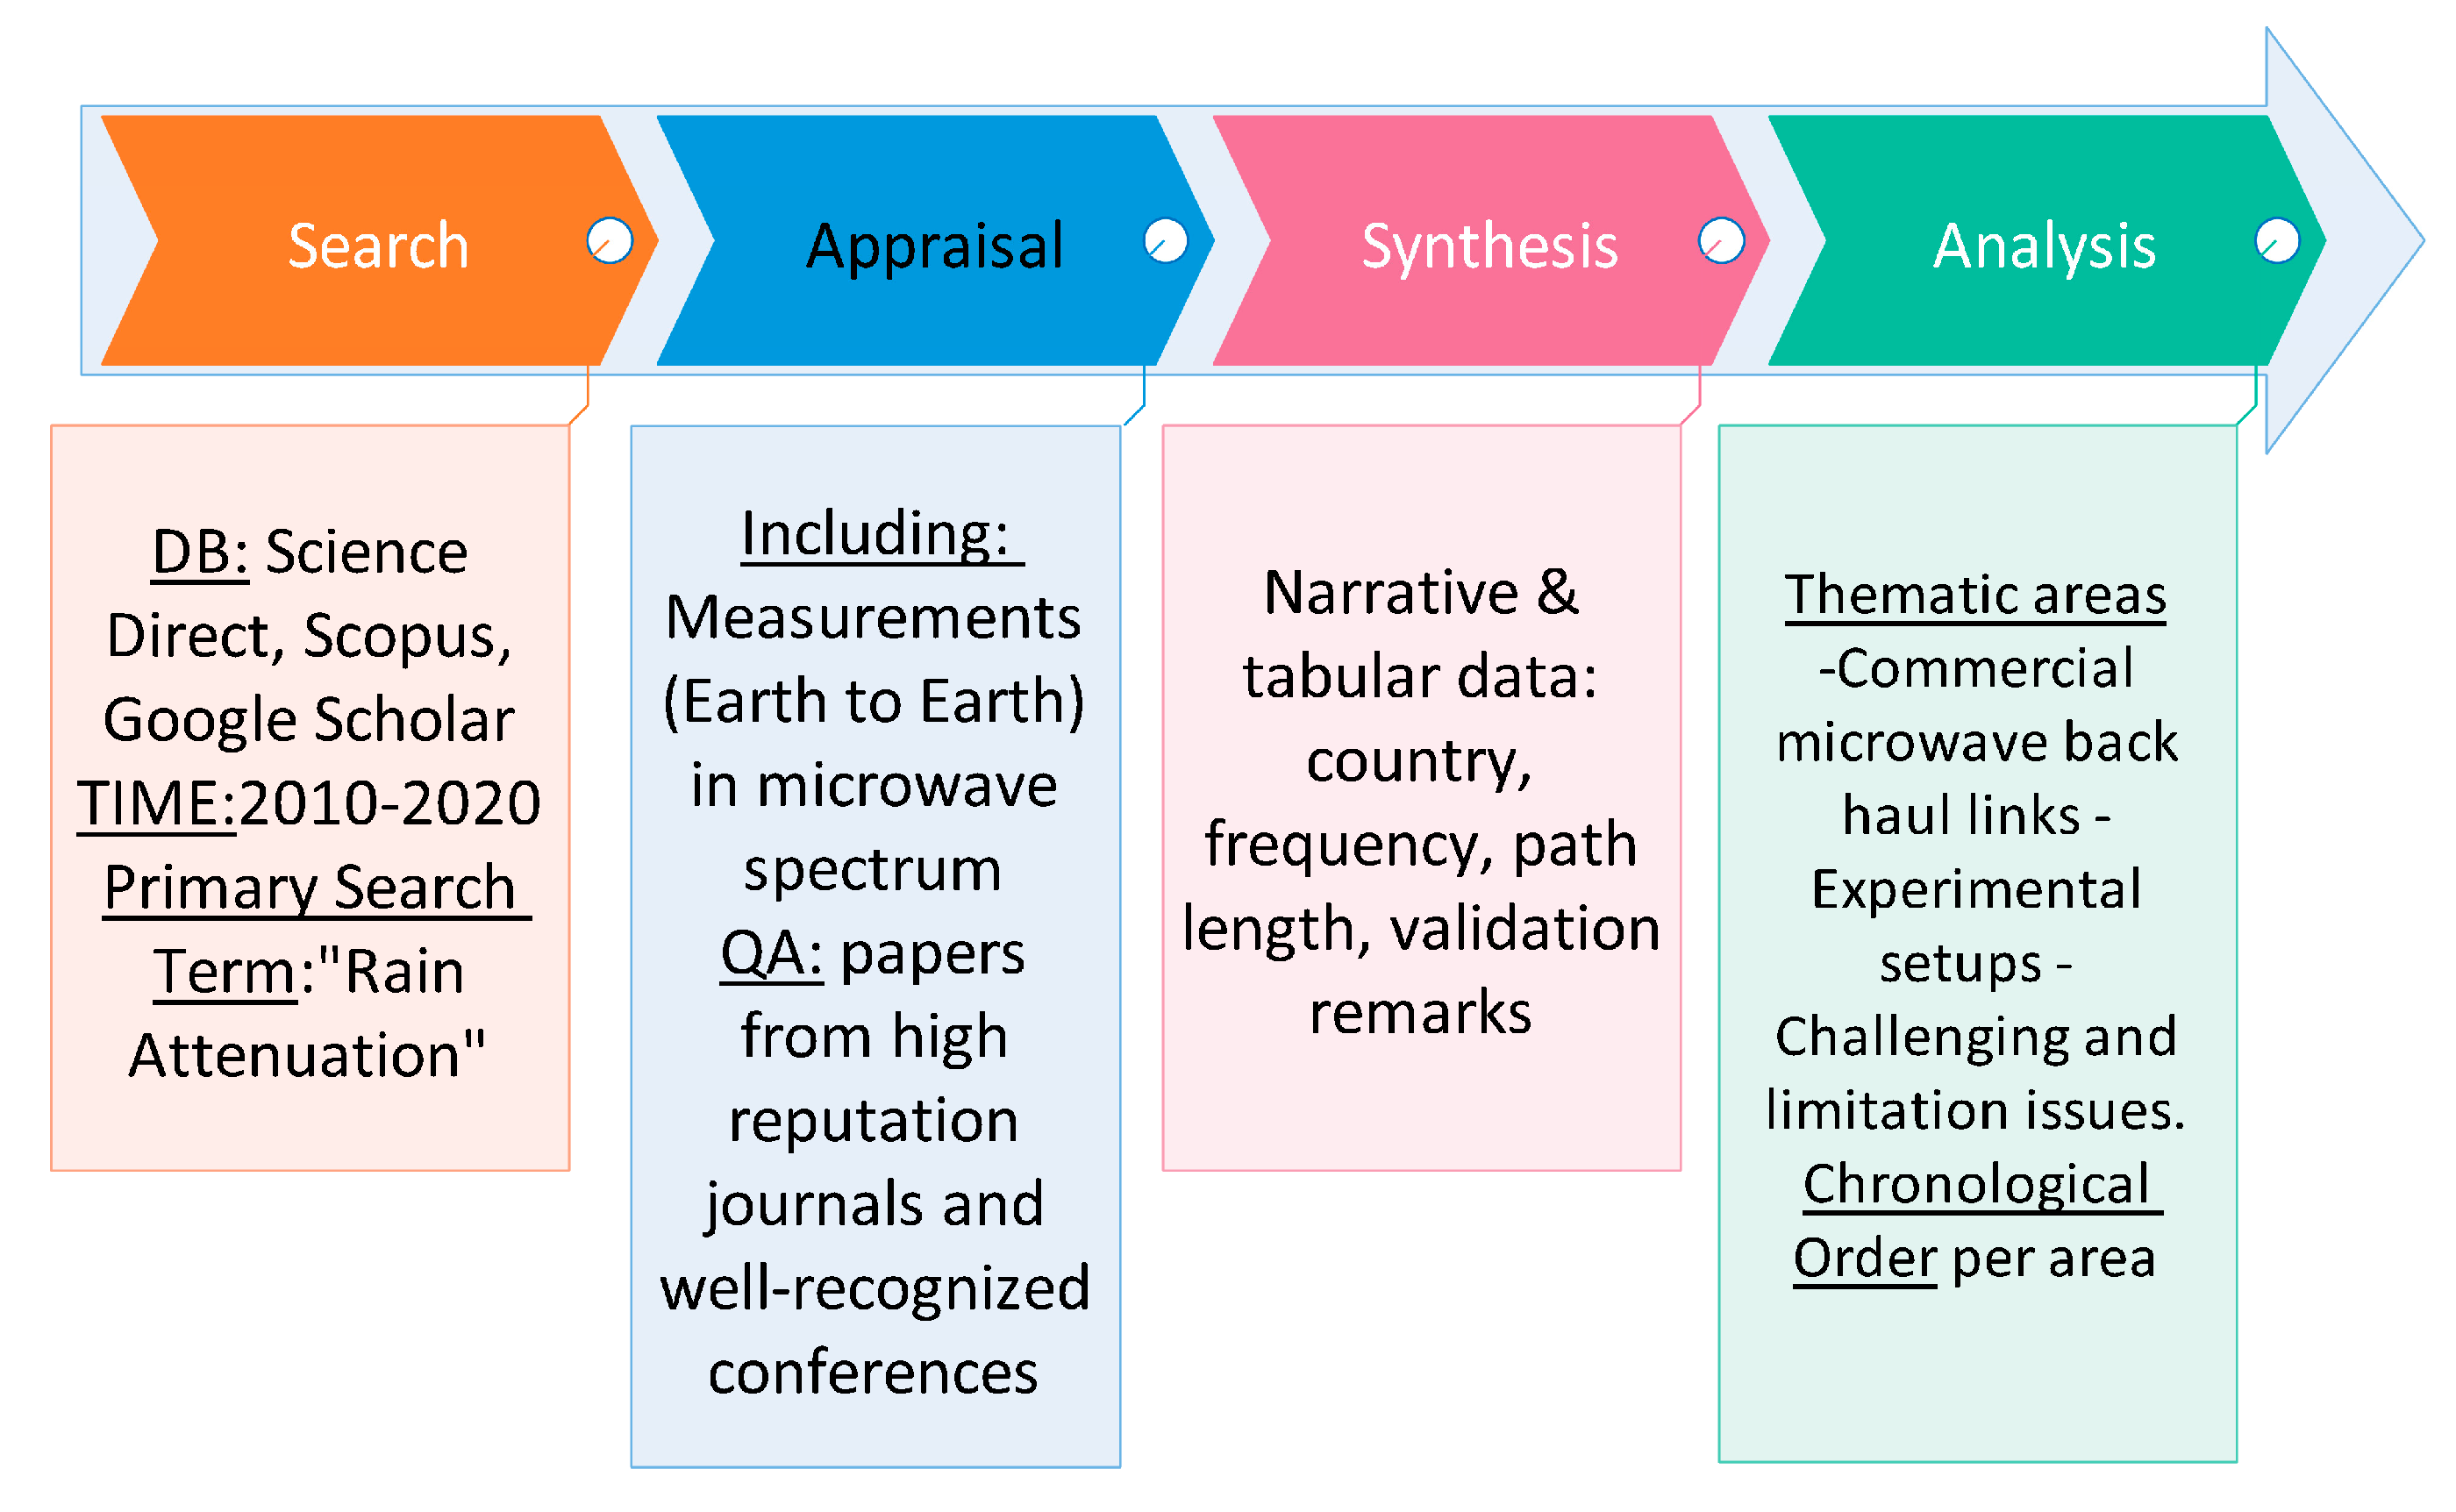
Section 2, the methodology and literature search is described. Then, in
Section 3, the theoretical and experimental framework of the signal attenuation due to rainfall is presented.
Section 4 classifies rainfall measurement works related to backhaul cellular infrastructure.
Section 5 classifies customized experimental setups. Research challenges are described in
Section 6. Finally, conclusions are reported in
Section 7.
The aforementioned paper structure is reported in this way in order to form a flow path which can lead to better reading the significant conclusions. Specifically,
Section 2 gives the methodology while it informs the reader of the kind of structure that this paper exhibits based on scientific facts while
Section 3 analyzes the theory in order the reader to obtain the most basic knowledges for properly interpreting the provided experimental framework. Then, in
Section 3, as the readers can now understand basic results on this area of expertise, a classification is imminent in order to lead them properly through the reading process, while
Section 6 comes to complete the classification by adding the experimental part. Then, by having acquired the basic knowledges from the classification, research challenges must be mentioned in order to show the current restrictions in the current development and what someone should expect and work towards in the near future. Then, the final section follows, which includes discussion and conclusions for finalizing this literature review. Especially this final section of the paper exhibits generic recommendations because in the condition that further details would had been given in conclusion, then these would had been taken from all the related works which exhibited a diversity in their findings and that condition would had been non-functional for the reading process. Consequently, if the readers want to have a quick glance at the last decade of the the thematic area of this paper, they should quickly read the remaining paper or at least
Section 6 which provides limitation issues apart from useful research challenges.
4. Rainfall Measurements Through Backhaul Cellular Infrastructure
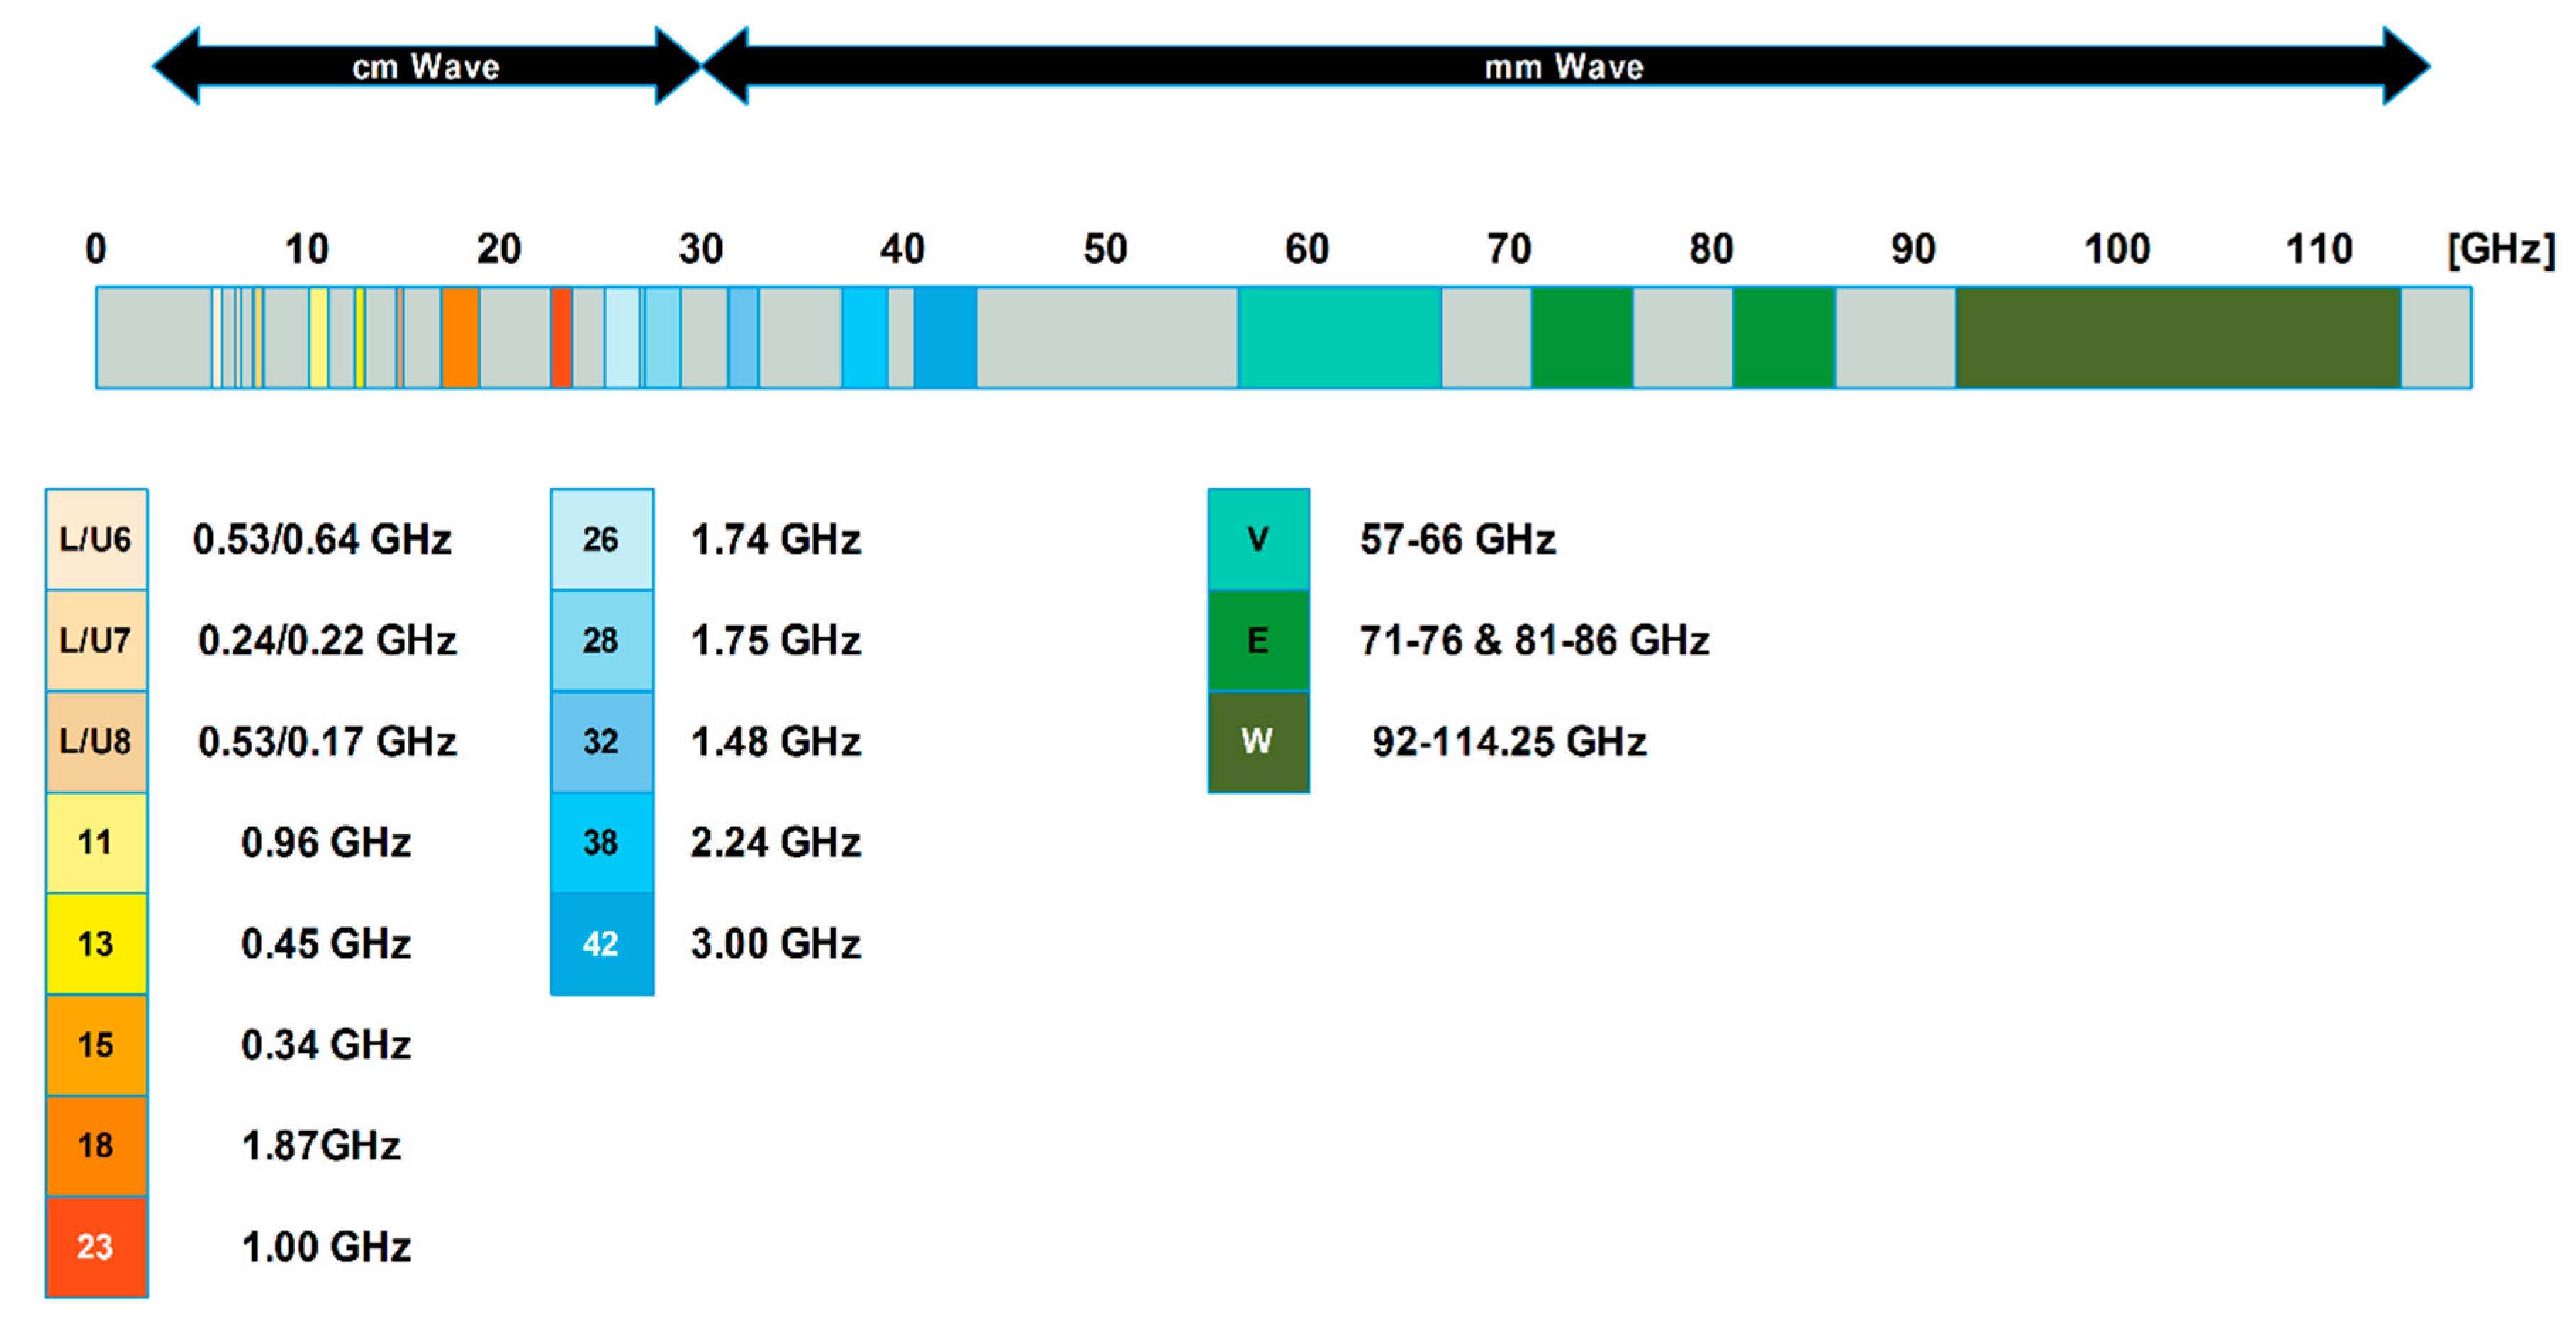
The primary advantages of rainfall monitoring with the use of microwave links from cellular backhaul networks are the existing infrastructure as well as the abundance of such links around the world. At the same time, they cover a wide range of frequencies. The majority of microwave backhaul links operate in the 6–23 GHz and 32, 38 GHz frequency bands. There are new structures that operate at Ε-band 70/80 GHz, while in the future, the W and D bands will be used for lengths of no more than 1 km [
32]. The distances of the links generally range between a few km and a few tens of km for smaller continuities.
Figure 5 presents the microwave backhaul spectrum from cm-Wave to mm-Wave and information concerning bandwidth on each frequency band.
The main disadvantage is that the microwave links are made to transfer information and not to measure rainfall, so the accuracy of the measurements is limited. It also limits the sampling time of the receiving signal, which can be varied once more and every 24 h. Additionally, the difficulty of accessing such data managed by companies is another disadvantage. The non-uniformity of rainfall, especially in long links and the impossibility of correlation with the rainfall measurements from a conventional rain gauge, adds to significant limitations that need to be addressed.
In this section, signal attenuation measurements are presented due to rainfall from backhaul microwave links. Information is presented concerning the transmission and reception parameters, the sampling of signal measurements, the geographical, the active path, and the methodology followed for the correlation of rainfall with the signal attenuation.
The studies and development of proper procedures for exploiting signal attenuation, by using microwave links (cellular or not), are striving to find a proper place in the measurement procedure relevant to the rainfall calculation and prognosis. Below are reported essential works relevant to this matter of research and development (R and D) such as the one that follows and that is relevant to the review study on opportunistic remote sensing of rainfall [
26] whereas it is described with a non-expert view style (as the authors declare) the history behind rainfall monitoring using microwave links MLs and its principles. This technique is very important as it could empower the measurement procedure in cooperation with other already known devices such as rain gauges, disdrometers, weather radars, and remote sensors in general. Typical working frequencies of cellular devices could be between 1 to 2 GHz (L-band). On the contrary, MLs of a K-band utilize frequencies of higher values (GHz bands) with wavelengths proportional to 1 cm. These kinds of signals are prone to attenuation due to atmospheric conditions such as rainfall. Additional attenuation could occur by absorption and the microwaves’ scattering by raindrops. Less attenuation may occur in the presence of hail or snow in the condition that hail stones or snowflakes are not melting [
33]. Additionally, water vapor and oxygen exhibit absorption frequency bands, at 22.2 and 60 GHz respectively, in the microwave range of cellular links. The previous fact could be misinterpreted of being attenuation due to rainfall. Albeit the fact that the meteorological area of expertise had the knowledge from the past years that the calculation of the microwave attenuation could contribute to rainfall estimation [
34], the great awareness on this matter was accomplished by Equation (13) because it interpreted the fact of millions of commercial MLs to be considered as path-average rain gauges [
13]. As far as the typical values of variables for measurement purposes are the 15 min of rate between storing the signal values along with power resolution between 0.1 to 1 dB. Specifically, the value of 0.1 dB is the proper one for cellular links.
where α = (1/c)
1/d and
b = 1/d. The variables
c and
d depend on frequency. Additionally, when
is reported in mm/h, then
is reported in dB/km.
In Rotterdam, Netherlands, the measurement of rainfall in urban areas through CML is presented [
35]. In their research, data from June and July 2009 from 57 microwave links with a length greater than 0.7 km and an average length of 3.7 km were used. The frequencies ranged from 13 to 39 GHz. Rainfall attenuation is validated with the use of (a) the two Doppler weather radars, working at C-band, and they are operated by the Royal Netherlands Meteorological Institute, (b) a rain gauge network that was adjusting radar-based accumulation. A rainfall retrieval algorithm is also confirmed using data from a 27 GHz research link.
Chwala et al. used data from 5 microwave backhaul networks in southern Germany [
36]. A new method was introduced that detected wet and dry periods through spectral time series analysis. In their research, they did not use data from providers, but instead, special equipment installed in towers received power which was recorded by using a data logger. Data were captured from July to October 2010. The data was then sent via a GSM module to the database server for processing and analysis. Specifically, a Cinterion TC65i that included a GSM/GPRS module and two analog to digital converter (ADC) data loggers were used. The advantage was that as they received the analog voltage with an ADC and they achieved better precision in the order of 0.01 dB. They also measured the value of the analog voltage every 3 s and stored the average value per minute. For comparison with signal attenuation, six rain gauges were used in the area of measurements, three with 0.1 mm resolution and 3 with 0.2 mm resolutions. Validation was also achieved through a C-band weather radar covering a radius of 256 km and generated precipitation data every 5 min.
The contribution of this research team to the creation of rainfall maps, even for a whole country, is reflected once again in their work [
37]. Data were used from approximately 2400 Links with operating frequencies at the highest rate between 37 and 40 GHz and an average path length of about 3 km. The emitted power was almost constant, while for 15 min, the average value of the received power was recorded based on the maximum and minimum amount with 1 dB of resolution. The data were obtained from June to September 2011. Specifically, acquired data from a gauge-adjusted radar was used for the calibration of the microwave link rainfall retrieval algorithm and for the validation of link-based rainfall maps.
Two research teams from Switzerland used data from microwave links in the area of Zurich, Switzerland. The measurements took place for about a year from March 2009 to March 2010, with 14 microwave links and operating frequencies of 23, 38, and 58 GHz. The received power was recorded with a temporal resolution of two and five minutes while the transmitted power was unknown. Fourteen rain gauges were used to validate the data. Detection and quantitative error detection algorithms have been proposed [
38]. In turn, the authors developed a new method for estimating the rain rate and its uncertainty by integrating the variational approach by Bianchi et al. [
39] and by applying Kalman filtering. The specifications included radar rain-rate fields with a spatial resolution of 1 × 1 km
2 along with 5 min temporal resolution in an urban area of 20 × 20 km
2. Moreover, the MeteoSwiss radar network calculated the rain rate (for obtaining the advection field) which was combined to the rates found by 14 RGs and to those estimated by 14 microwave links working at 23, 38 and 58 GHz. Their polarizations were vertical and horizontal, while the power resolution was 0.1 or 1 dB. They managed to calculate with high accuracy the spatial distribution and thus the intensity of the rainfall [
39].
In West Africa, in Burkina Faso, the marked and received signals were recorded every second with a precision of 1 dB over a 29 km wireless link while the operating frequency was 7 GHz [
40]. Evaluation of signal data was done with a tipping bucket rain gauge in time intervals of five minutes. The rain gauge was on the MWL path. Data were received from July to September 2012. Additional high-resolution X band radar data were used to correlate the received data.
The authors in [
41] (“Precipitation Classification Using Measurements from Commercial Microwave Links”) confronted the need for precipitation classification originated from RSL measurements inside various commercial wireless networks. They introduced a tree of classification whereas it resulted in an agreement (85%) to a meteorological device known as a disdrometer. The latter one acquired measurements with a rate of 15-min (resolution) while the measurements were distinguished into three categories such as (1) pure rain, (2) a mix of snow, sleet, and rain (“sleet”) and (3) no precipitation (“dry”). Specifically, the proposed tree classification was directly related to different phenomena, i.e., wet periods were identified, and then their classification was accomplished concluding to pure rain or sleet as already mentioned. Nevertheless, the basic idea of a commercial microwave network (CMN) RSL measurements related to attenuation from precipitation was introduced by the same authors in [
42]. Consequently in [
41], a framework is given for classifying the precipitation by using CMN as a wireless distributed sensor network (WDSN) whereas the CMN RSL measurements served as input to the pattern recognition (PR) system. In turn, significant contributions were the prototype PR system for classifying the precipitation type and a novel method for the same purpose but only for existing measurements of CMN RSL. In turn, the validation purposes were based on testing under real conditions (a few fixed line-of-sight radio links of Israeli Cellcom with working frequencies at 18.36 GHz [vertical polarization] and 19.37 GHz [vertical and horizontal polarization] thus the classification performance was shown with the help of receiver operating characteristic (ROC) analysis [
41].
A research team from Ateneo de Manila University used the existing structure of 5 GHz Smart Bro fixed wireless network in the Philippines [
43]. Signal levels from over 700 subscribers with one min update were used. The data were obtained from July 2012 till the end of 2013. The classification of rain events was based on sigma level parameters. Visualization of sigma levels for highly intense rainfall events was also done via color code on maps.
The main goal was to determine the rain-induced attenuation from measurements of a received signal level using wireless links at frequencies of 13 GHz and 15 GHz, leading to the construction of an empirical prediction model [
44]. A polynomial attenuation model was considered and compared with the power-law of ITU-R and, it was found to have less error on predicting rain attenuations.
In a case study in Prague, Czech Republic [
45], microwave links with few seconds of temporal resolution were used to evaluate the precipitation along with multiple rain gauges. The experimental setup consisted of 14 microwave links operating at frequencies between 25 and 39 GHz, and 3 rain gauges covering a total area of 2.3 km
2. Data were collected remotely by the links with a rate of 5 times per min. Path-averaged quantitative precipitation estimations were computed according to power law,
, where
R corresponds to the average rain rate which is measured in mm/h,
k is the attenuation in dB/km and
a,
b are the model parameters depending on frequency, polarization, rain drop temperature and size distribution [
27], obtained directly by ITU [
46]. To obtain the attenuation caused by rain, a baseline is set during the wet season by interpolating the total attenuation within a window between 1 h before and 6 h after the rain period, to eliminate wet antenna attenuation (WAA). The baseline on dry seasons was simply the transmitter-receiver power difference. In contrast to conventional rain gauges, the microwave links performance is relatively more stable across all topologies layouts even during heavy rainfall events that they highly variate in both time and space.
Chwala et al. addressed the restrictions on access and data acquisition (DAQ) by commercial microwave links [
47]. In their work, they developed an open-source DAQ system written in Python to acquire real-time data from homogeneous and heterogeneous networks with high temporal resolution time. Data from 450 Ericsson MINI-LINK TN CMLs were acquired every min with only several seconds’ of delay.
Overeem et al. used data from a vast number of 2044 path links in a population of about 35,000 km
2 in the Netherlands [
48]. Received signal levels from Nokia and NEC microwave links were sampled every ten Hz while the maximum and minimum values of the received power were saved every 15 min. Additional information, such as geographic coordinates were also logged. The power resolution was 0.1 dB for NEC microwave links and 1 dB for Nokia. The total number of usable data was 894 days, while the operating frequency for the majority of the links was between 37 and 40 GHz. Two rain gauge networks validated the data. In the automated network, with a density of about 1 in 1000 km
2, automatic precipitation was measured every hour and daily. In the second manual network, the data obtained daily, and the density was about one gauge per 100 km
2. Additional radar rainfall data were obtained from two ground-based C-band weather radars.
In Italy, they used attenuation from microwave links in the K-band to create 2-D maps of accumulated rainfall [
49]. The microwave links operated at 25 GHz with a medium path link of 6 km in the Treviso area. The impregnated power was recorded with a sampling rate of 15 times per 2 min and the power resolution was equal to 3 dB. The measurements took place in September 2015. As far as the data from the nine rain gauges, they had rainfall accumulation per 24 h. Despite the small number of links, the reconstructed rain map was satisfactorily useful due to how it was by a collocated rain gauge network.
Relevant to the progress of rainfall monitoring due to cellular power measurements [
50], the use of the measurements being acquired from commercial cellular networks is discussed. Each channel is supposed to be the microwave link between two base stations. Consequently, this set-up was used as a rain sensor based on the fact of signal attenuation, which was directly associated to the rain rate. Specifically, the OSN (opportunistic sensors networks) technology is used with the drawback of lower quality sensing which is compensated by the whole network’s measurement efficiency. In turn, the utilized OSN had the characteristics of a large number of sensors, proper spatial distribution (entire country) and built-in diversity (links with different lengths and frequencies). This technique is better compared to that of a radar, thus the it can provide correlation up to 0.9647 and a measurement rate every 10 s. Nevertheless, a common protocol provides measurements every 15 min, and the technique based on OSNs is not proposed for rain mapping over oceans. Certainly, high quality maps can be produced with the use of OSNs [
51]. In particular, the authors in [
50] have studied the way that links’ spatial geometry can lead to a well-derived rainfall map. They mention that they accomplished a dynamic rainfall map over an area of 15 km
2 with a spatial resolution of 1 km, while the temporal resolution had been set to 1 min.
The combination of short commercial microwave links in an urban environment and rain gauges is a promising solution to improve space-time resolution of rain monitoring [
52]. An exponential law usually models the attenuation due to rainfall. For frequencies between 20–40 GHz, the exponent parameter is close to unity. The authors propose a more straightforward model combining linear approximation for rain attenuation and wet antenna attenuation and that is
, where
γ is an empirical parameter related to raindrop attenuation,
k is a specific attenuation after baseline separation, and Δ is offset parameter correcting both for wet antenna attenuation and baseline inaccuracy. This model performs well with aggregation intervals of few minutes to 1 h but not for higher intervals. Additionally, the range of the links should be 1–2 km or less.
Several techniques used to estimate rainfall were compared, namely rain gauges, radars, and microwave links providing datasets into a rainfall-runoff simulation model for lowland catchments in the Netherlands. It was found that seasonal variations caused errors in the microwave links attenuation model. The events were underestimated in summer but overestimated in autumn [
53].
In Sao Paulo, Brazil, CML measurements were taken for 81 days from 20 October 2014 to 8 January 2015 [
54]. The measurements came from 147 Huwai and Ericcson CML with a power resolution of 0.1 dB. The analysis of the data was done in path links smaller than 20 km. For the validation of the rainfall attenuation, 152 rain gauges of the National Early Warning and Monitoring Center of Natural Disasters (CEMADEN) in Brazil, were used to measure rain amount per 10 min of integration time. The operating frequencies of the links were ranged from 8 to 23 GHz. Rain rates were derived from attenuation measurements through Rainlink. The rain gauges validated thirty min of rainfall estimations, and the possibility of rainfall was confirmed in subtropical climates such as that of Sao Paulo.
A work that could be considered of being complimentary to [
38] and to similar ones, is the vertical precipitation estimation which was introduced in [
55]. This estimation was due to the Virga phenomenon as the latter can mislead the proper estimation of precipitation at the ground. Consequently, a new method was suggested combining commercial microwave links’ (CMLs) measurements to those of weather radars at different heights. In turn, a vertical profile of the rain rate (in arid areas) and of the cloud base level (CLB) was accomplished. The estimation was validated by taking into account the RGs measurements, thus comparing the proposed CLB to that of real CLB (weather station). The mentioned method exhibited a maximum correlation of 0.9615 relevant to measurements from RGs and from two observed storms. The location of the experiment included a CML path of 16 km of length and recording procedures of every 15 min while the utilized radar elevations had a total range of 355 to 2862 m above ground. As far as for clarification purposes, three different kinds of apparatus/measurement conditions were used and i.e., CML and radar beams observing two different elevation ranges constituting the aforementioned total range. An immediate result from this proposed method could be flash flood warnings.
A comparison of measured and predicted rain attenuation was presented by Valtr et al. [
56]. The measurements took place between 2014 and 2016. A total of 17 microwave links were used in the Northeast area of Prague, Czech Republic. The operating frequencies were centered around 32 and 38 GHz. The minimum length of the links was 186 m, while the maximum was 1810 m—the transmitted and received power levels were collected by a customized software that runs on the mobile server operator. The sampling was done every 1 min, and the power resolution was 0.33 dB. Rainfall data was available from the rain gauge network of Prazska vodohospodarska spolecnost. The results shew that the theoretically underestimated formulas systematically deviated the signal attenuator by several dB relevant to the measurements.
Path-averaged rainfalls were estimated in a microwave network comprising eight links at frequencies 6–8 GHz and distances between 5.7 and 37.4 km [
57]. The accuracy of the estimation of rain-induced attenuation on the links was found higher than 80%, and it was confirmed using concurrent measurements by rain detectors in weather stations. The power resolution of signals was 0.01 dBm and the temporal resolution was 1 min.
It is shown that it is possible to detect rain using errors and attenuations recorded by microwave backhaul network, in a wet-dry classification fashion, employing machine learning techniques [
58]. Measurements records from 34 commercial microwave links in two years were studied. Detection using both attenuation and error measurements outperforms slightly instead of using only attenuation measurements.
The experimental setup included data from two active CMLs from the cellular operator Cellcom near the city of Arad in Israel [
59]. The two CML shared the same path-link with a length of 16 km, an operating frequency of 18.6 GHz, and polarization being horizontal or vertical. The output log recorded the maximum received signal level (RSL) value for a 15-min time interval and ±0.3 dB quantization. For the correlation of the data, two typical rain gauges measured rainfall with ten min integration time. In addition, data were also derived from the Israel Meteorological Sector’s controlled radar, which was located roughly 85 km from the CML to one located in the town of Arad and the other in the Shani area. Six rainfall events from November 2015 to March 2016 were analyzed and compared with CML. Through these observations, it is shown that the bias affecting the min/max RSL, TSL interferes with CML based rain estimation methodologies.
A further step in the prediction of rain was conducted by Julius Polz et al. with the use of convolutional neural networks [
60]. As far as the quantitative estimation of the precipitation with CMLs, this could be, as aforementioned, supplemental to other already known techniques such as rain gauges. The opportunistic character of this method could be finely correlated to revolutionary data processing. This work is oriented towards the processing part of the rain detection system and i.e., the time series of the signal level at CMLs. A convolutional neural network (CNN) is employed with 20 layers of neurons (along with 1.4 × 10⁵ trainable parameters) for this purpose in order to be trained for detecting and analyzing attenuation patterns (apart from only the amount of fluctuations) due to rainfall and the utilized data originated from 3904 CMLs in Germany. This CNN was a probabilistic classifier and was trained by a learning algorithm of Goodfellow et al. [
61]. A more in-depth view reveals that this CNN was trained for about four months and by using 400 randomly selected CMLs. The produced results were tested against those of gauge radar RADOLAN-RW on an hourly basis. Furthermore, receiver operating characteristic (ROC) analysis reported that the CNN was far better than the reference with an average detection score of 87% for rainy and 91% for non-rainy conditions.
Nevertheless, a serious difficulty was to report the noisy part correctly from the light rain’s signal fluctuation. Other specifications of the system included path lengths from 0.1 to over 30 km and CMLs’ frequencies from 10 to 40 GHz. Moreover, the TSL was stored with a 1-min rate and a power resolution of 1.0 dB while the power resolution for RSL was equal to 0.3 dB.
Two research teams from Germany used data from 3904 CML operated by Ericsson [
62]. CMLs were distributed throughout Germany, and sampling was done every minute. The data retrieval period was approximately one year from September 2017 to August 2018. The power resolution was 1 dΒ for the transmitted signal and regularly 0.3 dB for the received signal. The length of the path links ranged from a few hundred meters up to 30 km, and the operating frequencies were ranged from 10 to 40 GHz based on the length of the path. For the validation of the data, measurement equipment such as a gridded gauge radar, which was adjusted every hour, had been already employed by the German Meteorological Service. Particular emphasis was given to the accurate determination of rain event by the signal attenuation signal and the wet antenna attenuation using schemes of Leijnse et al. 2008 [
63] Schleiss et al. 2010 [
64].
In Kuala Lumpur, Malaysia, rain attenuation and rainfall measurements were collected for 1.8 km of path link and for a period of one year from September 2017 to 2018 [
65]. The measurements were conducted at 73.5 GHz (E-band), while three rain gauges had been installed along the path. The gauges were tipping buckets type with a sensitivity of 0.2 mm. A transmitter (Tx) and receiver (Rx) were equipped with Mini Link-6352 providing the minimum and maximum received signal level values every 15 min. This was the first experiment at E-band, and it was accomplished in a heavy rain tropical region.
Another interesting research which used a deep learning approach relevant to recurrent neural networks (RNN) is reported in [
66]. The key-points are (1) the rainfall estimation by taking into consideration only the minimum and maximum attenuation data in order to produce a constant weighted average method for calculating the actual attenuation and (2) that the proposed RNN model was developed by using a disdrometer’s (OTT PARSIVEL1 located 20 km from Melbourne) data with an interval of 30 s that they are comparable to those data acquired from network operators. A more in-depth look reveals that the proposed model was far better than the typical estimation methods of attenuation from MLs.
It is worth mentioning that very recent work by a research team in the Netherlands presented the possibility of monitoring general meteorological phenomena from various opportunistic sources including data from CML [
67]. Several CML were used between 18 and 40 GHz, while maximum path links values were around 10 km. Data from smartphones, personal weather stations, and traditional sources were also used. The experiment took place in the Amsterdam metropolitan area, Netherlands, during 17 days between 6 June and 23 June 2017. Although each source presented limitations regarding the accuracy, it is a fact that the more data collected by sources, the better hydrometeorological monitoring can be achieved.
5. Customized Experimental Setups
This section provides an overview of recent experimental setups that have been used to measure rainfall. The theoretical background remains the same and goes back to calculating the link budget for dry and rain events. This section also includes works that use the received signal strength level from mobile terminals to estimate rainfall.
Specifically, in Durban, South Africa, the one-year experimental data from a 6.73 km path with operating frequency at 19.5 GHz was compared to theoretical results from typical rain attenuation models. Integration time for both the rainfall and the received signal was 1 min [
68].
A disaster alarm system was designed based on measurements from wireless link attenuation due to rainfall in the Philippines where typhoons are common phenomena. In order to estimate the spatial distribution of the rain rate, acoustic sensors had been placed along the path of the links with a resolution of 100 m. The microwave links were operating at 26 GHz and were placed at distances of 4 km each other. Three years of measurements were processed in order to establish the attenuation model. The received signal level limit and the duration of rainfall were two critical parameters that triggered the alarm system [
69].
Rainfall has an effect on wireless signal quality. It has been observed that during and after rain period wireless links operating at 2.4 GHz were affected, in such a way that some of them had decreased performance but some of them had increased performance [
70]. The phenomena were attributed by the authors not to rain itself but in water gathered on antennas changing their radiation pattern, because at such relatively low frequency, the attenuation due to rainfall is expected to be negligible according to existing theoretical models. Following an experiment where water was periodically sprayed on antennas plastic enclosures, it has been found that initially, the received signal strength increases, and then it decreases as the water amount is large enough.
An experimental setup was established using microwave links together with rain gauges in order to estimate rain-related attenuation to received power [
71]. Transmitters and receivers were placed at distances of about 3–4 km. The double operating frequency was at 13 GHz and 22–23 GHz approximately. The rain gauges were tipping buckets. The baseline, that is, the received power in the absence of rain, was not assumed to be constant during the rain event as it could be unrealistic. The baseline is not defined only by the rain itself but also by atmospheric absorption depending on specific conditions. The model performed better, considering the variable baseline. The calculation of the baseline was based on a linear low-pass filter approach. Specific attenuation by the wet antenna effect was taken into account as well. The attenuation model was expressed as,
R , where
R corresponds to the rain rate (mm/h) while
k is the specific attenuation (dB/km) and the parameters
a,
b are found to be approximately 4.4 and 1.1, respectively.
In the customized experimental setup used by Chwala et al. to measure precipitation and humidity, they presented, among other things, detailed information about the microwave system they implemented [
72]. The system included a combined transmitter/receiver with operating frequencies of 22,235 and 34.8 GHz. The length of the path was 1.32 km. The data were sampled at a rate of 20 Hz via an automatic operating mode with a power resolution of 0.1 dB. For the validation of the microwave data, a Thies Laser Disdrometer had been installed next to the Tx/Rx system which had a time resolution of one minute. Very close to the measurement area, there was a weather station of the type Vaisala WXT520 which gave rain rate data, humidity, pressure, and temperature information with a time resolution of ten min. The experimental setup was located near Fendt, Peißenberg, Germany, and a total of 6 different attenuation cases were analyzed from 2011 data.
The effect of weather in electromagnetic wave propagation was studied over the Aegean Sea, Greece using data recorded from stations installed on several islands [
73]. The main goal was to evaluate the attenuation level of microwave links based on local rainfall measurements. It was found that moderate precipitation caused a power loss of about 10–12 dBm at 2.4 GHz.
Nevertheless, very little research has been carried out on wireless signal attenuation due to rainfall for frequencies lower than 5 GHz, mainly because the theoretical models consider it a negligible power loss for such low frequency. In this work, experiments took place in order to investigate this effect at the frequency of 1.8 GHz, used by the global system for mobile communications (GSM) [
74]. Commercial mobile phones were used to report the received signal strength (RSS) from base stations (BSs) in dBm. The distance between BS and the mobile device was 400 m. Experimental measurements showed that the attenuation during the raining season was far greater than the theoretical expected one; furthermore, it is comparable to the theoretical attenuation caused by a frequency of 120 GHz. In addition, another potential factor affecting the attenuation was found to be the wind, causing fluctuations on the RSS level. In their next work [
75], an alternative approach to rain attenuation was given that was focused on improved distance estimation through the study of sensed radio strength and precipitation. An in-depth view reveals that this work introduces a new enhanced received signal strength (RRS) distance estimator whereas it takes into account the precipitation, as well as the proposed path-loss model, includes rain attenuation for accomplishing an estimation based on an iterative form of Newton’s method. Simulations and measurements verified the very good ability to estimate distance during precipitation with an adequate error reduction rate (85–90%) compared to that of the conventional scheme. For the purpose above, sensed precipitation data were taken into consideration (from a proposed estimator) from a local weather station (WS) or from the Central Weather Bureau (CWB). Specifically, rain rate acquirement was conducted with integration times of 30 min or more while the estimation error was at least 120 m when rain rate was equal to 20 mm/h. Additionally, the actually utilized band was that of the 1.8-GHz GSM mobile network.
In their work [
76], Hong et al. had the goal of seeing only the effect of rain on signals on the W/V band that can be used for satellite communications. For this reason, in a small terrestrial path link and at a distance of 560 m in the New Mexico area, they measured signal attenuation due to rain at 84 GHz. The experimental setup included a disdrometer in the transmitter and receiver area for validation. The results were preliminary and were acquired in August 2016 for 27 days’ time.
Two scientists from Chosun University, Republic of Korea, analyzed rainfall and rain attenuation data for 3 years from 2013 to 2015 in the area [
77]. The attenuation data came from 2 links with lengths of 3.2 km and 0.1 km and operating frequencies of 38 and 75 GHz, respectively. The data were sampled every 10 s and averaged over one min. Data were obtained from National Radio Research Agency (RRA). An optical disdrometer OTT Parsivel was used to measure rainfall intensity and to validate rain attenuation. Attenuation over the same path link of 3.2 km was measured rain attenuation for 18 GHz operating frequency [
78]. The same research team studied rain attenuation for a microwave link with 18 GHz and length 3.2 km [
79]. The measurements took place in the period from 2013 to 2015 in South Korea. Both the rainfall data and the signal data were received by sampling every 10 s. The rain rate was measured using an OTT Parsivel laser optical placed near Receive Tower. Antennas are placed 30 m above the surface and they are protected by radome to prevent unwanted wetting antenna conditions. Comparison with ITU-R P.530-16, Moupfouma, Silva Mello, and Abdulrahman models with the proposed prediction model was also discussed. Experimental results were observed to be undervalued due to the ITU-R P.530-16 model.
Customized measurement equipment with 10
−4 dB power resolution and a signal-to-noise (SNR) ratio of 145 dB, with sampled values of 0.2 min, was introduced by Christofilakis et al. [
80]. Validation of data was accomplished through the conventional 0.2 mm per tip rain-gauge. The experimental setup included transmitter and receiver at a distance of about 20 m between them so that the rainfall to be uniform. The antennas were located inside two adjacent buildings in order not to be present the wet antenna attenuation and wind jitter errors. Rainfall amount from 0.2 to 0.8 mm was measured over one year from 2015 to 2016. The measurements took place within the University of Ioannina campus near the town of Ioannina. Furthermore, the same research group from Greece presented a rain attenuation model in the lowest region of the microwave S-band validating signal and rainfall data from one-year measurements [
25].
Beritelli et al. made an assessment of the rainfall based on received signal level features from an LTE/4G mobile terminal [
81]. For their measurements, they used the Mobile terminal and the G-Mon application, which gave a report of parameters related to received signal strength, connection type, etc. The data was recorded by sampling for 1 min. The datasheet included data obtained for more than 112 h in the area of Catania, Sicily, Italy. The receiver (mobile terminal) had been placed at a distance of 200 m from the base station. For the correlation of the data, a tipping bucket rain gauge was used at the same point as the mobile terminal. They also presented a classification method based on a probabilistic neural network so that there is a separation into four possible rainfall conditions no-rain, weak, moderate, and heavy rain.
In Malaysia, two research teams implemented a 5G radio link with a length of 1.3 km and an operating frequency of 26 GHz [
82]. The link was set up between WCC, University Technology Malaysia, Johor Bahru and Skudai. The radio-based system was based on an Ericson mini link CN 500. For rainfall, a tipping bucket was used with 0.5 mm sensitivity while the data were collected in the logger every minute. The measured attenuation over the path link exhibited a maximum value of 34 dB which this fact can significantly affect communication.
Exploring the feasibility of creating a wireless disaster alarm system, two microwave links were employed measuring the degradation of received signal level due to rainfall. The links were operated at frequencies of 5 GHz and 26 GHz [
83]. The microwave attenuation was correlated with rain rate measurements by tipping bucket gauges. The used model for attenuation due to rain presence is A
, where
R is the rain rate in mm/h, A is the attenuation in dB/km and
α,
b are constants depending on frequency. The constant parameters were found to be the following; for the 5 GHz link
α = 1.3479,
b = 0.2045. For the 26 GHz, link tow differences were found between master and slave terminals mainly caused by different rain gauge resolutions. For the master terminal
α = 1.6908,
b = 0.5348, using a 15-min gauge resolution, same as for the 5 GHz link, while for the slave terminal
α = 2.1139,
b = −0.8724, using event-driven tipping bucket. The 26 GHz link was more susceptible to attenuation due to rain compared to the 5 GHz one.
A custom experimental setup operating at 22.84 GHz and 77.52 GHz K and E band, respectively have been designed by Huang et al. [
84]. Measurements took place from January to December 2018 at Durham, UK. The path link between the Tx and the Rx antenna was 35 m. The rain attenuation was related to rainfall events by a PSW100 disdrometer. The PSW100 rain data were logged every minute, while channel data were recorded with a sampling rate of 1 s per min. Measured rain attenuation is much higher than the predicted one (ITU model) and that would be equal. The wet antenna effect was also investigated.
Song et al. presented in their work the feasibility of detecting signal through a cellphone signal [
85]. Data were captured from 8 June to 17 July 2016, on University Campus in Nanjing China. The path link was 504 m with no clear line of sight. The measurement setup consisted of a signal generator (Tx side) and a spectrum analyzer (Rx side). The spectrum analyzer was used to measure the received power in the receiver. The resolution was 0.01 dBm, and the sampling of the received signal was about 183 times per minute and the operating frequency was 2 GHz. An OTT Parsivel disdrometer exhibiting 1 min resolution was used for temporal validation. A detection method to classify dry/rainy periods presented and trained using the C4.5 algorithm.
Moroder et al. used a unique experimental setup [
86] that is a successor to their previous work to analyze the wet antenna effect and determine its effect on the rain rate. Their unique instrument provided measurements derived from the antenna reflection coefficient. In their work, 6 independent Commercial microwave link antennas were used with frequencies of 18, 22.235, 25.375, 28.500, 34.800, 38.500 GHz. The test site was at Fendt near Weilheim in Upper Bavaria, Germany. A detailed analysis of the used hardware was also presented. The heart of the instrument was a standard VNA from Anritsu, while a Raspberry Pi 3 was used as a main central processing unit (CPU). Two disdrometers, a weather station near the test site, and a video camera were used for further validation of the attenuation measurements.
6. Research Challenges
Challenging and limitation issues concerning both CML and customized experimental measurements including but not limited to are:
Short sampling times even with 24-h rates
Limited access to received signal strengths
Limited power resolution
Fluctuations in the transmitted and received signal due to electronics’ noise
Signal’s effect by various phenomena due to the path between the transmitter and receiver, such as fading due to reflections from nearby objects and the ground, but also by atmospheric parameters.
Wet antenna effects
Jitter due to wind on antennas
Heterogeneity in methodologies
Signal processing and machine learning algorithms
Lack of experimental measurements and different frequency bands and mainly in the lower microwave region of the spectrum, which is ruled by abundant remote sensing devices operating under specific wireless communications standards. These devices could potentially adopt scientific and technical aspects in the future, in terms of precision and accuracy to measure rainfall.
The aforementioned issues have been addressed in detail by Brauer et al. [
53], Uijlenhoet et al. [
26], Messer [
87], Chwala and Kunstmann [
88].
Microwave links can be used efficiently to estimate path-averaged rainfall employing either the path-integrated attenuation or the attenuation difference of two signals having different frequencies or polarizations. In [
89], the authors have assessed the errors and uncertainties in microwave link estimation of path-averaged rainfall intensities due to rainfall variability. To this end, the simulated link signals using measured time series of raindrop size distributions, thus obtaining a dataset of almost 2 yr in size relevant to drop size distributions. This dataset has been used in combination with wind measurements to simulate link signals and compute the appropriate statistics.
Microwave links have been also widely implemented for wireless data exchange, primarily between mobile phone networks or base stations. However, the ability to distinguish the attenuation during dry periods (i.e., the so-called attenuation baseline) from the one due to rainfall is a critical issue. Specifically, such a procedure requires identification and separation of dry from rainy periods. In [
64], a method of implementing this procedure was proposed and was implemented with the use of path-integrated attenuation measurements which had been obtained from operational microwave links. Dry and rainy periods were separated by analyzing the local alteration of the link signal. The attenuation baseline was real-time estimated by employing the classification procedure into dry and rainy periods.
Cellular networks which are constituted of commercial microwave links provide the benefit to measure near-surface rainfall. Nevertheless, the operated communication links introduce uncertainty relative to the dedicated installations because the properties of the working frequencies, and thus the geometry is oriented towards high communication performance instead of rainfall observation.
Consequently, when the measurements are non-optimal it is obvious that quantification of the uncertainties is needed in order for the data to be usable. In [
90], various instrumental impairments were studied and included signal variations originated from antenna wetting, uncertainty of baseline attenuation and digital quantization, and thus environmental ones, i.e., the observed variation of drop size distribution along a link’s territory whereas is affected the accuracy of the path-averaged rainfall measurement and the spatial variability of rainfall which in turn affects the rainfall estimation accuracy outside the link’s range.
Accurate measurements of rainfall are significant in the scientific areas of meteorology, hydrology, agriculture, environmental policy, and weather forecasting. In order to obtain such measurements, one can use a number of microwave links to constitute a wireless communication network (WCN). These types of links, for cellular network infrastructure, can be envisaged for an environmental sensor network (ESN). Particularly, the term “sensor” can be explicated as a radio link which binds a base station to the main network. For this kind of ESN, the main constraint is to produce algorithms for assessing the intensity of weather effects which compromise communication performance in the order of influence and i.e., rainfall and wind, humidity, fog, and snow.
In [
51], authors revealed the achievability of employing microwave communication links from a cellular infrastructure as ESNs intended for rainfall monitoring.
In [
91], a dataset of 2-yr time was retrieved by utilizing a C-band dual-polarization radar (C-Pol) (which is found near Darwin, Australia) is employed for extracting statistics of stratiform and convective precipitation into five large-scale regimes.
The precise recovery of rain rates from attenuation measurements of commercial microwave links poses a demanding duty. For the purpose of acquiring reliable rain rate estimation, various matters need to be addressed such as baseline estimation and wet-antenna attenuation. The authors in [
92], by utilizing the information from an experimental setup positioned in the area of Zürich, managed to calculate with unprecedented precision and temporal resolution the wet-antenna attenuation impacting a commercial microwave link.
Hoedjes et al. underlined the combination of data from different sources, and a cognitive, high-resolution flash flood early warning system was also introduced. There were about 1800 rainfall stations in Kenya that do not support real-time monitoring. By integrating signal attenuation data from a telecommunication company with more than 3000 links and operating frequencies 7, 8, 15, 23 GHz and distances from a few km up to 80 km, vast amounts of data will be produced [
93].
Precise measurements of precipitation are important for many applications, such as flash-flood warnings and water resource management. Nevertheless, the precision of the current tools is restricted due to several technical and practical factors. In [
94], a survey of the current publications and works on this area of expertise has been presented.
In [
95], a method was introduced for the purpose of adjusting parameters of the power law locally, mostly in real-time, by using measurements from rain-gauges and existing CMN.
In [
96], a retrieval algorithm for rainfall mapping from microwave links in a cellular network as a substitute or supplement for continental-scale rainfall monitoring has been proposed.
Zohidov et al. negotiated the problem of creating rainfall maps through signal attenuation data [
97]. A new retrieval algorithm was suggested for showing the abilities of microwave links to monitor rainfall inside urban areas. The area of research was the city of Nantes in France. The rain datasets came from 207 weather radar images. The microwave links of the area were 256 with path links varying from 0.3 to 16.8 km with operating frequencies of 18.23 and 38 GHz.
In [
98], the authors analyzed the impact of the quantizer along with the min/max operators on the signals levels measurements of commercial microwave links. They proved that the quantization process, in conjunction with the min/max operators, aggregates bias to potential important measurements. In addition to the previous, they suggested a way of calculating the bias and exhibited their results by using measurements from actual commercial microwave links.
An affected link budget of microwave wireless communication has been properly studied for network design. The effects were originated from rainfall and other environmental phenomena. Nevertheless, the procedure has typically been conducted for every microwave-link separately. The attenuation in several microwave-links is currently being used in real-time for rainfall mapping of specific areas and particular algorithms have been designed for relating multiple microwave-links’ attenuation to its corresponding rain-field. These algorithms’ performance considerably rely on the network’s structure. In [
99], the statistical nature of cellular microwave network (CMNs) has been studied along with the establishment for this kind of model which is based on empirical results.
In [
59], authors examined through network management systems (NMS) the acquired attenuation measurements from two microwave links during the period of multiple rain events. They empirically demonstrated that the output of the NMS included bias, which interfered with the rain-estimation process. With the intension of using attenuation measurements, acquired from microwave links, for estimating the rain, the baseline attenuation level is necessary to be obtained. Current methods regularly exploit the low attenuation values which are observed during the periods prior to the beginning of the rain that has been defined as dry for determining the baseline attenuation level in the period of rainy activity.
In the next work [
87] are reviewed significant results and technologies oriented in more detail to the opportunistic-sensing idea. As far as the measurements-results that can be acquired for environmental sensing from commercial microwave links (CMLs), these can be further enriched because there is a capability of employing a vast number of virtual sensors with no cost at all. Two different approaches for environmental monitoring exist and these are the active and the passive one. The latter scheme uses records of network management systems (NMS) for accomplishing weather monitoring. Only the level values of minimum and maximum received signal (RSL) along with the transmitted signal (TSL) are saved at a rate of 15 min and a power resolution of 0.1–1 dB as aforementioned. These measurements are rarely available in real-time because they are typically used for analysis purposes.
On the contrary, the active approach uses the simple network management protocol (SNMP) for acquiring weather monitoring measurements in real-time at small intervals of even 10 s. The additional unnecessary cellular network traffic can be avoided with the use of a dedicated server for such a kind of RSL measurements but a problem still exists and that is the permission from the provider to access the system behind the firewall. Additionally, many studies are reported to have been conducted for environmental monitoring such as rainfall sensing, rainfall mapping, humidity and fog sensing, precipitation classification, dew and pollution detection, and wind estimation. Additionally, works have been reported to contribute relevant to error analysis, i.e., the sources of errors such as general, dry/wet, wet antenna, calibration, quantization bias, non-linear preprocessing, and network topology. Furthermore, works suggesting algorithms for rainfall monitoring are reported such as instantaneous rain mapping, dynamic rain mapping, and heavy rain detection, combined with other measurements, rainfall tomography, accumulated precipitation, and various open software tools. Then, various applications are mentioned which are relevant to large scale rainfall estimation/mapping, rainfall measurements, flood prediction, disaster alarm, calibration of other sensors, and hydrology. Finally, the potential use of the aforementioned reviewed technology is shown and i.e., the covering of blind spots (no near-ground measurements are available), the monitoring accuracy improvement and the improvement of various meteorological and hydrological models.
In [
100], authors presented a theoretical analysis that justified the use of the lower attenuation values and proposed a systematic method, in order to estimate the baseline attenuation level in real-time, without needing a dry/wet classification.
In [
101] the authors elaborated on the use of microwave links from commercial cellular communication networks which were used in The Netherlands since 2003. In that work, authors reported on their experience on this topic starting back to 1999.
The exploitation of measurements by wireless communication and navigation systems for environmental sensing has shown great potential for monitoring several atmospheric phenomena. On the other hand, data collection and storage are an open issue in terms of real-time measurements and measurements from different mobile phone companies stored under different protocols and with varying accuracy. There are open issues regarding the harmonization of heterogeneous measuring sensors in an area of its spectrum that is full of telecommunication protocols [
102].
In [
103] the authors performed a measurement campaign to test a straightforward rainfall retrieval algorithm whereas the latter was applied to the microwave link measurements as a function of a power-law relationship. Their results were compared to the results of five disdrometers positioned along the path. This methodology enabled the assessment of the quality of retrieval without taking into consideration the impact of other attenuation sources.
In [
88] authors assessed the current status and future challenges of using commercial microwave link networks for observing rainfall.
In [
104], the authors proposed a method to identify wet antenna attenuation (WAA) distribution and upper limits in accordance with rainfall climatology without the need for adjacent rainfall observations. The quantified contributions of antenna wetting owing to total loss had been obtained from 2 years of data, which had been acquired from eight short (48–497 m) CMLs, which worked at frequencies of 37.3 to 39.2 GHz within the cellular backhaul.
In [
105] a model, explaining and the same time correlating the WAA to the rain rate was proposed. In that model, excess attenuation reached approx. 3 dB per antenna in the condition of rain rate equal to 100 mm/h. The statistics of theoretically predicted rain attenuation, containing the WAA term, were compared to those of measured attenuation on a set of three other links which worked at the same frequency.
Much work has also been done on the new prediction methods for rain attenuation. Since ITU-R rain attenuation mode does not perform accurately on a global scale, Livieratos and Cottis [
106] proposed a new prediction model without complex mathematical expressions that shew a very high accuracy level. This model uncovered the latent dependence of rain attenuation on operation frequency, path length, polarization, DSD, etc.
The authors in [
107] proposed a new model for estimating the statistics of rain fade slope for terrestrial microwave links inside tropical regions. The proposed model was validated with the use of the Chi-squared goodness-of-fit test.
In [
108], an analysis was presented relevant to the wet antenna attenuation from an electrodynamic perspective. That model has been predicated on the three antenna parameters such as reflectivity, efficiency, and directivity. Furthermore, the model makes possible the variation of those three parameters which depend on the degree of wetness. It has been shown that WAA is constituted of variations relevant to antenna impedance, efficiency, and directivity.
Of particular interest are the rain attenuation and the ability to measure the path average raindrop size distribution with microwave link instruments. This feature is presented in a recently published work [
109]. Two different methodologies were used where simulated data on radar and disdrometer measurements from France were applied. The metadata was also applied to variables derived from 5 laser DSDms along the path and also to data originated from microwave link instruments in the Wageningen area, Netherlands. Preliminary results from the application of the method to an experimental setup of 26 and 38 GHz microwave links along a 2.2 km path link was also additionally presented.

 ,
, 


