Article

Influence of the Installation Position of Submersible Pumps on Deposition Characteristics in Prefabricated Pumping Stations

1
National Research Center of Pumps and Pumping System Engineering and Technology, Jiangsu University, Zhenjiang 212013, China
2
Institute of Fluid Engineering Equipment, Jiangsu Industrial Technology Research Institute (JITRI), Zhenjiang 212009, China
3
United Automotive Electronic Systems Co., Ltd., Shanghai 201206, China
*
Authors to whom correspondence should be addressed.
Symmetry 2020, 12(8), 1347; https://doi.org/10.3390/sym12081347
Submission received: 11 July 2020 / Revised: 7 August 2020 / Accepted: 9 August 2020 / Published: 12 August 2020

Abstract

:
Based on the discrete phase model (DPM), solid–liquid two-phase flow calculation, particle settling theory and MATLAB image processing technology, the influence of the installation position of submersible pumps on the deposition characteristics in a cylinder-type prefabricated pumping station was studied, and two performance indices, the deposition rate and area ratio of the easy deposition region were proposed. The results show that the area ratio and deposition rate of the easy deposition region increase as the suspension height increases. The discharge effect is best when the suspension height is 0.1H0, however, at this time the inlet bias of the pump is larger, which is not conducive to the smooth operation of submersible pumps. The area ratio and deposition rate of the easy deposition region gradually increase with the increase in the interval of the pumps. As the center distance increases, the area ratio and deposition rate of the easy deposition region basically decreases first and then increases, and reach the minimum at 0.1R and 0R, respectively.

1. Introduction

Compared with traditional pumping stations, the integrated prefabricated pumping station has the advantages of small size, low energy consumption, short installation period, low maintenance cost and so on. It plays an important role in the construction and transformation of urban sewage pipe networks, river regulation, residential areas and water source protection areas, and other decentralized sewage collection. However, sediment is easily deposited in the pump pit, which affects the efficiency of sewage discharge and corrodes the materials of the pumping station. Therefore, the anti-deposition performance is one of the problems considered in the design of integrated prefabricated pumping stations. Although there are many anti-deposition design schemes available at present, there is still a lack of simple and efficient methods to improve the effectiveness of the design.
The deposition phenomenon has been studied in many fields, especially in the area of industrial and water conservancy construction where there has been extensive study of this phenomenon. Peng et al. [1] investigated the influence of the particle character and stream field on particle deposition in a new type of rectifying plate system. Jassim et al. [2] studied the deposition characteristics of hydrate in gas pipeline by using the CFD method and established the corresponding calculation model of deposition location. Xu et al. [3] established a particle deposition model by the random function method and studied the particle deposition characteristics of a plate-fin heat exchanger. Manuel et al. [4] simulated the effects of different particle sizes on particle deposition and the effects of tube wall morphology on particle deposition rate in the case of multi-row tube bundles in the superheater. Ling et al. [5] established a theoretical particle model and studied dust flying in a coalmine tunnel. Heydarabadi et al. [6] studied particle dust deposition over a tilted photovoltaic module under various working conditions. Li et al. [7] used a CFD method that numerically simulated the flow in a pumping station, studied the flow characteristics of water and sand in a prefabricated pumping station, and optimized the design parameters and shape of the bottom of the tank to reduce the deposition of sand particles. Kang et al. [8] used CFD to simulate the flow field of a pumping station, and studied the effects of pump spacing and pump installation height on the pump performance and the two-phase flow pattern of the pumping station. Ding et al. [9] studied the problem of sedimentation in the forebay of a pumping station. Using a physical model of the pumping station, they found that when the water level was high, the flow velocity in the regulating pool was low, which can easily cause sediment deposition in the regulating pool. Considering that the sediment deposition of the pumping station has a great negative impact on the running of the unit, Mi et al. [10] carried out a numerical simulation of the structural flow at the inlet of the pumping station based on the Eulerian solid-liquid two-phase flow model and CFD method. The simulation results indicated that sediment deposition occurs in the forebay due to poor flow pattern therein. In order to improve the operation of the forebay, several designs for the optimization of the pumping station were carried out. Through optimization, the sediment deposition of the pumping station was improved.
However, there is currently little research about the influence of the installation position of submersible pumps on the deposition characteristics of pumping stations. In our previous research, we chose the deposition rate in order to study the deposition characteristics of a baffle-type integrated prefabricated pumping station under different flow rates, different particle diameters, and different liquid levels [11]. The deposition characteristics of a prefabricated pumping station under the action of single/double pumps were also analyzed and the motion trajectory of particles at the bottom of the pump pit when the closing inlet valve was closed were measured by using a high-speed photogrammetry system. Therefore, two performance indices are proposed in this paper, the deposition rate and the area ratio of the easy deposition area, and the influence of the installation position of the submersible pump on the deposition characteristics of a barrel prefabricated pumping station was analyzed based on the discrete phase model (DPM). The results could provide a reference for the design of anti-deposition prefabricated pumping stations.

2. Research Model and Method
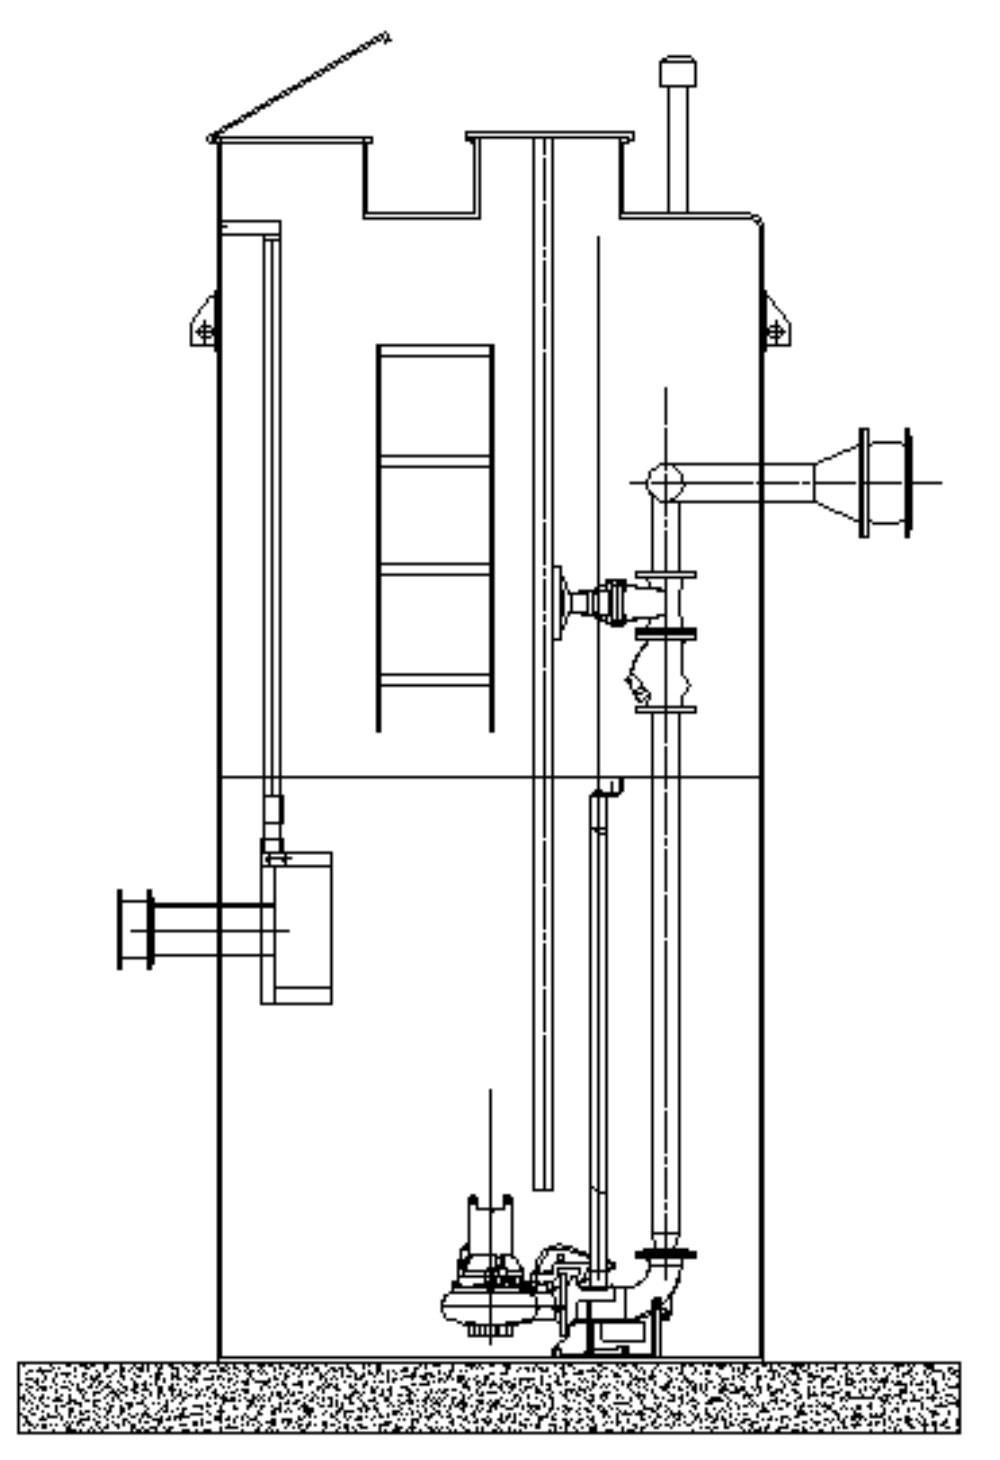
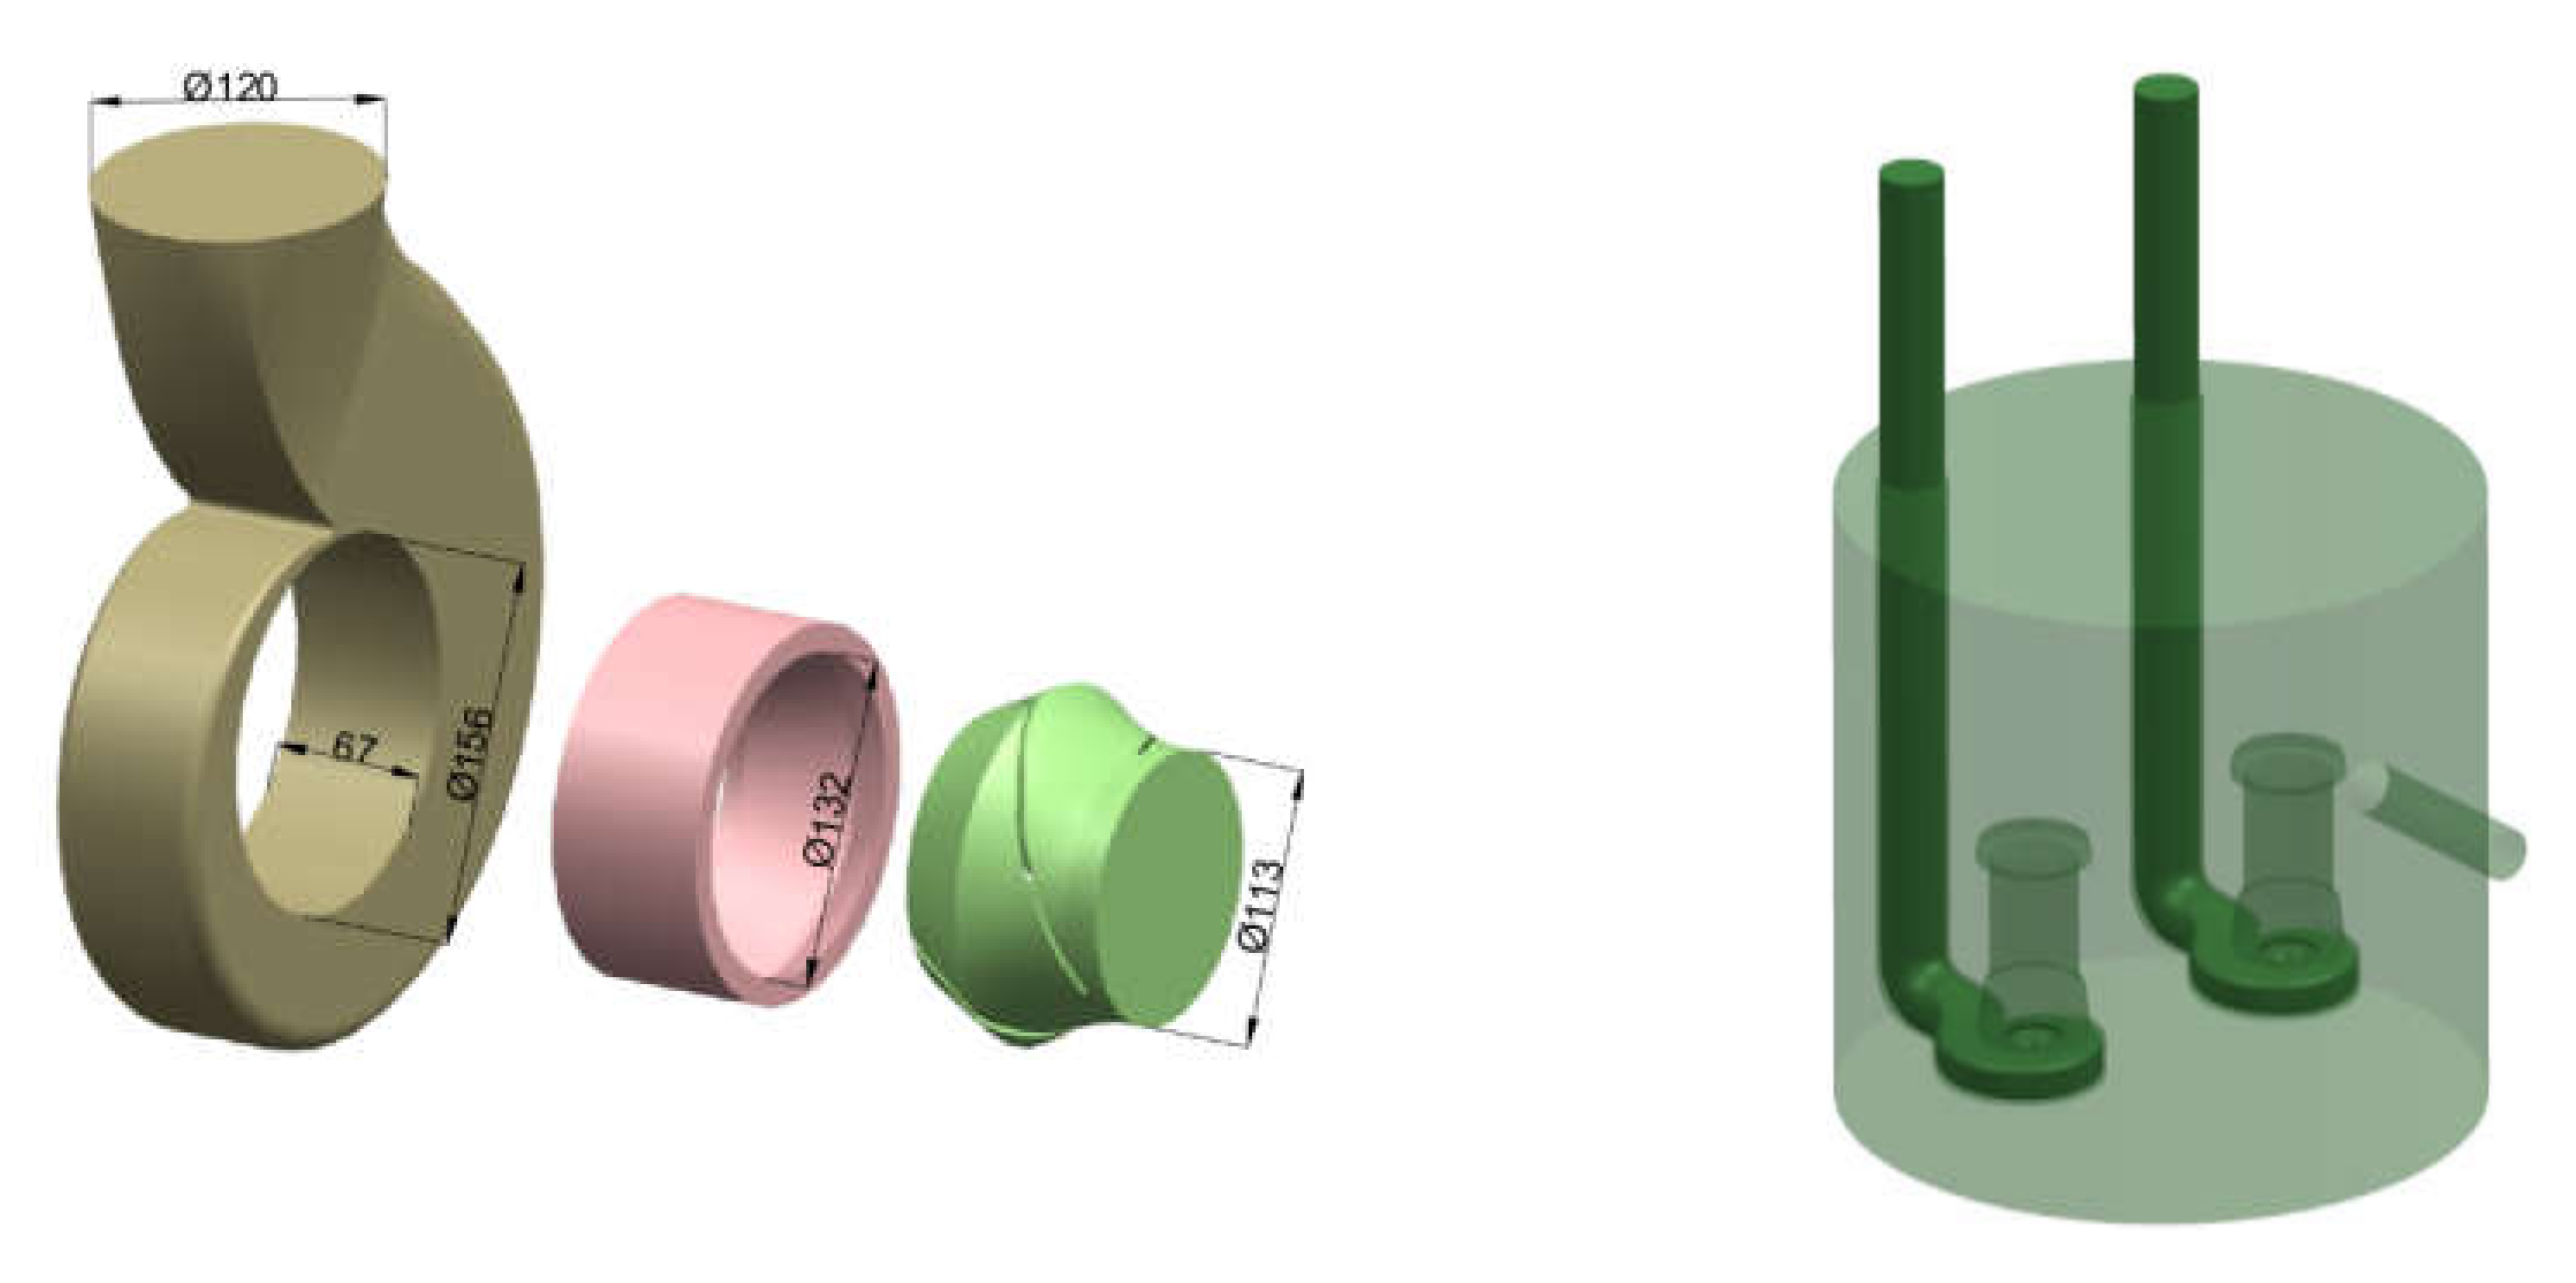
There are two main kinds of harm caused by particle and debris deposition in prefabricated pumping stations: (1) the long-term accumulated deposition cannot be cleaned effectively, which gradually reduces the effective volume of the prefabricated pumping station and affects the efficiency of sewage discharge and transportation, and (2) the deposition is immersed in the water for a long time and gradually decays. Thus, because the material of the prefabricated pumping station is usually steel, long-term contact with the deposition at the bottom of the pump pit causes a certain degree of corrosion.
To address these two problems, two performance indices to evaluate the anti-deposition performance of prefabricated pumping stations were proposed, that is, the deposition rate of particles (DE) and the area ratio of the easy deposition region on the surface of the pump pit (AR).

2.1. Research Model

Figure 1 shows the structure of a cylinder-type prefabricated pumping station, which includes a cylinder (collecting pool), two submersible pumps, maintenance platform, piping system and ventilation equipment, etc. The main parameters of the integrated prefabricated pumping station are: cylinder diameter D0 = 1200 mm, inlet pipe diameter D = 100 mm, inlet pipe height H0 = 820 mm, operation liquid level h1 = 1200 mm, the design flow rate of single pump Q = 42 m3/h, head H = 10 m, and rotational speed n = 1480 r/min.

2.2. Grid Generation

To deal with the complicated surface of gas and liquid, the rigid-lid hypothesis method and volume of fluid (VOF) method are commonly used. The interaction between the gas phase and liquid phase is not relevant because the flow rate of the prefabricated pumping station is small. The shape of the bubbles and distortions of the liquid surface were not studied. Therefore, the rigid-lid hypothesis method was adopted in this research. In addition, as this paper mainly studied the influence of the installation position of the submersible pumps on deposition characteristics, details such as the pipeline flange, fixed bracket and maintenance platform were simplified.
Pro/E code was used to build the three-dimensional model of the prefabricated pumping station. The model consists of the water in the body of the submersible pumps and the water in the body of the cylinder of the integrated prefabricated pumping station. The body of the submersible pump is divided into the impeller, clearance and volute, as shown in Figure 2.
The calculation domain of the whole flow field was divided with the ICEM code. In order to improve the accuracy of the calculation and computing efficiency, a grid independence check was performed [11].

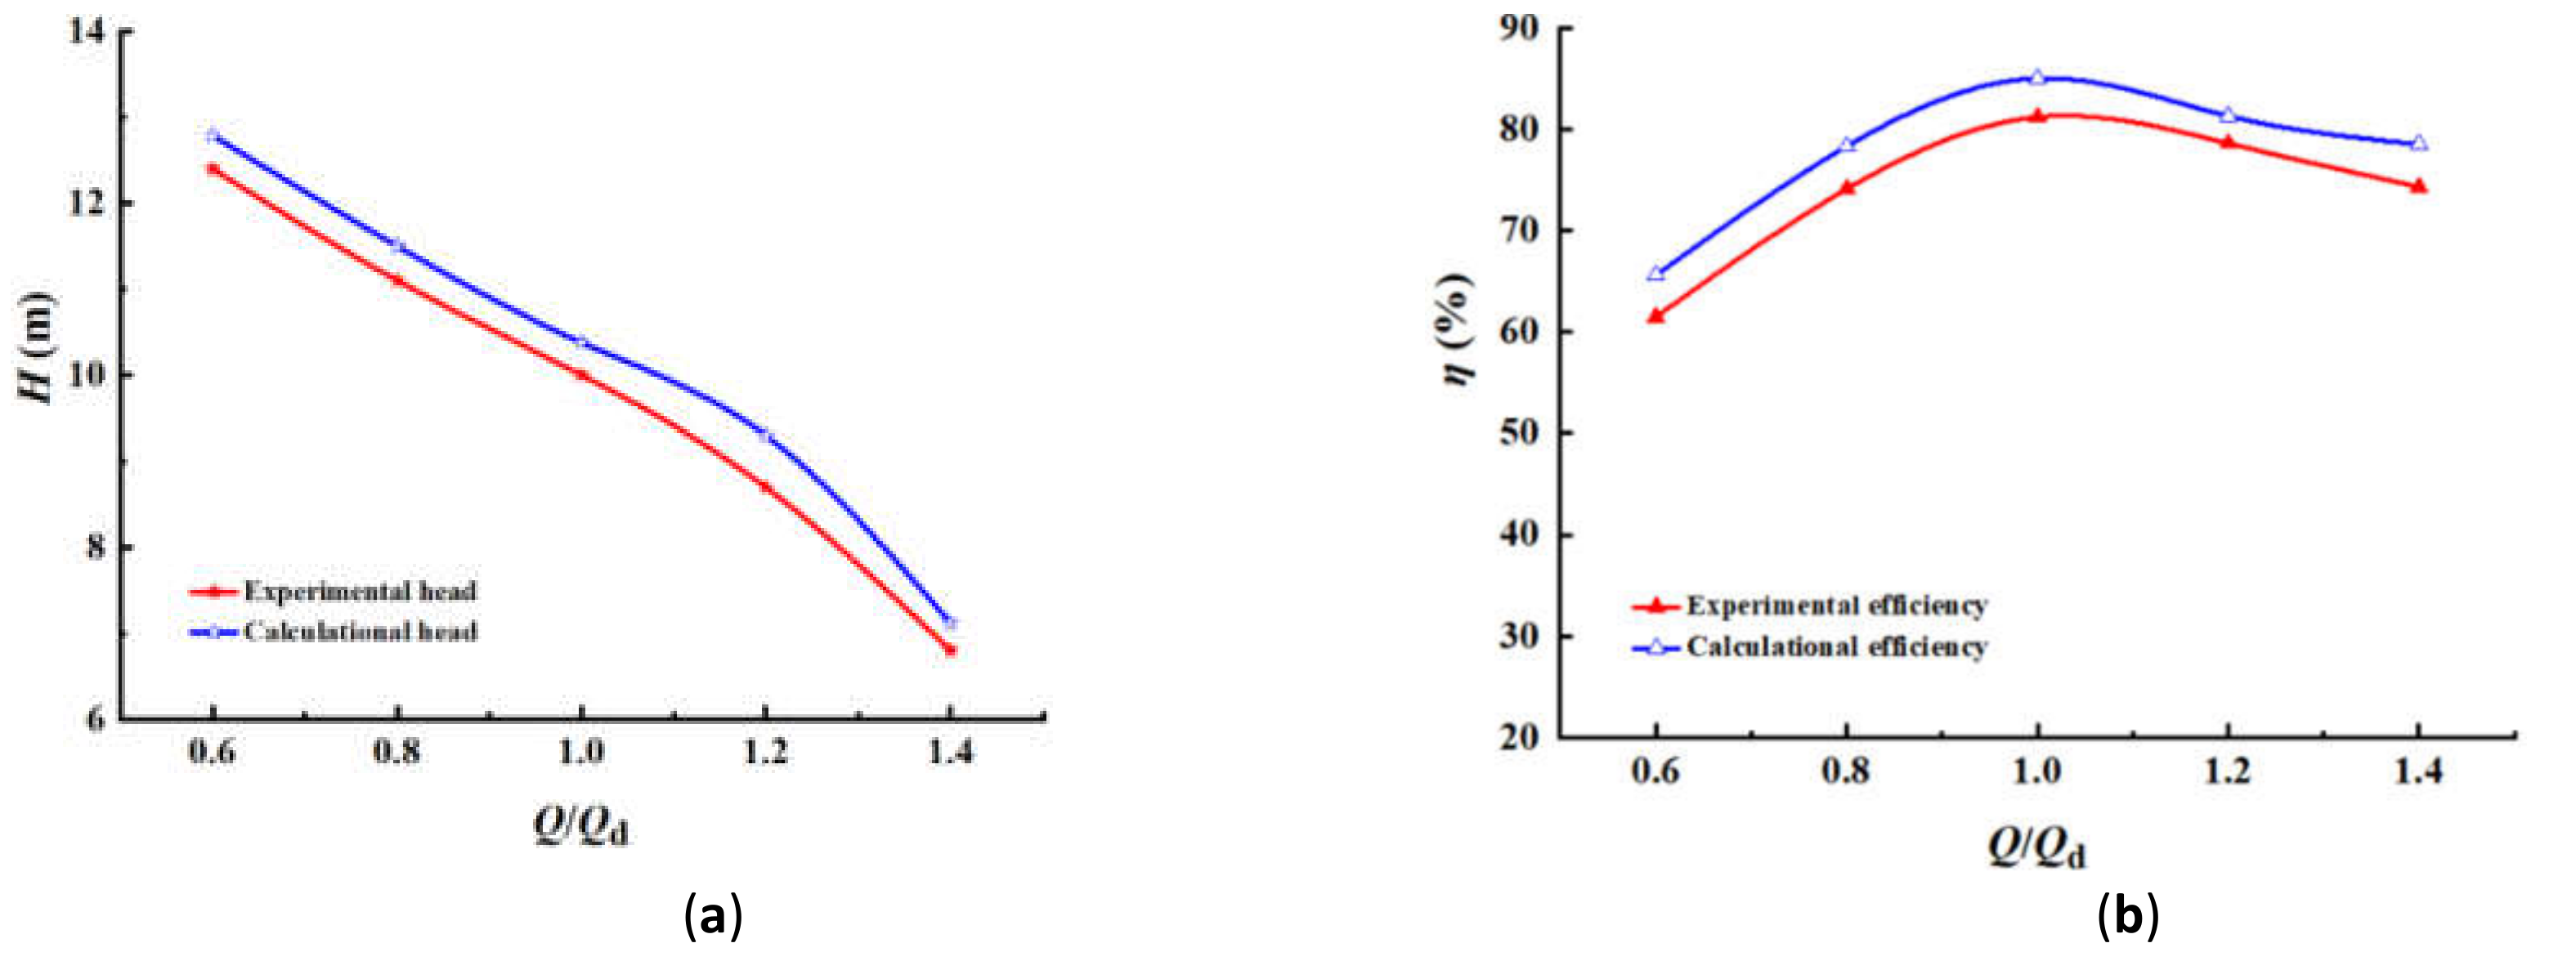
2.3. Calculation Method for the Internal Flow Field

The CFD numerical computation software, Fluent was used to calculate the internal flow field in the prefabricated pumping station and a multiple coordinate model was adopted. The setting of DPM in Fluent was the same as in [11]. The flow field in the impeller was set to a rotating coordinate system, and the rest was set to a static coordinate system. An interface was set between the rotational and static calculation domains. In the steady numerical calculation, a frozen rotor interface was used, and the time-averaged Navier–Stokes equation was used as the basic governing equation. All physical surfaces were set to no-slip wall and the near-wall regions were defined with a standard wall functions method. The cylinder inlet was set as a mass flow inlet, and the value was 23.3 kg/s. The particles with a density of 1200 kg/m3 and a diameter of 6 mm enter from the inlet at the same initial velocity as the liquid phase water, and the volume fraction was 1%. It was assumed that the turbulence was fully developed at the outlet of the pipe, and the outlet was set as a free outlet boundary.
Figure 3 shows the numerical calculation and characteristics of the experimental curve of energy in the submersible pump. Under the design flow rate, the predicted error between the calculated result and the experimental result of the efficiency is 3.4 percentage points and the predicted error of the head is 2.7%. Under other flow rates, the predicted errors of the head and the efficiency were less than 5%.

2.4. Calculation Method for the Deposition Rate

The calculation formula for the deposition rate is as follows [11].
D E = N t N e N t
where Nt is the number of incoming particles, and Ne is the number of outgoing particles.

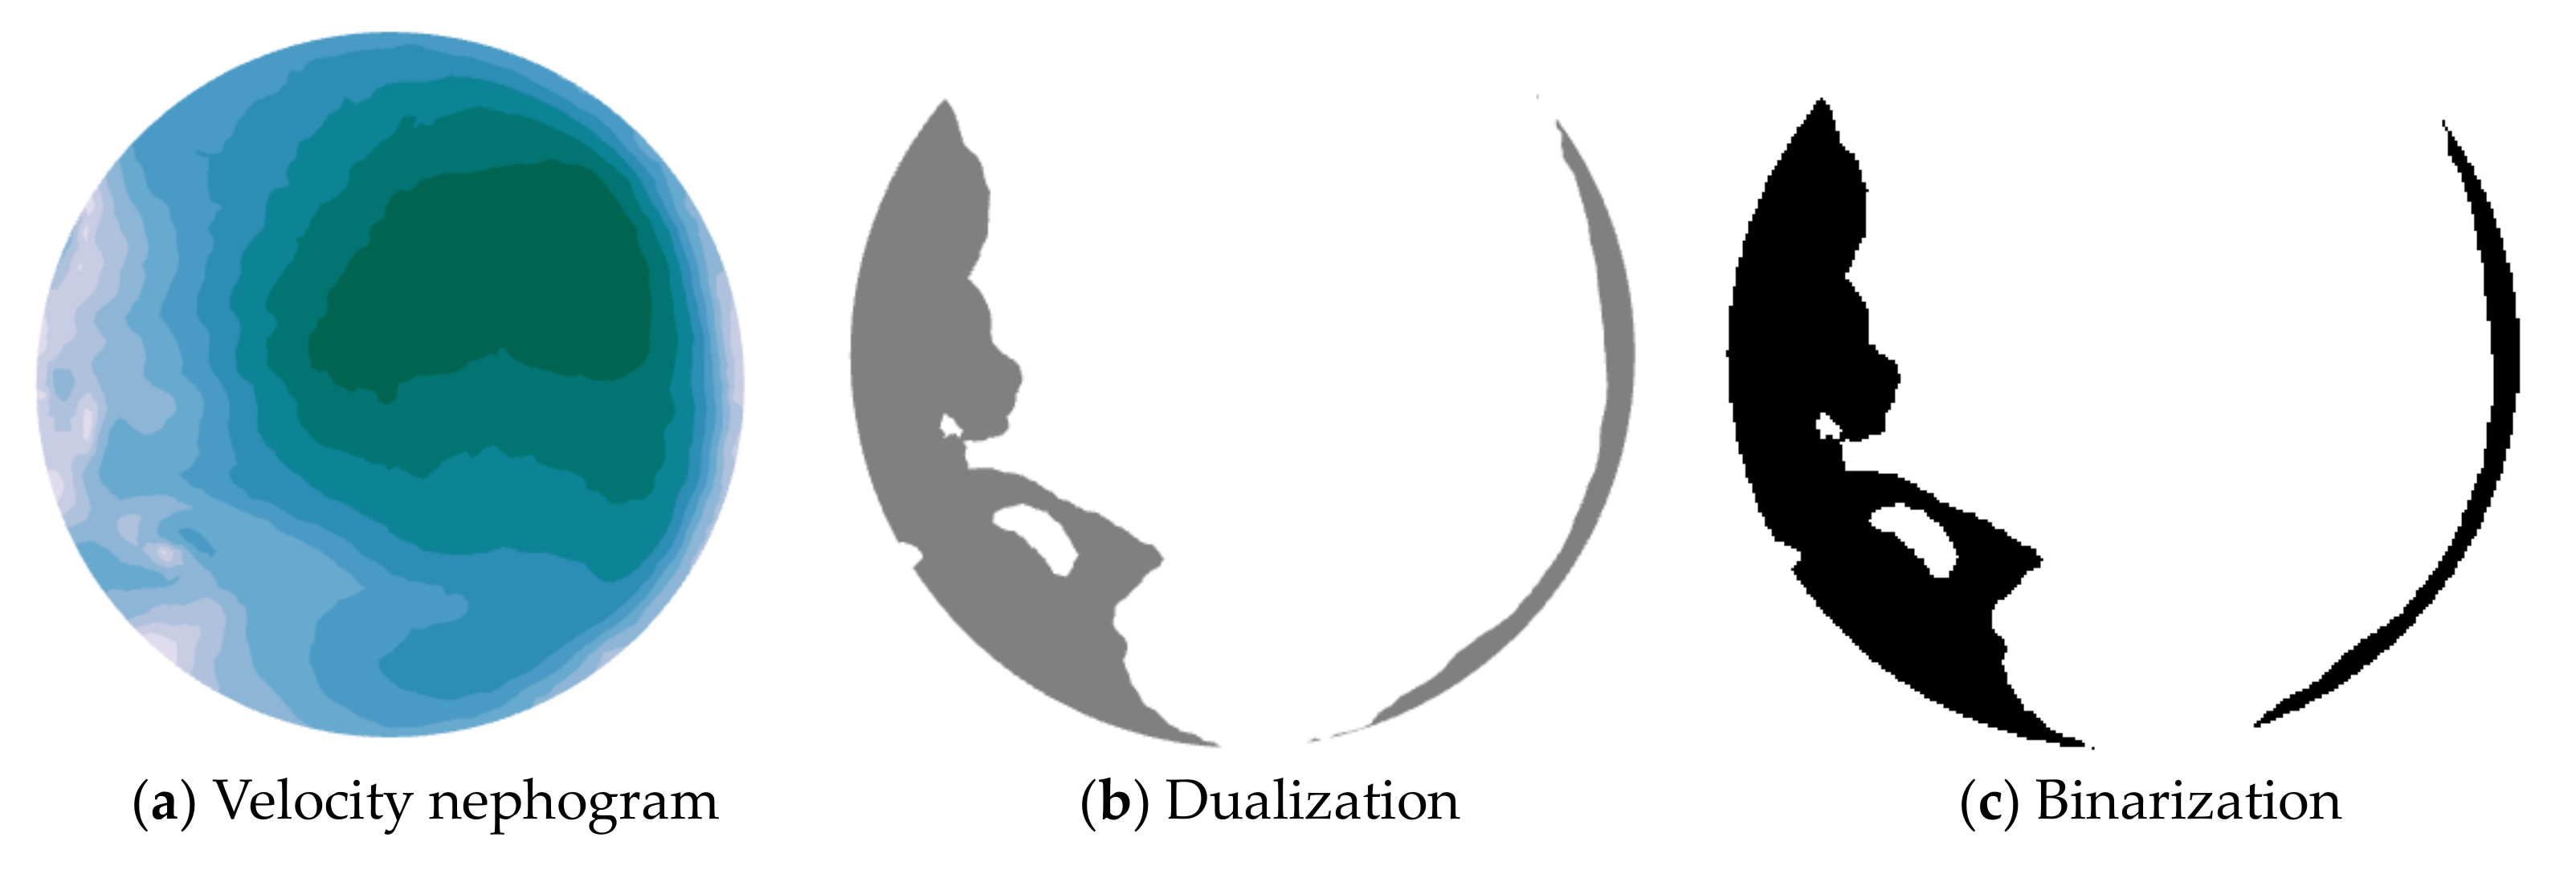
2.5. Calculation Method for the Area Ratio of the Easy Deposition Region

(1)
Particles settling theory.
Assuming that the particles are spherical, according to the force equilibrium relationship between gravity and buoyancy of particles in water, the formula for calculating the settling velocity of spherical particles is as follows [12],
u t = π d s g ρ s ρ l 6 φ ρ l
where ds is the average diameter of particles, and its value is 6 mm, φ is the drag coefficient, ds = 6 mm, φ = π 8 C , C = 0.4~0.5, ρs and ρl are the density of particles and liquid, and their values are 1200 kg/m3 and 1000 kg/m3, respectively.
According to the Govier theory [13], the flow velocity of the mixed fluid must be more than 2 times that of the settling velocity of the particles to ensure that the particles move with the fluid. Considering other influencing factors, the flow velocity of the mixed fluid was defined as 3 times the settling velocity of the particles in this research.
(2)
Image processing technology.
Threshold segmentation technology is the simplest image segmentation method, which is important when defining an appropriate threshold. If an appropriate threshold can be determined, the image can be segmented accurately. The threshold is usually selected according to the histogram of the image. After the threshold is selected, the threshold is compared one by one with the gray value of the pixel, and each pixel can be segmented in parallel. The segmentation result directly provides the easy deposition region.
The image obtained after threshold segmentation has obvious bimodal characteristics, and it is a grayscale image with two-dimensional data. Therefore, MATLAB was adopted as the research tool to calculate the area of the easy deposition region. First, the image data was read, and the two initial values m and n were defined as 0. Each pixel that was treated as a point on the coordinates with two-dimensional characteristics was traversed from the start point to the end point, and the attribution of the pixels was determined with the grayscale value. Up until the end of the traversal, the pixels in the total image with a gray value of zero was taken as the area of the easy deposition region. After calibrating, the correlation parameter between the pixel and the actual distance were obtained, thus the actual area of easy deposition region was calculated.
(3)
Area identification of easy deposition region.
Figure 4 shows the process of identifying the area of the easy deposition region. Based on three times the settling velocity, the velocity nephogram was dualized, and the binary velocity nephogram was binarized by threshold segmentation. The area calculation was performed based on MATLAB GUI and image processing functions. Finally, the actual area of the easy deposition region Ad and the pump pit surface area Aa were obtained, the formula for calculating the area ratio of the easy deposition region is as follows:
A R = A d A a

2.6. Calculation Scheme

Figure 5 shows the parameters of the installation position of two submersible pumps, including the suspension height H1, the pump interval S, and center distance L. The calculation schemes are shown in Table 1.

3. Results and Analysis

3.1. Influence of Suspension Height on Deposition Performance

Figure 6 shows the movement of particles at different suspension heights. It can be seen that when the particles hit the wall, they spread uniformly to the bottom of the pump pit, the velocities of the particles near the center are larger, and the velocities of the particles far away from the center of two submersible pumps decrease gradually, and then move toward the side of the inlet pipe. Due to the influence of the suction of the submersible pump, the particles diverging to both sides tend to converge at the center of two submersible pumps, which is very obvious in 0.1H0. The number of particles sucked into the two submersible pumps is basically the same at a low suspension height, whereas with an increase in the suspension height, the number of particles escaping from the pipeline is significantly different and the total number of particles passing through also decreases.
Figure 7 shows the calculation results for the easy deposition region at different suspension heights. It was found that the deposition area moves from a symmetrical distribution to an irregular distribution with the increase in suspension height.
Figure 8 indicates the area ratio and deposition rate of the easy deposition region. When the suspension height is 0.1H0, the area ratio of the easy deposition region is 31.4%, and the deposition rate is 58.8%. When the suspension height is 0.2H0, the area ratio and deposition rate of the easy deposition region are 34.8% and 77.3%, respectively. When the suspension height is 0.3H0, the area ratio and deposition rate of the easy deposition region increase to 35.6% and 98.3%, respectively. It was found that the area ratio and deposition rate of the easy deposition region show an upward trend with an increase in the suspension height.

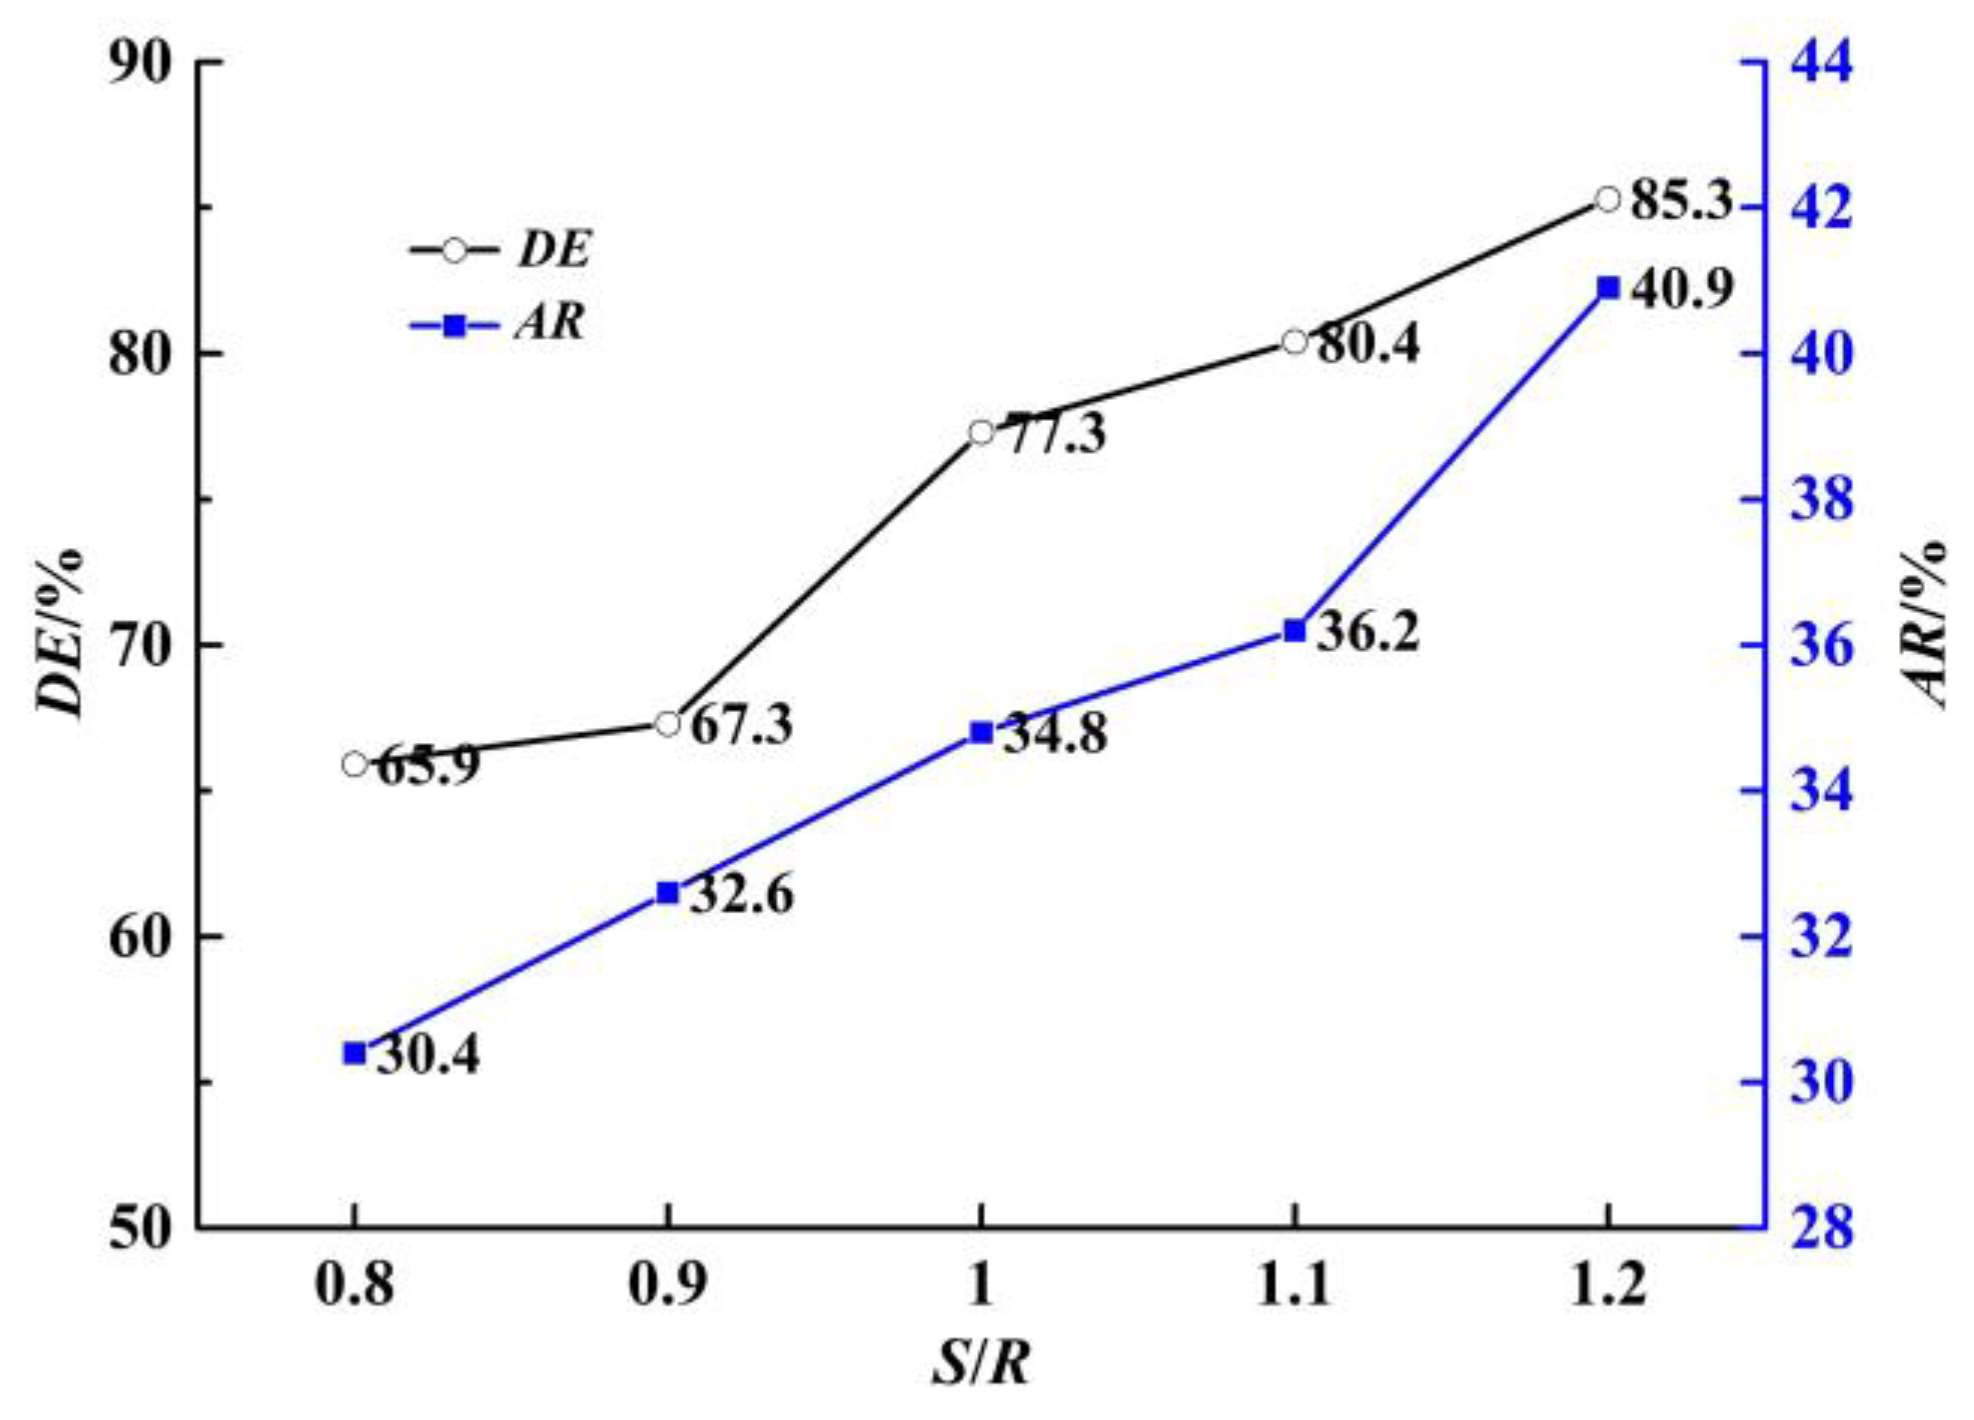
3.2. Influence of Pump Interval on Deposition Performance

Figure 9 shows the movement of particles under different pump intervals. When the pump interval is 0.8R, the particles move from the right to the region affected by the pump. Because the pump interval is relatively small, the suction to the central region is larger, almost no particles pass through the pumps, a few particles move to the edge of the cylinder wall, and finally deposit on the side near the inlet pipe. When the distance between the pumps is small, a large number of particles moving through the pumps are sucked into the submersible pump. With the increase in the pump interval, a large number of particles escape from the pumps, and the number of absorbed particles gradually decreases.
Figure 10 shows the easy deposition region under different pump intervals. Figure 11 shows the area ratio and deposition rate of the easy deposition region under different pump intervals. When the interval of the pumps is 0.8R, the area ratio and deposition rate of the easy deposition region are 30.35% and 65.9%, respectively. When the pumps’ interval is 1.0R, the area ratio and deposition rate of the easy deposition region increase to 34.8% and 77.3%, respectively. When the pumps’ interval is 1.2R, the area ratio and deposition rate of the easy deposition region increase to 40.96% and 85.3%, respectively. As the interval of the pumps increases, the area ratio and deposition rate of the easy deposition region gradually increase.

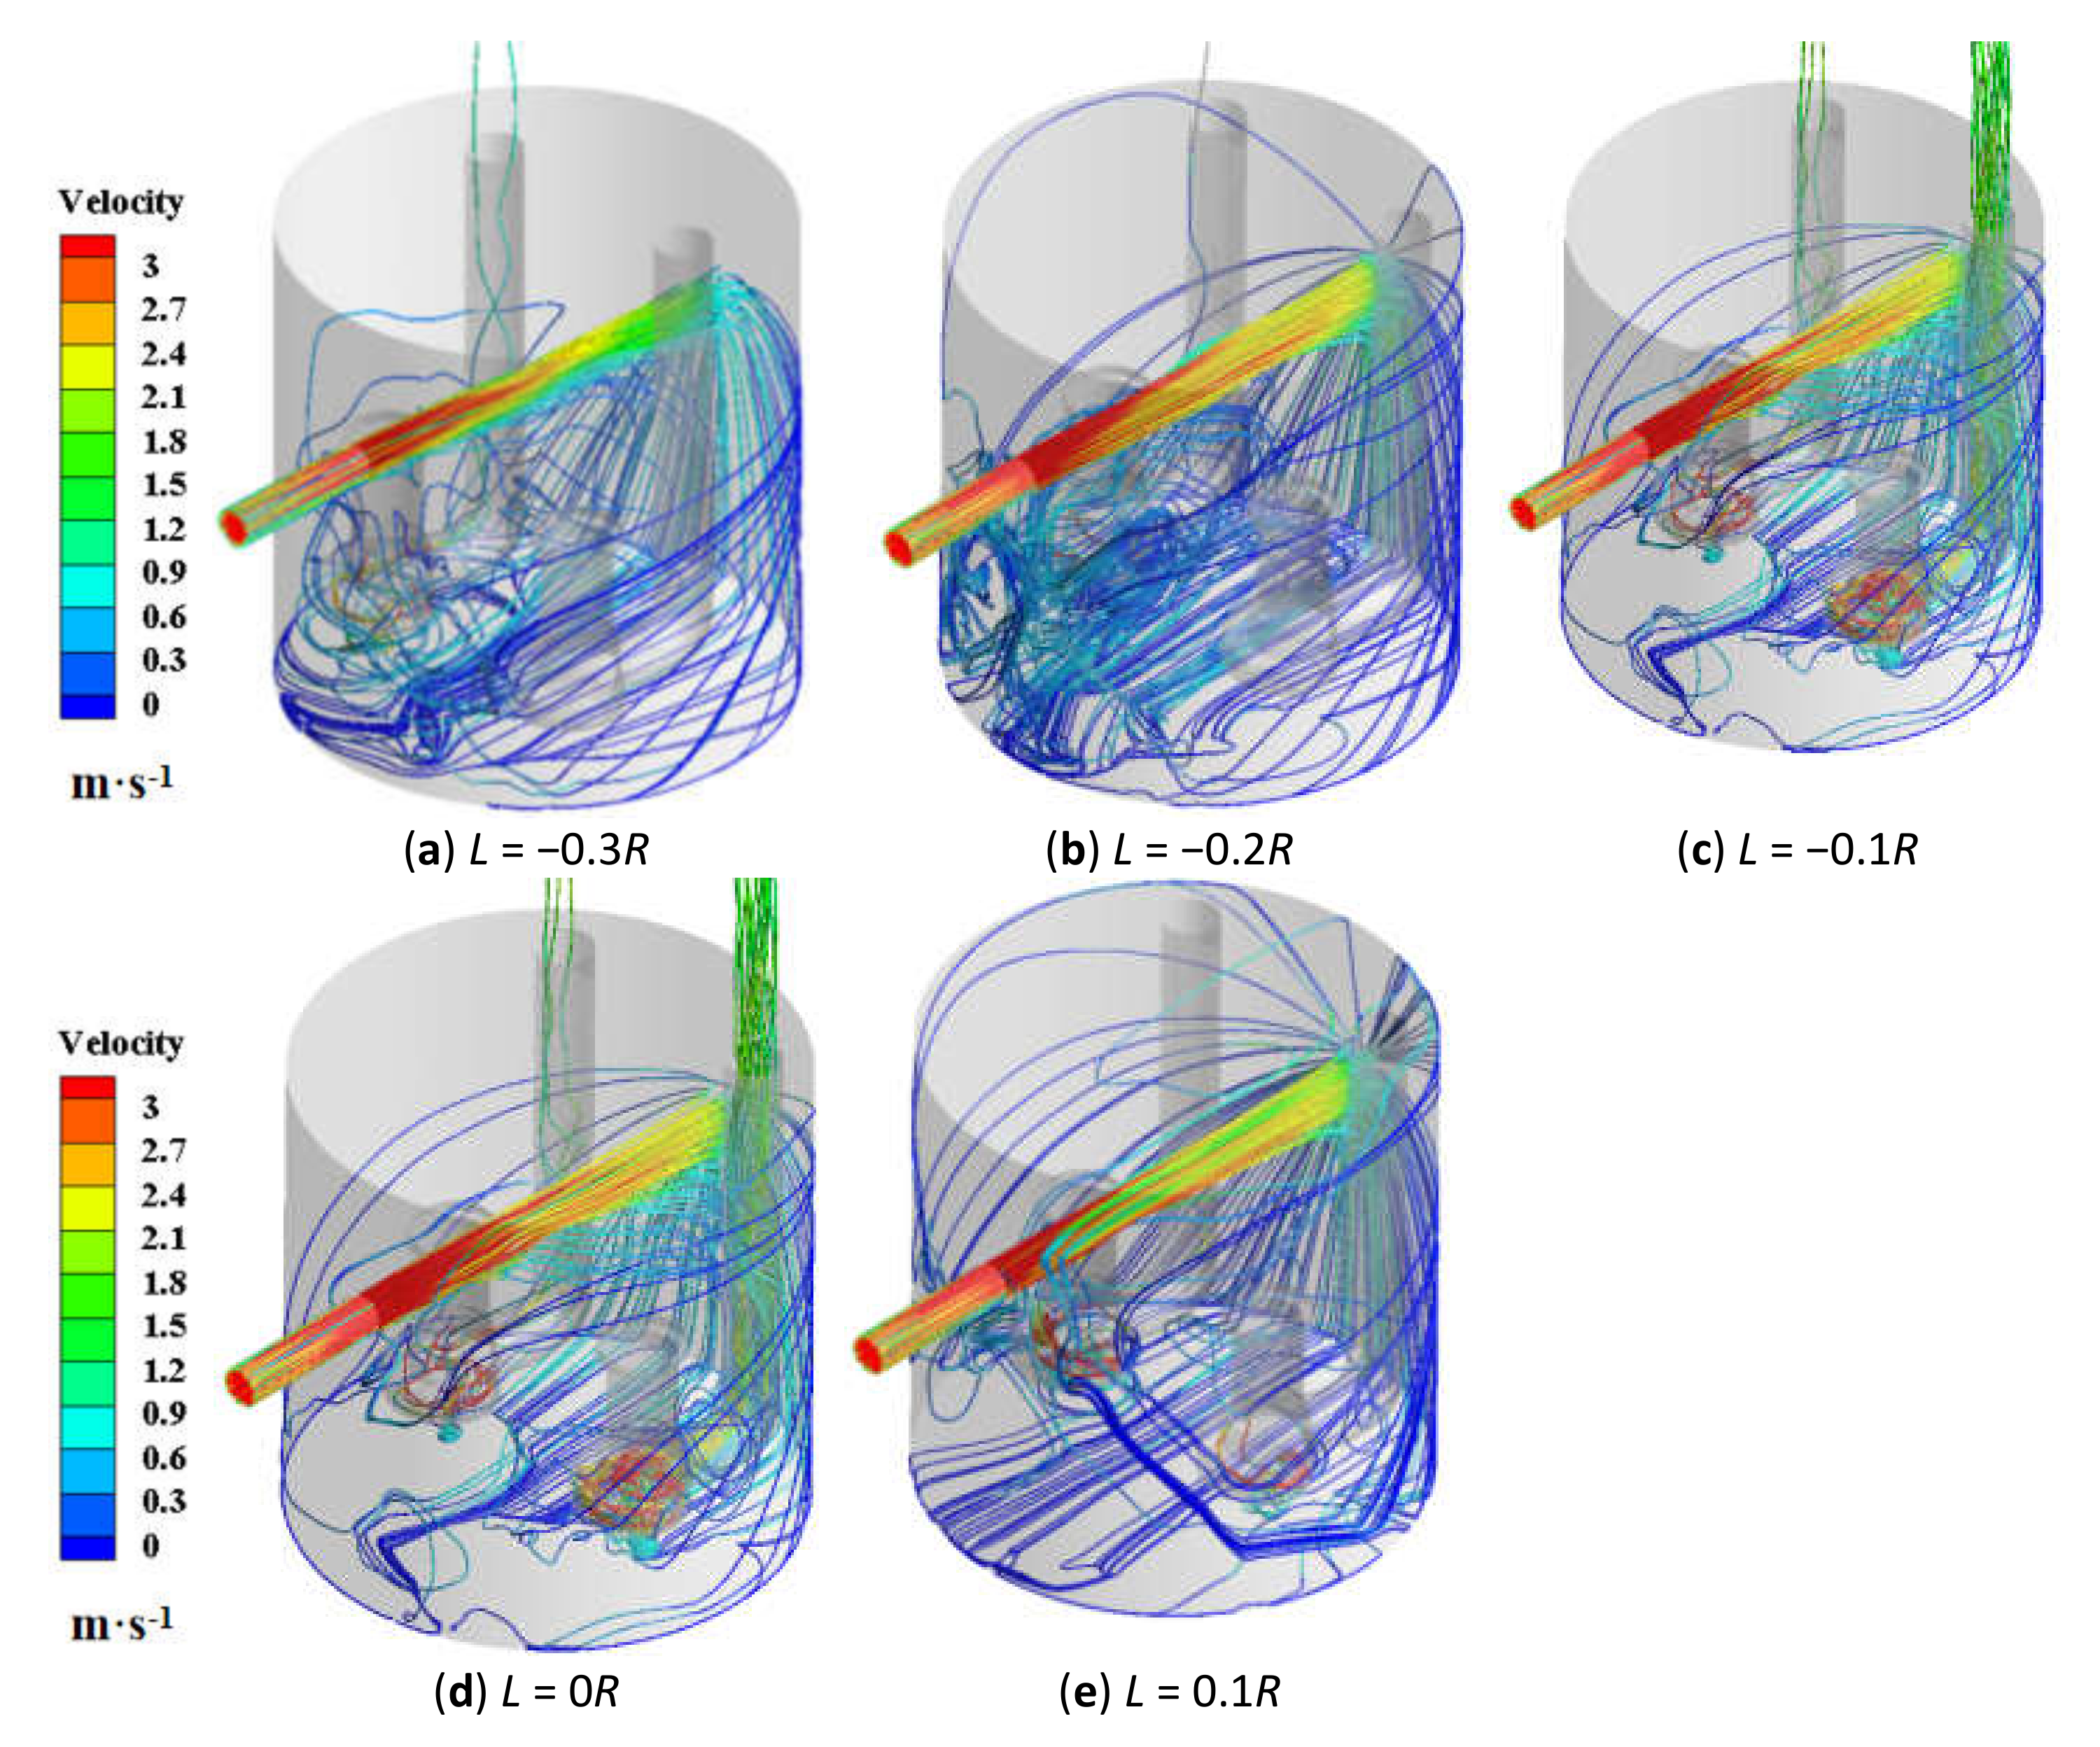
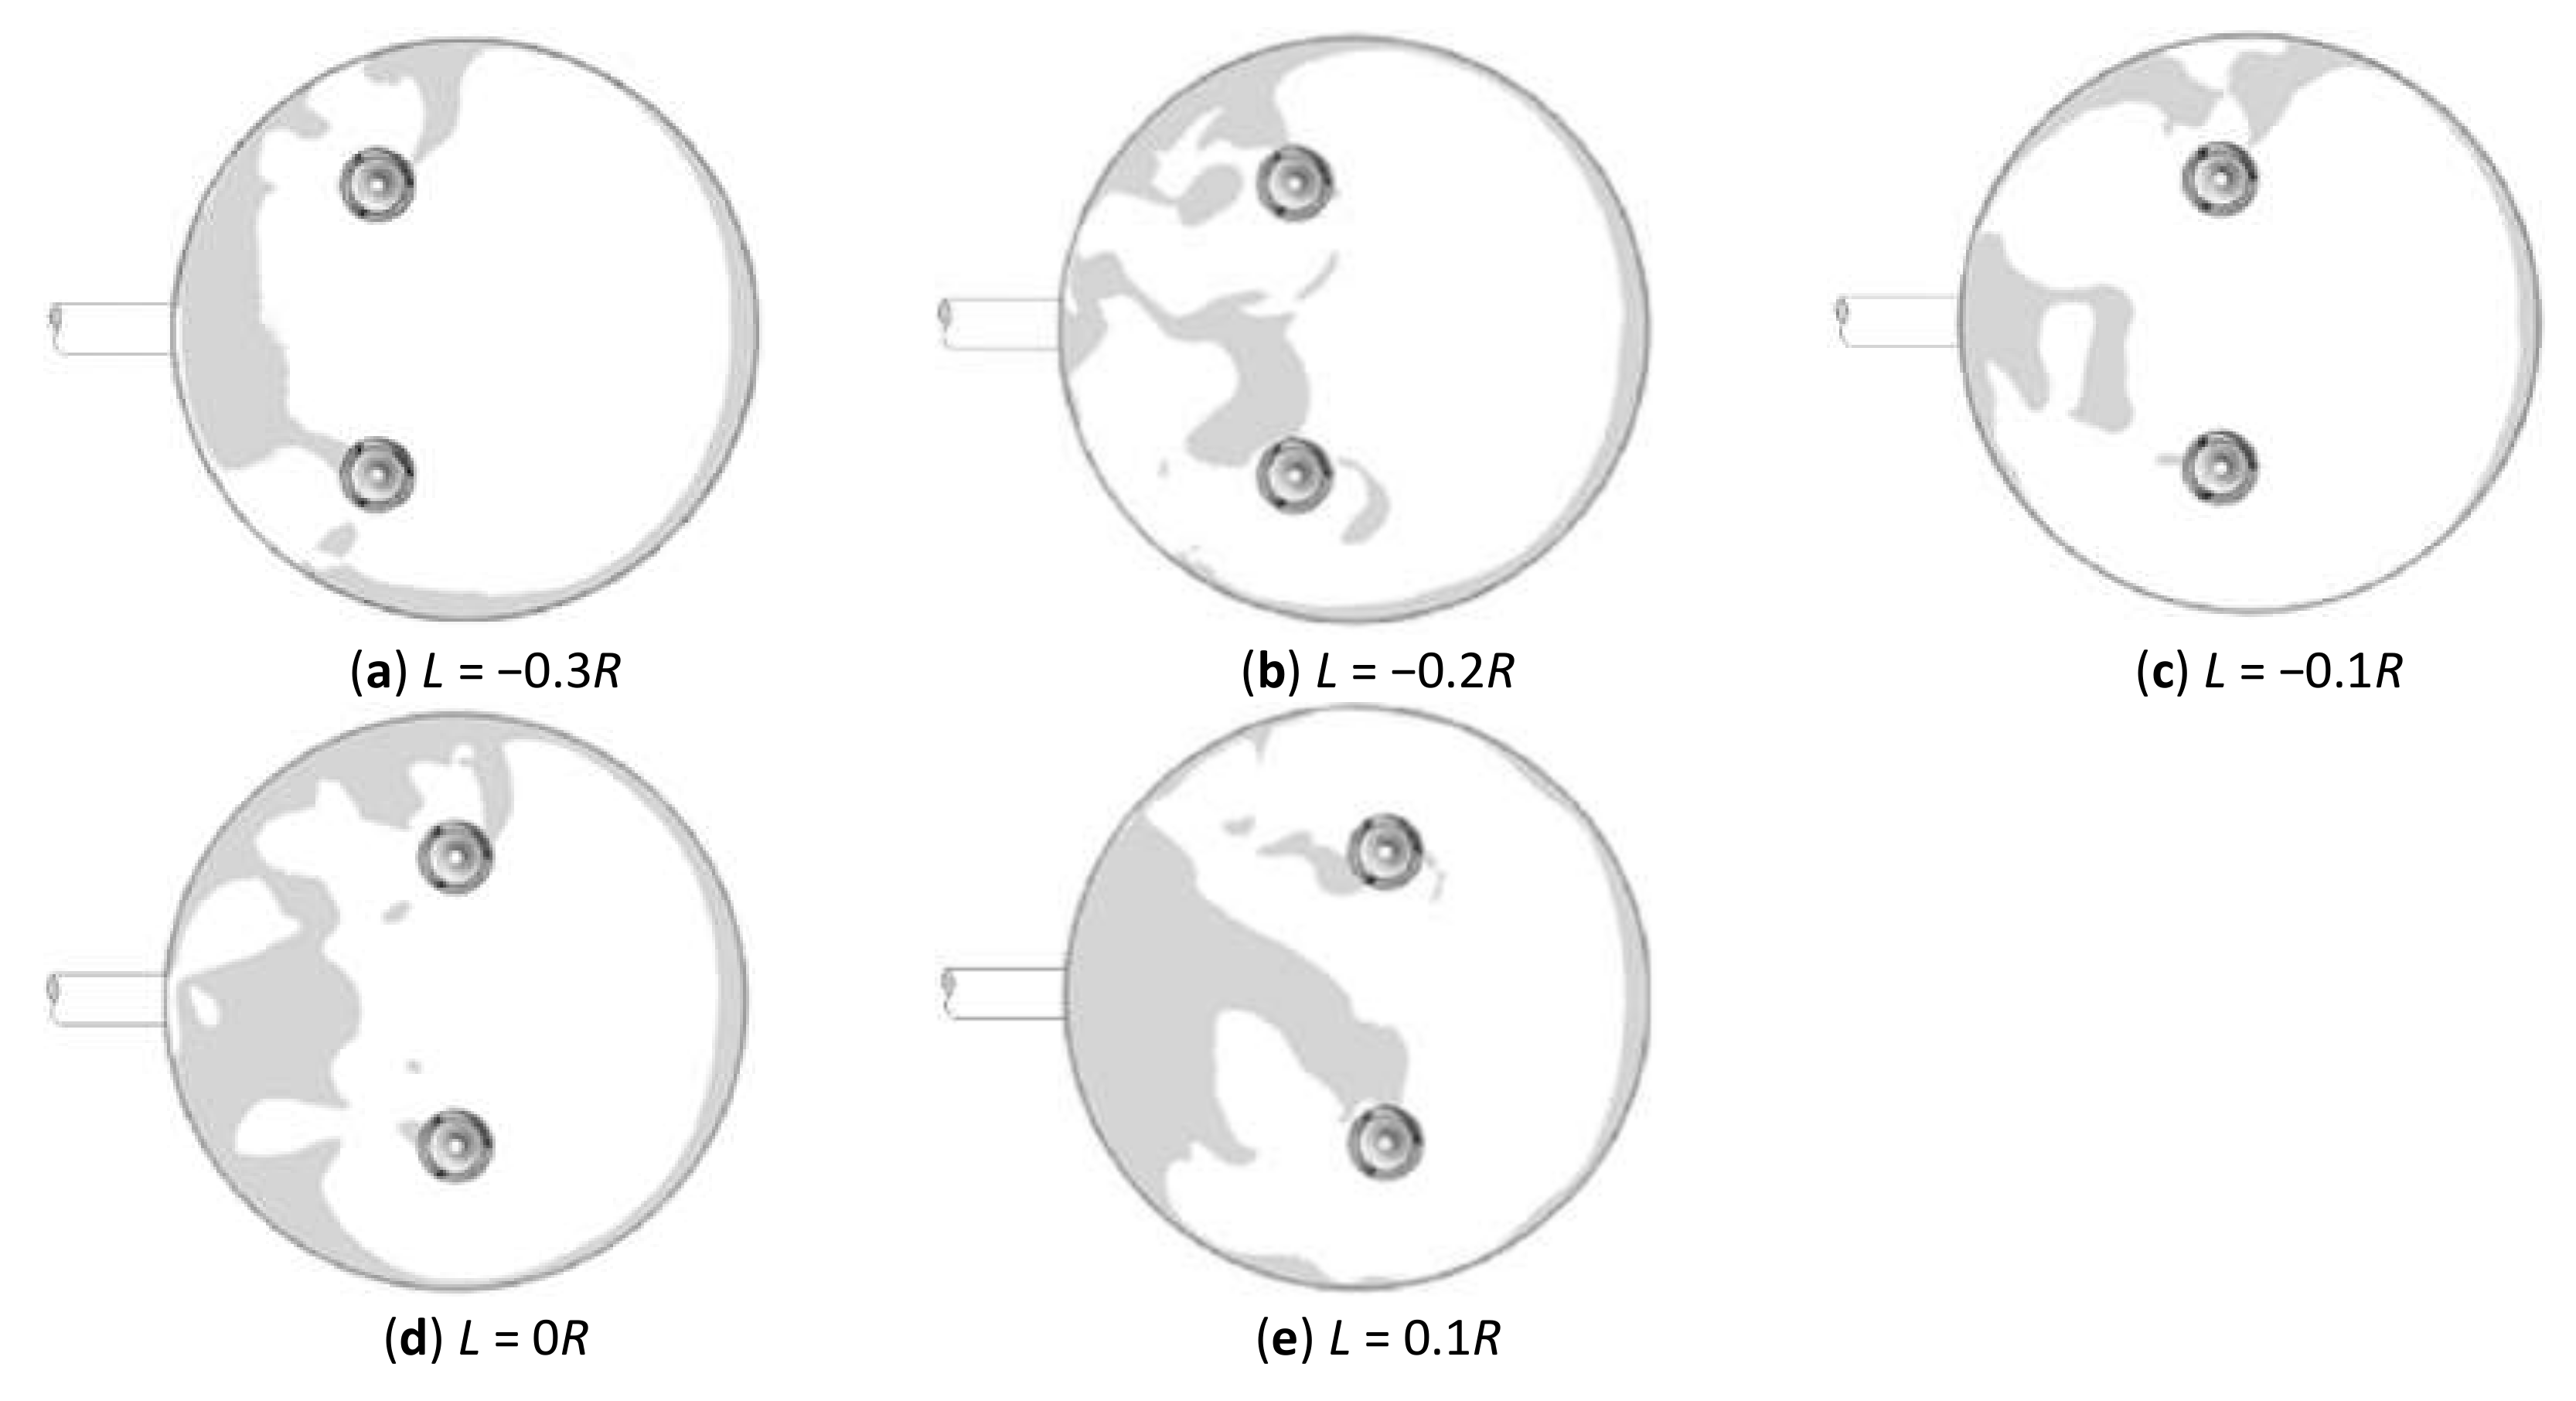
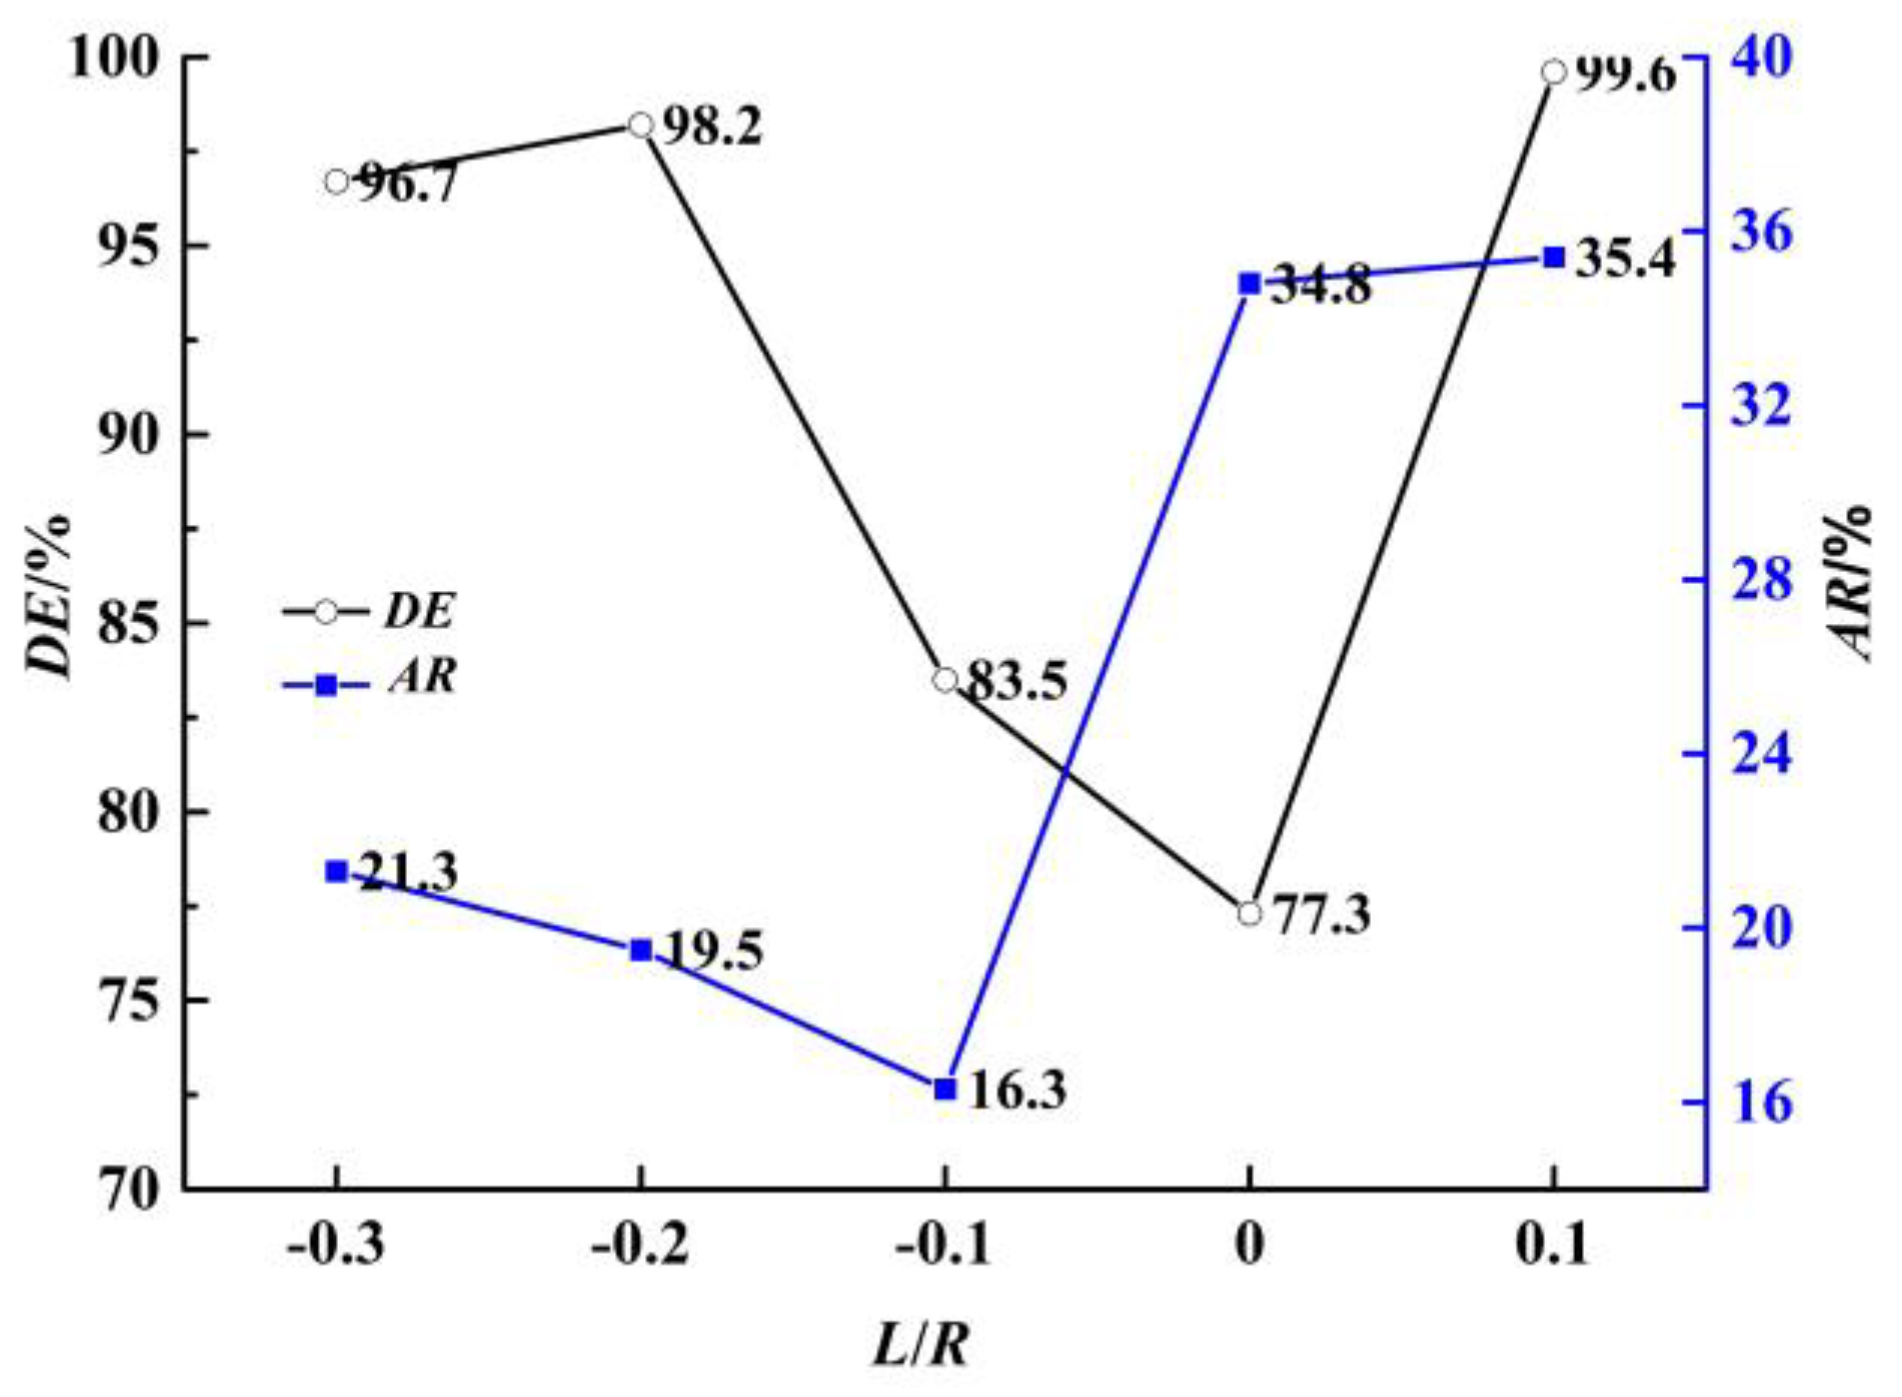
3.3. Influence of Center Distance on Deposition Performance

Figure 12 shows the movement trajectories of particles with different center distances. It can be seen that when the installation position of the pump deviates from the center of the pumps and is too close to one side of the inlet pipe or outlet pipe, the suction capacity of the submersible pump is not good. This is because when the submersible pump is too close to the outlet pipe side, the initial velocity of the particles passing through the submersible pump is too large and the inertia causes the movement of the particles to deviate from the streamline of the pump inlet. When the submersible pump is installed near the inlet pipe, the particles are almost stagnant when they move around the pump. The pump’s suction power is not enough to draw them into the flow channel, which also causes more particles to be deposited.
Figure 13 shows the easy deposition region under different center distances. Figure 14 shows the area ratio and deposition rate of the easy deposition region under different center distances. When the center distance is −0.2R, the area ratio and deposition rate of the easy deposition region are 19.53% and 98.2%, respectively. When the center distance is 0R, the area ratio and deposition rate of the easy deposition region are 34.8% and 77.3%, respectively. When the center distance is 0.1R, the area ratio and deposition rate of the easy deposition region increase to 35.4% and 99.6%, respectively. With the increase in center distance, the area ratio and deposition rate of the easy deposition region decrease first and then increase, and the area ratio and deposition rate of the easy deposition region reached the minimum at −0.1R and 0R, respectively.

4. Conclusions

This paper studied the influence of the installation position of submersible pumps on the deposition characteristics of a prefabricated pumping station, and proposed two performance indices, which are the deposition rate and area ratio of the easy deposition region. The main conclusions are as follows.
  • With the increase in suspension height, flow field distribution is affected, the number of particles escaping from the pipeline is obviously different, and the total number of particles passing through also decreases, whereas the area ratio and deposition rate of the easy deposition region increase. The sewage discharge effect is best when the suspension height is 0.1H0, but at this time the inlet bias of the pump is larger. So, when determining the suspension height of submersible pumps, it is necessary to balance the discharge effect and the inlet state.
  • With the increase in the interval of the pumps, the suction to the central region decreases, a large of particles escape from the pumps, and the number of absorbed particles gradually decreases, while the area ratio and deposition rate of the easy deposition region gradually increases.
  • With the increase in center distance, the suction capacity of the pump is affected. The area ratio and deposition rate of the easy deposition region decreases first and then increases. The area ratio and deposition rate of the easy deposition region reach the minimum at 0.1R and 0R, respectively.

Author Contributions

Conceptualization, H.L.; methodology, K.W.; software, H.B. and Z.Z.; validation, K.W.; formal analysis, Z.Z.; investigation, H.B. and J.H.; resources, K.W.; data curation, K.W.; writing—original draft preparation, H.B.; writing—review and editing, K.W.; visualization, Z.Z.; supervision, H.L.; project administration, H.L.; funding acquisition, H.L. and K.W. All authors have read and agreed to the published version of the manuscript.

Funding

This research was funded by the National Key Research and Development Program of China, grant number 2019YFC0312400 and 2019YFC0312403, the National Natural Science Foundation of China, grant number 51779108 and 51979124, the Key Research and Development Program of Zhenjiang of China, grant number GY2019026, and Key Laboratory Foundation of the Equipment Pre-research of China, grant number 6142204200306.

Conflicts of Interest

The authors declare no conflict of interest.

References

  1. Peng, S.B.; Chen, Q.K.; Zheng, C.; Liu, E.B. Analysis of Particle Deposition in a New-type Rectifying Plate System During Shale Gas Extraction. Energy Sci. Eng. 2019, 8, 702–717. [Google Scholar] [CrossRef] [Green Version]
  2. Jassim, E.; Abdi, M.A.; Muzychka, Y. A New Approach to Investigate Hydrate Deposition in Gas-dominated Flowlines. J. Nat. Gas Sci. Eng. 2010, 2, 163–177. [Google Scholar] [CrossRef]
  3. Xu, Z.M.; Sun, A.D.; Han, Z.M.; Yu, X.Y.; Zhang, Y. Simulation of Particle Deposition in a Plate-fin Heat Exchanger Using a Particle Deposition Model with a Random Function Method. Powder Technol. 2019, 355, 145–156. [Google Scholar] [CrossRef]
  4. Manuel, G.P.; Esa, V.; Timo, H. The Contribution of Differently-sized Ash Particles to the Fouling Trends of a Pilot-scale Coal-fired Combustor with an Ash deposition CFD Model. Fuel 2017, 189, 120–130. [Google Scholar]
  5. Ling, B.C.; Ju, H.Y.; Ye, Z. Study on Numerical Simulation of Secondary Dust Deposition Phenomenon. Appl. Mech. Mater. 2013, 423, 2957–2962. [Google Scholar] [CrossRef]
  6. Heydarabadi, H.; Abdolzadeh, M.; Lari, K. Simulation of Airflow and Particle Deposition Settled over a Tilted Photovoltaic Module. Energy 2017, 139, 1016–1029. [Google Scholar] [CrossRef]
  7. Li, Q.; Kang, C.; Teng, S.; Li, M.Y. Optimization of Tank Bottom Shape for Improving the Anti-Deposition Performance of a Prefabricated Pumping Station. Water 2019, 11, 602. [Google Scholar] [CrossRef] [Green Version]
  8. Kang, C.; Li, Q.; Li, M.Y.; Teng, S. Deposition of solid particles exposed to the suction of dual pumps in the tank of a pumping station. Powder Technol. 2020, 361, 727–738. [Google Scholar] [CrossRef]
  9. Ding, Y.; Li, T.C.; Liu, X.Q.; Guo, Y.; Zhou, M.Z. Model test research on effect of flow accelerating-board in a pumping station. Mater. Sci. Eng. 2017, 242, 012048. [Google Scholar] [CrossRef] [Green Version]
  10. Mi, Z.H.; Zhou, D.Q.; Mao, Y.T. Three-dimensional CFD simulation of inlet structure flow in pumping station based on Eulerian solid- liquid two-phase flow model. J. Drain. Irrig. Mach. Eng. 2015, 33, 494–498. [Google Scholar]
  11. Wang, K.; Hu, J.B.; Liu, H.L.; Zhang, Z.X.; Zou, L.; Lu, Z.G. Research on the Deposition Characteristics of Integrated Prefabricated Pumping Station. Symmetry 2020, 12, 760. [Google Scholar] [CrossRef]
  12. Tong, Q.L. Theoretical Basis of Two-Phase Flow; Metallurgical Industry Press: Beijing, China, 1982. [Google Scholar]
  13. Govier, G.W.; Aziz, K. The Flow of Complex Mixtures in Pipes, 2nd ed.; Society of Petroleum Engineers: Richardson, TX, USA, 2008. [Google Scholar]
Figure 1. Structure of the cylinder-type prefabricated pumping station.
Symmetry 12 01347 g001
Figure 2. 3D model of prefabricated pumping station [11].
Symmetry 12 01347 g002
Figure 3. Comparison of external characteristics curves in the submersible pump. (a)Head characteristic curve; (b) Efficiency characteristic curve.
Symmetry 12 01347 g003
Figure 4. Process of area identification of easy deposition region.
Symmetry 12 01347 g004
Figure 5. Installation position of two submersible pumps.
Symmetry 12 01347 g005
Figure 6. Movement trajectories of particles at different suspension heights.
Symmetry 12 01347 g006
Figure 7. Easy deposition region at different suspension heights.
Symmetry 12 01347 g007
Figure 8. Area ratio and deposition rate of the easy deposition region under different suspension heights.
Symmetry 12 01347 g008
Figure 9. Movement trajectories of particles under different pump intervals.
Symmetry 12 01347 g009
Figure 10. Easy deposition region under different pump intervals.
Symmetry 12 01347 g010
Figure 11. Area ratio and deposition rate of the easy deposition region under different pump intervals.
Symmetry 12 01347 g011
Figure 12. Movement trajectories of particles under different center distances.
Symmetry 12 01347 g012
Figure 13. Easy deposition region under different center distances.
Symmetry 12 01347 g013
Figure 14. Area ratio and deposition rate of easy deposition region under different center distances.
Symmetry 12 01347 g014
Table 1. Calculation schemes.
Suspension Height H10.1H00.15H00.2H00.25H00.3H0
Pumps interval S0.8R0.9R1R1.1R1.2R
Center distance L−0.3R−0.2R−0.1R0R0.1R

