1. Introduction
The field of modern analytics based on nano- and microelectronic devices, such as sensors and transformers of any type, leans on a solution complex, including analytical conversions, circuit engineering, and mathematical and program algorithms.
A primary transformer, as a rule, is the element that transforms the influence of the external environment into an electric signal that is related to the change of parameter or parameters of the external environment by the function where is the parameter of the environment influence, is the accompanying parameter of the external environment capable of having a significant impact on the change of parameter and is influence duration time.
The electronic circuit of connection and the hardware–software algorithm of functioning are necessary for the use of primary transformers of any type. The scheme of connection and an operation algorithm are defined by the physical principle, which is the basis of the chosen primary converter [
1,
2]. Gas-sensitive sensors can be classified by manufacturing techniques as measurements and by the principle of measurements. Also, primary converters–sensors should be divided by the organization of application: elementary and integrated, contact and contactless, analog and digital.
Ideally, dependence on
is linear. However, most of the time, the dependence can be nonlinear, locally linear, or pseudo-linear. It imposes conditions [
3] on a circuitry solution and an operation algorithm in the field of the transformer control, measurements reading, and processing.
The existence of «pure» vapors or gases in air is almost unreachable because of natural molecular variety. The molecular structure of ambient air forms molecules (substances), which, in turn, undergo physical and chemical transformations [
4,
5]. It means that the structure of ambient air can be considered as dynamically variable.
The relevance of intelligent device development for environment control and technogenic processes does not raise doubts. The «electronic nose» system belongs to devices of this kind. It is a multisensor system for recognizing a component of steam–gas mixes, with further identification and definition of quantitative indices.
In contrast to the traditional sensor systems demanding high-selection detectors, the «electronic nose» may contain a set of low-selection sensors and lean on developed modern computers and methods of multiple-parameter information processing [
3].
The most optimal tools for implementing analytical systems like the “electronic nose” are semiconductor sensors that are manufactured by methods of nano- and microelectronic technologies. The most preferable semiconductor sensors are metal-oxide sensors [
6], the operation principle [
7] of which is based on conductivity change of broadband tin oxides, zinc, titanium, tungsten, indium, and other alloys that have catalytic properties.
It should be noted that the semiconductor sensors manufactured on the basis of tin dioxide (SnO
2) alloyed by electromanaging and catalytic impurity fully meet the requirements of modern gas analysis [
8]. The gas analysis system that is constructed on the basis of semiconductor sensors and the microprocessor equipment replaces, in many cases, difficult analytical equipment such as chromatographs, IR spectrometers, mass-spectrometers, chromass-spectrometers, and other expensive devices demanding highly skilled service [
9].
Devices like the «electronic nose», intended for the detection of toxic gases and other impurities, are considered a current perspective [
10]. According to the definition, an «electronic nose» is a device for distinguishing a smell from an image, by which it is possible to define the material structure of the environment [
11]. In other words, an «electronic nose» is the system that allows us to define from an integrated sign, the composition of the impurities that are contained in the air [
12].
On the basis of «an electronic nose» multisensor system, it is possible to combine a set of selective/nonselective sensors with high cross-sensitivity that are «trained» to recognize images of the analyzed mix of vapors and gases [
13,
14].
The structure of a multisensor system plays an important role. The optimal grouping of systems of sensors, each of which has various sensitivities to the analyzed substances and has the specific profile of responses, is almost impossible because sensors of any type will have notable cross-selectivity that demands the application of multiple-parameter information processing in real-time.
One of the main advantages of a multisensor system in modern gas analysis devices is the possibility of using it for the complex analysis of the majority of the volatile components that create an integrated smell and presenting it in the form of characteristic “images” that mean the functionality or the system of the functions, which are unambiguously determined by the results of measurements of the studied environment.
A correctly created multisensor system allows us to solve problems of quantitative and qualitative analysis of multicomponent gas mixtures and to carry out the analysis of the volatiles that create different smells. Thus, the relevance and justification of the application of such a system for analytical control of complex multicomponent mixtures in which the assessment is still being carried out organoleptically, causing ambiguous interpretation and disputable situations, does not raise doubts.
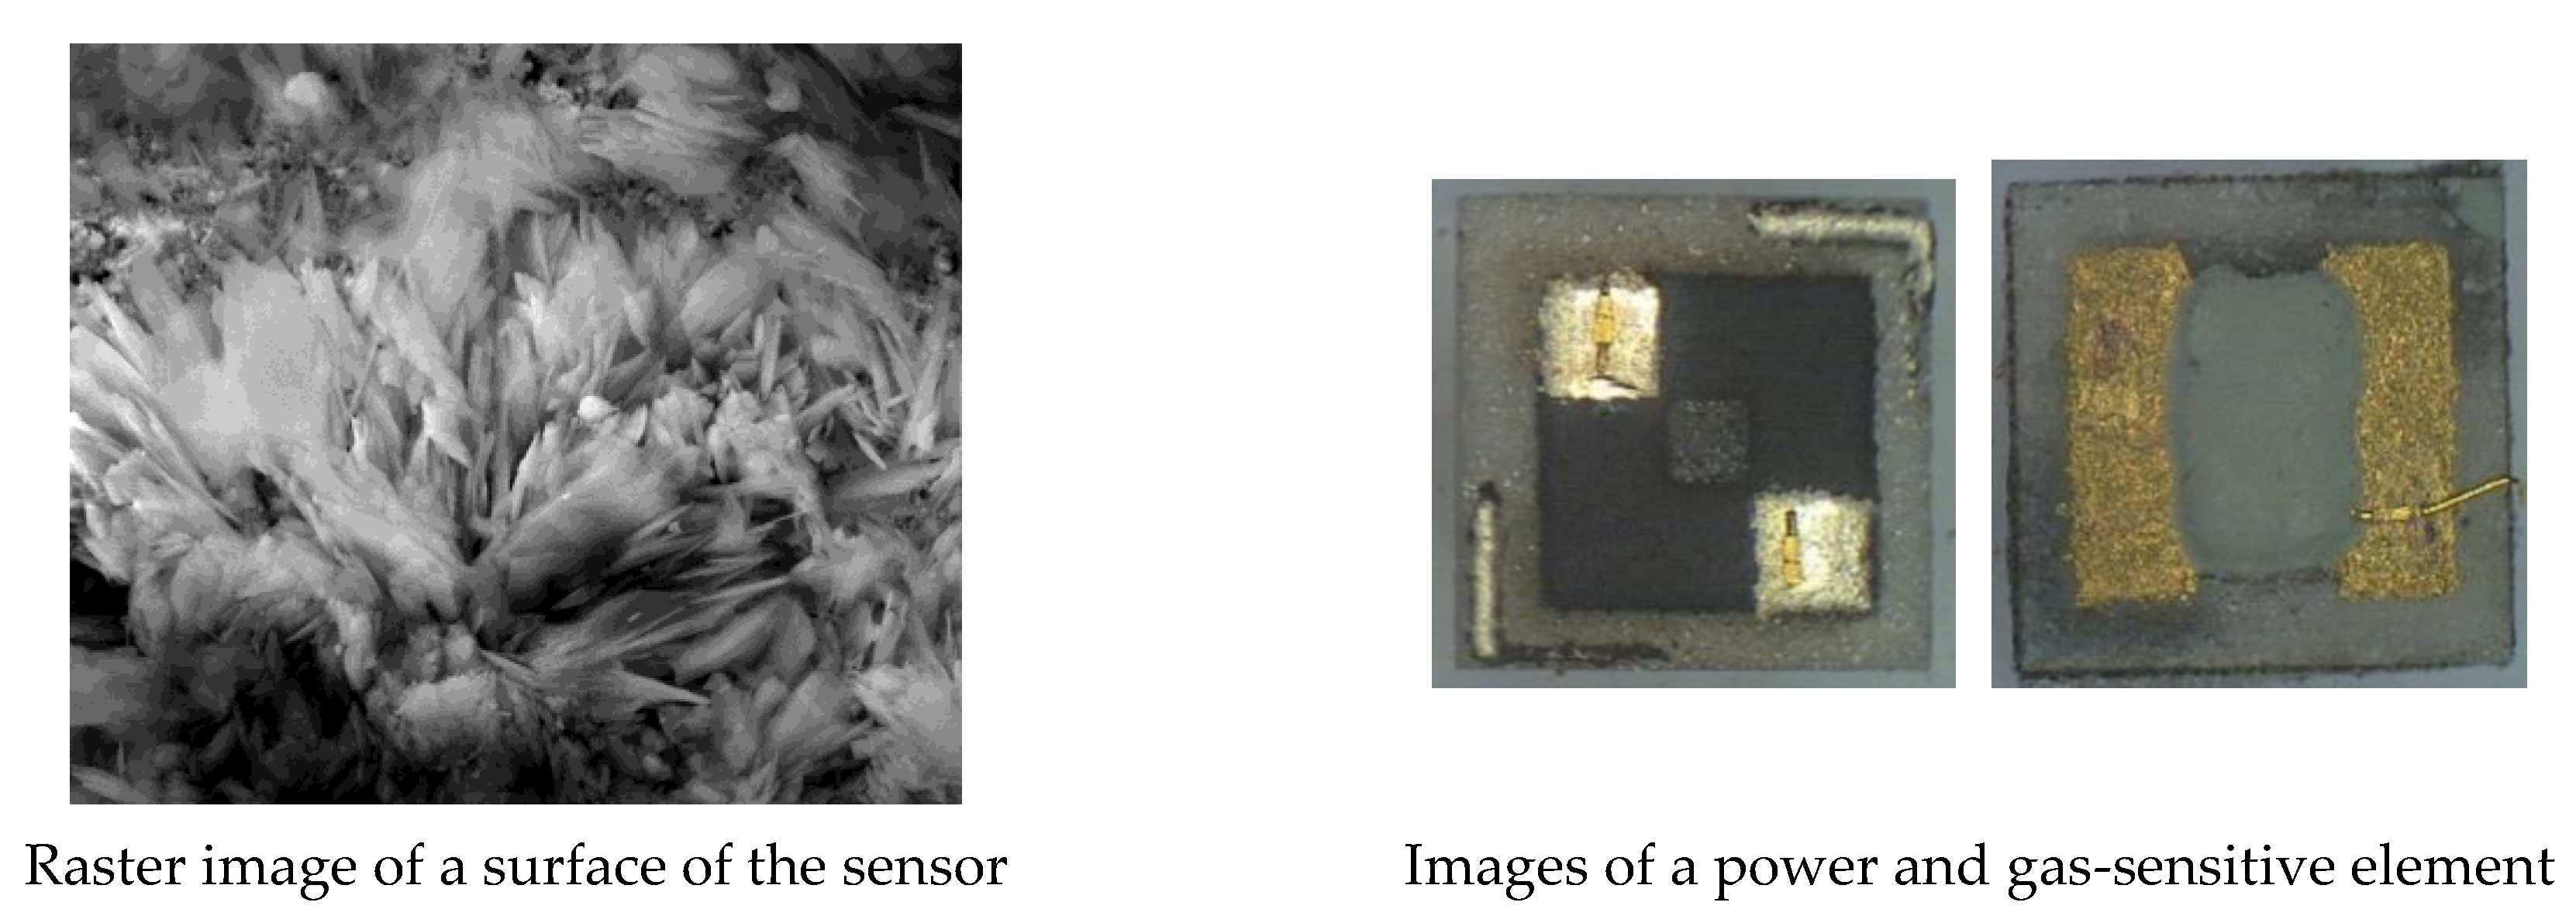
The technology of synthesis and production of semiconductor sensors allows us to receive the sensors and detectors, with stable electrophysical and analytical characteristics, making a case for devices like the «electronic nose».
Today, more than 30 structures with high gas-sensitivity that are the basis for forming the matrix (assembly) of primary transformers (
Figure 1) are synthesized and checked.
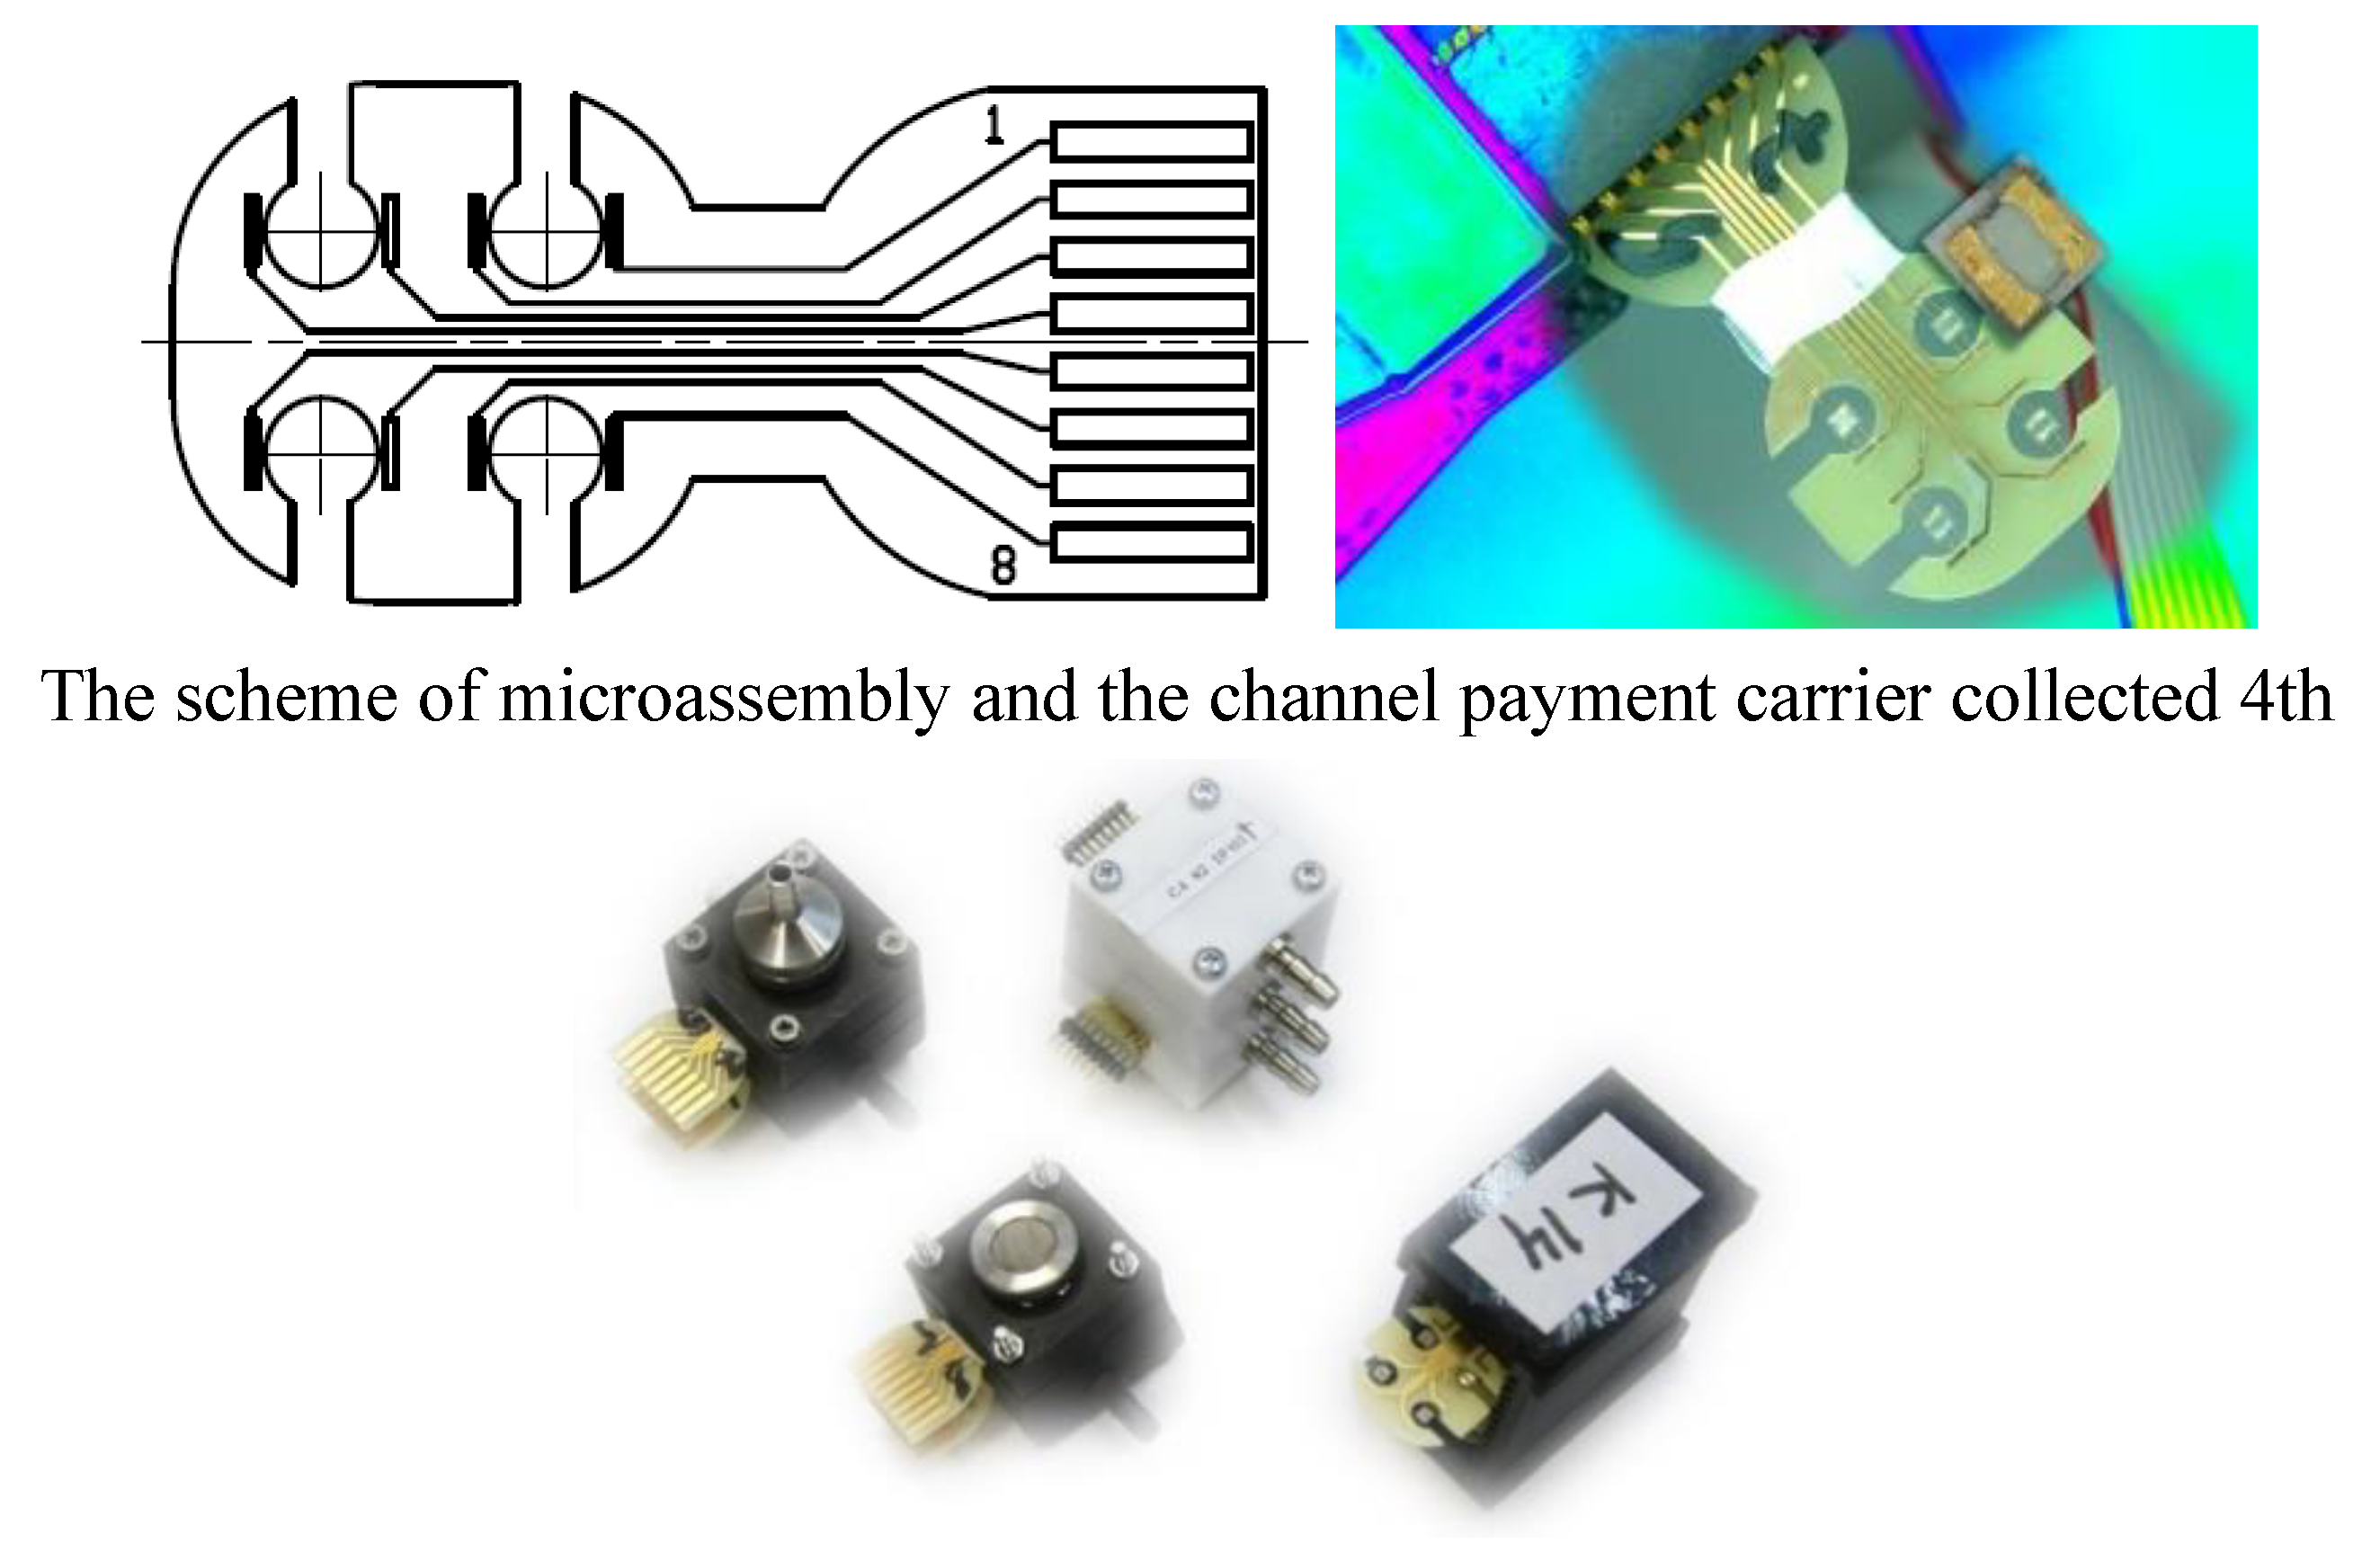
Multisensor system designs and their placement variants are given in
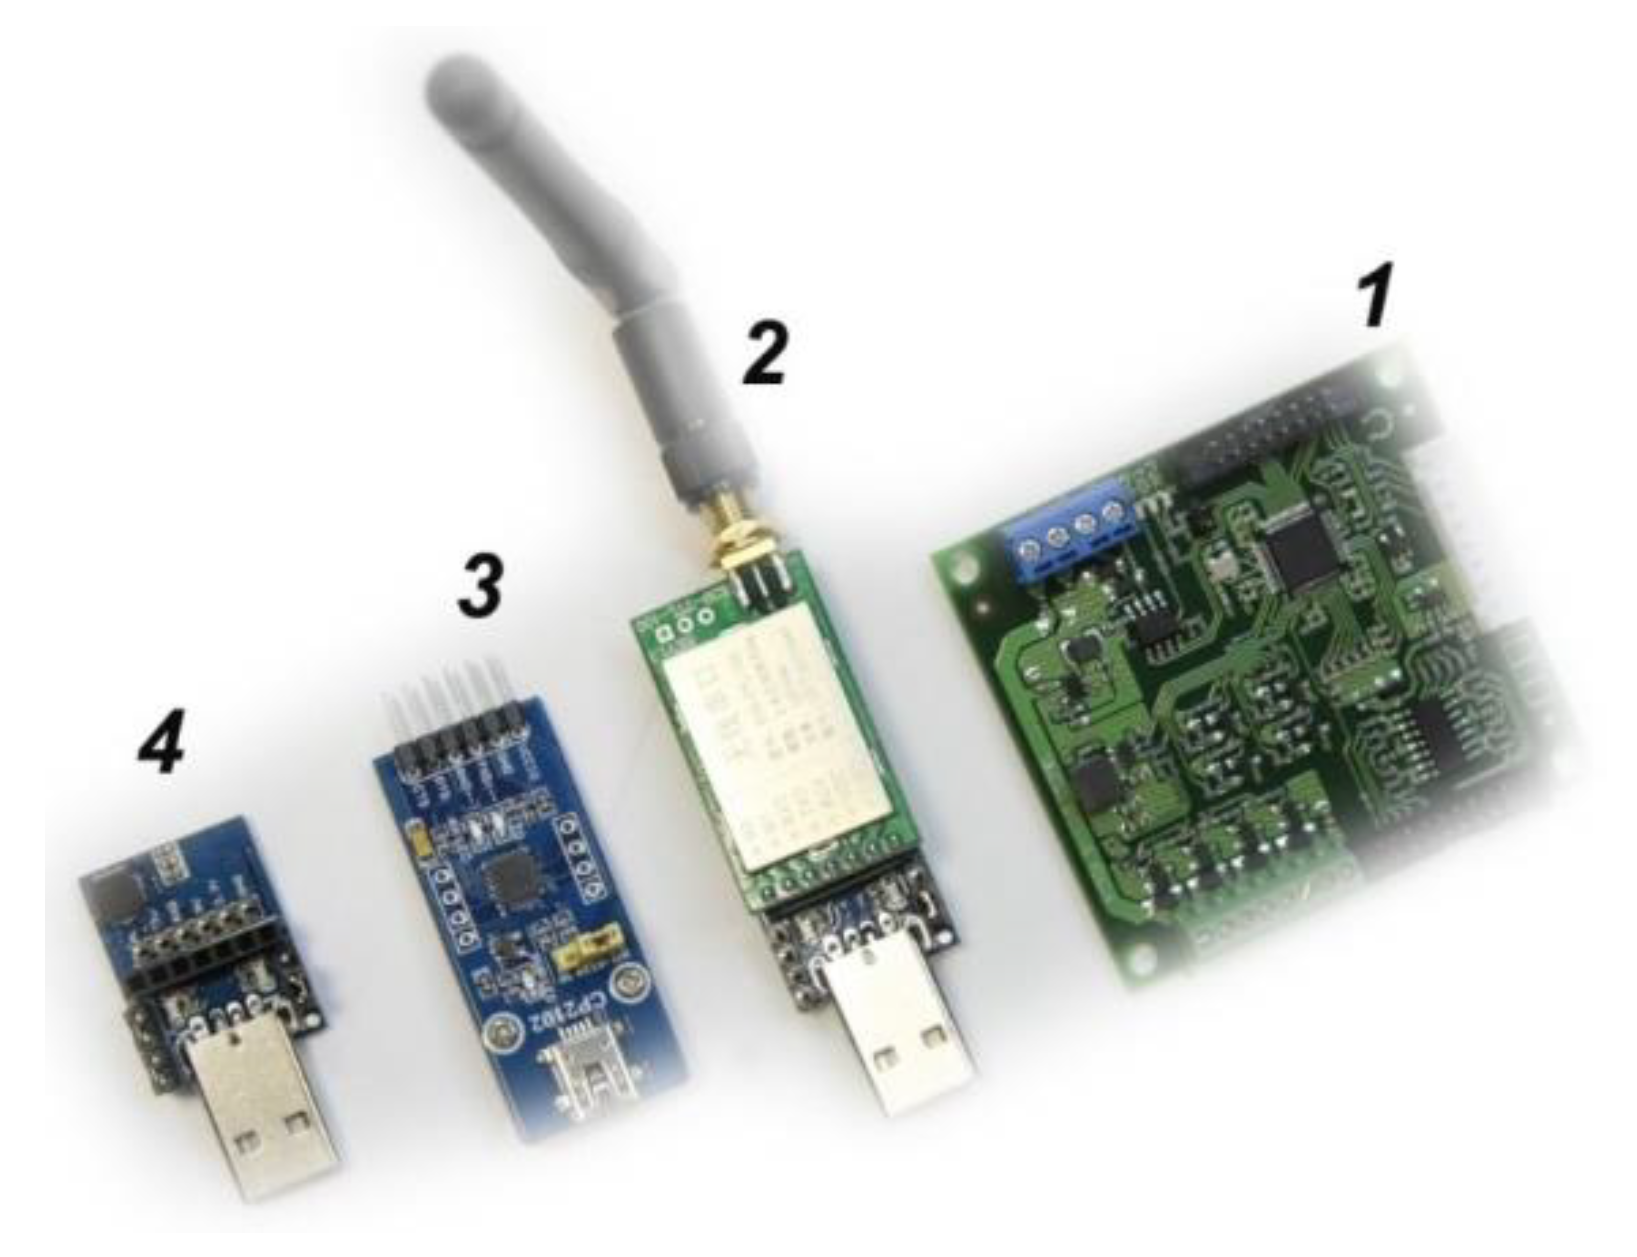
Figure 2. The circuit and algorithmic solution (
Figure 3) allow us to develop the gas analysis system, the closest to the implementation of electronic and analytical devices.
The device working principle consists of measurement of the electrical conductivity of sensors in their interaction with vapors of volatile matters. As a result of the adsorption of molecules of the studied substance, the electrical conductivity of the sensing materials of sensors either increases or decreases, depending on the properties of the studied vapors or gases. If the substance has oxidizing properties, then the electrical conductivity decreases (electrical resistance increases). In the case of a substance-reducer, the electrical conductivity grows, and resistance naturally goes down [
2].
However, gas-sensing semiconductor sensors, as well as any other, are not strictly selected. Therefore, special data processing is required for the sensor set that allows the creation of a unique image of the analyzed substance.
A touch array containing 8 to 128 elements (or more) under microprocessor control was created. This array allows us to form and realize the conditions of measurement and to carry out the necessary processing of analysis results [
2].
During serial pumping of vapors of various substances through a multisensor system, a library of responses is formed. Then, the library is stored in the memory of a computing mechanism. The detection is carried out by the comparison of a response of the analyzed substance with the responses of the images which are already available in the library. In case of compliance with a response or their combination, the system will recognize a smell.
2. Materials and Methods
Direct and indirect measurements of parameters or indexes of the studied environment are accompanied by fluctuations caused by the statistical nature of analytical signal formation and distortions connected with hardware noise.
For example, a change of electrical conductivity of a gas-sensing layer of semiconductor sensors has an accidental character and models Brownian motion.
Recording the change of a signal in each instant, with an interval (—the frequency of measurements), a random function is formed, depending on cathode rays generated by the reactions, caused by chemosorption and reactions in the near-surface area of a sensing layer.
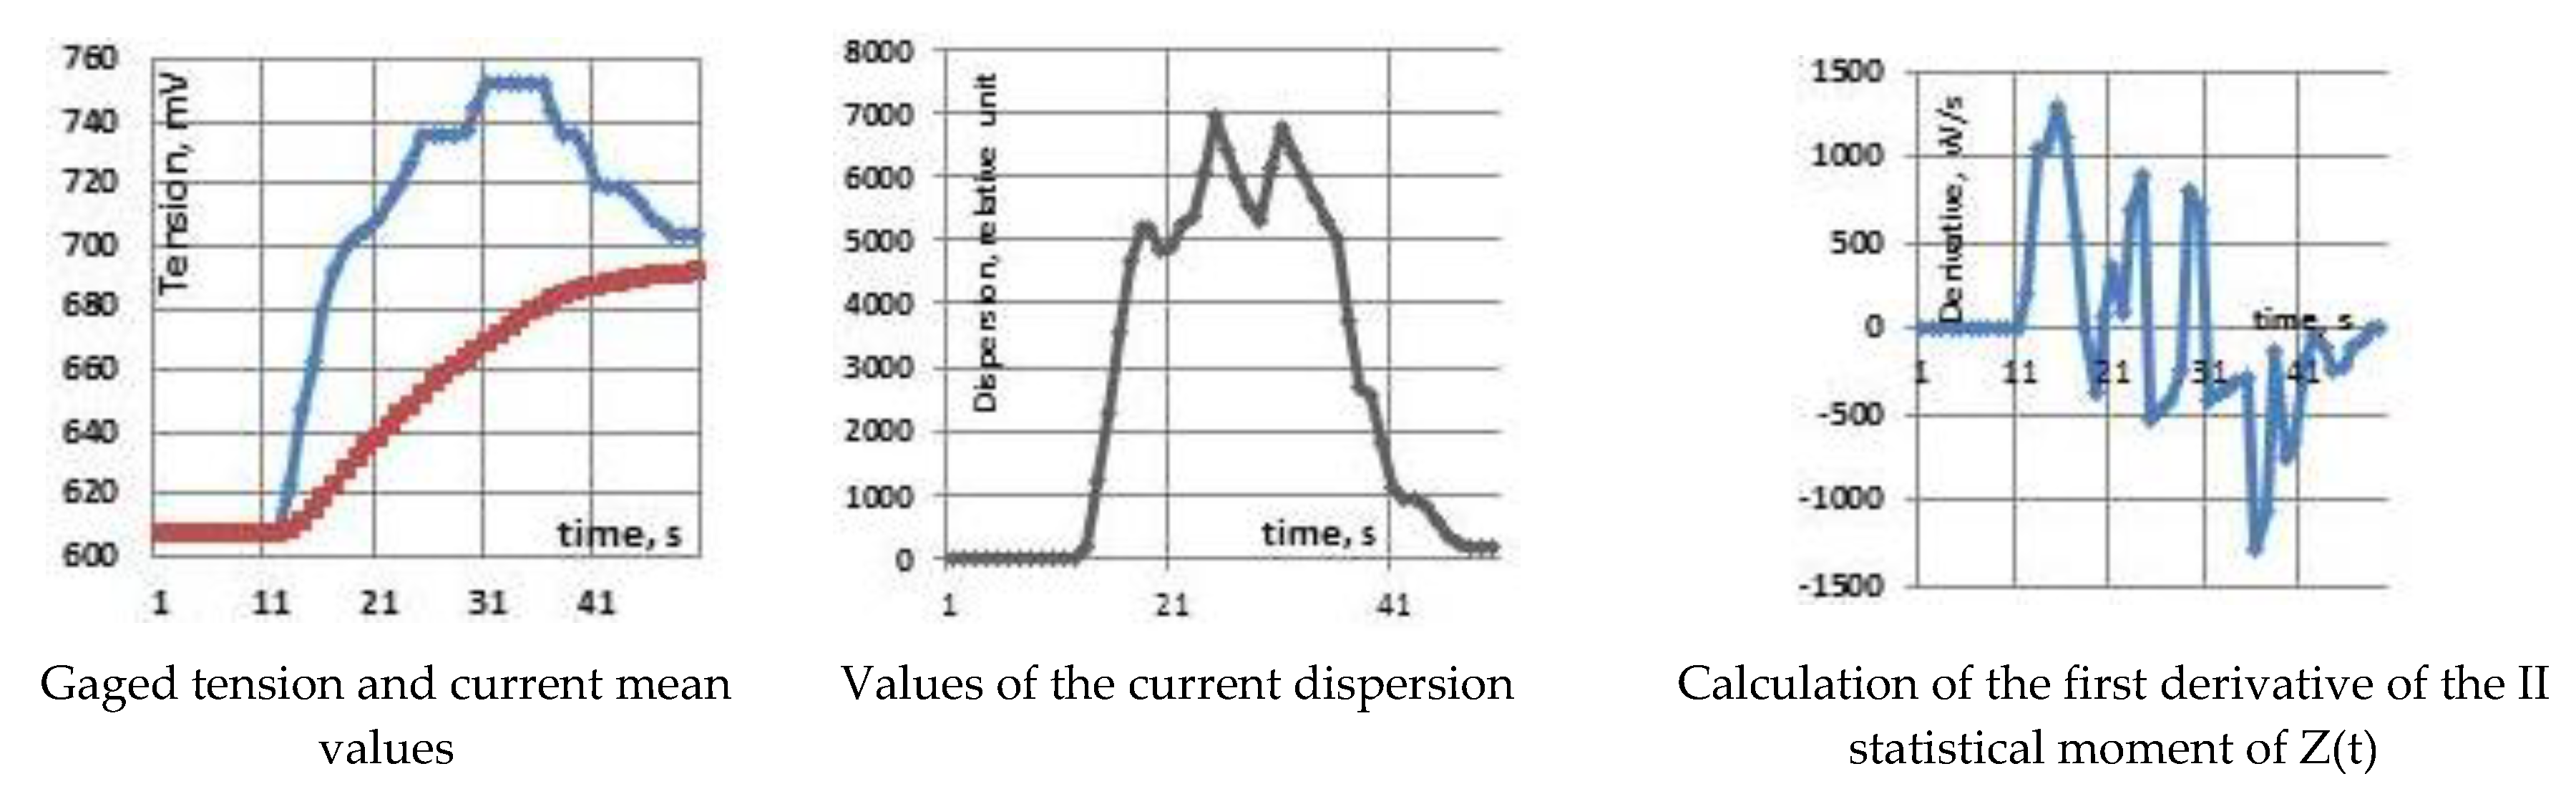
As a rule, a measurand for an analytical multisensor system is a tension that corresponds to each measuring channel , where i is the channel number .
Since the initial signal is distorted by fluctuations of the studied environment and hardware noise, it is necessary to process gaged tension in the way that reduces foreign influence without distorting observed data as much as possible.
To decrease the influence of hardware noise, the procedure of smoothing that is carried out on the scale of real-time allows us to reduce the influence of an electronic circuit as much as possible, and, in some cases, to eliminate it. The algorithm of exponential smoothing in real-time,
, with a coefficient of smoothing,
, provides minimum distortion of an entrance signal [
4].
To decrease the impact of fluctuations, it is necessary to calculate the statistical moments of the first and second order for each present situation of time. The first statistical moment corresponds to mean value to the set of gaged values and pays off in each instant:
where
t is the current time,
T is the total time of measurements,
.
The second statistical moment corresponding to dispersion of measurands, as well as the first moment, pays off in each instant:
The calculated values of the current mean values and the complete dispersion (the first and second statistical moments) uniquely determinate Gaussian distribution for each value of the measured tension by formula
, or taking into account expressions for I and II moments, we have the following:
Thus, the first statistical moment shows the direction of the interaction process for the sensor with the studied substance; the second statistical moment defines the dynamics of the interaction process. Calculation results of the initial statistical moments for the measured tension are given in
Figure 4.
The advantage of statistical transformations is obvious since the problem taking place for any indirect measurements is solved: stability of «zero» line increase in the regularity of measurements.
The current mean value of tension and dispersion uniquely determinates a normal distribution in each point of measurement and if , where ε and δ are infinitesimal sizes than .
The carried out primary transformations provide stability of an initial analytical signal, which, as much as possible, smoothes insignificant fluctuations of molecules of the defined substance and practically eliminates the influence of hardware noise, thereby increasing stability of «the zero line»—background measurements [
9].
The analytical system, formed of n sensors working independently, considerably expands possibilities of detection and identification of a wide list of substances but also imposes a number of conditions on placements of sensors that, in turn, affect design features and structure of an algorithm of calculations.
It is apparent that the application of a multisensor system considerably increases the selectivity of the detection of substances in the air. There are the following statistical transformations: «Normal», «Low Dangerous», and «Dangerous». The first two transformations allow us to receive such types of signals that reduce an error, both in the course of substance identification and in the quantitative calculations necessary for the definition of concentration and threshold values [
15].
The autonomy of a multisensor system is defined by the independent operation of channels. The basis of this operation is the linear combination of the functions describing the interaction of a substance of a gas phase with gas-sensing layers of sensors. That is, if
is dependent on the transformed initial signal
from the time of measurement of a single-component mix, then for the functions forming basis, the following ratios are carried out:
where
i,
j are numbers of analytical channels,
p is the given power of heating in each channel. It is apparent that if Ratio (4) is other than zero, then the channels are dependent, and it is necessary to change the heating power for one of the sensors. Equation (4) is a criterion of heating power specification for multisensor system autonomy achievement.
For a multicomponent mixture, the linear combination will take the form
where
i is the number of the analytical channel,
k is the number (symbol) of substance,
p is the index of the rated capacity of heating for channel
i.
Fixing the power of heating by index
p for each channel
i, a function for substance
k, capacities of heating of
p for sensor
i will be defined by the expression
For substances k, capacities of heating p, and analytical channels i, Expression (7) represents the tensor identifying the impurity that is a part of the analyzed air.
Tensor (4) creation requires measurements that are rather a long procedure. For example, for eight given capacities of heating and for the 4th component mixture, 64 measurements, 32 of which fall into the single-component mixture, are required.
To optimize this task, it is necessary to define a heating power vector at which the transformed analytical signal has the maximum affinity of sensors (conditions of measurements) with a defined substance. At the same time, the number of defined substances should not exceed the number of analytical channels. In this case, the set of equations, of which the left-hand part contains the measurement values of the single-component mixture, will take the form
where
is the transformed signal at measurements of a multicomponent mixture,
is the transformed signal received from the component blending by
; there are components of an identification vector of substance
k. Since the quantity of the equations is defined by the number of analytical channels, the quantity at the same time found for substances for multicomponent mixtures is limited. In a matrix form, Equation (8) can be written down as
, where
.
The solution of System (8) is carried out by the Cramer rule because the existence of a result is determined by the value of the main determinant.
If , then, System (8) has no solution. Then, it is necessary to choose heating capacities (or a type of sensors that is defined by catalytic impurity) so that . The other way is to reduce the number of defined substances, changing a grade of a matrix (Z) to an order at which the main determinant of a system is other than zero.
To identify complex (group) signs of environment states, it is enough to take measurements of the reference mixture, composed of estimated components, for drawing up a reference vector of
. For this purpose, it is enough to optimize a vector of capacities of heating at which
, calculated by Equation (7), does not exceed zero at a size
for each measurement. Then, on measurements of the studied environment, it is required to create a matrix
and solve a secular equation for the definition of eigenvalues
where
is a unit matrix (a reference vector of
),
is the eigenvalues. Eigenvalues correspond to latent vectors of a matrix
, which make sense, as well as in Equation (8). However, it is possible that eigenvalues
correspond to a matrix. It means that the multisensor system, at the given heating capacities or the sensors chosen as analytical channels, is not specific to the substances that are contained in the studied environment. In this case, it is necessary to change a vector of heating capacities or type of sensors to remove degeneration and to receive the necessary solution of
.
This approach allows us to carry out both group and individual identification of components of circles of the complex structure.
Let it be noted that the identification of the structure of the studied environment without carrying out primary transformations is impossible because of the strong fluctuations, the characteristics of air environments, and the hardware noise inherent in electronic components [
5].
Model estimates of gas-sensing devices’ electrical conductivity change at substance chemosorption from a gas phase can be given more qualitatively than the quantitative assessment to indexes of the studied environment. Therefore, model creation based on real measurements with the application of dynamic equations of behavior description during the interaction time of the sensor with a substance of a gas phase is relevant.
The analytical signal of the sensor at a chemosorption of molecules on its surface is formed by elementary acts for which the following condition is satisfied:, where —a wave function of the elementary act of interaction of a molecule with a surface, s—the section of interaction, n—concentration of the active sites, —the limiting value of interaction energy. An integration is conducted on the surface occupied by the active sites.
Since a large number of particles participate in the process of electrical conductivity change, the signal
is distributed normally or close to a normal distribution [
10]. In this case, the complete dispersion of a signal
on an interval
pays off as
for any
values in an interval.
The calculated dispersion depends only on the difference of and depends poorly on the amplitude of a signal of . For dispersion and a standard deviation of increments, equality is fair at , .
At increment change, the standard deviation fluctuates, concerning
D slightly:
. In this case, the ratio is fair:
Respectively, the increment of a signal has the property of statistical self-similarity:
The self-similarity of a signal allows us to calculate the dimension of phase (fractal) coordinates of observed data on an interval .
The conducted research from positions of the theory of dynamic chaos allows us to determine several physical consistent patterns connecting statistical and fractal characteristics of the environment with the recording system. One of the strengths of nonlinear and dynamic description methods is the possibility of prediction of system properties [
11].
The example of a target substance with various structure measurements shows the effectiveness of nonlinear dynamics method application for forming a unique image and identification of substances in multicomponent mixtures.
For this purpose, it is required to calculate the parameters necessary for the creation of a system attractor to estimate the main spatial and dynamic fractal system performance—«the studied environment of the sensor».
The mathematical basis for the procedure of attractor creation, the elements of which are phase trajectories, is Takens’ [
16] theorem, based on operations of sets investment.
By Takens, it is proved that for almost all smooth dynamic systems on the available temporary realization of one observed dynamic variable, it is possible to design a new attractor, the main properties of which will be identical to an initial phase trajectory.
For calculation of statistical averages such as dimension, entropy, and other characteristics of an attractor, it is necessary to have an
n-points set, defined in a phase space of dimension and belonging to an attractor. The number of points
M in calculations is terminating, but it is obliged to be rather larger
, where
D—dimension of an attractor [
16].
Information about the time behavior of any of the dynamic variables is necessary to calculate the characteristic of the attraction of a real dynamic system, the mathematical model, and the dimension of the phase where space is unknown. In addition, the time slice of the experimental realization is limited to the measurement time.
In typical cases, dimensions have the same sizes, which is the fractal dimension of an attractor. This dimension is calculated for any attractor in an
n-dimensional space according to the Kolmogorov–Hausdorf rule [
17]:
where
is the minimum number,
n is measured volumes with an edge ε, necessary for an attractor covering. For real systems, the dimension
can be fractional.
In the case of experimental data, the dimension of a phase space of a system is, as a rule, unknown. Therefore, the Takens method is used for the restitution of an attractor. At the same time, the correlation dimension of an attractor of at first increases but then reaches a fixed level . If the output signal of a dynamic system is strongly noisy, then the dimension of an attractor constantly grows. Therefore, the application of primary transformations (1) and (2) is necessary.
The correlation dimension of
is bound to the dimension of a phase space
as follows:
where
n is the dimension of a phase space (dimension of an investment),
—the rated range, σ—the noise level (standard deviation),
—an error integral.
The important corollary of this analytical result is that even at , the correlation dimension considerably increases with the body height of the dimension of an investment.
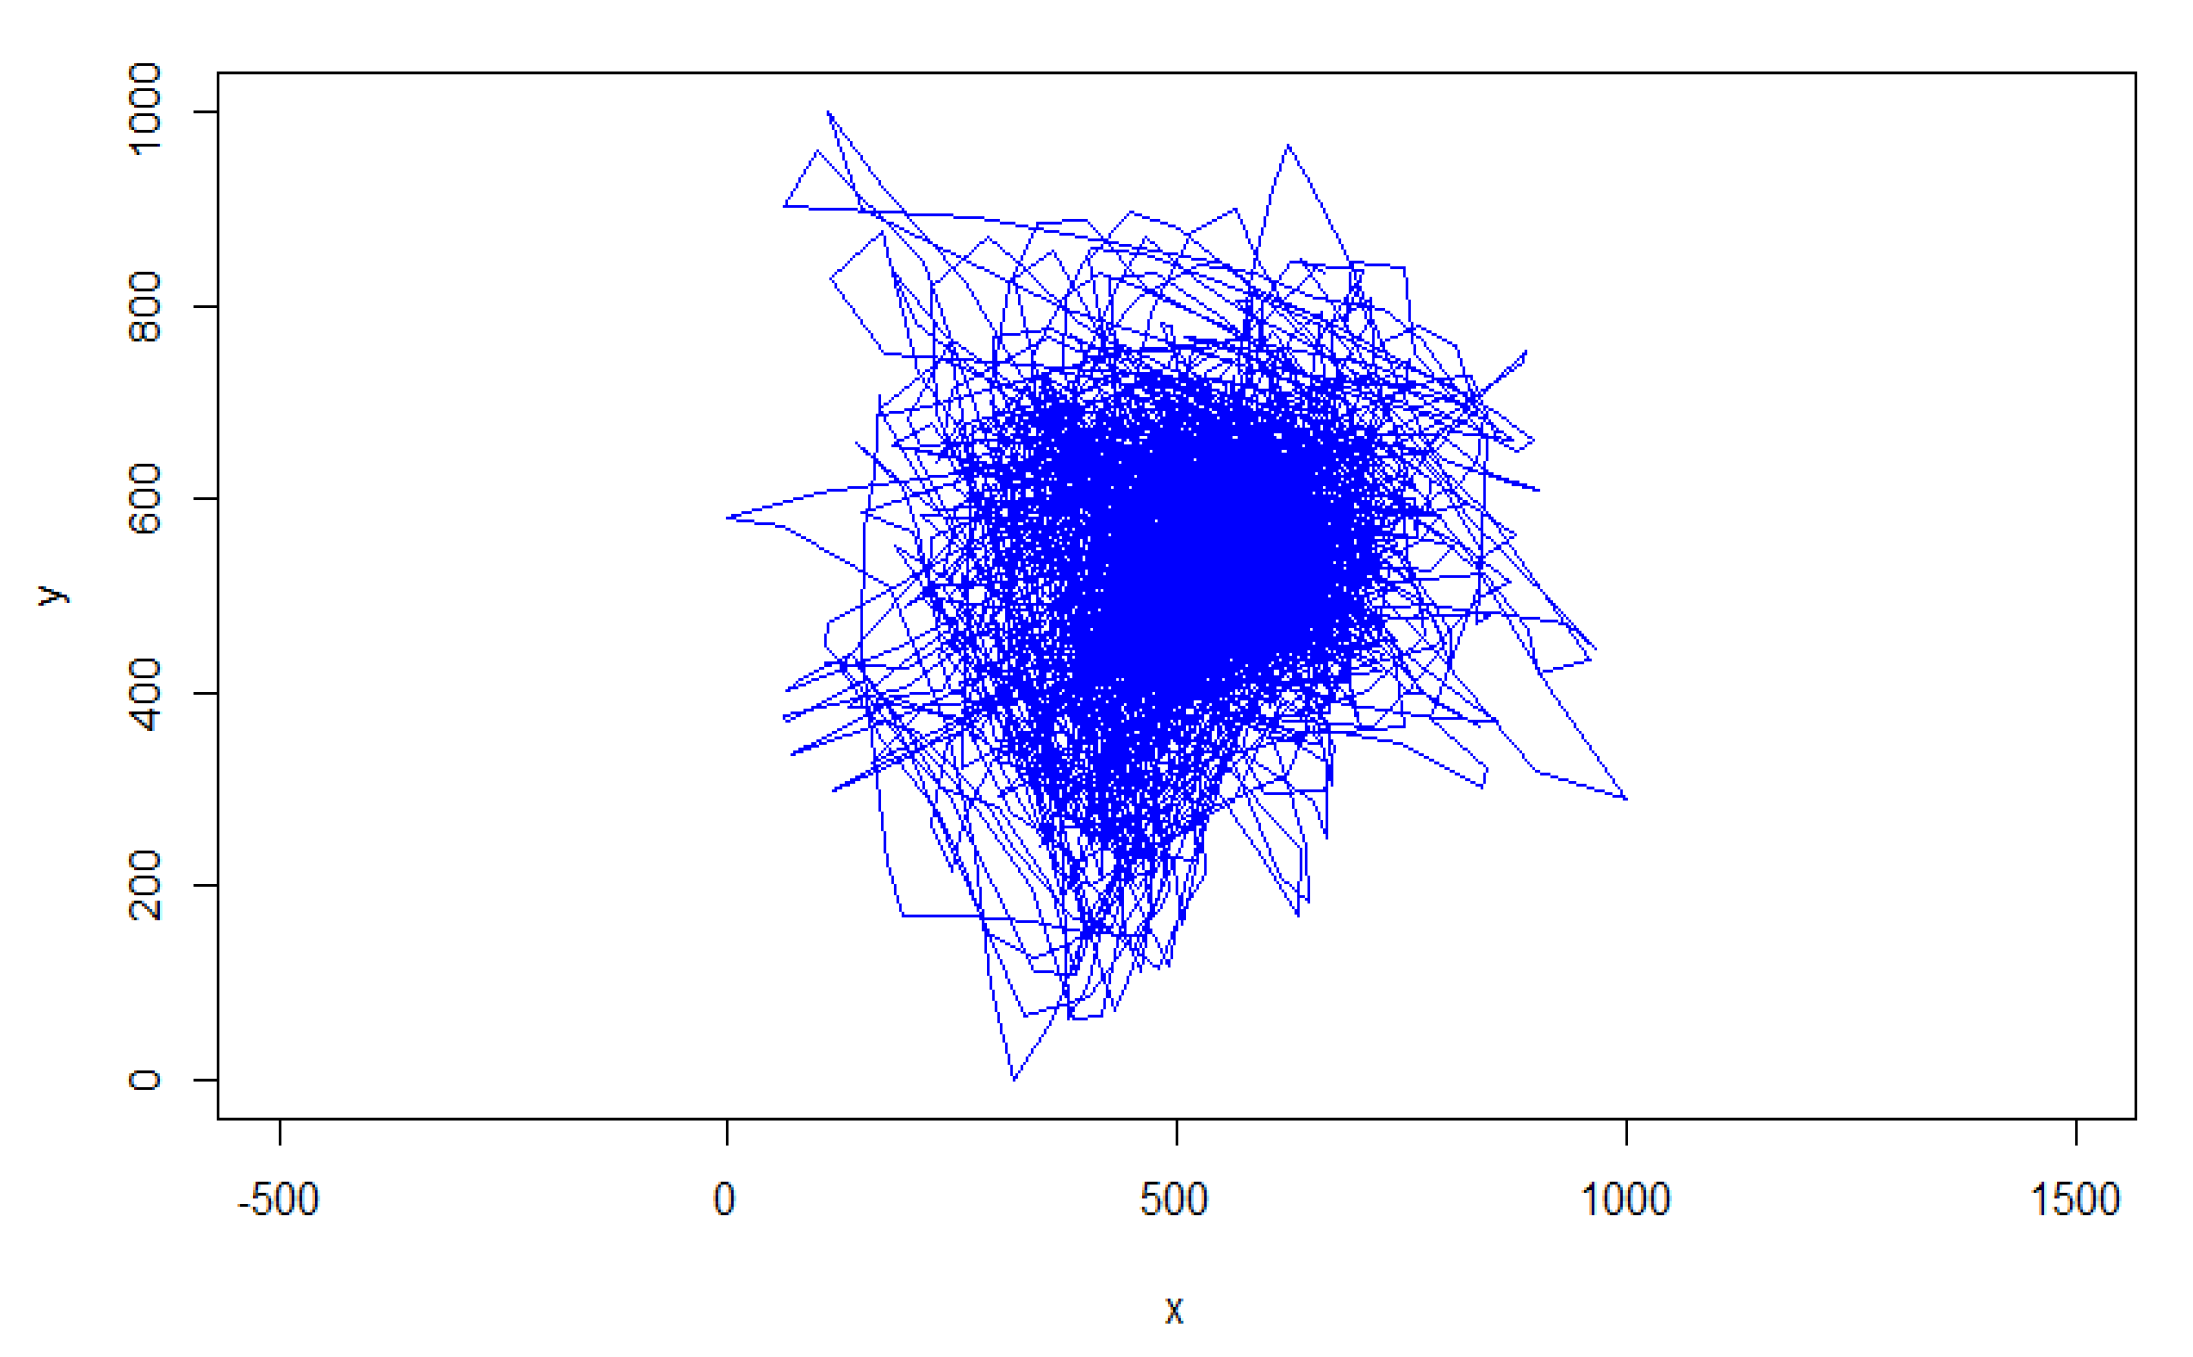
If the behavior of a system is completely stochastic, the phase trajectory evenly fills some volume of a phase space. In this case, the attractor is presented by an indistinct «point»—a chaotic state (
Figure 5).
If it is a determined or dynamically chaotic process, a trajectory will take the form of some figure in multidimensional space (see
Figure 5) relevant to dynamic structure.
It is necessary to remember that the analysis of a phase space allows us to reveal visual features only in the case of obviously expressed distinctions [
18] that reduce informational content. Similar values in correlative and phase dimensions indicate the invariant nature generating a signal. In this case, it is a reaction of substance interaction with the surface of sensor gas-sensing material.
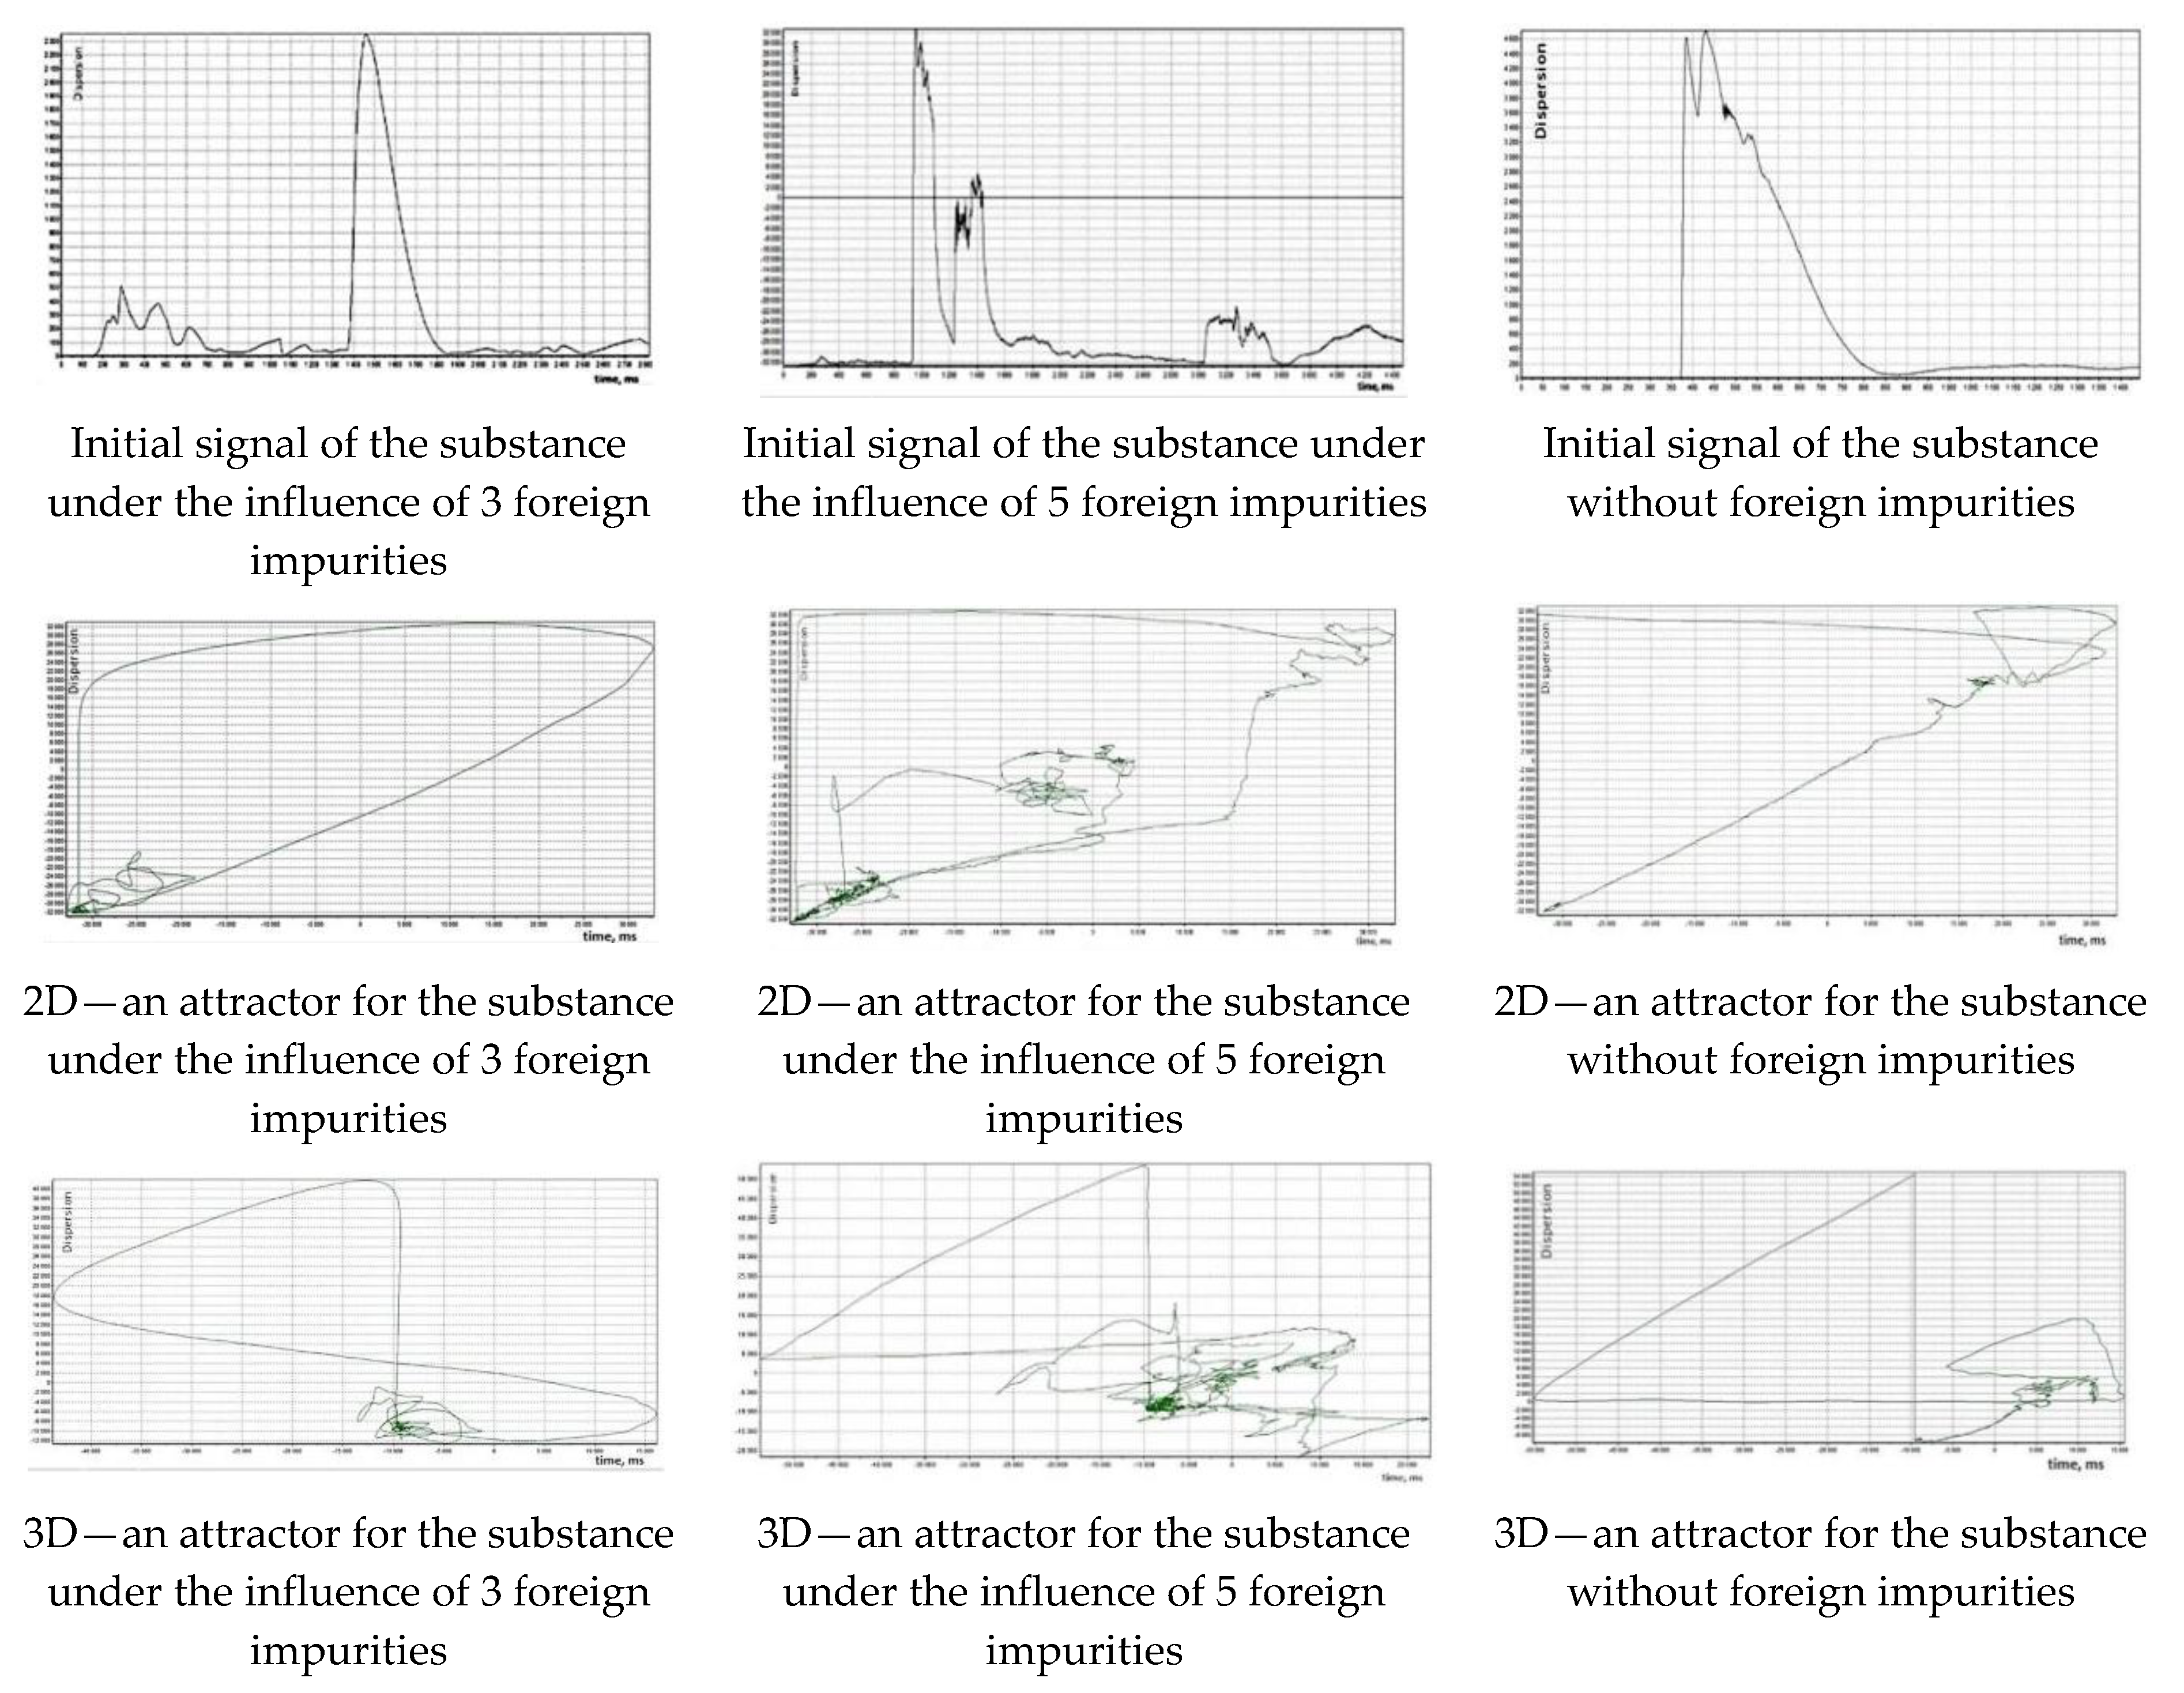
Figure 6 shows phase trajectories for a «pure» substance–single-component mixture, and attractors for the same substance in the complex, multicomponent mixtures.
According to
Figure 6, it is visible that despite obvious differences in phase trajectories, it is difficult to precisely identify the substance. Values of correlation, phase, and fractal dimensions and Hurst exponent for each case are given in
Table 1.
Although correlation dimensions and dimensions of a phase space have sufficient dispersion and allow us to judge the number of impurities in an air environment, the fractal dimension and Hurst exponent do not allow us to construct a unique attractor with dispersions of fractal dimension values and a Hurst exponent less than 8%.
Thus, additional transformations of phase trajectories are necessary for an increase in informational content and the selection definition of the substance in multicomponent environments.
3. Results
To increase the information content of dynamic systems analysis, we will enter the dynamic density of an attractor as the density of the elementary trajectories forming an attractor. Therefore, the dynamic density of an attractor is defined not only by the correlation dimension but also by fractal and Hurst exponents, which, in turn, are dynamic characteristics of substance gas-sensing devices—the sensor detection process.
For the time series presented by counting a measurand and the Takens method of a time delay by which in an
n-dimensional phase space, a polymarker is created:
, where
r is a time delay, and
n is the dimension of an investment [
19].
If
, the point set
sets an investment of an initial attractor at any choice of an observed variable, and if
n is not less than the doubled dimension of an initial attractor, the choice of a time delay pays off from an autocorrelation function of a time series:
The delay τ is chosen by autocorrelation function that is equal to the time of the first crossing of zero. Then, the attractor is divided into cells. The cells are necessary to calculate the quantity of the phase trajectory elements. This quantity corresponds to the number of hits in the section area of a phase space. The presence of symmetrical properties in a chaotic attractor [
20] makes it possible to use the revealed patterns in practical applications.
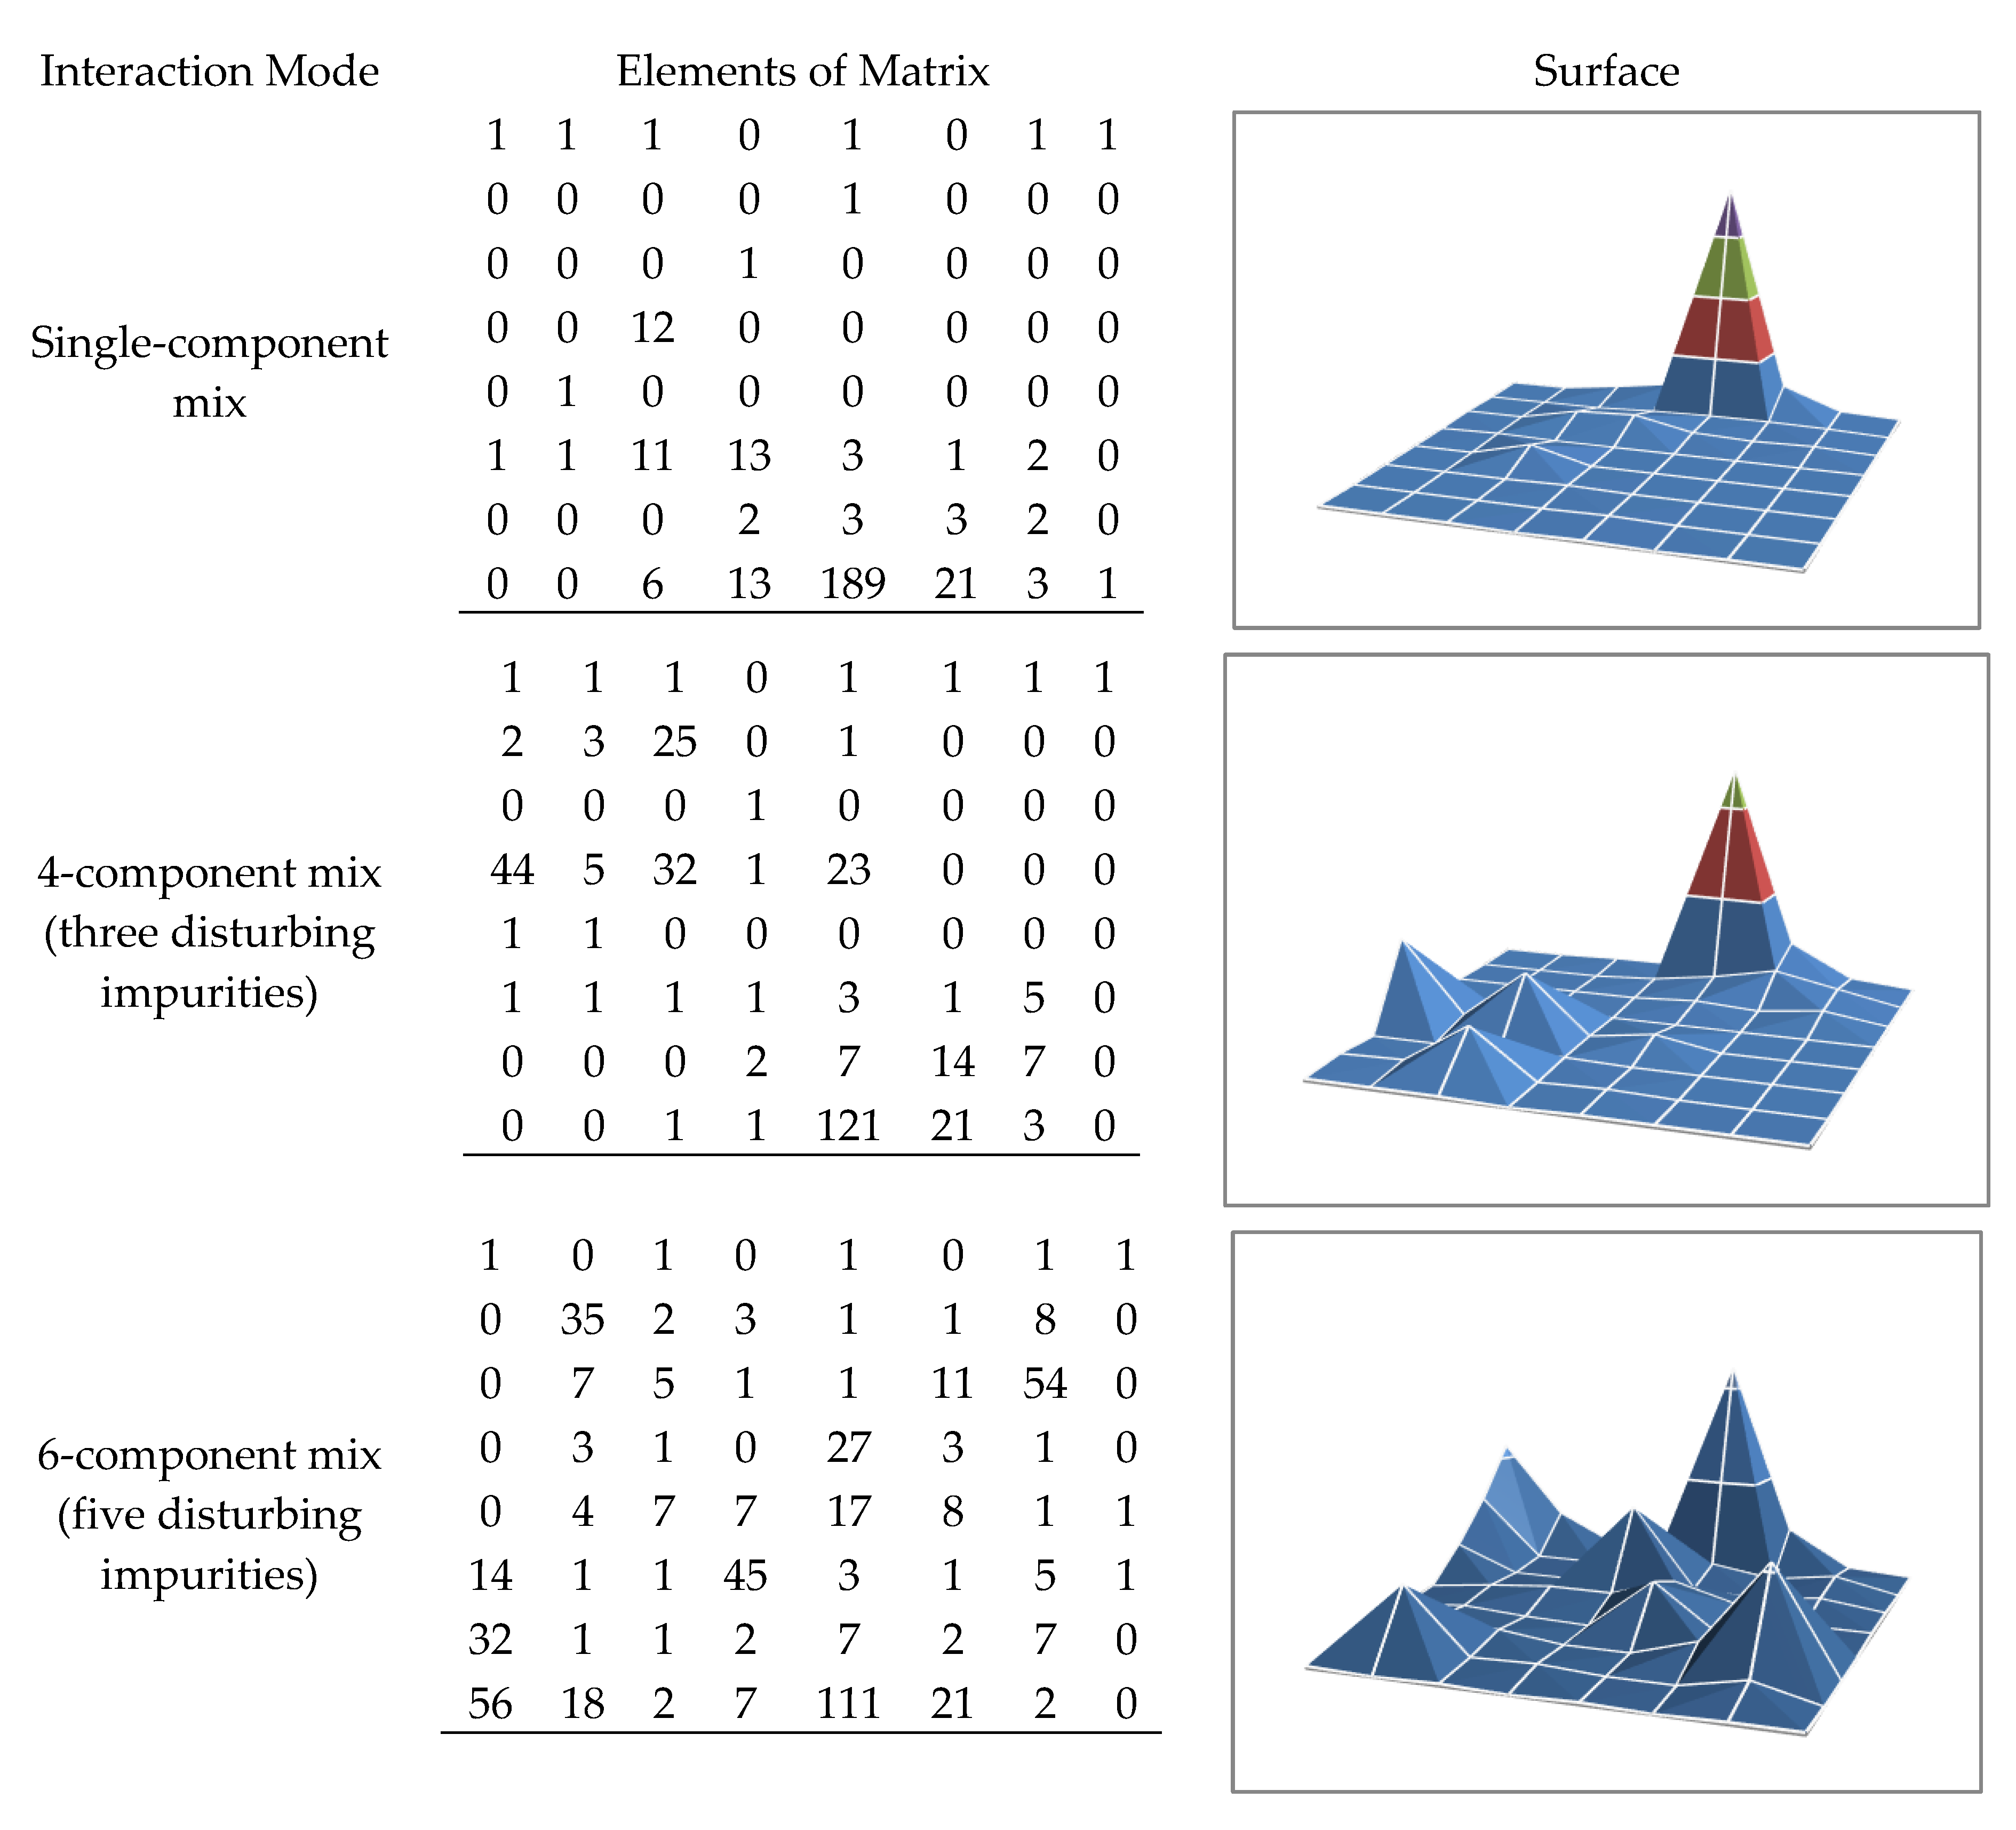
The calculation of element trajectories is carried out by the algorithm of the filling of the limited space of LOWESS (locally weighted scatterplot smoothing) [
21]. After calculating element trajectory quantities, matrix
is created. The elements of this matrix represent the two-dimensional dynamic array corresponding to a phase trajectory.
According to the results of splitting, the surface is created. The provision of an amplitude maximum of each field of splitting meets an expectation, and half-width is the dispersion of splitting field values.
Matrix of attractor-splitting corresponds to the surface, which is a visual image of the dynamic system «Substance—Multisensor System».
Figure 7 shows matrixes and the surfaces corresponding to them for the attractors given in
Figure 8.
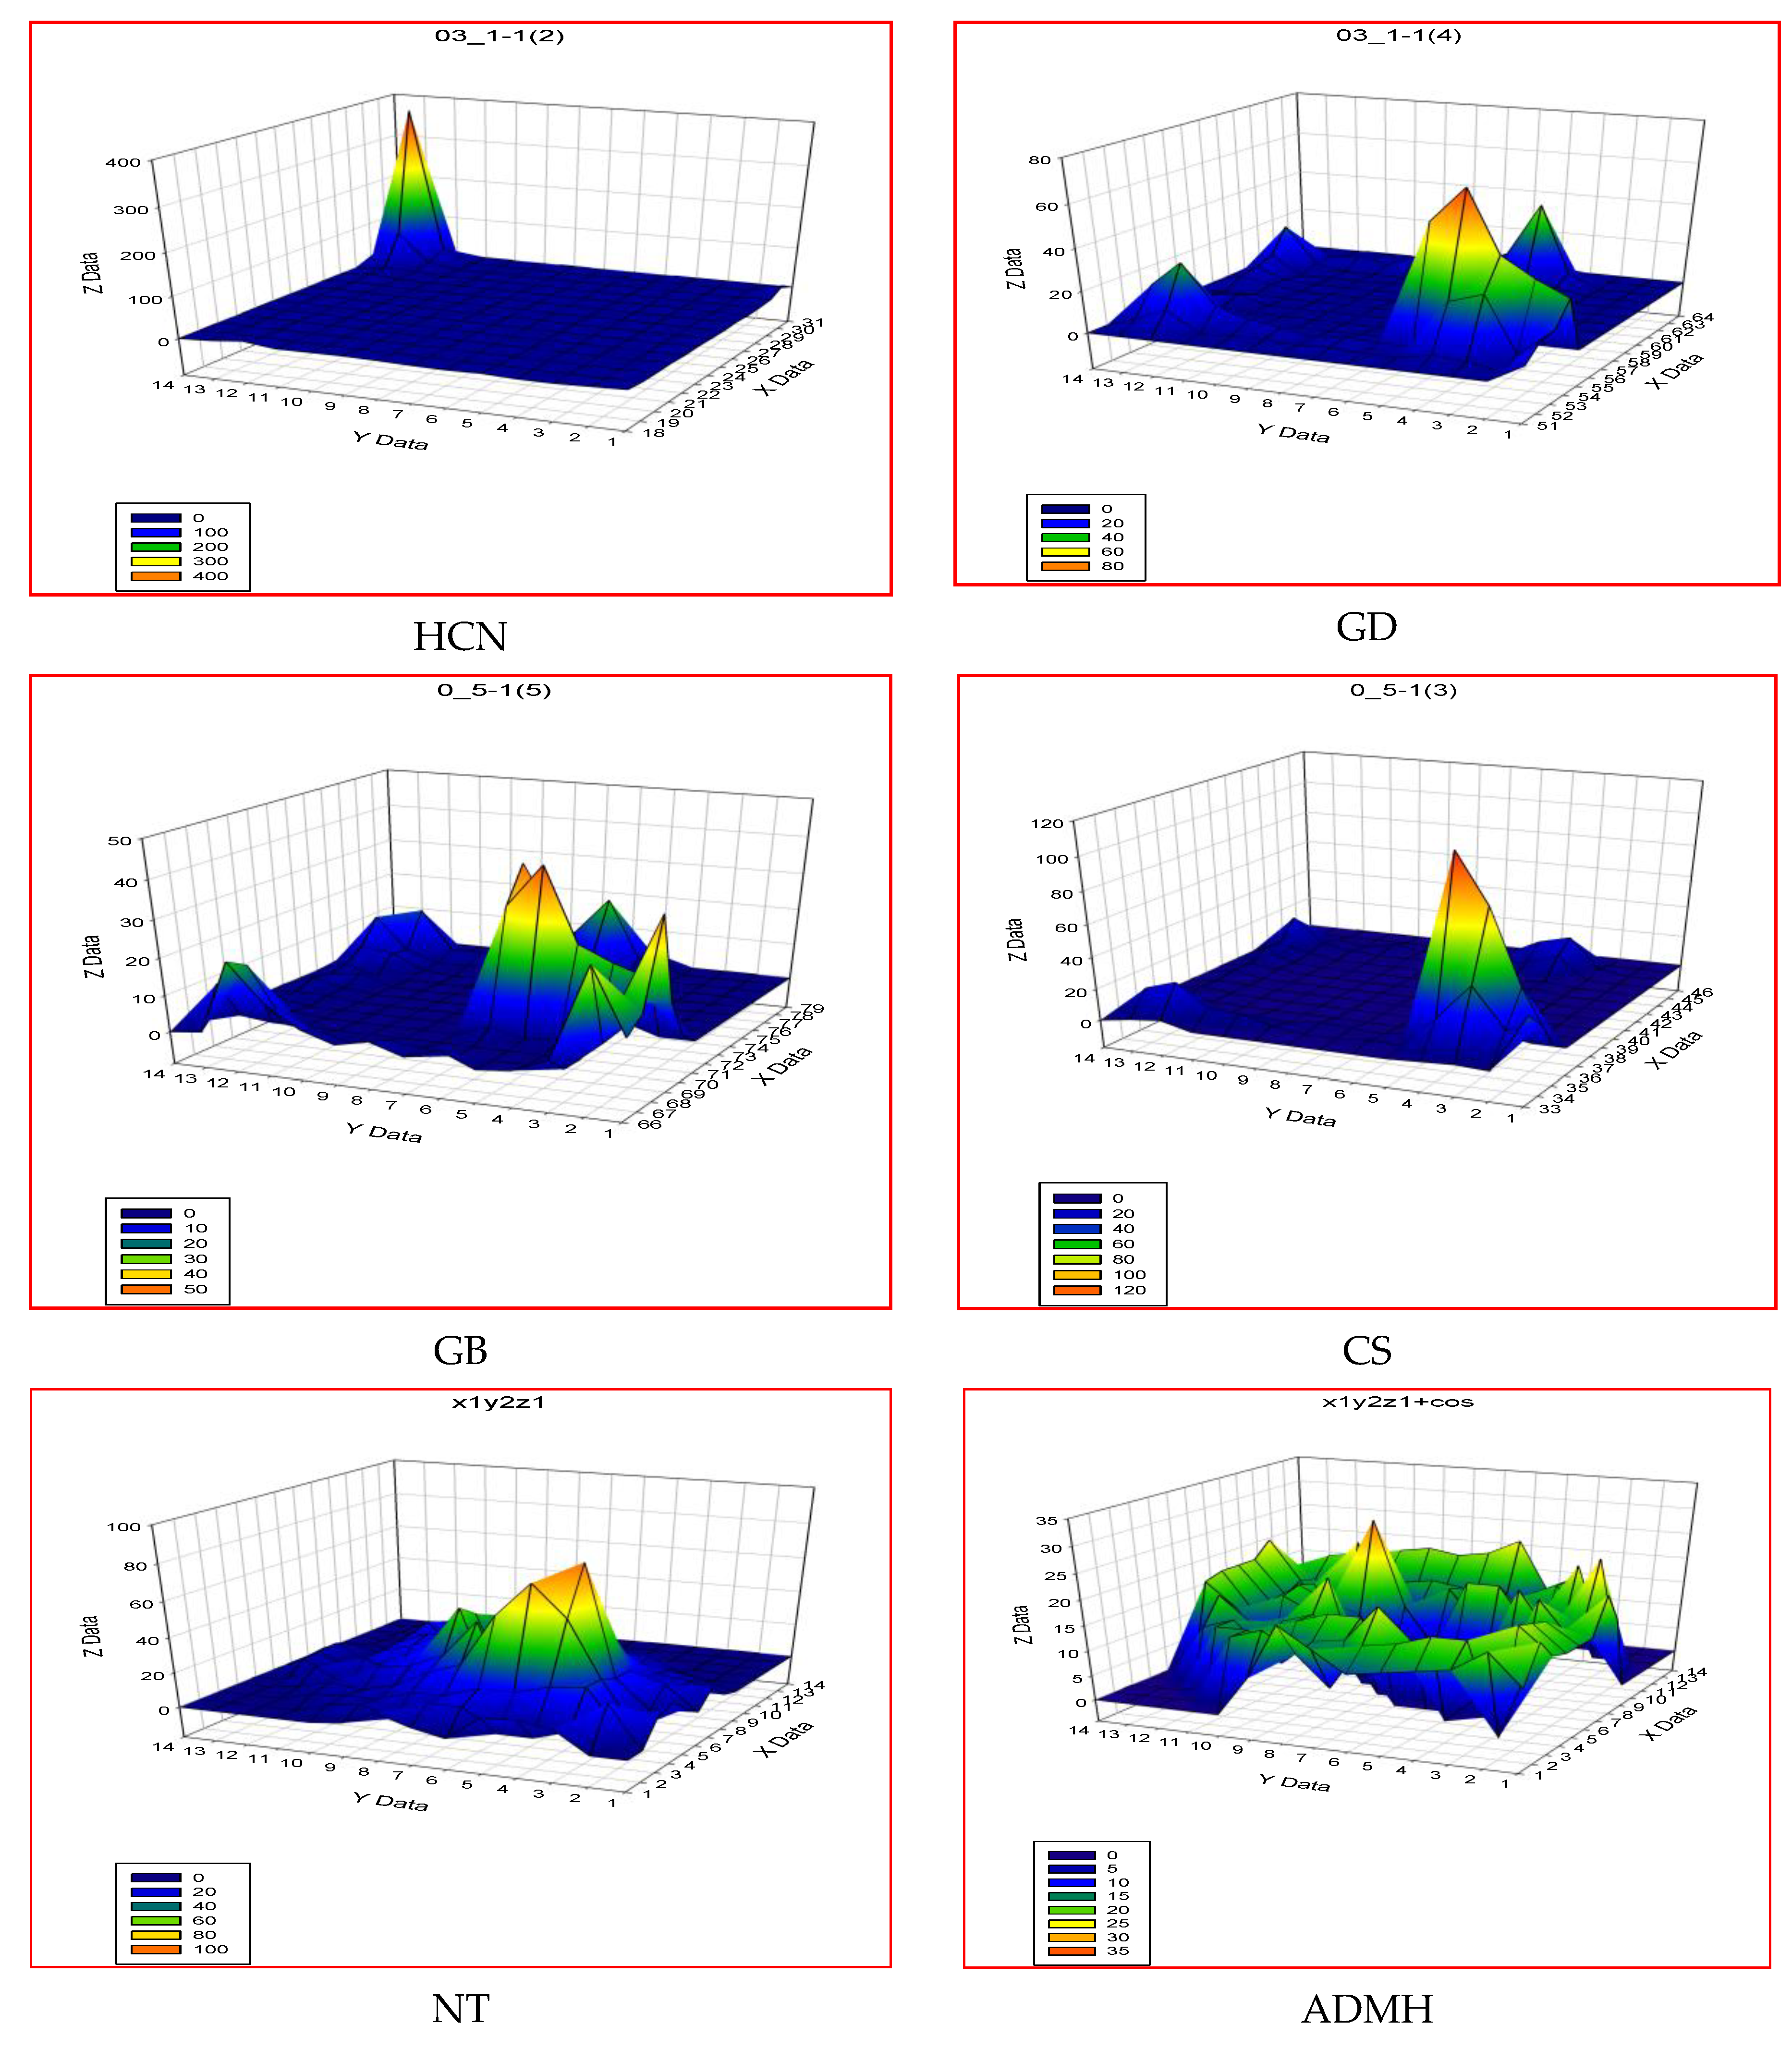
The results of measurement processing taken by means of the sensor of the working homeothermal heating are given in
Figure 8. Indicators of the dynamic system «Substances—The Sensor» are given in
Table 2. As a primary converter, the sensor on the basis of SnO
2 is chosen: Sb
2O
3 and the alloyed Ag Ag
3 O
2 with a valency of position types 1 and 3. As substances, anolyte compounds are chosen: HCN, the phosphorus organic substances GB and GD, an irritant of CS, a component of rocket fuels—nitrogen N
2O
4 (NT), tetraoxide, and the asymmetrical dimethylhydrazine (CH
3)
2N
2H
2) (ADMH).
Processing is carried out using the following algorithm:
measurements of vapors of substances—analytes at the power of heating of 300 mW of the SnO2 sensor, Sb2O3: Ag+ Ag3+ O2, exposure time 30 s;
the measured tension is transformed by Equations (1) and (2);
on values II of the statistical moment, attractors by the Takens method are constructed as 2D and 3D (10);
correlations, fractal dimensions, Hurst exponents and dimensions of the phase space (
Table 2) are calculated;
splitting phase trajectories for each substance are carried out;
matrixes of splittings are created, and surfaces (
Figure 8) that are a visual image of the corresponding dynamic system are constructed;
on values of a matrix of splittings, the secular equations of a canonical bilinear form (12) that are settlement images of each of the measured substances are removed.
Forming images of studied substances can be carried out within dynamic systems that combine environment and multisensor analytical systems.
The proposed method of gas analysis control using semiconductor gas-sensitive sensors shown in
Figure 1 has been tested many times in the applied circuitry solutions (
Figure 3). A comparison was also made with other gas analysis methods such as chromatography, mass spectrometry, infrared spectrometry, and Raman spectrometry. The main difference and advantage is the absence of any operations for preparing the sample for analysis. A multisensor system composed of sensors (e.g., 4, 8, 16) allows us to form an image of the detected air, both of the integral smell and the components separated.
The accuracy of the quantitative analysis depends on air sampling and the stability of the sensors. Sampling accuracy is achieved by using precision flow rate drivers (such as air pumps, measurement stability) with the help of the technology of manufacturing sensors and an electronic circuit for controlling measurements and calculations.
4. Conclusions
In this paper, comprehensive processing of measurement results was carried out. Dynamic image formation, correlation, and fractal dimension are carried out, not with initial data, but with transformed analytical signals. Based on the obtained dimension values, two-dimensional and three-dimensional attractions were built, representing unique images of multicomponent steam–gas mixtures.
The main problem with gas analysis measurements using semiconductor sensors is the problem of 3S—sensitivity, selectivity, and stability.
For electronic nose systems, selectivity is addressed by forming a multisensor system and analyzing the nonlinear dynamic sensor–gas system. Sensitivity is achieved by forming a developed surface by converting the semiconductor material into a ceramic state. The sensor creation technology allows us to obtain up to 1025 surface-active centers, which are involved in the chemisorption process with further changes in the electrical conductivity of the sensitive layer. Finally, the stability that determines the reproducibility and repeatability of the measurement results is achieved by sensor manufacturing techniques. The manufacturing technique involves a process of group application of a gas-sensitive material through a stencil. The process mode provides for the simultaneous application of 250 sensors, followed by skybing (laser cutting).
The paper shows that the variation of the physical parameters of sensors, such as the resistance of the heating element and the resistance of the sensitive layer within one series, does not exceed 10%–12%.
It is advisable to continue the miniaturization of sensors. For example, a topology for placing gas-sensitive layers 2 and 4 on one microchip has been developed. This will reduce power consumption and increase the number of analytical channels, which will improve the quality and reliability of measurements. An example is shown in
Figure 8.
The use of an electronic nose system allows us to carry out the detection and identification of smells created by multicomponent mixtures of substances.
In ambient air, substance-anality is in the structure of multicomponent mixtures, which can have different physical and chemical properties.
Figure 7 and
Figure 8 show splitting phase trajectories, drawing up a matrix of splitting, creating a surface leading to the formation of substance images, and allowing the system to carry out its detection in multicomponent environments with a high probability of identification.
Besides the formation of a matrix of splittings and the surface corresponding to it, the algorithm includes calculations of eigenvalues of a matrix and coefficients of the canonical bilinear form, which is, in a unique way, the studied substance in the presence of the disturbing impurities:
where
i,
j are the line number and columns of a matrix of splittings,
k is the index of the substance.
The offered algorithm is applied to analyze complex dynamic systems in which the formation of an image of various substances is carried out by one sensor under constant conditions of measurement.
It is apparent that the analysis of phase trajectories, which is carried out on their regular splittings, increases the quality of informational content of processing of initial measurements and allows us to achieve the necessary reliability and stability of an image of a dynamic system.
Our attention in this paper is given to semiconductor multisensory systems. Control measurements were performed using chromatography and Raman spectrometry using the SERS effect. Infrared spectrometry and mass spectrometry were used in part. The strategy used in our research has been tested on the measurement of impurities of various substances and vapor–air mixtures of different compositions. The correlation coefficients between measurements by various methods exceeded 0.75.
Spheres and the predicted ranges of application of the electronic nose system:
medicine (diagnosis of diseases on the smell of respiration and selections, detection of causative agents of infections on respiration, determination of the level of alcohol and drugs in blood, monitoring of anesthetics);
ecology (monitoring of a condition of the atmosphere, harmful emissions at industrial enterprises, combustion gases of internal combustion engines);
chemical safety (detection of explosives, poisons, drugs, systems of early fire alarm, sensors of security alarm systems, systems of detection of weapons of mass destruction);
the agrarian direction (determination of agricultural product quality, production of forages for animals, accelerated selection);
science (fast analysis of proteinaceous mixes in genetic engineering, identification of plants and animals in biology);
mining industry (the analysis of vapors of naphtha and gas for searching and monitoring of fields, fast identification of minerals);
household appliances (consumer monitoring, definition of degree of readiness of a product in microwave ovens and ovens, robots vacuum cleaners and disinfectors).
The creation of an economical and, at the same time, effective analytical system based on multisensor systems is required. The conducted research in the field of nanostructural semiconductor materials, circuitry decisions, and applied mathematical methods allow us to implement systems like the «electronic nose», corresponding to the requirements for devices of analytical monitoring of the environment.
On the issue of smell control, a series of experiments was carried out in which special equipment was used to ensure the production of multicomponent mixtures and control measurements for each component. In addition, sources of microflow forming controlling smells with the possibility of separation by constituent substances were developed and certified. The experimental results, on which the basis of the calculations presented in this work was performed, were obtained from multiple measurements of at least 21 control points. The measurement results for each substance were averaged with the calculation of mean values and standard deviation. The error for each substance, relative to average values, did not exceed 10%.
Currently, research is being conducted on the formation of dynamic images corresponding to smells and their change.


