Abstract
Inspired by the collective behavior of fish schools, the fish school search (FSS) algorithm is a technique for finding globally optimal solutions. The algorithm is characterized by its simplicity and high performance; FSS is computationally inexpensive, compared to other evolution-inspired algorithms. However, the premature convergence problem is inherent to FSS, especially in the optimization of functions that are in very-high-dimensional spaces and have plenty of local minima or maxima. The accuracy of the obtained solution highly depends on the initial distribution of agents in the search space and on the predefined initial individual and collective-volitive movement step sizes. In this paper, we provide a study of different chaotic maps with symmetric distributions, used as pseudorandom number generators (PRNGs) in FSS. In addition, we incorporate exponential step decay in order to improve the accuracy of the solutions produced by the algorithm. The obtained results of the conducted numerical experiments show that the use of chaotic maps instead of other commonly used high-quality PRNGs can speed up the algorithm, and the incorporated exponential step decay can improve the accuracy of the obtained solution. Different pseudorandom number distributions produced by the considered chaotic maps can positively affect the accuracy of the algorithm in different optimization problems. Overall, the use of the uniform pseudorandom number distribution generated by the tent map produced the most accurate results. Moreover, the tent-map-based PRNG achieved the best performance when compared to other chaotic maps and nonchaotic PRNGs. To demonstrate the effectiveness of the proposed optimization technique, we provide a comparison of the tent-map-based FSS algorithm with exponential step decay (ETFSS) with particle swarm optimization (PSO) and with the genetic algorithm with tournament selection (GA) on test functions for optimization.
1. Introduction
With the increased use of artificial intelligence, decision support systems, forecasting, and expert systems in many enterprises, optimization problems arise more often in modern economic sectors. Such problems are widespread in computer science, engineering [1], and economics [2]. Optimization problems lie at the heart of many machine learning algorithms [3], including neural networks [4], clustering algorithms, support vector machines, and random forests. By convention, optimization denotes a minimization problem—the selection of element such that , where is the objective function, often named the fitness function in evolutionary computation. The maximization problem, conversely, can be formulated as the selection of such that . Evolutionary algorithms represent a subset of optimization algorithms. Such algorithms use heuristic techniques inspired by biological evolution, and they process a variety of solutions to an optimization problem in a single iteration. Therefore, such biology-inspired algorithms are also known as population-based techniques.
The recent research in evolutionary computation has introduced a number of effective heuristic population-based optimization techniques, including genetic algorithms [5], particle swarm optimization [6], ant colony optimization [7], cuckoo search [8], bee swarm optimization [9], memetic algorithm [10], differential evolution [11], fish school search [12], and others. These effective algorithms have found their applications in many real-world problems [1,2] and continue gaining popularity among researchers. According to the No Free Lunch (NFL) theorem in optimization, no universal method exists that could be used for solving all optimization problems efficiently [13]. Consequently, the recent research in optimization has introduced a variety of hybrid algorithms applied to solve practical problems, including big data classification using support vector machine (SVM) algorithms and modified particle swarm optimization [14] and predictive modelling of medical data using a combined approach of random forests and a genetic algorithm [15]. Hybrids of evolution-inspired and classical optimization methods have been proposed as well, applied in neural network model training [16,17] and in accurate inverse permittivity measurement [18]. In order to take advantage of the several population-based optimization algorithms, a novel meta-heuristic approach, COBRA (Co-Operation of Biology-Related Algorithms), was proposed in [19], based on the parallel and simultaneous work of multiple evolution-inspired algorithms.
In this paper, we consider the fish school search (FSS) algorithm, proposed by Bastos Filho et al. in [12]. Inspired by the collective behavior of fish schools, this effective and computationally inexpensive optimization technique outperformed the genetic algorithm in image reconstruction of electrical impedance tomography in [20] and proved its superiority over particle swarm optimization in [21]. Moreover, FSS outperformed back propagation and the bee swarm algorithm in neural network training for mobility prediction in [22]. In addition, FSS was used in intellectual assistant systems [23] and in solving assembly line balancing problems [24]. Compared to other evolution-inspired algorithms, FSS is a relatively lightweight optimization technique. A multiobjective version of FSS exists [25], as well as modifications intended to improve the performance of the algorithm [26].
However, the premature convergence problem inherent to many evolutionary optimization algorithms is inherent to FSS as well. The core idea of FSS is to make the randomly initialized population of agents move towards the positive gradient of a function, without the need to perform computationally expensive operations, except for fitness function evaluations. Given that, the quality of the obtained solution heavily depends on the initial locations of agents in a population and on the predefined step sizes. If the considered fitness function is multimodal and agents do not fill the search space uniformly, then the algorithm has a higher chance to converge to a locally optimal solution, probably different on each test run.
Therefore, the characteristics of the pseudorandom number generator (PRNG) used to initialize the locations of agents and to perform individual and collective movements have a great impact on the accuracy of the obtained solution and on the execution time of the algorithm as well. Plenty of PRNGs have been invented [27,28,29]; the generators vary per platform and per programming language. The characteristics of PRNGs differ, depending on the considered domain. PRNGs have applications in simulations, electronic games, and cryptography, and each area implies its own limitations and requirements. In some cases, the generator has to be cryptographically secure. In other cases, the speed of a PRNG can be a crucial measure of quality.
Chaotic behavior exists in many natural systems, as well as in deterministic nonlinear dynamical systems. Chaos-based systems have applications in communications, cryptography, and noise generation. A dynamical system is denoted by a state space , a set of times , and a map which describes the evolution of the dynamical system. An example of a chaotic mapping is the logistic map, introduced by Robert May in 1976 [30]. The map is given by the following equation:
Here, represents the current state of the dynamical system, and is the control parameter. The control parameter determines whether a dynamical system stabilizes at a constant value, stabilizes at periodic values, or becomes completely chaotic. The logistic-mapping-based system becomes chaotic when . In the completely chaotic state, the logistic map (1) can be used as a simple PRNG. Guyeux et al. in [31] proposed a novel chaotic PRNG based on a combination of chaotic iterations and well-known generators with applications in watermarking. Hobincu et al. proposed a cryptographic PRNG targeting secret communication [32]; the algorithm was based on the evolution of the chaotic Henon map.
Zhiteng Ma et al. in [33] used a modified version of the logistic map (1) to generate the initial locations of agents in the proposed chaotic particle swarm optimization algorithm. They conducted a series of experiments that verified the effectiveness of the implemented optimization technique. A novel hybrid algorithm based on chaotic search and the artificial fish swarm algorithm was proposed in [34], where Hai Ma et al. used the logistic map (1) to perform the local search. The results of the numerical experiment proved that the proposed technique was characterized by higher convergence speed and better stability compared to the original algorithm. El-Shorbagy et al. in [35] proposed a hybrid algorithm that integrates the genetic algorithm and a chaotic local search strategy to improve the convergence speed towards the globally optimal solution. They considered several chaotic mappings, including the logistic map (1). The obtained results confirmed that integrating the genetic algorithm with chaos-based local search speeds up the convergence, even when dealing with nonsmooth and nondifferentiable functions.
In this paper, we provide a comparative study of optimization algorithms based on FSS and different chaotic mappings, including (1). We consider the modified logistic map [36], the tent map [37], the sine map, and the circle map with zero driving phase, which are parts of the fractional Caputo standard α-family of maps, as described in [38]. Additionally, we consider the simple cosine map, mentioned in [29]. We analyze the distributions produced by chaotic PRNGs, and compare the performance of the mappings with that of other commonly used PRNGs, such as Mersenne Twister [28], Philox [39], and Parallel Congruent Generator (PCG) [40]. In addition, we incorporate exponential step decay into FSS and compare the accuracy of the modified algorithm with that of PSO and GA on both unimodal and multimodal test functions for optimization. We apply the Wilcoxon signed-rank test to determine whether significant differences exist between the considered algorithms. The results of the numerical experiments show the outstanding advantage of tent-map-based chaotic PRNG performance, as well as the superiority of tent-map-based FSS with exponential step decay over PSO and GA.
2. Materials and Methods
2.1. Chaotic Mappings, Bifurcations, and Lyapunov’s Exponent
The accuracy of optimization results obtained by FSS heavily depends on the initial locations of agents in a fish school—the initial population of solutions —and the shape of the distribution produced by the PRNG that is used to generate individual and collective-volitive random movement vectors. If the agents are not distributed uniformly in the search space, the optimization process can be prone to stagnation or to premature convergence towards local minima or maxima.
On the other hand, the performance of the algorithm depends on the performance of the incorporated PRNG. The chaos generated by nonlinear dynamical systems, such as (1), has the potential to outperform most default pseudorandom number generators due to the simplicity of the chaotic maps. Compared to other PRNGs, the chaotic maps can be far less computationally expensive.
The shape of the generated distribution depends on the specific chaotic mapping. In this study, we considered different chaotic maps, including the logistic map (1), the modified logistic map proposed in [36] (and named the square map hereafter), the digital tent map, first mentioned in [37], sine and circle maps, belonging to the fractional Caputo standard -family of maps [38], and the simple cosine map [29]. For each of the considered chaotic maps, we used different parameter values to make the maps completely chaotic. The iterative equations representing the mappings and their respective parameter values are listed in Table 1. In dynamical systems, a bifurcation diagram shows the values visited by a system as a function of the bifurcation parameter of the system. The bifurcation diagrams of the dynamical systems listed in Table 1 are shown in Figure 1.

Table 1.
Chaotic maps used as pseudorandom number generators (PRNGs) in this study.
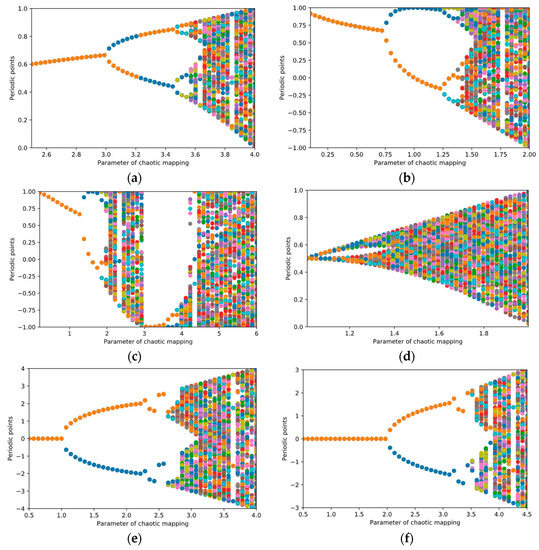
Figure 1.
Bifurcation diagrams of the chaotic maps listed in Table 1: (a) Logistic map; (b) Square map; (c) Cosine map; (d) Tent map; (e) Sine map; (f) Circle map.
In order to compare the chaotic maps and to select the appropriate values for the parameter, we used the Lyapunov exponent metric , which provides a detailed characterization of chaos in dynamical systems. A positive value of indicates that the dynamical system is chaotic. In chaotic motion, two points move apart as time increases, making it impossible to predict the locations of new points in the long-term future [41]. Negative values of the metric denote that a fixed point or a stable orbit attracts the orbits of the system. In cases when the system is in steady state. Such a system is considered conservative; the orbits maintain constant separation [30]. For a discrete time system, the Lyapunov exponent formula is given by
Here, denotes the total number of iterations; is the starting point; and denotes the derivative of the mapping function , which can be computed either analytically or numerically by using finite difference approximation.
Plots of the Lyapunov exponent (2) values for the chaotic maps defined in Table 1 are shown in Figure 2. For all of the parameter values listed in Table 1, the Lyapunov exponent values are positive (); hence, all of the considered maps are in the chaotic state.
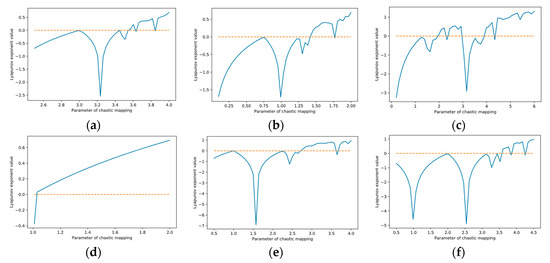
Figure 2.
Lyapunov exponent plots of the chaotic maps listed in Table 1: (a) Logistic map; (b) Square map; (c) Cosine map; (d) Tent map; (e) Sine map; (f) Circle map.
According to Figure 1d–f, the tent, sine, and circle mappings are those most likely to produce more symmetric and uniform pseudorandom number distributions when compared to other mappings. In order to either confirm or disprove this, we generated pseudorandom numbers using each of the chaotic mappings listed in Table 1. The obtained histogram plots illustrating the relative occurrence frequencies of numbers in different distributions and probability density curves are shown in Figure 3.
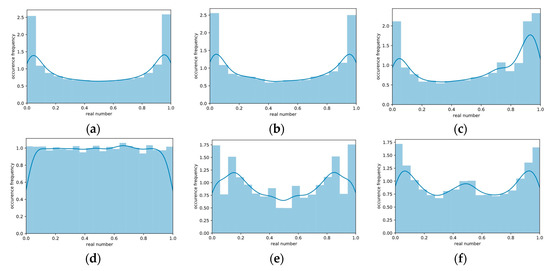
Figure 3.
Histogram comparison of the relative occurrence frequency of random numbers generated by chaotic maps: (a) Logistic map; (b) Square map; (c) Cosine map; (d) Tent map; (e) Sine map; (f) Circle map.
The biology-inspired FSS algorithm does not imply any additional limitations to the PRNG used to generate the initial locations of agents and movement vectors, except for the shape of the probability density curve. Notably, all of the probability density curves shown in Figure 3 are almost symmetric with respect to the line . The probability density curve of the chaotic cosine mapping is slightly less symmetric compared to the other curves, as shown in Figure 3c. Potentially, further parameter tuning could make the distribution more symmetric, as shown in [29]. The distributions generated by the chaotic tent, circle, and sine mappings show the most promising results. The tent map produces the most uniformly distributed pseudorandom numbers, as shown in Figure 3d.
In evolutionary optimization, the considered chaotic mappings have the potential to outperform most PRNGs used in modern programming languages by default, such as the Mersenne Twister [28] or PCG [40]. In order to experimentally confirm or disprove the advantages of the chaotic maps listed in Table 1 over the mentioned default PRNGs, in Section 3.1 we benchmark the discussed pseudorandom generation algorithms.
2.2. The Chaotic Fish School Search Algorithm with Exponetial Step Decay
In the proposed chaotic FSS algorithm with exponential step decay, the initial population is initialized with vectors. Here, is a random -dimensional vector generated using one of the chaotic mappings listed in Table 1, and the vector represents the location of the th agent. The initial vector, used as the initial state for a chaotic mapping, is generated by the default PRNG. After the initialization of the population , the FSS applies the individual movement operator to every agent in the population, according to
Here, denotes the location of the th agent at iteration . Unlike the original FSS algorithm, in chaotic FSS, the vector contains uniformly distributed random numbers belonging to the interval , generated using one of the chaotic mappings listed in Table 1. The term is the scalar individual movement step size, which decays each iteration according to
Here, denotes the step size at iteration , is the initial step size, and denotes the predefined total number of iterations, . A comparison of the step decay curve produced by (4) with the linear step decay used in the original FSS algorithm is shown in Figure 4.
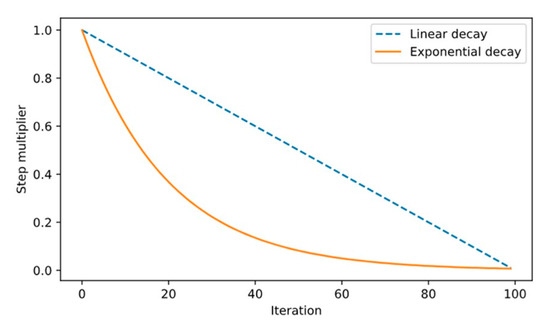
Figure 4.
Visual representation of linear and exponential step decays.
Similar to the original FSS algorithm, the new location produced by (3) is accepted only if , where denotes the fitness function being optimized; otherwise, the new position remains the same as . Next, we apply the feeding operator to every :
Here, . is the weight value associated with the corresponding agent . Consequently, the weights of agents with better location changes increase, and they attract other agents during the collective-volitive movement step. After feeding, collective-instinctive movement occurs. The collective-instinctive movement vector is computed, given by
Then, the collective-instinctive movement operator is applied to every agent:
Next, the collective-volitive movement operator is applied, defined by the following equation:
Here, the vector denotes the barycenter vector, which is computed according to (9), in exactly the same manner as it happens in the original FSS algorithm. The difference between the modified and original FSS is in the vector. In the chaotic version of FSS, this vector contains random real numbers belonging to the interval , generated by one of the considered chaotic mappings listed in Table 1.
The sign used in equation (8) depends on the new total weight of the population. If the weight has increased since the last iteration, the ‘’ sign is used; otherwise, the ‘’ sign is used. Similar to , the variable decays according to (4) on every iteration and indicates the maximum collective-volitive displacement allowed in the specific iteration.
On each iteration, is chosen such that . When the predefined maximum iteration count is reached, the algorithm stops. The last obtained is assumed to be the solution. In Section 3.2, we provide comparative benchmarks of the original and modified algorithms based on chaotic mappings listed in Table 1.
3. Numerical Experiments
3.1. Performance Comparison of Chaotic and Nonchaotic PRNGs
In order to experimentally confirm or disprove whether the chaotic mappings outperform commonly used PRNGs, such as Mersenne Twister [28], Parallel Congruent Generator (PCG) [40], and Philox [39], the mappings listed in Table 1 were implemented in the C programming language and then benchmarked. We included the Mersenne Twister, PCG, and Philox PRNG implementations in the benchmarks as well; the implementations for these algorithms were borrowed from the numpy library backend [42] and were written in C as well. We ran the experiments on the Ubuntu 18.04 operating system, and the characteristics of the machine on which the experiments were conducted are listed in Table 2.
Table 2.
Characteristics of the test machine.
In each test run and for each of the considered PRNGs, pseudorandom numbers were generated. In each test run, we computed the average value of the count of random numbers generated per second. In order to make the results statistically representative, the experiments were repeated 30 times. Then, we computed such metrics as the arithmetic mean value of the distribution, the best value, and the standard deviation, all measured in numbers per second. The results are shown in Table 3.
Table 3.
Numbers per second generated by chaotic and nonchaotic PRNGs.
According to Table 3, the logistic and tent mappings outperform most other PRNGs, including both chaotic and nonchaotic ones. However, the mappings that compute trigonometric functions on every iteration may be slower than Mersenne Twister or PCG. Notably, the tent map shows excellent performance and produces a uniform pseudorandom distribution, as the other considered nonchaotic PRNGs do. In order to compare the distributions produced by Mersenne Twister and the tent map, we plotted the probability density curves of pseudorandom numbers respectively generated by Mersenne Twister and the tent map. The plots are shown in Figure 5.
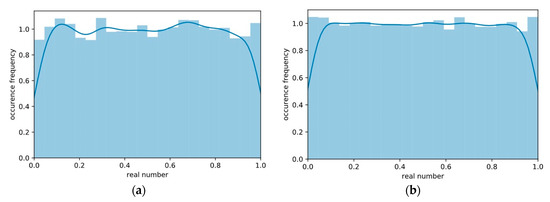
Figure 5.
Histogram comparison of the relative occurrence frequency of the uniformly distributed pseudorandom numbers generated by (a) Mersenne Twister and (b) the chaotic tent map.
From Figure 5 we observe that the tent map may produce random digits distributed more uniformly when compared to the Mersenne Twister PRNG used in the Python programming language by default. According to Table 3 and Figure 5, the tent map can generate high-quality distributions and achieve great performance. Hence, the chaotic tent map can be used in evolutionary optimization as a replacement for the default PRNG. The bio-inspired algorithms in general do not imply any additional limitations on the incorporated PRNG, except for speed and probability density function shape. Consequently, the tent-map-based PRNG could be incorporated into the FSS algorithm as well.
3.2. Comparison of Different Chaotic Maps Used as PRNGs in FSS with Exponential Step Decay
Based on the idea of chaotic FSS optimization with exponential step decay described in Section 2.2, we considered six separate algorithms based on the six chaotic mappings listed in Table 1. The FSS algorithm with exponential step decay, which relies on the Mersenne Twister PRNG, used in Python by default, was abbreviated as EFSS. EFSS modifications based on the logistic, square, and cosine mappings were abbreviated as ELFSS, ESFSS, and ECFSS, respectively. The chaotic algorithms based on the tent, sine, and circle maps were abbreviated as ETFSS, ESiFSS, and ECiFSS, respectively.
The algorithms described in Section 2.2 were tested on multidimensional test functions for optimization, including both unimodal and multimodal functions. The multidimensional functions included the Rastrigin, Griewank, Ackley, Sphere, and Rosenbrock functions [43] listed in Table 4 as and respectively; the Styblinsky-Tang and Schwefel 1.2 functions [44], listed as and ; and the Zakharov function [45], . In Table 4, the letter M denotes a multimodal function, and the letter U indicates that a function is unimodal.
Table 4.
Test functions used to benchmark the chaotic optimization algorithms. M and U letters denote multimodal and unimodal optimization problems respectively.
By convention, optimization denotes the minimization problem, and the functions listed in Table 4 are expected to be minimized inside their search regions. However, in the conducted numerical experiments, the functions were multiplied by in order to solve the dual maximization problem. Thus, the optimization problem which we intended to solve numerically can be described as
Here, denotes the th function listed in Table 4, ; denotes the study region of the given function and is the optimal solution belonging to .
In each of the test runs, the initial step sizes and of the chaotic FSS algorithms with exponential step decay were set to 14% of the radius of the study region. We created populations of 100 agents in each of the test runs. In the chaos-based algorithms, the positions of the agents were generated randomly using the mappings from Table 1, as described in Section 2.2. The random displacement vectors were generated using the respective chaotic maps, as described in Section 2.2. For every test function listed in Table 4, we ran 300 iterations of each of the considered algorithms.
The algorithms were implemented using the high-level interpreted Python programming language. In the EFSS algorithm, we used the default Python PRNG—the Mersenne Twister. In the chaos-based algorithms, we used the same PRNG to generate the initial values for each of the chaotic maps. We ran the experiments on the Ubuntu 18.04 operating system, inside the Docker container with Jupiter IPython kernel installed. The characteristics of the machine on which the benchmarks were conducted are listed in Table 2.
During the test runs, we used 15-dimensional versions of the -dimensional functions listed in Table 4. In order to gather representative results, each of the test runs was repeated 30 times. The mean values and standard deviations were computed. The maximum function values obtained by each of the algorithms were considered as the best solutions. The results are shown in Table 5.
Table 5.
Accuracy comparison of the considered algorithms based on fish school search (FSS) with exponential step decay (EFSS). Algorithms based on the logistic, square, cosine, tent, sine, and circle maps are abbreviated as ELFSS, ESFSS, ECFSS, ETFSS, ESiFSS, and ECiFSS respectively. The best result in each row is highlighted in bold.
From Table 5 we can observe that the Mersenne Twister PRNG and the chaotic tent-map-based PRNG show similar results in all of the considered optimization problems. Notably, the circle and square chaotic mappings can outperform other considered PRNGs in some optimization problems. However, the chaotic tent mapping and Mersenne Twister can produce the most accurate results in more optimization problems. According to Table 3, the chaotic circle mapping is relatively more computationally expensive when compared to the tent map, square map, or nonchaotic PRNGs, including PCG and Mersenne Twister. The logistic map, which outperformed chaos-based PRNGs in Section 3.1, produces less accurate results when used as a PRNG in the fish school search evolution-inspired optimization algorithm with exponential step decay. Most likely, this is due to the different shape of the distribution produced by the logistic-mapping-based PRNG—in ELFSS, the initial positions of agents do not cover the search space uniformly when the algorithm starts. As a result, this negatively affects the accuracy of the obtained solution. The ECFSS algorithm also shows less accurate results in most problems when compared to other algorithms. According to Figure 3c, the probability density curve of the cosine mapping is not symmetric, and this can cause premature convergence to a locally optimal solution as well. In order to further illustrate the convergence process of the considered algorithms, we provide the convergence plots shown in Figure 6.
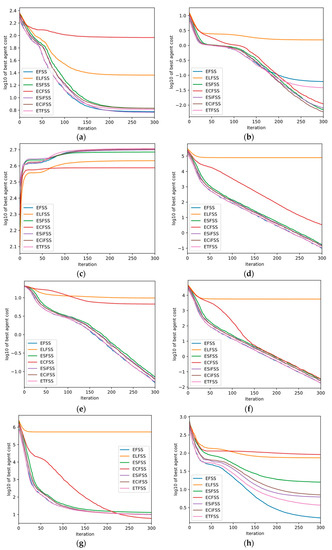
Figure 6.
Convergence curves of chaotic algorithms based on FSS with exponential step decay, optimizing 15-dimensional versions of the respective test functions listed in Table 4: (a) (b) (c) (d) (e) (f) (g) (h) .
The chaotic tent map showed excellent performance in Section 3.1. According to Table 5, the tent-map-based PRNG can produce more accurate results than other considered chaotic mappings. The results produced by the ETFSS algorithm are no worse than the results produced by the EFSS algorithm, which is based on Mersenne Twister. This means that the tent-map-based FSS algorithm is faster than FSS based on Mersenne Twister, without any losses in accuracy.
According to Figure 6, the tent-map-based ETFSS algorithm and EFSS algorithm based on Mersenne Twister show similar results in most optimization problems. In order to verify whether significant statistical differences exist between the EFSS and ETFSS algorithms, we applied the paired Wilcoxon signed-rank test to EFSS and ETFSS with level of significance set to . According to the results, no significant differences between EFSS and ETFSS were found.
3.3. Comparison of FSS with Exponential Step Decay with Original FSS, PSO, and GA
To demonstrate the effectiveness of the proposed modification of fish school search, we implemented such effective optimization algorithms as particle swarm optimization (PSO) and the genetic algorithm with tournament selection (GA). In each algorithm, 100 agents were spawned, and 300 iterations were run. For GA, the mutation probability was set to 0.1, and the crossover probability was set to 0.9. For PSO, the acceleration coefficients were set to 0.8 and 0.5. For the original FSS algorithm, the initial maximum displacements and were set to 7% of the radius of the search region. For the chaotic tent-map-based modified FSS algorithm with exponential step decay, the initial values for and were slightly increased and set to 14% of the radius of the search area. The experiments were evaluated 30 times. We computed such metrics as the mean value, best value, and standard deviation. The benchmark results are shown in Table 6. The convergence curves are shown in Figure 7.
Table 6.
Accuracy comparison of PSO, GA with tournament selection, FSS, and ETFSS on 15-dimensional test functions. The best result in each row is highlighted in bold.
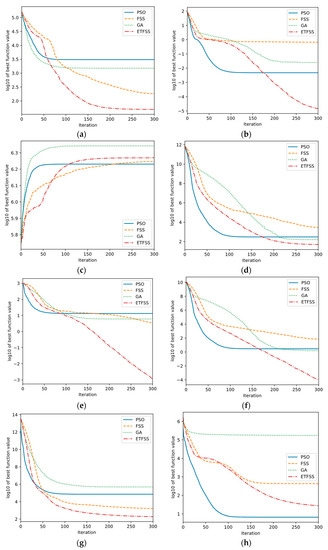
Figure 7.
Convergence curves of PSO, FSS, GA, and ETFSS algorithms optimizing the 15-dimensional versions of test functions listed in Table 4: (a) (b) (c) (d) (e) (f) (g) (h) .
According to the results shown in Table 6, the tent-map-based FSS algorithm with exponential step decay outperforms FSS, PSO, and GA in most cases. The ETFSS algorithm also shows better stability when compared to other considered algorithms. Based on the results provided in Table 6, and the convergence curves shown in Figure 7, we can conclude that the tent-map-based FSS algorithm with exponential step decay outperforms the other considered optimization algorithms in most of the optimization problems listed in Table 4. In several optimization problems, GA and PSO can outperform ETFSS, as shown in Figure 7c,h. However, according to Table 6, the best values obtained by ETFSS are more accurate when compared to the best values obtained by other considered optimization algorithms. Notably, according to the No Free Lunch (NFL) theorem, no universal method exists that can be used for solving all optimization problems [13], although further research could investigate the hybridization problem of ETFSS and GA, or of ETFSS and PSO. The incorporation of the genetic operators and momentum into the ETFSS algorithm could potentially improve the performance of the algorithm as well.
In order to verify these observations, we applied the statistical nonparametric paired Wilcoxon signed-rank test to the ETFSS algorithm and PSO, GA, and FSS. The null hypothesis indicated that no significant statistical differences exist between ETFSS and other optimization algorithms, and the level of significance was set to , which means the 99% confidence level. For 15-dimensional versions of the multidimensional test functions listed in Table 4, the Wilcoxon signed-rank test results are shown in Table 7.
Table 7.
Wilcoxon signed-rank test results applied to ETFSS and other algorithms.
In Table 7, the ‘’ sign indicates that ETFSS outperforms the original algorithm, ‘’ denotes the opposite, and ‘’ indicates that no significant statistical differences exist between the two compared distributions. According to Table 7, the proposed ETFSS shows the best results in most of the considered optimization problems, but not the Styblinsky-Tang function. Despite the fact that generally GA outperforms ETFSS, according to Table 6, the best value obtained by ETFSS is more accurate when compared to that by GA. In order to further demonstrate this, we provide a boxplot of the respective optimized Styblinsky-Tang function values obtained by PSO, FSS, GA, and ETFSS. The boxplot is shown in Figure 8.
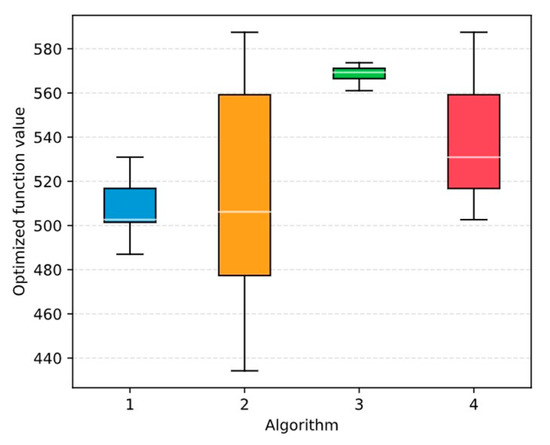
Figure 8.
Boxplot of the solutions obtained by PSO, FSS, GA, and ETFSS optimizing the 15-dimensional version of the multidimensional Styblinsky-Tang test function.
4. Discussion
During the research presented in this paper, we considered a number of dynamical equations, including the logistic map, which has been of great interest among researchers since its first mention in 1976 [30]. We also considered the improved logistic map, proposed in [36], the digital tent map [37], the cosine mapping, and the sine and circle mappings, based on Caputo standard α-family of maps [38]. According to the Lyapunov exponent metric, specific parameter values were selected to make the iterative equations completely chaotic.
The performance of the PRNG used to generate the initial population of solutions and to perform other computations is crucial in evolutionary optimization and especially in swarm intelligence. In Section 3.1, we benchmarked the considered chaotic PRNGs and state-of-the-art PRNGs, such as Mersenne Twister, PCG, and Philox. The logistic map and the tent map showed the best performance. Analysis of the pseudorandom number distributions produced by the chaotic PRNGs showed that only the digital tent map produces uniformly distributed random numbers. We observed that the tent-map-based PRNG can produce more symmetrically and uniformly distributed real numbers when compared to the considered nonchaotic PRNGs. As shown in [46], the digital tent-map-based pseudorandom bit generators (PRBGs) represent a suitable alternative to other traditional low-complexity PRBGs such as the linear feedback shift registers. All these facts allow us to conclude that the use of the tent-map-based PRNG is highly appropriate in evolutionary computation, especially in cases when the performance of an optimization algorithm is of great importance.
We proposed a novel modification of the FSS algorithm, which was originally invented by Bastos-Filho et al. We incorporated exponential step decay into the original FSS algorithm and used different chaotic mappings to generate initial locations of agents in the population and to generate individual and collective-volitive movement vectors. The modified algorithm with exponential step decay based on the chaotic tent map, abbreviated as ETFSS, showed the most promising results in most of the considered optimization problems. The considered multidimensional test functions for optimization, including both unimodal and multimodal functions. We tested the algorithms on the test functions for numerical optimization, including the Rastrigin, Griewank, Sphere, Ackley, and Rosenbrock functions [43], the Schwefel 1.2 and Styblinsky-Tang functions [44], and the Zakharov function [45]. We compared the proposed ETFSS algorithm with the original FSS with linear step decay and with PSO and GA with tournament selection. In order to verify the superiority of ETFSS, we applied the Wilcoxon signed-rank statistical test to the original algorithm and to other considered popular optimization techniques. The obtained results confirmed that ETFSS generally performs better when compared to the original FSS algorithm, PSO, or GA. The incorporation of the chaotic tent mapping reduces the time required for the considered biology-inspired heuristic to converge, and the incorporation of exponential step decay improves the accuracy of the obtained approximately optimal solution. Notably, as shown in [33,47], the incorporation of chaotic mappings into PSO and GA can lead to better exploration and exploitation by the algorithms, resulting in improved accuracy of the obtained solutions.
Further research could cover more chaotic mappings, for example, the Chebyshev map or the Henon map. The incorporation of genetic operators or momentum into the ETFSS algorithm could potentially improve the performance of the ETFSS algorithm as well. As shown in [48], a hybrid algorithm based on PSO and FSS achieved better performance when compared to the original PSO and FSS algorithms used separately. The proposed ETFSS continuous optimization technique can be applied to any problem which can be solved by continuous evolutionary computation, for example, in machine learning or engineering. Finally, the tent-map-based PRNG could be used in order to improve the performance of other optimization algorithms which heavily rely on the performance of the incorporated PRNG, including the binary FSS algorithm [49], GA, PSO, ant colony algorithms, cuckoo search, and others.
Author Contributions
Conceptualization, guidance, supervision, validation L.A.D., software, resources, visualization, testing A.V.G., original draft preparation L.A.D. and A.V.G. All authors have read and agreed to the published version of the manuscript.
Funding
This research received no external funding.
Conflicts of Interest
The authors declare no conflict of interest.
References
- Cagnina, L.; Esquivel, S.; Coello, C. Solving Engineering Optimization Problems with the Simple Constrained Particle Swarm Optimizer. Informatica (Slovenia) 2008, 32, 319–326. [Google Scholar]
- Ponsich, A.; Jaimes, A.L.; Coello, C.A.C. A Survey on Multiobjective Evolutionary Algorithms for the Solution of the Portfolio Optimization Problem and Other Finance and Economics Applications. IEEE Trans. Evol. Comput. 2013, 17, 321–344. [Google Scholar] [CrossRef]
- Bennett, K.; Parrado-Hernandez, E. The Interplay of Optimization and Machine Learning Research. J. Mach. Learn. Res. 2006, 7, 1265–1281. [Google Scholar]
- Sigov, A.; Andrianova, E.; Zhukov, D.; Zykov, S.; Tarasov, I. Quantum informatics: Overview of the main achievements. Russ. Technol. J. 2019, 7, 5–37. (In Russian) [Google Scholar] [CrossRef]
- Goodman, E. Introduction to genetic algorithms. In Proceedings of the Genetic and Evolutionary Computation Conference (GECCO), London, UK, 7–11 July 2007; pp. 3205–3224. [Google Scholar]
- Kennedy, J.; Eberhart, R. Particle Swarm Optimization. In Proceedings of the IEEE International Conference on Neural Networks, Perth, Australia, 27 November–1 December 1995; Volume 4, pp. 1942–1948. [Google Scholar]
- Dorigo, M.; Birattari, M.; Stützle, T. Ant Colony Optimization. IEEE Comput. Intell. Mag. 2006, 1, 28–39. [Google Scholar] [CrossRef]
- Yang, X.; Deb, S. Cuckoo search via Lévy flights. In Proceedings of the 2009 World Congress on Nature & Biologically Inspired Computing, Coimbatore, India, 9–11 December 2009; pp. 210–214. [Google Scholar]
- Reza, A.; Mohammadi, S.; Ziarati, K. A novel bee swarm optimization algorithm for numerical function optimization. Commun. Nonlinear Sci. Numer. Simul. 2010, 15, 3142–3155. [Google Scholar]
- Neri, F.; Cotta, C. Memetic algorithms and memetic computing optimization: A literature review. Swarm Evol. Comput. 2012, 2, 1–14. [Google Scholar] [CrossRef]
- Price, K.; Storn, R.M. Differential Evolution—A Simple and Efficient Heuristic for global Optimization over Continuous Spaces. J. Glob. Optim. 1997, 11, 341–359. [Google Scholar]
- Bastos Filho, C.; Lima Neto, F.; Lins, A.; Nascimento, A.; Lima, M. A novel search algorithm based on fish school behavior. In Proceedings of the 2008 IEEE International Conference on Systems, Man and Cybernetics, Singapore, 12–15 October 2008; pp. 2646–2651. [Google Scholar]
- Wolpert, D.H.; Macready, W.G. No Free Lunch Theorems for Optimization. Trans. Evol. Comput. 1997, 1, 67–82. [Google Scholar] [CrossRef]
- Demidova, L.; Nikulchev, E.; Sokolova, Y. Big Data Classification Using the SVM Classifiers with the Modified Particle Swarm Optimization and the SVM Ensembles. Int. J. Adv. Comput. Sci. Appl. 2016, 7, 294–312. [Google Scholar] [CrossRef]
- Shah, S.; Pradhan, M. R-GA: An Efficient Method for Predictive Modelling of Medical Data Using a Combined Approach of Random Forests and Genetic Algorithm. ICTACT J. Soft Comput. 2016, 6, 1153–1156. [Google Scholar]
- Ganjefar, S.; Tofighi, M. Training qubit neural network with hybrid genetic algorithm and gradient descent for indirect adaptive controller design. Eng. Appl. Artif. Intell. 2017, 65, 346–360. [Google Scholar] [CrossRef]
- Demidova, L.A.; Gorchakov, A.V. Research and Study of the Hybrid Algorithms Based on the Collective Behavior of Fish Schools and Classical Optimization Methods. Algorithms 2020, 13, 85. [Google Scholar] [CrossRef]
- Requena-Perez, M.E.; Albero-Ortiz, A.; Monzo-Cabrera, J.; Diaz-Morcillo, A. Combined use of genetic algorithms and gradient descent methods for accurate inverse permittivity measurement. IEEE Trans. Microw. Theory Tech. 2006, 54, 615–624. [Google Scholar] [CrossRef]
- Akhmedova, S.; Semenkin, E. Co-Operation of Biology Related Algorithms. In Proceedings of the 2013 IEEE Congress on Evolutionary Computation, Cancun, Mexico, 20–23 June 2013; pp. 2207–2214. [Google Scholar]
- Dos Santos, W.; Barbosa, V.; Souza, R.; Ribeiro, R.; Feitosa, A.; Silva, V.; Ribeiro, D.; Covello de Freitas, R.; Lima, M.; Soares, N.; et al. Image Reconstruction of Electrical Impedance Tomography Using Fish School Search and Differential Evolution. In Critical Developments and Applications of Swarm Intelligence; IGI Global: Hershey, PA, USA, 2018. [Google Scholar]
- Bastos Filho, C.; Nascimento, D.O. An Enhanced Fish School Search Algorithm. In Proceedings of the 1st BRICS Countries Congress on Computational Intelligence (BRICS-CCI), Recife, Brazil, 8–11 September 2013; pp. 152–157. [Google Scholar]
- Ananthi, J.; Ranganathan, V.; Sowmya, B. Structure Optimization Using Bee and Fish School Algorithm for Mobility Prediction. Middle-East J. Sci. Res. 2016, 24, 229–235. [Google Scholar]
- Bova, V.; Kuliev, E.; Rodzin, S. Prediction in Intellectual Assistant Systems Based on Fish School Search Algorithm. Izv. Sfedu Eng. Sci. 2019, 2, 34–47. [Google Scholar]
- Carneiro de Albuquerque, I.M.; Monteiro Filho, J.; Lima Neto, F.; Silva, A. Solving Assembly Line Balancing Problems with Fish School Search algorithm. In Proceedings of the 2016 IEEE Symposium Series on Computational Intelligence (SSCI), Athens, Greece, 6–9 December 2016; pp. 1–8. [Google Scholar]
- Bastos Filho, C.; Guimarães, A. Multi-Objective Fish School Search. Int. J. Swarm Intell. Res. 2017, 6, 23–40. [Google Scholar] [CrossRef]
- Filho, J.B.M.; de Albuquerque, I.M.C.; de Lima Neto, F.B.; Ferreira, F.V.S. Optimizing multi-plateau functions with FSS-SAR (Stagnation Avoidance Routine). In Proceedings of the 2016 IEEE Symposium Series on Computational Intelligence (SSCI), Athens, Greece, 6–9 December 2016; pp. 1–7. [Google Scholar]
- Wichmann, B.; Hill, D. Algorithm AS 183: An Efficient and Portable Pseudo-Random Number Generator. J. R. Stat. Soc. Ser. C (Appl. Stat.) 1982, 31, 188–190. [Google Scholar] [CrossRef]
- Matsumoto, M.; Nishimura, T. Mersenne Twister: A 623-Dimensionally Equidistributed Uniform Pseudo-Random Number Generator. ACM Trans. Model. Comput. Simul. 1998, 8, 3–30. [Google Scholar] [CrossRef]
- Alawida, M.; Samsudin, A.; Teh, J.S.; Alshoura, W.H. Digital Cosine Chaotic Map for Cryptographic Applications. IEEE Access 2019, 7, 150609–150622. [Google Scholar] [CrossRef]
- May, R. Simple Mathematical Models With Very Complicated Dynamics. Nature 1976, 261, 459–467. [Google Scholar] [CrossRef] [PubMed]
- Guyeux, C.; Wang, Q.; Bahi, J.M. A Pseudo Random Numbers Generator Based on Chaotic Iterations: Application to Watermarking. WISM 2010 Lect. Notes Comput. Sci. 2010, 6318, 202–211. [Google Scholar]
- Hobincu, R.; Octaviana, D. A Novel Chaos Based PRNG Targeting Secret Communication. In Proceedings of the 2018 International Conference on Communications (COMM), Bucharest, Romania, 14–16 June 2018; pp. 459–462. [Google Scholar]
- Ma, Z.; Yuan, X.; Han, S.; Sun, D.; Ma, Y. Improved Chaotic Particle Swarm Optimization Algorithm with More Symmetric Distribution for Numerical Function Optimization. Symmetry 2019, 11, 876. [Google Scholar] [CrossRef]
- Ma, H.; Wang, Y. An Artificial Fish Swarm Algorithm Based on Chaos Search. In Proceedings of the 2009 Fifth International Conference on Natural Computation, Tianjin, China, 14–16 August 2009; Volume 4, pp. 118–121. [Google Scholar]
- El-Shorbagy, M.; Mousa, A.; Nast, S. A chaos-based evolutionary algorithm for general nonlinear programming problems. Chaos Solitons Fractals 2016, 85, 8–21. [Google Scholar] [CrossRef]
- Wu, Y.; Zhao, Q.; Feng, W. Fault Diagnosis Method of Generator Based on Mutative Scale Chaos Combined Clustering and Feature Fusion. In Proceedings of the 2013 International Conference on Electrical and Information Technologies for Rail Transportation (EITRT2013), Changchun, China, 25–27 October 2013; Lecture Notes in Electrical Engineering; Springer: Berlin/Heidelberg, Germany, 2013; Volume 287, pp. 119–128. [Google Scholar]
- Borcherds, P.H.; McCauley, G.P. The digital tent map and the trapezoidal map. Chaos Solitons Fractals 1993, 3, 451–466. [Google Scholar] [CrossRef]
- Edelman, M. Caputo standard α-family of maps: Fractional difference vs. fractional. Chaos Interdiscip. J. Nonlinear Sci. 2014, 24, 23–137. [Google Scholar]
- Salmon, J.K.; Moraes, M.A.; Dror, R.O.; Shaw, D.E. Parallel Random Numbers: As Easy as 1, 2, 3. In Proceedings of the 2011 International Conference for High Performance Computing, Networking, Storage and Analysis, Seatle, WA, USA, 12–18 November 2011; pp. 1–12. [Google Scholar]
- O’Neill, M.E. PCG: A Family of Simple Fast Space-Efficient Statistically Good Algorithms for Random Number Generation. 2014. Available online: https://www.cs.hmc.edu/tr/hmc-cs-2014-0905.pdf (accessed on 4 April 2020).
- Parks, P.A.M. Lyapunov’s stability theory—100 years on. IMA J. Math. Control Inf. 1992, 9, 275–303. [Google Scholar] [CrossRef]
- Van der Walt, S.; Colbert, S.C.; Varoquaux, G. The NumPy Array: A Structure for Efficient Numerical Computation. Comput. Sci. Eng. 2011, 13, 22–30. [Google Scholar] [CrossRef]
- Hussain, K.; Salleh, M.; Cheng, S.; Naseem, R. Common Benchmark Functions for Metaheuristic Evaluation: A Review. Int. J. Inform. Vis. 2017, 1, 218–223. [Google Scholar] [CrossRef]
- Jamil, M.; Yang, X.S. A Literature Survey of Benchmark Functions for Global Optimization Problems. Int. J. Math. Model. Numer. Optim. 2013, 4, 150–194. [Google Scholar]
- Dongping, T. Particle Swarm Optimization with Chaotic Maps and Gaussian Mutation for Function Optimization. Int. J. Grid Distrib. Comput. 2015, 8, 123–134. [Google Scholar]
- Addabbo, T.; Alioto, M.; Fort, A.; Rocchi, S.; Vignoli, V. The Digital Tent Map: Performance Analysis and Optimized Design as a Low-Complexity Source of Pseudorandom Bits. IEEE Trans. Instrum. Meas. 2006, 55, 1451–1458. [Google Scholar] [CrossRef]
- Snaselova, P.; Zboril, F. Genetic Algorithm Using Theory of Chaos. Procedia Comput. Sci. 2015, 51, 316–325. [Google Scholar] [CrossRef]
- Cavalcanti-Júnior, G.M.; Bastos-Filho, C.J.A.; Lima-Neto, F.B.; Castro, R.M.C.S. A Hybrid Algorithm Based on Fish School Search and Particle Swarm Optimization for Dynamic Problems. In Advances in Swarm Intelligence, ICSI 2011; Tan, Y., Shi, Y., Chai, Y., Wang, G., Eds.; Lecture Notes in Computer Science, 6729; Springer: Berlin/Heidelberg, Germany, 2011. [Google Scholar]
- Sargo, J.A.G.; Vieira, S.M.; Sousa, J.M.C.; Filho, C.J.A.B. Binary Fish School Search applied to feature selection: Application to ICU readmissions. In Proceedings of the IEEE International Conference on Fuzzy Systems (FUZZ-IEEE), Beijing, China, 6–11 July 2014; pp. 1366–1373. [Google Scholar]


© 2020 by the authors. Licensee MDPI, Basel, Switzerland. This article is an open access article distributed under the terms and conditions of the Creative Commons Attribution (CC BY) license (http://creativecommons.org/licenses/by/4.0/).