Article

Numerical Study of Bubble Behavior under Gradient Flows during Subcooled Flow Boiling in Vertical Flow Channel

by
SalaiSargunan S Paramanantham
,
Dong-Hyun Kim
and
Warn-Gyu Park
*
School of Mechanical Engineering, Pusan National University, Busan 46241, Korea
*
Author to whom correspondence should be addressed.
Symmetry 2020, 12(4), 611; https://doi.org/10.3390/sym12040611
Submission received: 12 March 2020 / Revised: 31 March 2020 / Accepted: 5 April 2020 / Published: 12 April 2020
(This article belongs to the Special Issue Fluid Mechanics Physical Problems and Symmetry)

Abstract

:
In this study, we examined the condensing behavior of single and multiple bubbles of pure steam in a subcooled liquid phase using a fully compressible two-phase homogeneous mixture method that is solved by an implicit dual-time preconditioned technique. The interface between the liquid and vapor phases was determined by the advection equations using a compressive high-resolution interfacing capturing method. The spurious current reduced near the interface, a smoothing filter is applied to the progress curvature calculation. The sensitivity study carried out to predict the empirical constant by using Lee’s mass transfer model. A comparison of the numerical and experimental results highlighted that the proposed model accurately predicted the behavior of the definite condensing bubble. Furthermore, the single and multiple bubble condensation behaviors were investigated for different initial subcooled temperatures, and bubble diameters under various gradient flow, such as velocity gradient, temperature gradient, and velocity and temperature gradients. Subsequently, the effect of multiple bubbles flows in different bubble pattern forms, and their condensation was studied. The coalescence of bubbles depends on the subcooled temperature. Furthermore, the bubble diameter, the gap between the bubbles, and the flow rate of the bubbles were also observed.

1. Introduction

Heat transfer characteristics in bubble dynamics are essential phenomena in the design of nuclear reactors, boilers, and cooling system in electronic devices. Existence of vapor bubbles impacts the heat transfer phenomena, pressure drop, and flow instability. Heat transfer characteristics are highly pronounced under subcooled boiling flow conditions, and hence, the knowledge of bubble dynamics is crucial during the design of several industrial applications.
Nowadays, this research is focused on theoretical study, experimental analysis, and numerical simulation of the application, as mentioned above (bubble condensation in subcooled flow boiling). Theoretical studies were conducted [1] and [2] on stationary and dynamic bubble condensation. In the last two decades, the technological improvements in the measuring and monitoring instruments used in bubble experiments have caused an increase in the knowledge of bubble behavior. Significant research progress has been experimentally made to understand the bubble behavior in terms of bubble size history, shape, velocity, and collapse time. Furthermore, the interfacial heat transfer coefficient was investigated under high-pressure/temperature conditions [3,4,5] and low-pressure conditions [6,7,8]. It is difficult to obtain vital information on bubble behavior because their shape and interfacing area are too complicated for measurement. Furthermore, bubble growth and condensation occur in less than a microsecond; thus, they are challenging to investigate. Therefore, numerical simulation is regarded as the only method that can be employed to overcome such difficulties.
Condensation of a pure single steam bubble [9,10,11,12,13,14,15,16] and a mixture bubble [17,18] have been studied extensively. Several researchers computationally investigated the bubble nucleation, growth, departure, film- and flow boiling, and condensation [19,20,21]. The simulation performed [22] focused on bubble behaviors under low- and high-pressure, different bubble sizes, and different subcooled temperatures; and compared different velocities and bubble lives for a single bubble. Moreover, simulation of multi-bubble behavior (under different gaps between bubbles, different bubble sizes, and different velocities) and validation of the surface tension force using a square droplet were performed. However, only very few simulations have been conducted for the multi-bubble study [22,23,24,25]. Furthermore, multi-bubble behaviors under various gradient flow conditions have not been studied. Therefore, considering the perspectives mentioned above, the numerical simulation in this study focused on single- and multi-bubble condensation flow under velocity and temperature gradients. For simulating the gradient flow condensation, we used to apply different operating conditions, such as different bubble diameters, subcooled temperatures, velocities, and different multi-bubble pattern arrangements.
The in-house code for the condensation model is validated using a vapor bubble condensed in liquid [22]. A compressive interface-capturing scheme was applied in the simulation for interfacing the liquid and vapor phases. A detailed review of the advantages and disadvantages of this scheme was conducted [26,27,28,29]. The proposed model was further validated using experimental data and numerical results of cavitation. While numerically analyzing the flow with low Mach number, the preconditioning method improves the numerical stability and reduces the computational time [30,31,32,33,34]. For analysis the cavitation and flashing phenomena in the convergent divergent nozzle, the compressible homogeneous mixture model and a dual-time preconditioned approach is used for the calculation of the empirical constant range [35]. S Paramanantham et al. [22] extended the same computation method for bubble condensation using a vertical channel that was simulated. This prediction was successfully validated using the experimental data. Using the same method, Phan et al. [36] analyzed the air-steam mixture condensation flows in a vertical tube with different air–steam mixture flow conditions.

2. Geometrical Configuration

In this simulation, we considered the vertical rectangular channel geometrical models for the bubble rod condensation problem. The two-dimensional (2D) computational domain of the geometrical model was 10 × 20 mm, as shown in Figure 1a. In the vertical flow channel, the bubble rod was discharged from the bottom of the channel. We investigated the effect of bubble behavior and various phenomena under different flow conditions. We considered the applied velocity at the inlet, extrapolation pressure at the exit, and sides of the domain as a slip wall to be the boundary conditions in this simulation.

3. Mathematical Formulation

3.1. Governing Equations

In this numerical simulation, a fully compressible two-phase homogeneous mixture approach is used to model the direct contact condensation process of pure bubble condensation flows in subcooled water. For a two-dimensional axisymmetric and planer flow, the approach consists of a compressible Reynolds Averaged Navier–Stokes (RANS) system of equations. It is established on a mass conservation equation for the individual phase (water & steam), and a momentum and energy conservation equation for the mixture phase model consists of five conservative equations. A condensation mass transfer model is employed to simulate the process of mass and energy transfer across interfaces. For two-dimensional flows, dimensionless forms of these governing equations are written in generalized coordinates ( ξ , η ) as follows:
Γ e Q ^ t + Γ Q ^ τ + ( E ^ E ^ v ) ξ + ( F ^ F ^ v ) η = S ^ + σ k ( H ^ ξ ξ + H ^ η η )
Q ^ = 1 J ( p u v T Y v ) ,   E ^ = 1 J ( Y L ρ U ρ u U + ξ x p ρ v U + ξ y p ρ h t U Y v ρ U ) , F ^ = 1 J ( Y L ρ V ρ u V + η x p ρ v V + η y p ρ h t V Y v ρ V )
E ^ v = 1 J ( 0 ξ x τ x x + ξ y τ x y ξ x τ y x + ξ y τ y y ξ x b x + ξ y b y 0 ) , F ^ v = 1 J ( 0 η x τ x x + η y τ x y η x τ y x + η y τ y y η x b x + η y b y 0 )
H ^ ξ = 1 J ( 0 ξ x α v ξ y α v 0 0 ) ,   H ^ η = 1 J ( 0 η x α v η y α v 0 0 ) ,   S ^ = 1 J ( m ˙ C a Y L ρ v / y ρ g x ( ρ u v τ x y ) / y ρ g y ( ρ v 2 τ y y ) / y m ˙ h l v + ( u τ x y + v τ y y ρ h t v q y ) / y m ˙ C a Y v ρ v / y )
b x i = u j τ x i x j q x i q x = λ ( ξ x ξ T + η x η T ) q y = λ ( ξ y ξ T + η y η T )
U = ξ x u + ξ y v ,   V = η x u + η y v
α v = Y v ρ L ρ v 1 ( Y v ρ v ( ρ v ρ L ) ) ,   α v + α L = 1 ,   Y v = α v ρ v ρ ,   Y v + Y L = 1
where x and y denote the Cartesian coordinates; p denotes the pressure; u and v denote the velocity components in the x- and y-directions, respectively; T denotes the temperature; Y is denotes mass fraction; m ˙ is the condensation rate; ξ and η denote the generalized coordinates; Q ^ and S ^ are the vector of the primitive variables and Source term, respectively; E ^ and F ^ denote the flux terms; E ^ v and F ^ v denote the viscous terms; h, ht and hlv denote the mixture enthalpy, the total enthalpy and the latent heat of evaporation, respectively; g, ρ, µ, and α are the gravity, mixture density, mixture viscosity and void fraction, respectively; σ denotes surface tension coefficient and k denotes the surface curvature; and subscripts v denotes the steam and L denotes water, respectively. The factor C a denotes whether the governing equations are written for planar flow ( C a = 0) or axisymmetric flow ( C a = 1). τ is the pseudo-time and J denotes the Jacobian matrix:
The mixture properties, i.e., density, viscosity, enthalpy, thermal conductivity, specific heat, and Prandtl number are given in S Paramanantham et al. [22]. The properties of water and steam were estimated by employing the IAPWS-97 (International Association for the Properties of Water and Steam) database [37].
The flux Jacobian, Γ e , and the preconditioning matrix, Γ , are defined as:
Γ e = [ Y L p ρ 0 0 Y L T ρ ρ + Y L Y v ρ u p ρ ρ 0 u T ρ u Y v ρ v p ρ 0 ρ v T ρ v Y v ρ h t p ρ ρ u ρ v h t T ρ h t Y v ρ + ρ p h + ρ T h + ρ Y v h Y v p ρ 0 0 Y v T ρ ρ + Y v Y v ρ ]
and
Γ = [ Y L p ρ 0 0 Y L T ρ ρ + Y L Y v ρ u p ρ ρ 0 u T ρ u Y v ρ v p ρ 0 ρ v T ρ v Y v ρ h t p ρ ρ u ρ v h t T ρ h t Y v ρ + ρ p h + ρ T h + ρ Y v h Y v p ρ 0 0 Y v T ρ ρ + Y v Y v ρ ]
A study [22] provided the derivatives of mixture enthalpy, density, and other quantities in Equations (8) and (9).
The interfacial tension force was applied as a continuous surface force based on Brackbill et al., method [38]. The curvature is defined as:
k ˜ = . ( α | α | ) = . n ^ = ( n ^ x y + n ^ y y )
where n ^ is the unit normal vector to the interface:
n ^ = α L | α L |
The governing equations are coupled to the system of interface advection equation for the volume fraction of the vapor phase to capture the interface between the phases (liquid–vapor). The interface advection equation for the volume fraction of steam is given in Ha et al. [39].
The simplified saturation model developed by Lee was used for the condensation and evaporation processes [40]. The mass transfer is considered to occur at constant pressure, and quasi-thermal-equilibrium state, which gives the relationship described in the Equation (12).
m ˙ = C R V ρ v α v max ( 1 T / T s a t , 0 )
where C R V = C R V D / U is the empirical scaling constant calculated using the mass transfer intensity factor.

3.2. Numerical Method

Implementation of the dual-time preconditioned system in the numerical method is established based on the references [26] and [31]. The discretization form of Equation (1) is given as follows:
[ I + Γ s 1 ( ξ Γ A ˜ + + ξ Γ A ˜ + η Γ B ˜ + + η Γ B ˜ ) ] n + 1 , m   Δ Q ^ n + 1 , m = Γ s 1 R ^ n + 1 , m
where I denote the identity matrix Γ s = Γ / Δ τ + 1.5 Γ e / Δ t ; Δ denotes the first-order forward differencing; denotes the first-order backward differencing; Δ Q ^ n + 1 , m = Q ^ n + 1 , m Q ^ n + 1 , m Δ superscripts n+1 denotes the new physical-time level; the superscript m and m+1 denote the actual and the new pseudo-time-levels; Δt is the physical time-step; Δτ is the pseudo-time-step; and R ^ n + 1 , m is the residual. For simplification, the superscript n+1, m is denoted as m. R ^ is the residual represented as follows:
R ^ m = Γ e Q ^ m 4 Q ^ n + Q ^ n 1 2 Δ t + ( E ^ i + 1 / 2 E ^ i 1 / 2 + F ^ j + 1 / 2 F ^ j 1 / 2 ) m ( E ^ v i + 1 / 2 E ^ v i 1 / 2 + F ^ v j + 1 / 2 F ^ v j 1 / 2 ) m S ^ m
Time discretization is approximated by using the second-order backward difference method, physical- and pseudo-time derivatives are approximated with first-order backward differences. By using the MUSCL (Monotonic Upstream-Centered) upwind scheme, approximated for the spatial discretization and the inviscid terms. The second-order central differencing scheme applied to discretized for viscous and surface tension terms.

4. Numerical Results and Discussions

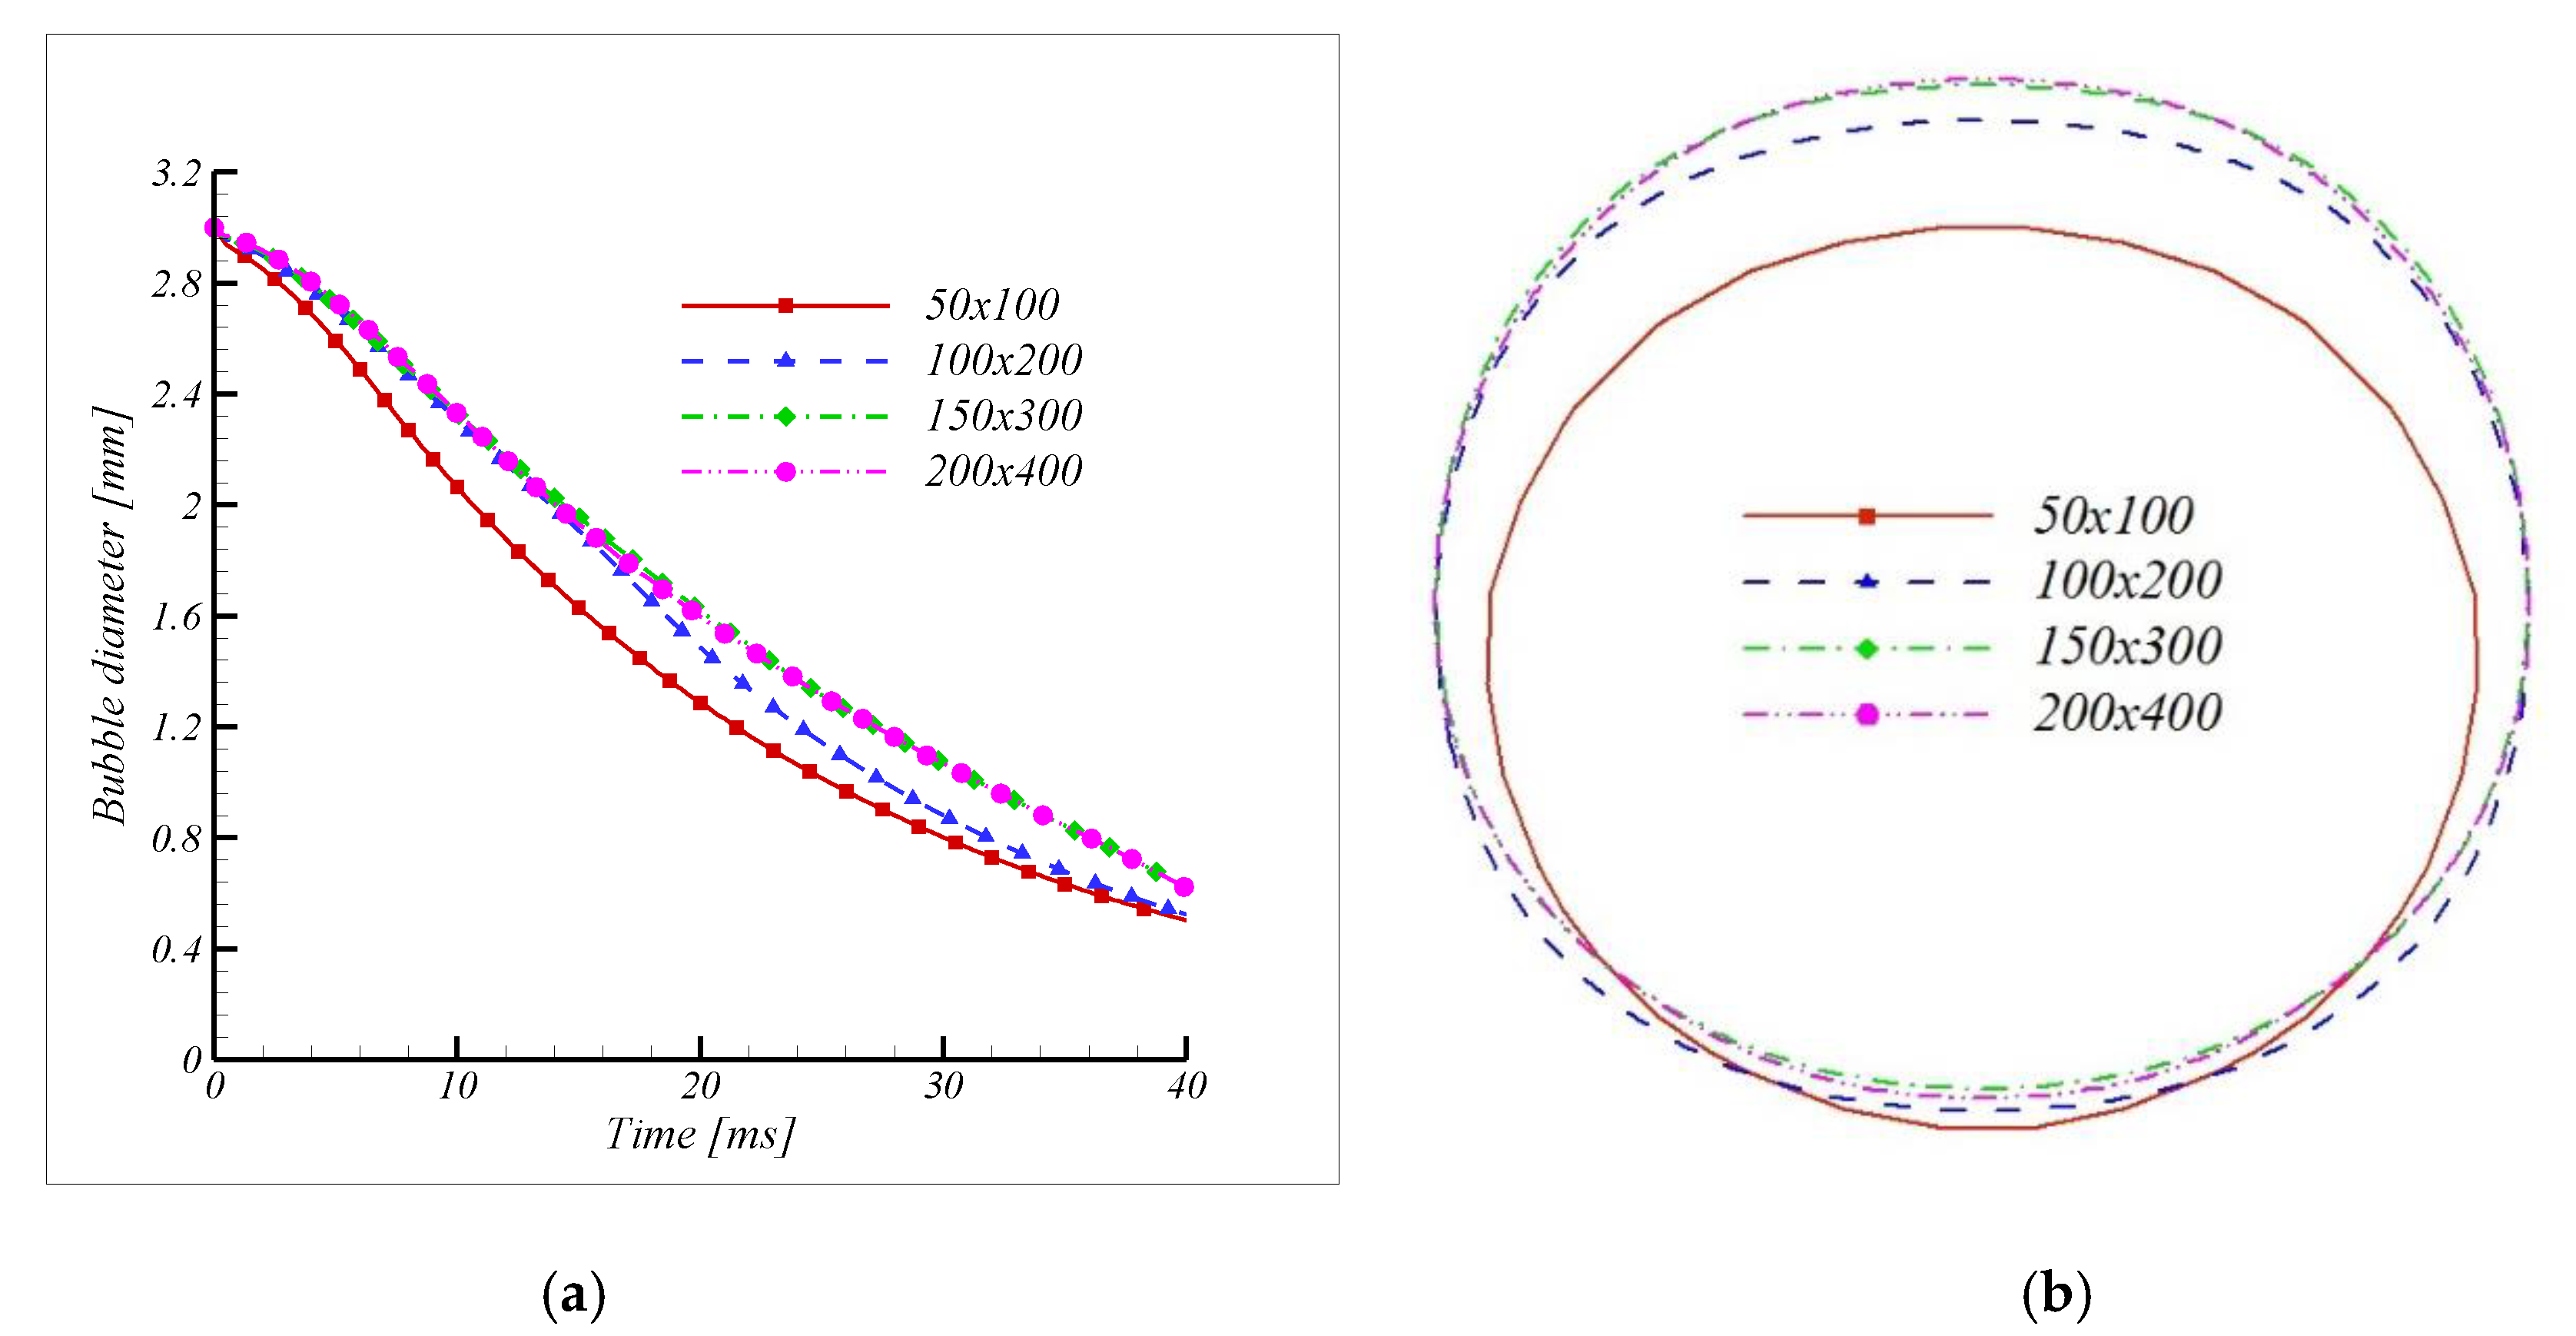
4.1. Geometrical Model Validation

In this case, the liquid temperature (Tliquid) of the whole domain of the channel is defined from lower than the saturation temperature (Tliquid = Tsat − ΔT). To acquire the grid resolution using Figure 1a, the initial bubble diameter of 4 mm, and the subcooled temperature (ΔT = 10 K) and velocity (u = 0.3 m/s) are plotted in Figure 2. Four types of grid densities were considered: 50 × 100, 100 × 200, 150 × 300, and 200 ×400. Among the tested grid types, the 150 × 300 and 200 × 400 grids showed similarities in the bubble diameters and shapes, as shown in Figure 2a,b, respectively, for the range of grid sizes showing satisfactory convergence. Thus, in this study, the bubbles were resolved using the 150 × 300 grid size. This grid arrangement was used to obtain the results presented in this study.
Figure 3b–d show the velocity gradient, temperature gradient, and velocity and temperature gradient flow geometry used in this simulation. Figure 3 shows the arrangement for various patterns of the multi-bubble form in the vertical channel. Moreover, this multi-bubble has been tested in the gradient flow corresponding to Figure 3b–d.

4.2. Mass Transfer Coefficient

The condensation constant (CRV) in the Lee phase change model [40] is essential for the prediction of a suitable value by comparing the bubble condensing behaviors while varying the CRV, as shown in Figure 4. A CRV value of 1750 is appropriate for this simulation, which is comparable to the experimental results reported by Kim and Park [6].
A suitable value of the condensation constant defines the amount of the vapor phase converted into the liquid phase at the interface. The result shows that the bubble life history derived from the numerical results is highly sensitive to the condensation coefficient, and the Lee phase transfer model is that the condensation constant is a function of pressure and temperature. Figure 5a,b show comparisons of the experimental and numerical results of this study in terms of bubble volume and bubble surface area. The numerical results were found to be in good agreement with the experimental results. In this report, we assumed the constant empirical coefficient (CRV = 1750) for all simulation conditions. The relative difference between the numerical result and experimental data at different averaged time steps is approximately 2.18%.
Figure 6 shows a comparison of the experimental results and the present numerical results for the bubble shapes. The bubble rising behavior is numerically calculated with a two-dimensional axisymmetric assumption. The bubble surface tension is calculated using the continuous surface force method. On using continuous surface force method, even surface force applied on the surface of the bubble. Therefore, even though the initial square droplet relaxed to the equilibrium circular shape after some time [22]. Due to these assumptions, a considerable difference between experimental and numerical results of a bubble shape.

4.3. Single-Bubble Rising Behavior

We performed an analysis of the single-bubble condensation behavior under different gradient conditions, such as velocity gradient, temperature gradient, and velocity and temperature gradients, as shown in Figure 1.

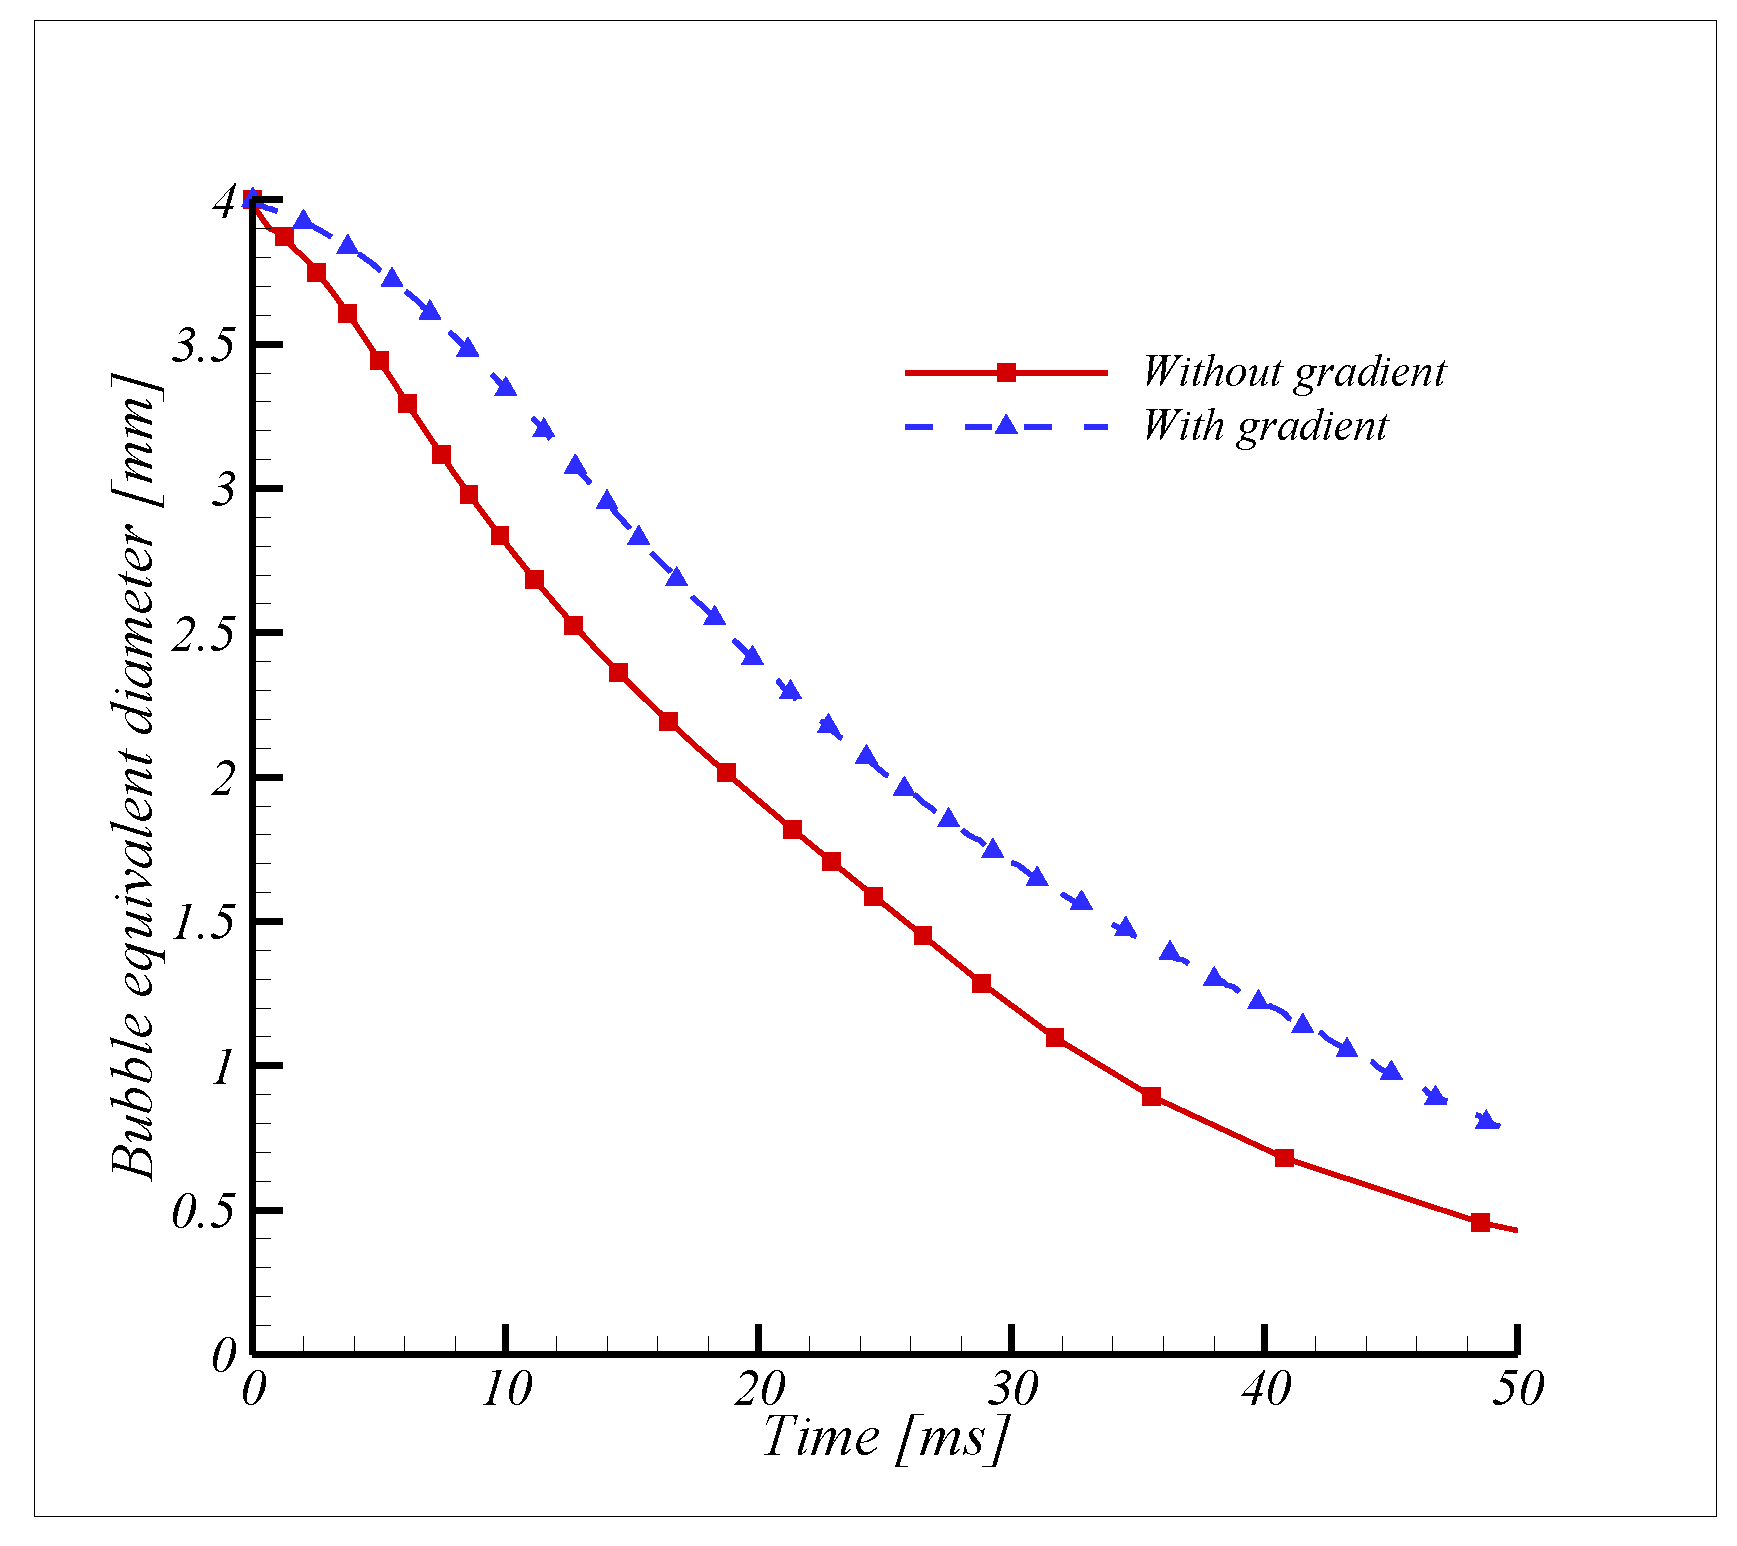
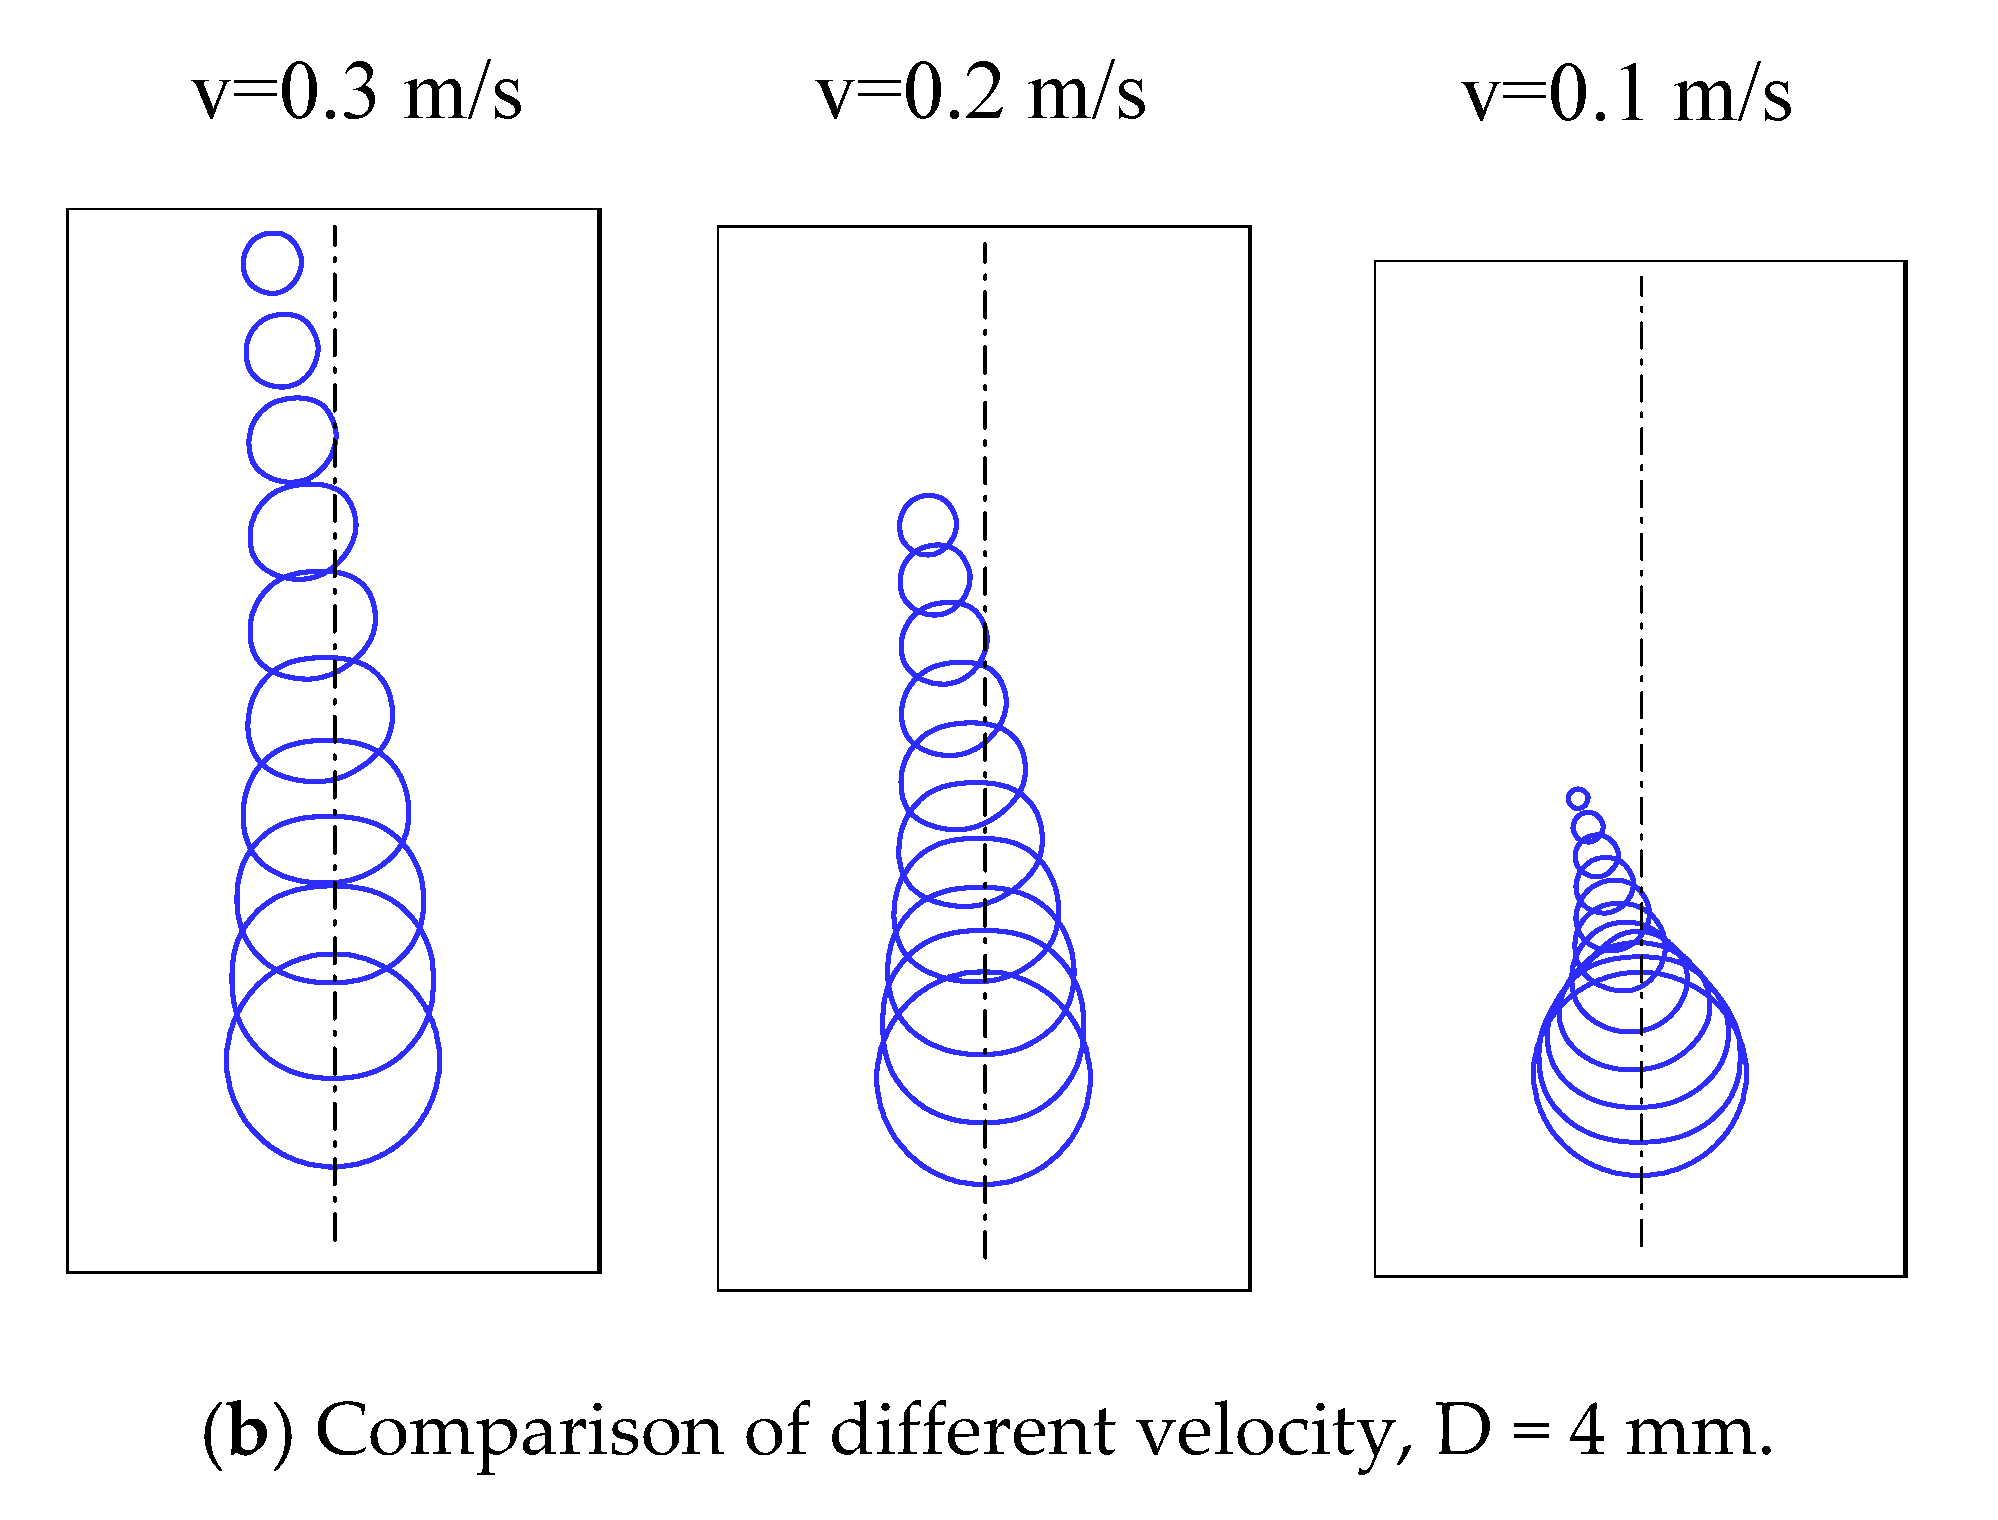
4.3.1. Velocity Gradient Flow

To study the effect of condensing bubble-moving trajectory under the velocity gradient flow, we used the computational 2D bubble released at the bottom of the vertical channel, and the flow direction was upward. A bubble is simulated in a subcooled liquid with a linear velocity gradient at the inlet, as shown in Figure 1b and test conditions are listed in Table 1. Figure 7a–d shows the simulated moving path of the bubble and its shape change under the velocity gradient with different scenarios. Figure 7a shows the bubble diameter, D of 2 mm and linear velocity gradient values, vmin and vmax of 0.1 m/s and 0.3 m/s, respectively. The moving bubble path change occurred in a significant amount, but it is negligible, and bubble condensed.
Moreover, increasing the subcooled temperature with the velocity gradient flow ensures that the moving bubble path is approximately on the bubble axis. The bubble moving path may exist in the liquid depending on the bubble shape and deformation of the bubble by interaction with the surrounding liquid. The influence of the surface tension is large enough in this small bubble size to restrict the changes in the shape. Thus, a small-sized bubble will rise vertically under the liquid velocity gradient.
Furthermore, noticeable changes in the bubble shape and moving path were observed for larger bubble sizes with diameters of 3 mm and 4 mm. Figure 7b,c illustrates that the condensing bubble shape changes from spherical to ellipsoidal via a wing shape and finally retained its original shape. It was observed that in the velocity gradient flow, migrating bubbles did not move across the sides more than the bubble radius distance. If the subcooled temperature is increased, the bubble will move closer to a lower velocity region. As a result, bubble condensation accelerates the crosswise migrating bubble in the surrounding liquid. Decreasing the velocity gradient and increasing the subcooled temperature tend to restrict the migrating bubble. It moves approximately in a vertical line for a bubble diameter, D of 4 mm and linear velocity gradient values, vmin and vmax of 0.05 m/s and 0.15 m/s, respectively, as shown in Figure 7d. Commonly, the bubble shape is restrained by the buoyant force, surface tension, and the surrounding liquid’s inertial force, and the condensation rate. The existence of the velocity gradient modifies the inertial force, which successively influences the bubble shape, condensation rate, and bubble trajectory. Figure 8 shows the comparison of bubble condensing life under with velocity gradient and uniform velocity flow in ΔT = 5 K. the condensation rate majorly affected in the velocity gradient compared with uniform flow. In the velocity gradient flow, inertial force is increasing the bubble life, i.e., the rate of condensation is reduced.

4.3.2. Temperature Gradient Flow

The effect of the local condensation rate and the bubble surface is simulated, as shown in Figure 1c and test condition are listed in Table 2, to examine the influence of the linear temperature gradient on liquid flow in the bubble condensation channel.
Figure 9a shows the predicted sizes of the bubble diameter. The bubble rate of condensation on the right side of the bubble interface area is more significant than the left side because of the local liquid temperature difference, which results in an asymmetrical shape of the migrating bubble. Nevertheless, this study shows that the effect of the local condensation rate does not affect bubble deformation because a negligible amount of deformation occurs. As shown in Figure 9b the initial normal velocity does not affect bubble deformation in the temperature gradient part of the simulation.

4.3.3. Velocity and Temperature Gradient Flow

The simultaneous effect of the temperature and velocity gradients is examined in this section. Figure 10 shows the condensation and deformation of the bubble in liquid along with the temperature and velocity gradients, as shown in Figure 1d and test conditions are lists in Table 3. The migrating bubble generated a sinuous path for the larger bubble and a negligible path for the smaller bubble. Although the velocity gradient dominates in the flow, the bubble moves to a higher temperature region due to the high condensation rate in the temperature gradient. The velocity and temperature gradients show that the lateral migrating bubble can significantly affect the bubble lifetime.

4.4. Multi-Bubble Rising Behavior in the Gradient Flow

Figure 1b–d show the analysis results of a multi-bubble condensation behavior under different gradient conditions, such as velocity, temperature, and velocity and temperature gradients. Compared to a single bubble condensation, the multi-bubble simulation is more complicated because it contains numerous physical phenomena that occurred, such as bubble coalescence, and it makes rapid and continuous shape changes. For examined these behaviors, and along with well as the effect of gradient under different bubble patterns such as two similar and dissimilar bubbles in a row with and without gradient flow, three similar bubbles in a row with and without gradient flow, and three similar bubbles in a triangular shape and delta shape with and without gradient flow, as shown in Figure 3. The following analyses were performed to investigate the multi-bubble rising behavior with mass transfer simulation: (1) Two-bubble rising behavior, (2) Three-bubble rising behavior.

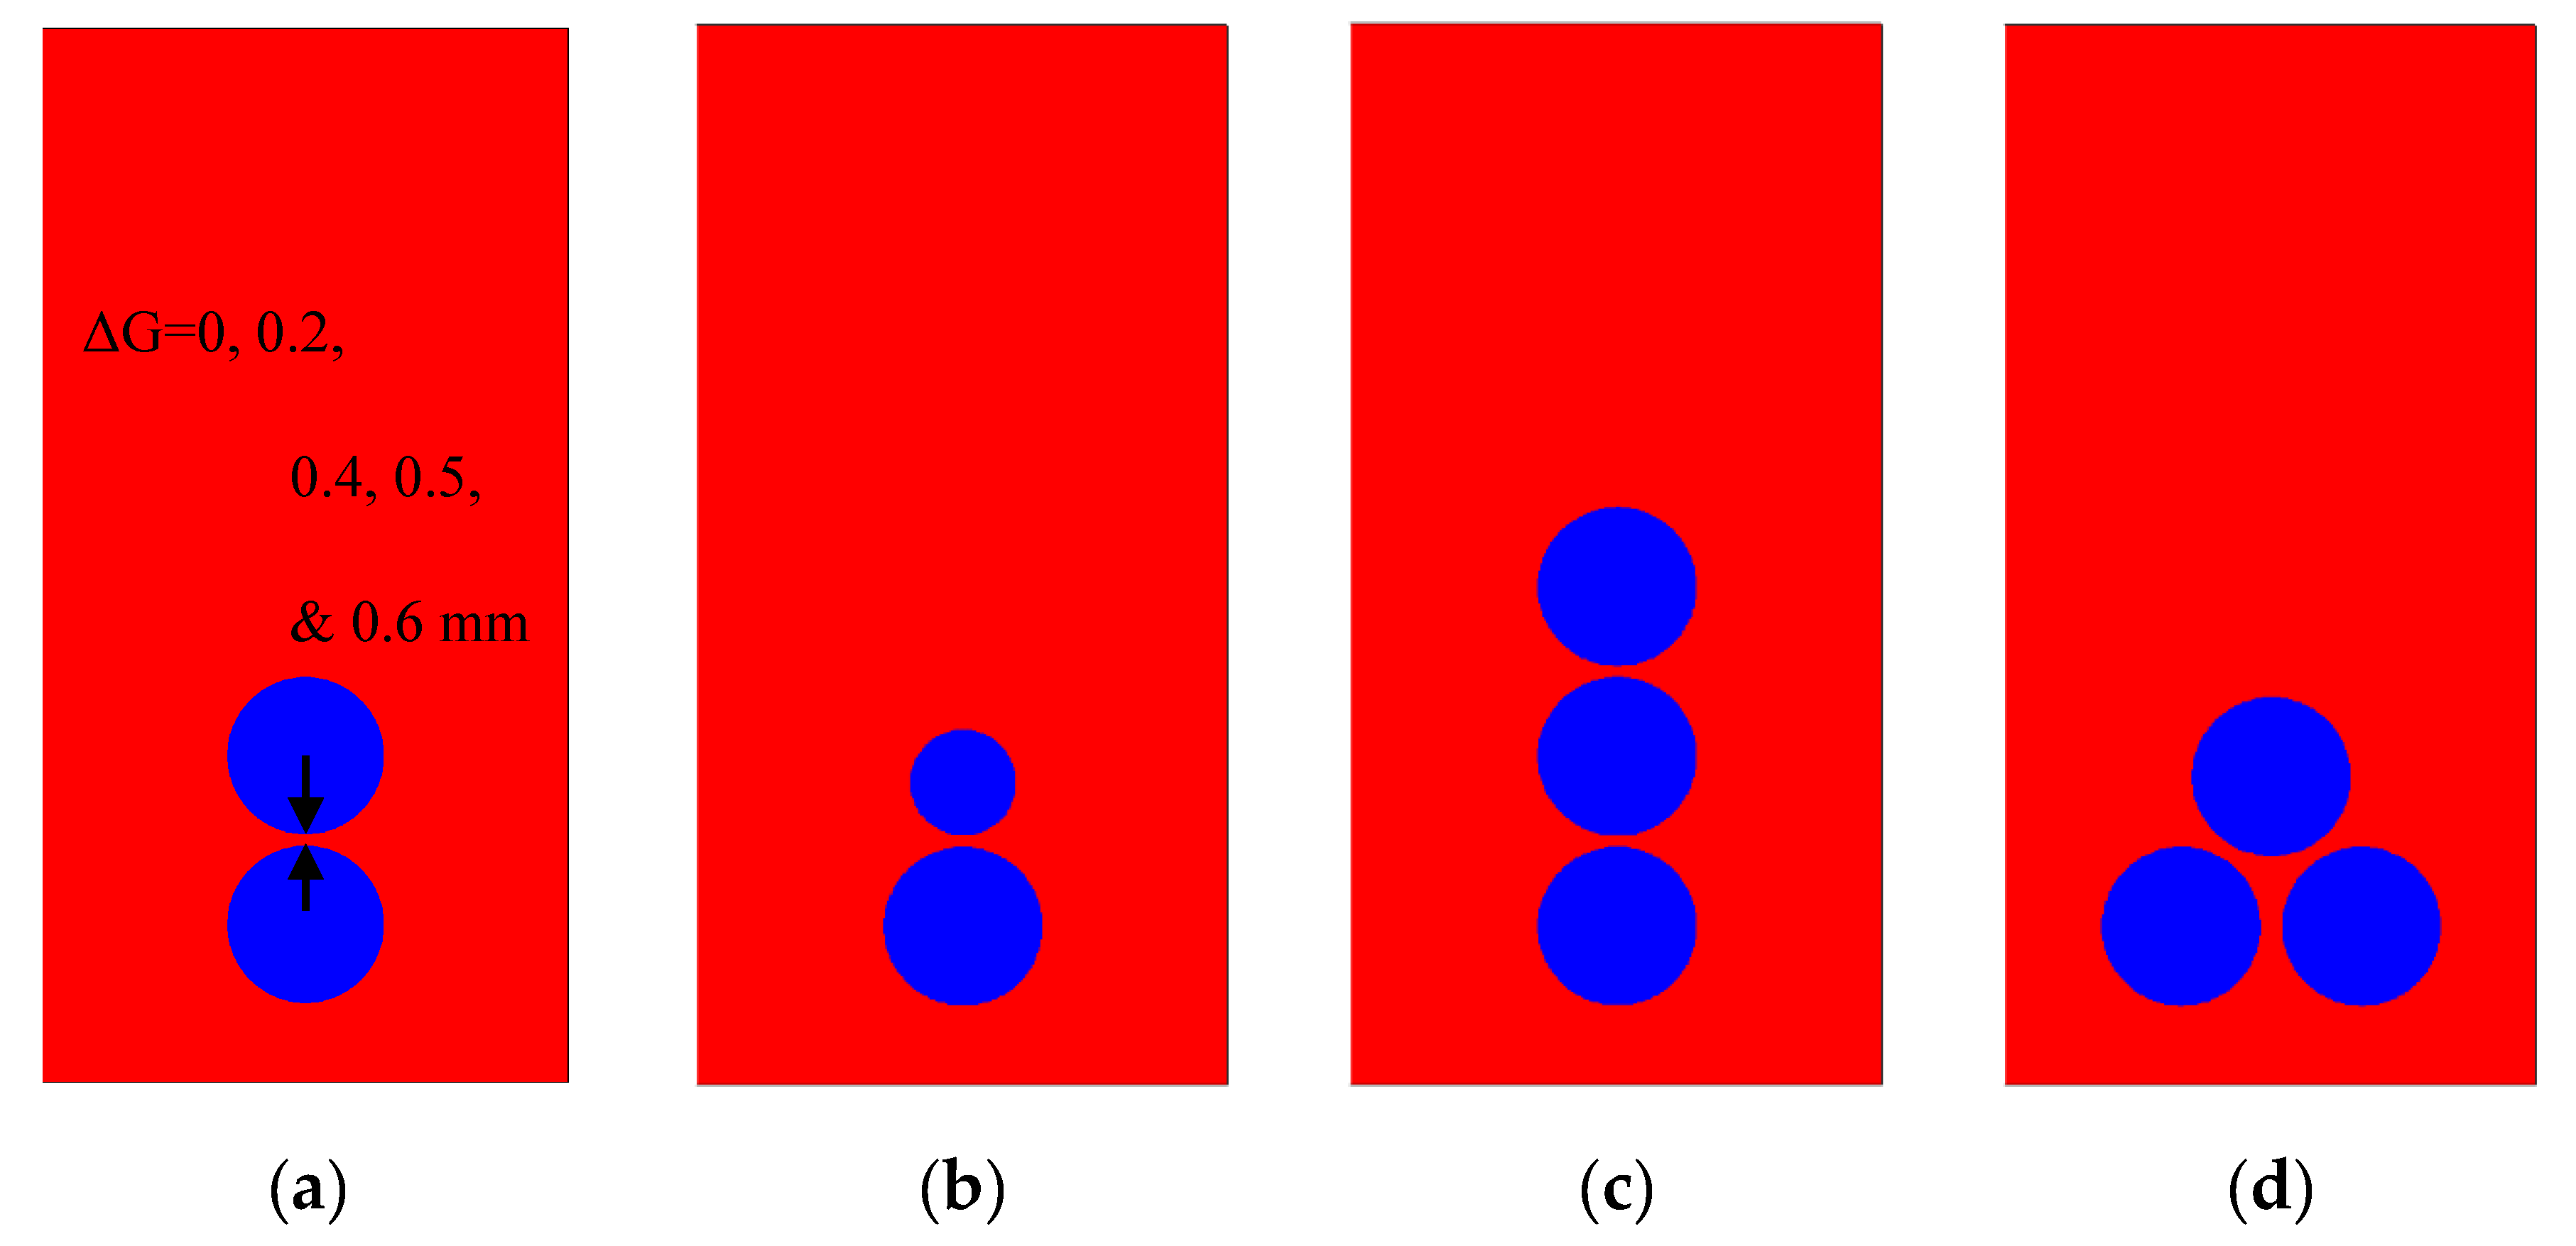
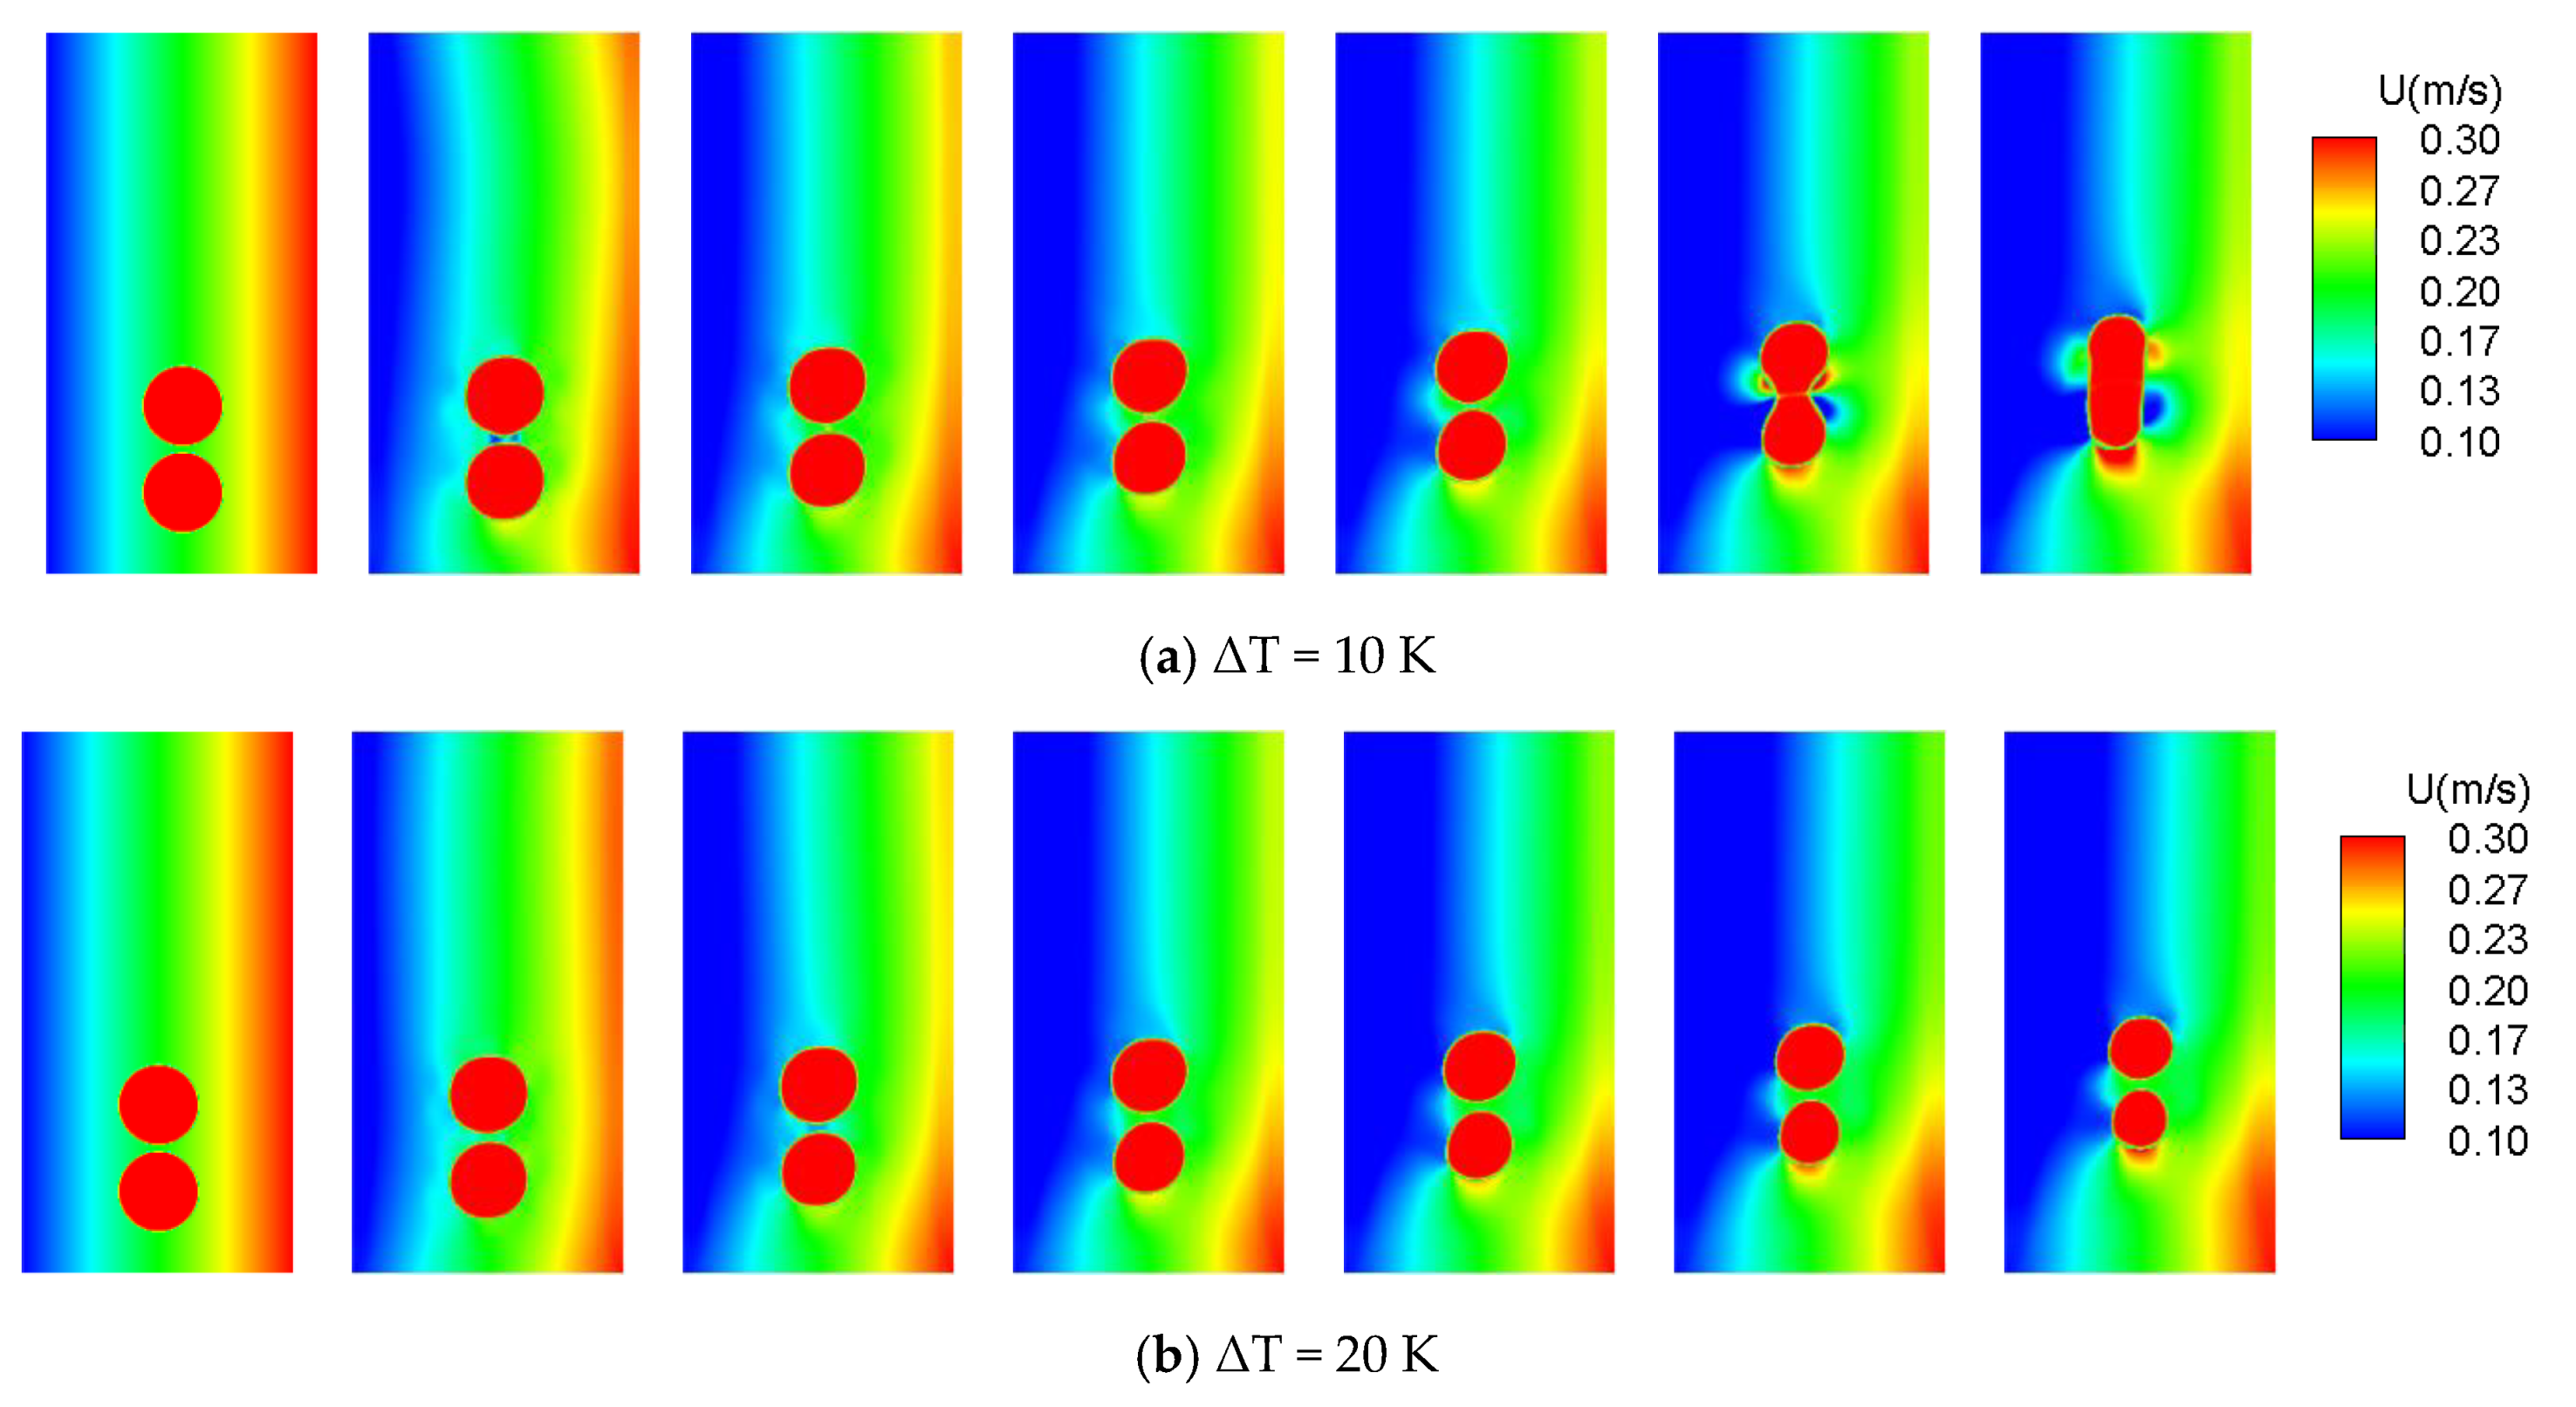
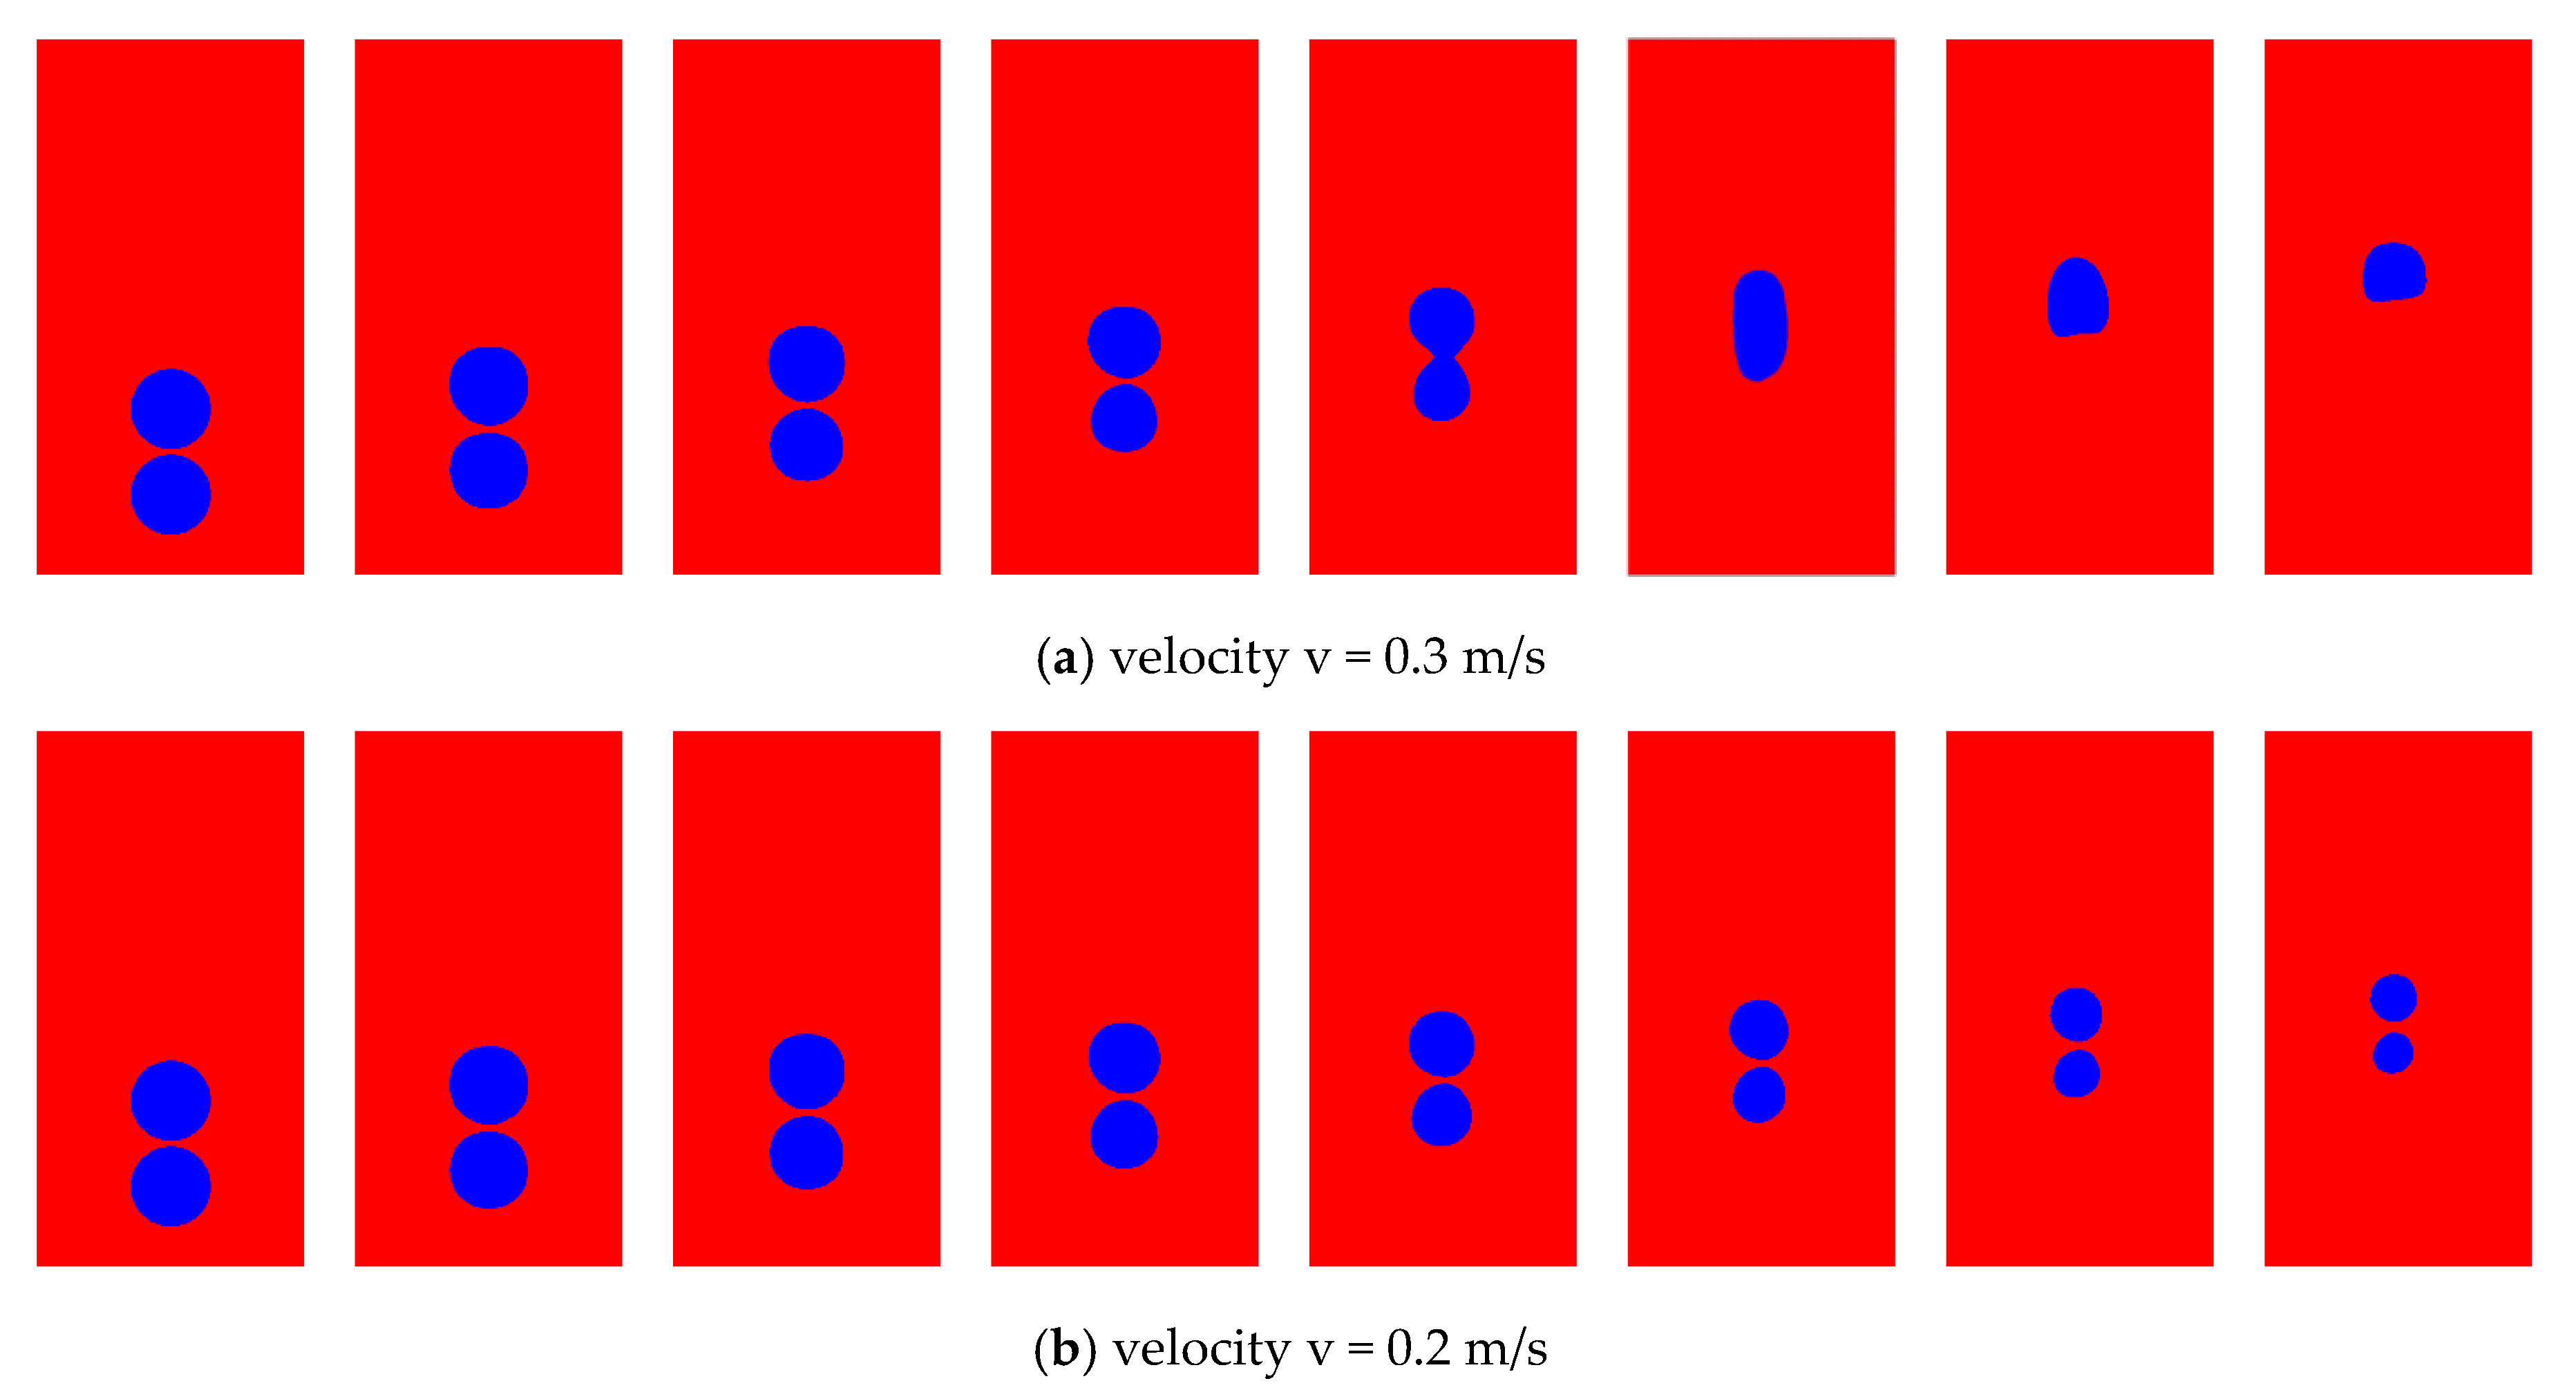
4.4.1. Two-Bubbles Rising Behavior

In this simulation, two bubbles were placed at the centerline of the domain. Subsequently, the gap between the two bubbles was varied, and the bubble merge process was examined based on the bubble gaps (BGs). Figure 11 shows similar bubbles with different gaps between each bubble. When the gap is above 0.2 mm, the merging process will be affected, and condensation occurs separately. We observed that during the bubble merging and condensation processes in the liquid, the initial shape of the bubbles changed rapidly and continuously with time. For the case of no gap between the bubbles, the merging process started, and the bubble shape-changing occurred with very less time steps. Moreover, for the case with a BG of 0.2 mm, the bubbles merged after some time steps.
The bubble merging process break due to the increase in the certain gap between bubbles. When bubbles move vertically along the rising line, bubble coalescence did not occur because the lowest bubble condensed faster than the upper bubble. The upper condensing bubble releases the condensation heat towards the lower bubble, which increases the liquid temperature near the lower bubble. It will reduce the lower bubble condensation rate, but the random perturbation produced by the upper bubble can raise the condensation heat transfer of the lower bubble [22,23]. Local perturbation causes the lower bubble to condense faster than the upper bubble. Therefore, the condensation rate of the lower bubble is influence by liquid temperature and random perturbation. In the case of two dissimilar bubbles in a row without the gradient flow, the same phenomena are observed as in similar bubbles case.
Figure 12 shows the dissimilar bubble condensation at different bubble gap without gradient flow condition. Bubble condition. Increasing the bubble gap small enough, it breaks the bubble coalescence. Even though a small gap occurred between bubbles, the coalescence not occurred due to the lower bubble large than the upper bubble. However, the local perturbation causes the lower bubble to condense faster than the upper bubble. Figure 13 shows a comparison of the bubble equivalent diameter for bubble condensation behaviors with different BGs. Compared to the merged bubble process, the case without bubble merging may increase the condensation process because local saturation can accelerate condensation.
Figure 14, Figure 15, Figure 16 and Figure 17 show the similar bubbles in a row condensing behavior studied under different gradient conditions varying with the bubble gap, velocity, subcooled temperature. Figure 14 show the different subcooled temperature with BG = 0.2 mm for D = 3 mm. During the bubble merging, the bubble shape-changing occurred rapidly with different shapes that were observed. The merging process depends on the subcooling temperature. When the subcooling temperature increases, the bubble merging process will also be affected, and under the velocity gradient flow, the migrating bubble generated a negligible range of sinuous path because of the bubbles interlink and tends to move toward the vertical direction approximately.
Figure 15 shows that gradient velocity flow at different subcooling temperatures with a BG between 0.2 mm. When the gap between the two bubbles is small enough, it merges. The lower bubble moves faster than the upper bubble because of the buoyancy force and the two-bubble capillary reaction that occurs between them. The upper bubble flow creates a lower velocity region between the bubbles, and then the upper bubble pulls the lower bubble to merge, as shown in Figure 15a. Figure 15b shows that similar phenomena occurred because of the lower subcooled temperature (ΔT = 20 K) that those occurred with ΔT = 10 K. The upper bubble tends to pull the lower bubble toward itself; however, the lower bubble loses its mass before that. Thus, the capillary effect is broken, and the bubble merging process will not occur. Figure 16 shows the bubble under the temperature gradient. We applied different velocities and observed different characteristics. Decreasing the bubble velocity affects the bubble merging process and increases condensation in the temperature gradient flow. Figure 17 shows that under the velocity and temperature gradient flow, the complete merging process is restricted, even in the low-velocity gradient range. However, when compared to the case without the gradient flow, bubble condensation is affected by the gradient flow condition.

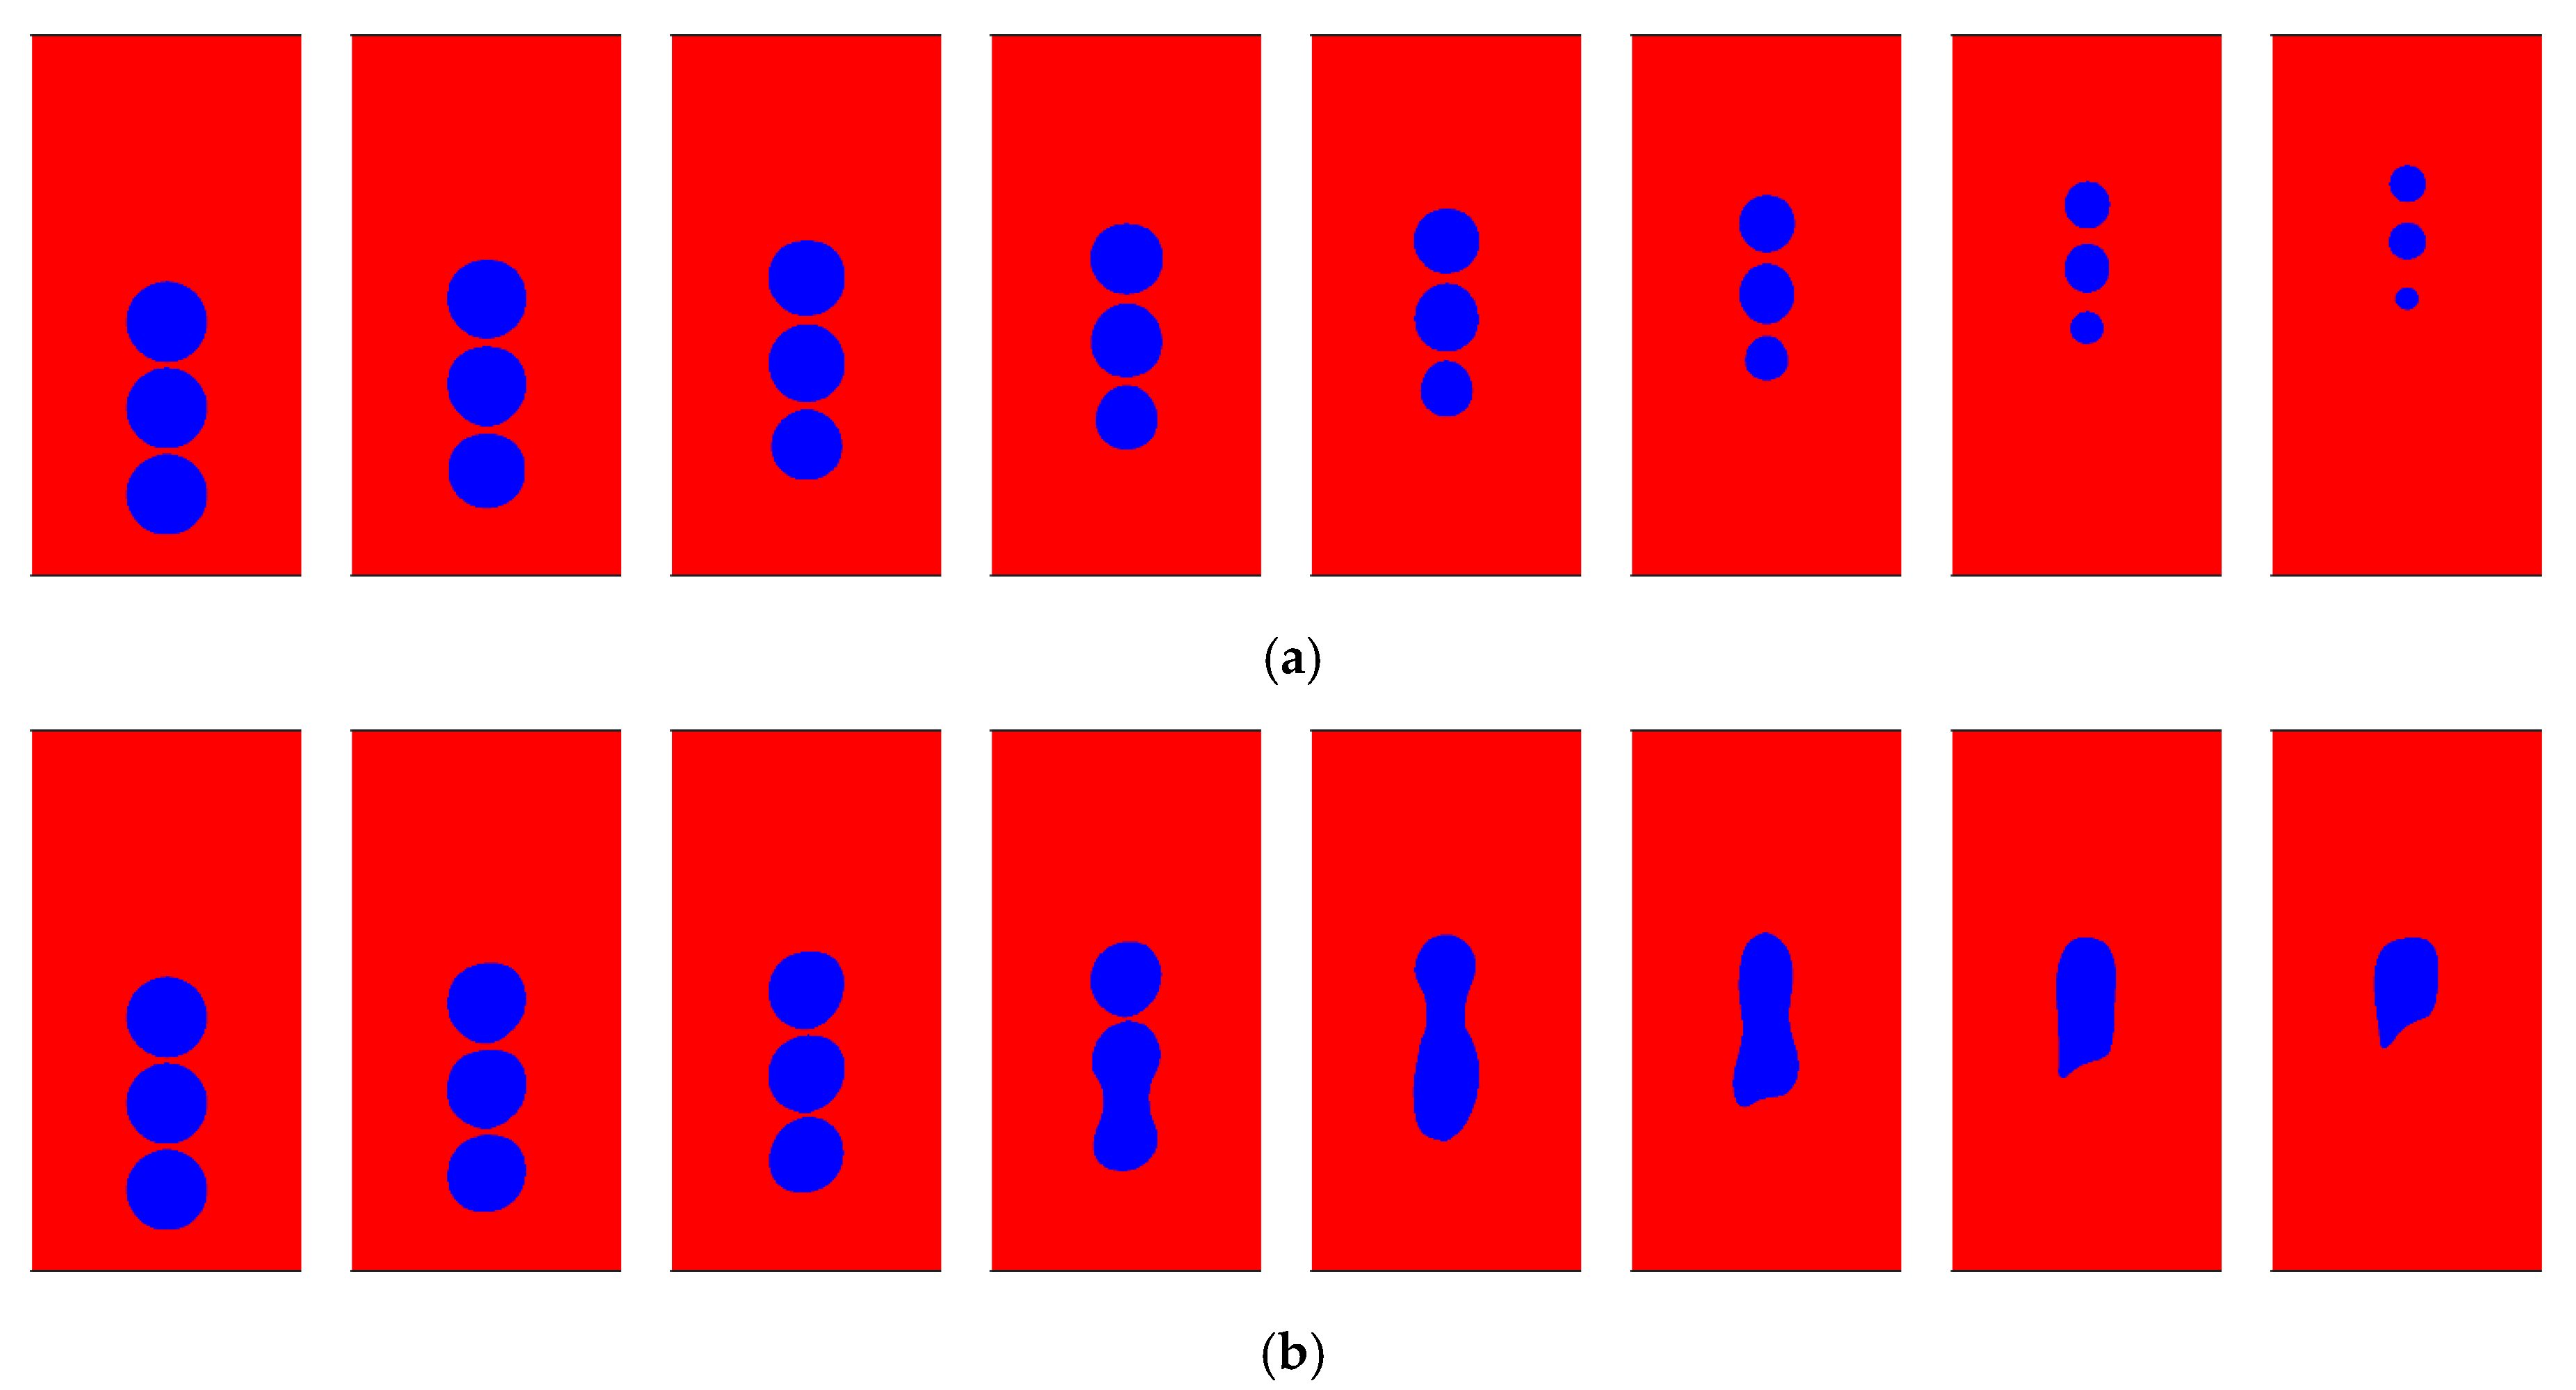
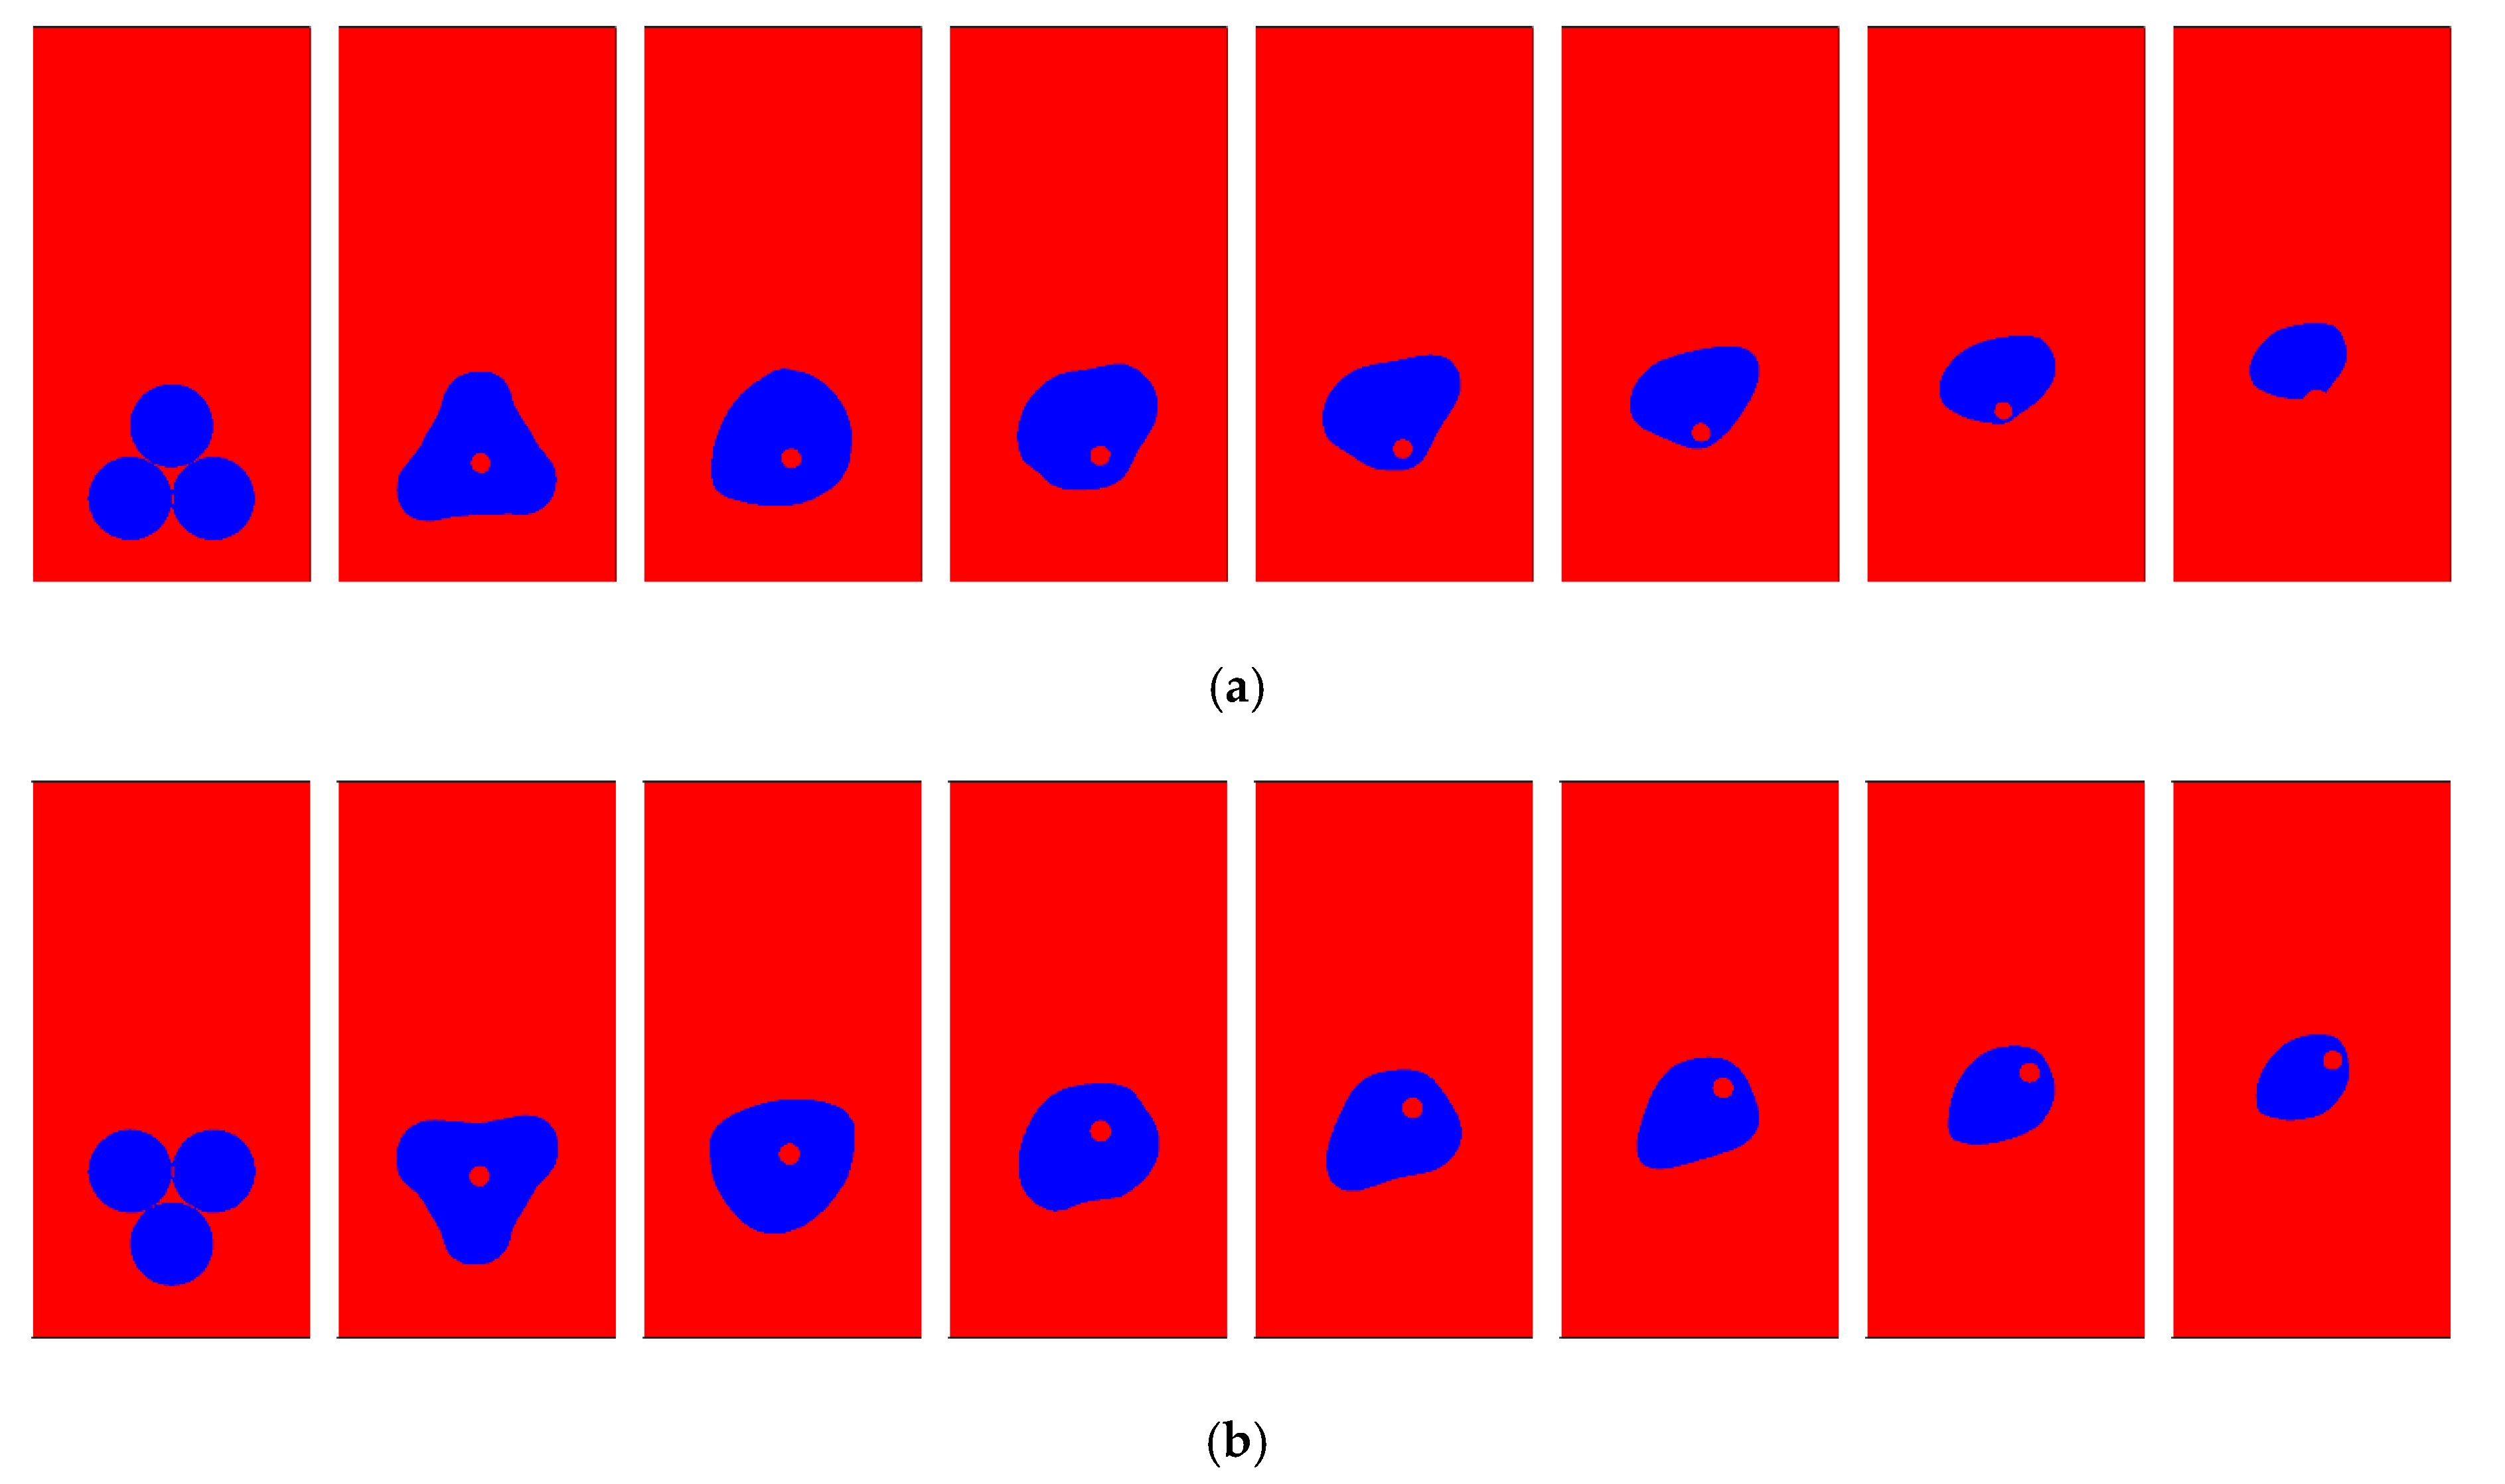
4.4.2. Three-Bubbles Rising Behavior

Figure 18 shows the simulation of three similar bubbles at an equal distance in a liquid to examine the condensation effects. Figure 18a illustrates the simulation of the bubble condensation process in liquid without the gradient flow. The bubble shapes were not affected, and the local perturbation improved the bubble condensation heat transfer. A considerable amount of bubble deformation occurred in the three bubbles; the lower bubble condensed, followed by the upper bubble, and these two bubbles slightly restricted the condensation of the middle bubble. Figure 18b show three bubbles rise in a row condensation under the gradient flow; the bubble merge from the lower bubble to the upper bubble occurred. The bottom bubble merged completely after coalescing with the upper bubble. The coalescing bubble shape bubble formed was similar to a bowling pin, and condensation occurred from the bottom of the bubble with continuously changing shape, as reported [22]. Figure 19 shows a comparison of bubble condensation, with gradient and without the gradient. It can be observed that the case without the gradient flow improved bubble condensation as compared to that with the gradient flow.
Finally, we performed a simulation of more complicated multiple bubble patterns with triangular and delta arrangements to study the bubble behavior under velocity and temperature gradient with different gaps between the bubbles, as shown in Figure 20. Complicated shapes were formed during the bubble merging process, and the bubble shape transformed rapidly and continuously into an indistinguishable shape. The triangular and delta patterns showed a similar type of bubble merging shape characteristics because the initial pattern formed a small liquid drop in the merged indistinguishable shaped bubble. When the BG is sufficiently large, the merging process is restricted, and bubble condensation occurs separately. Initially, the lower temperature gradient region condensed faster than the higher region. However, the velocity gradient moves from the higher side to the lower side, i.e., from the right side to the left side, as shown in Figure 20.

5. Conclusions

In this study, we numerically investigated the condensation behaviors of single and multiple bubbles under different gradient conditions using a homogeneous mixture model. The solver is developed for solving the two-dimensional, and compressible flow. The mass transfer was modeled based on the Lee phase change model. At subcooled temperature conditions, the numerical results of bubble condensation characteristics were compared with two different experimental data. The numerical solutions are in fairly agreement with the experimental results. The condensation bubble behavior under the gradient flow was studied qualitatively under several conditions. The bubble size, BG, subcooled bubble temperature, and bubble pattern had significant effects on the bubble lifetime, bubble deformation, and bubble shapes. The following conclusions were drawn with the parameters for bubble condensation:
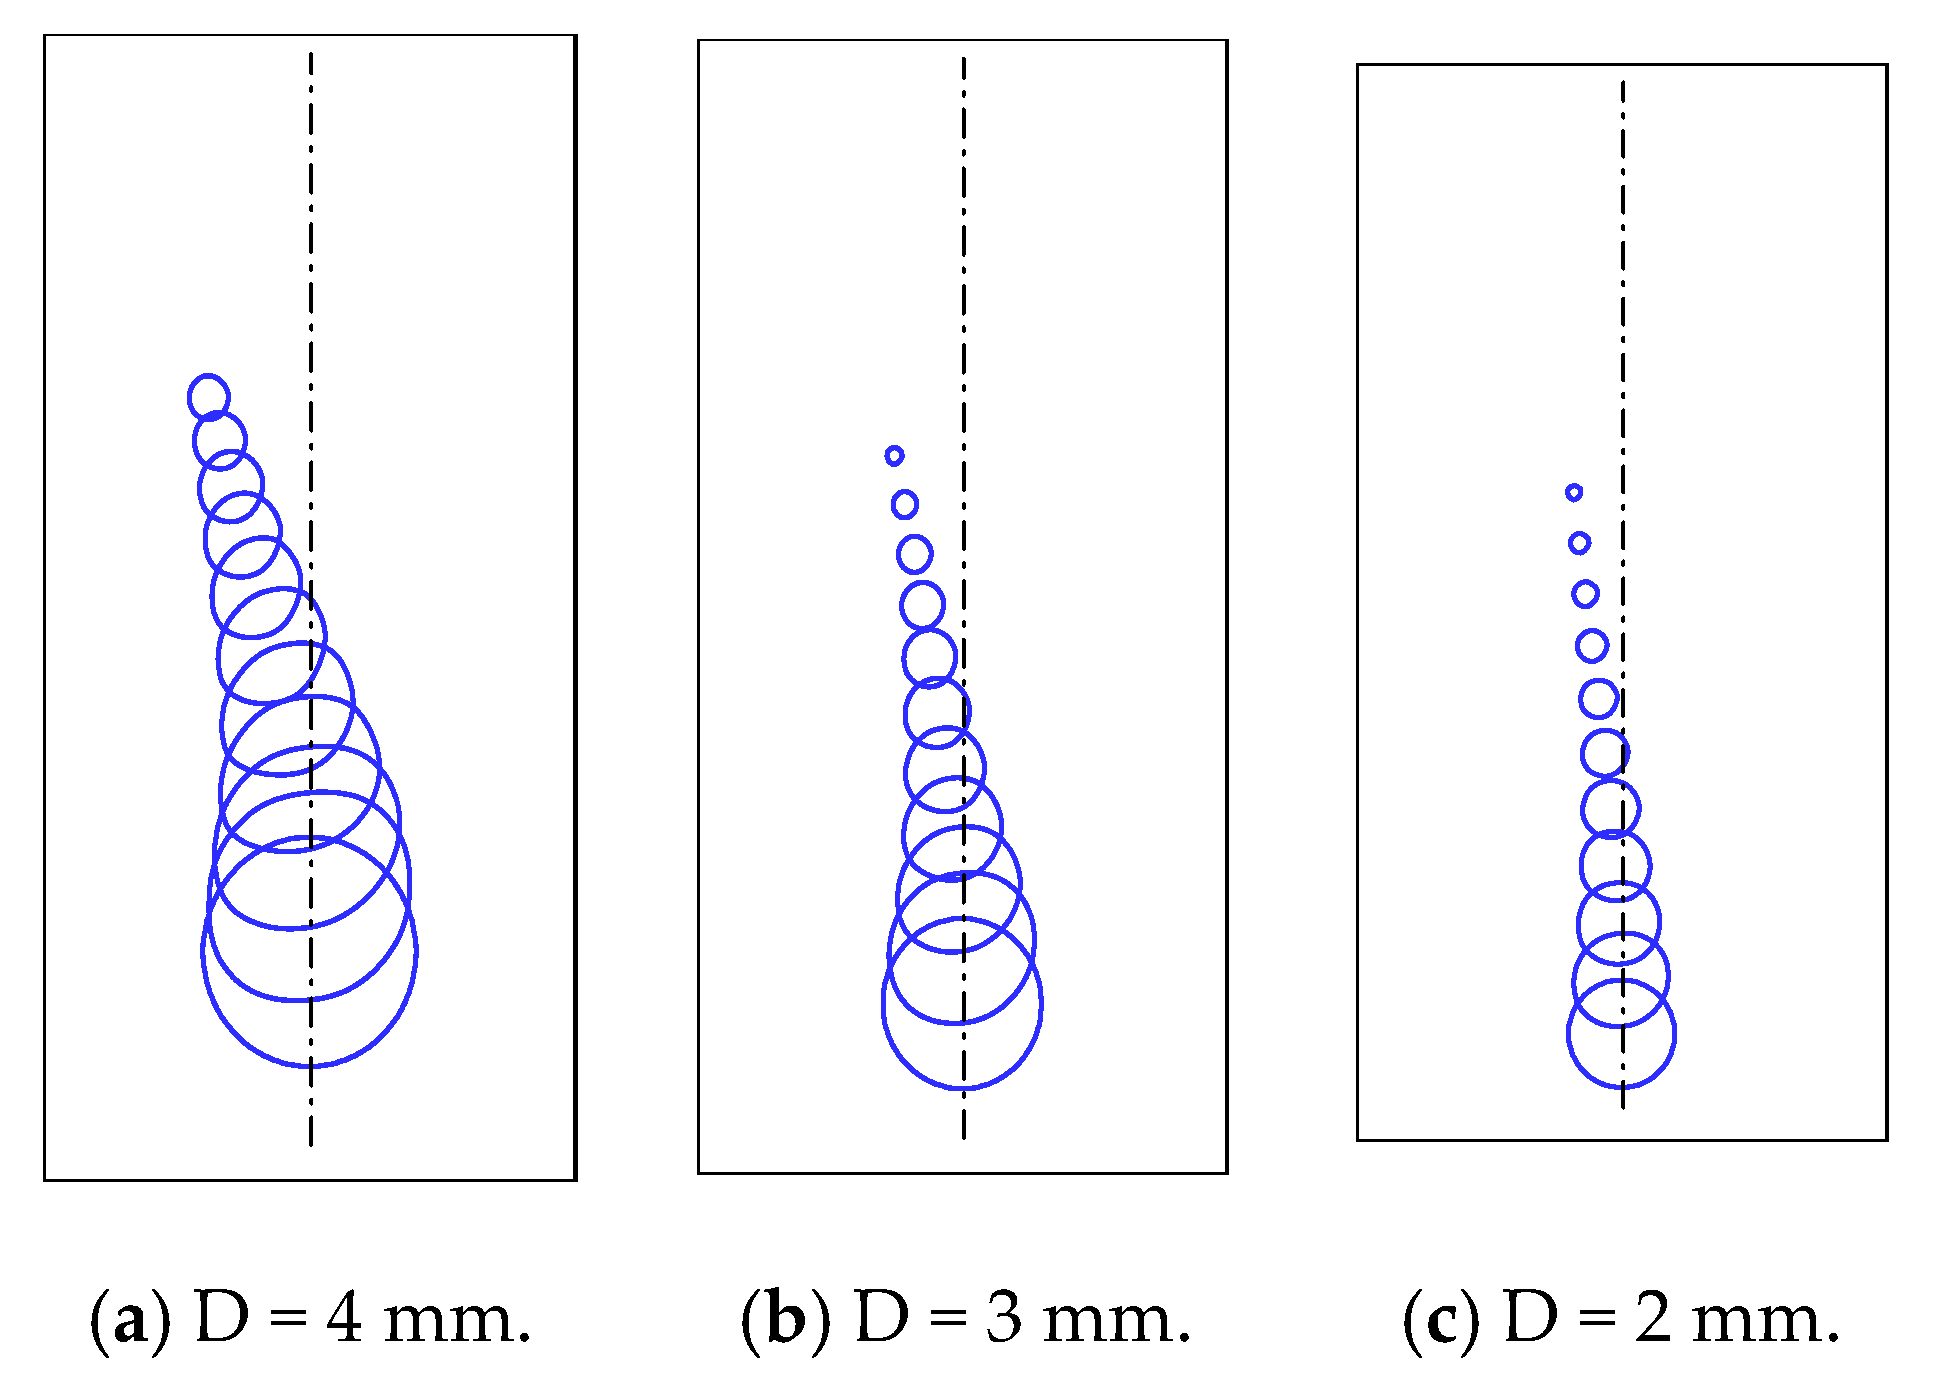
  • When the bubble moved in the velocity gradient, it migrated toward the lower velocity side, thereby decreasing the bubble diameter and reducing the sinuous path. Similarly, in the temperature gradient, the bubble moved toward the lower temperature side and increased the condensation on one side of the bubble. In the case of velocity and temperature gradient flow, the bubble initially moved toward the higher velocity side; however, it again transformed and moved to the lower velocity and higher temperature side.
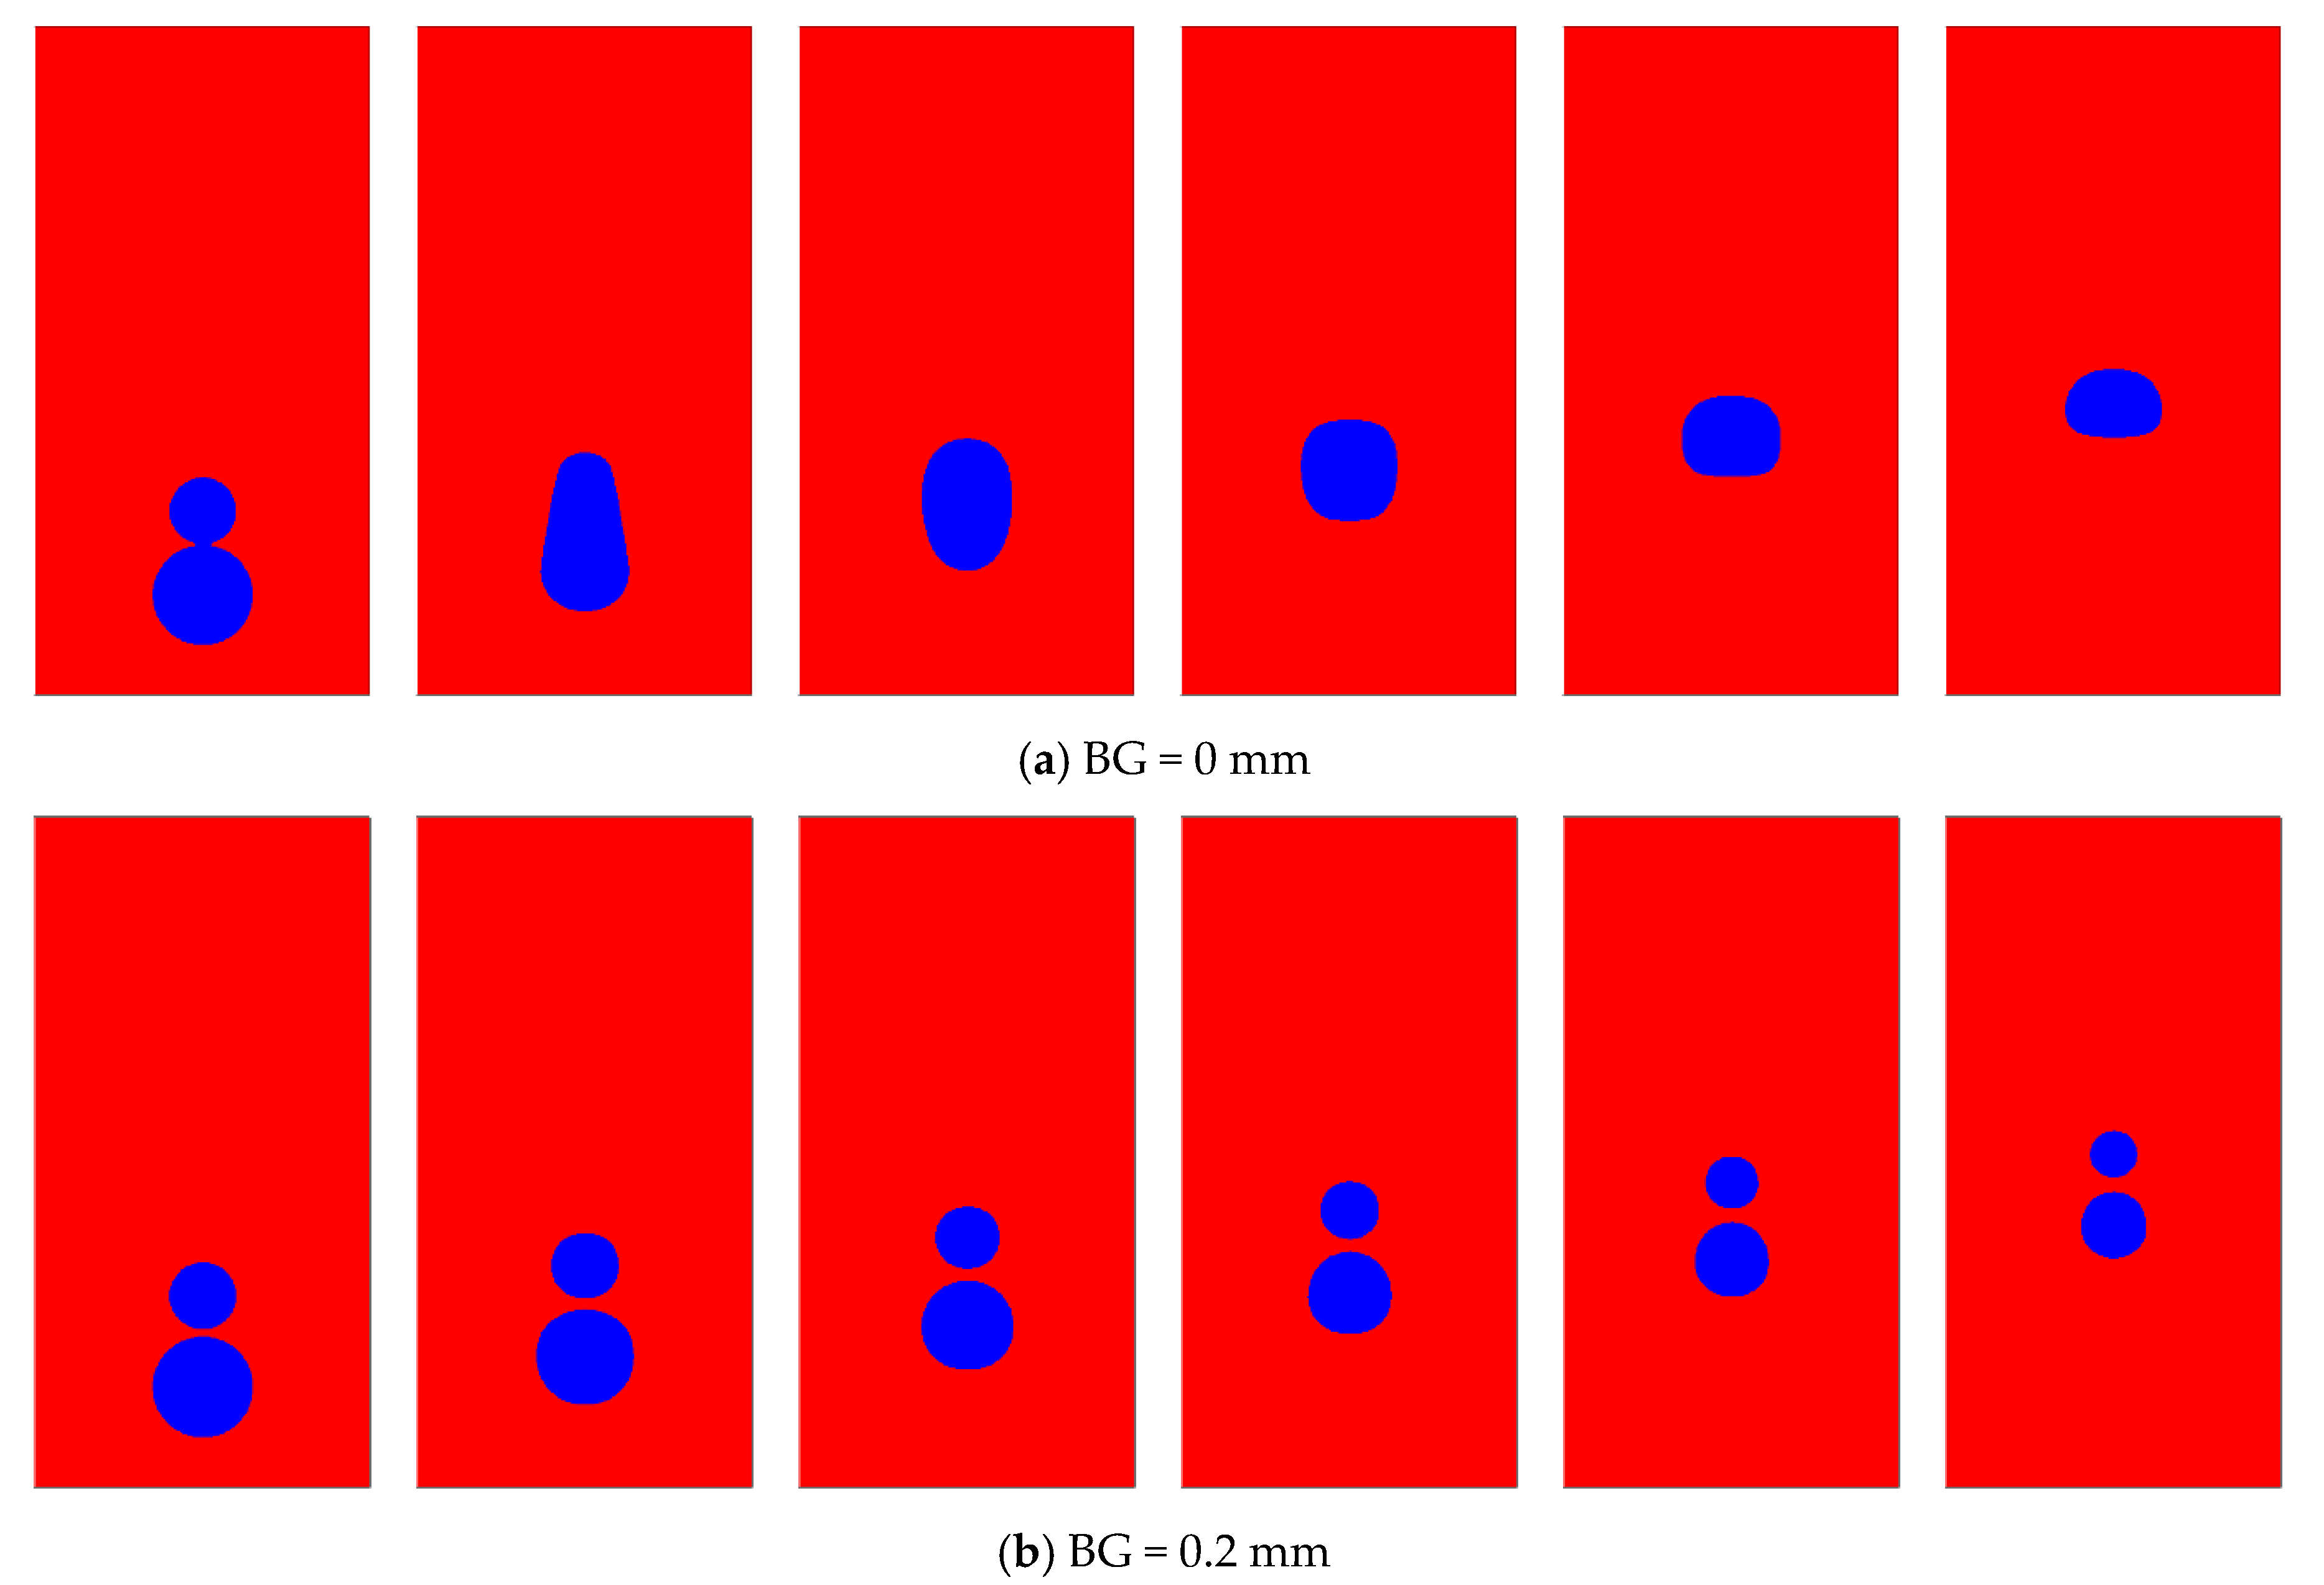
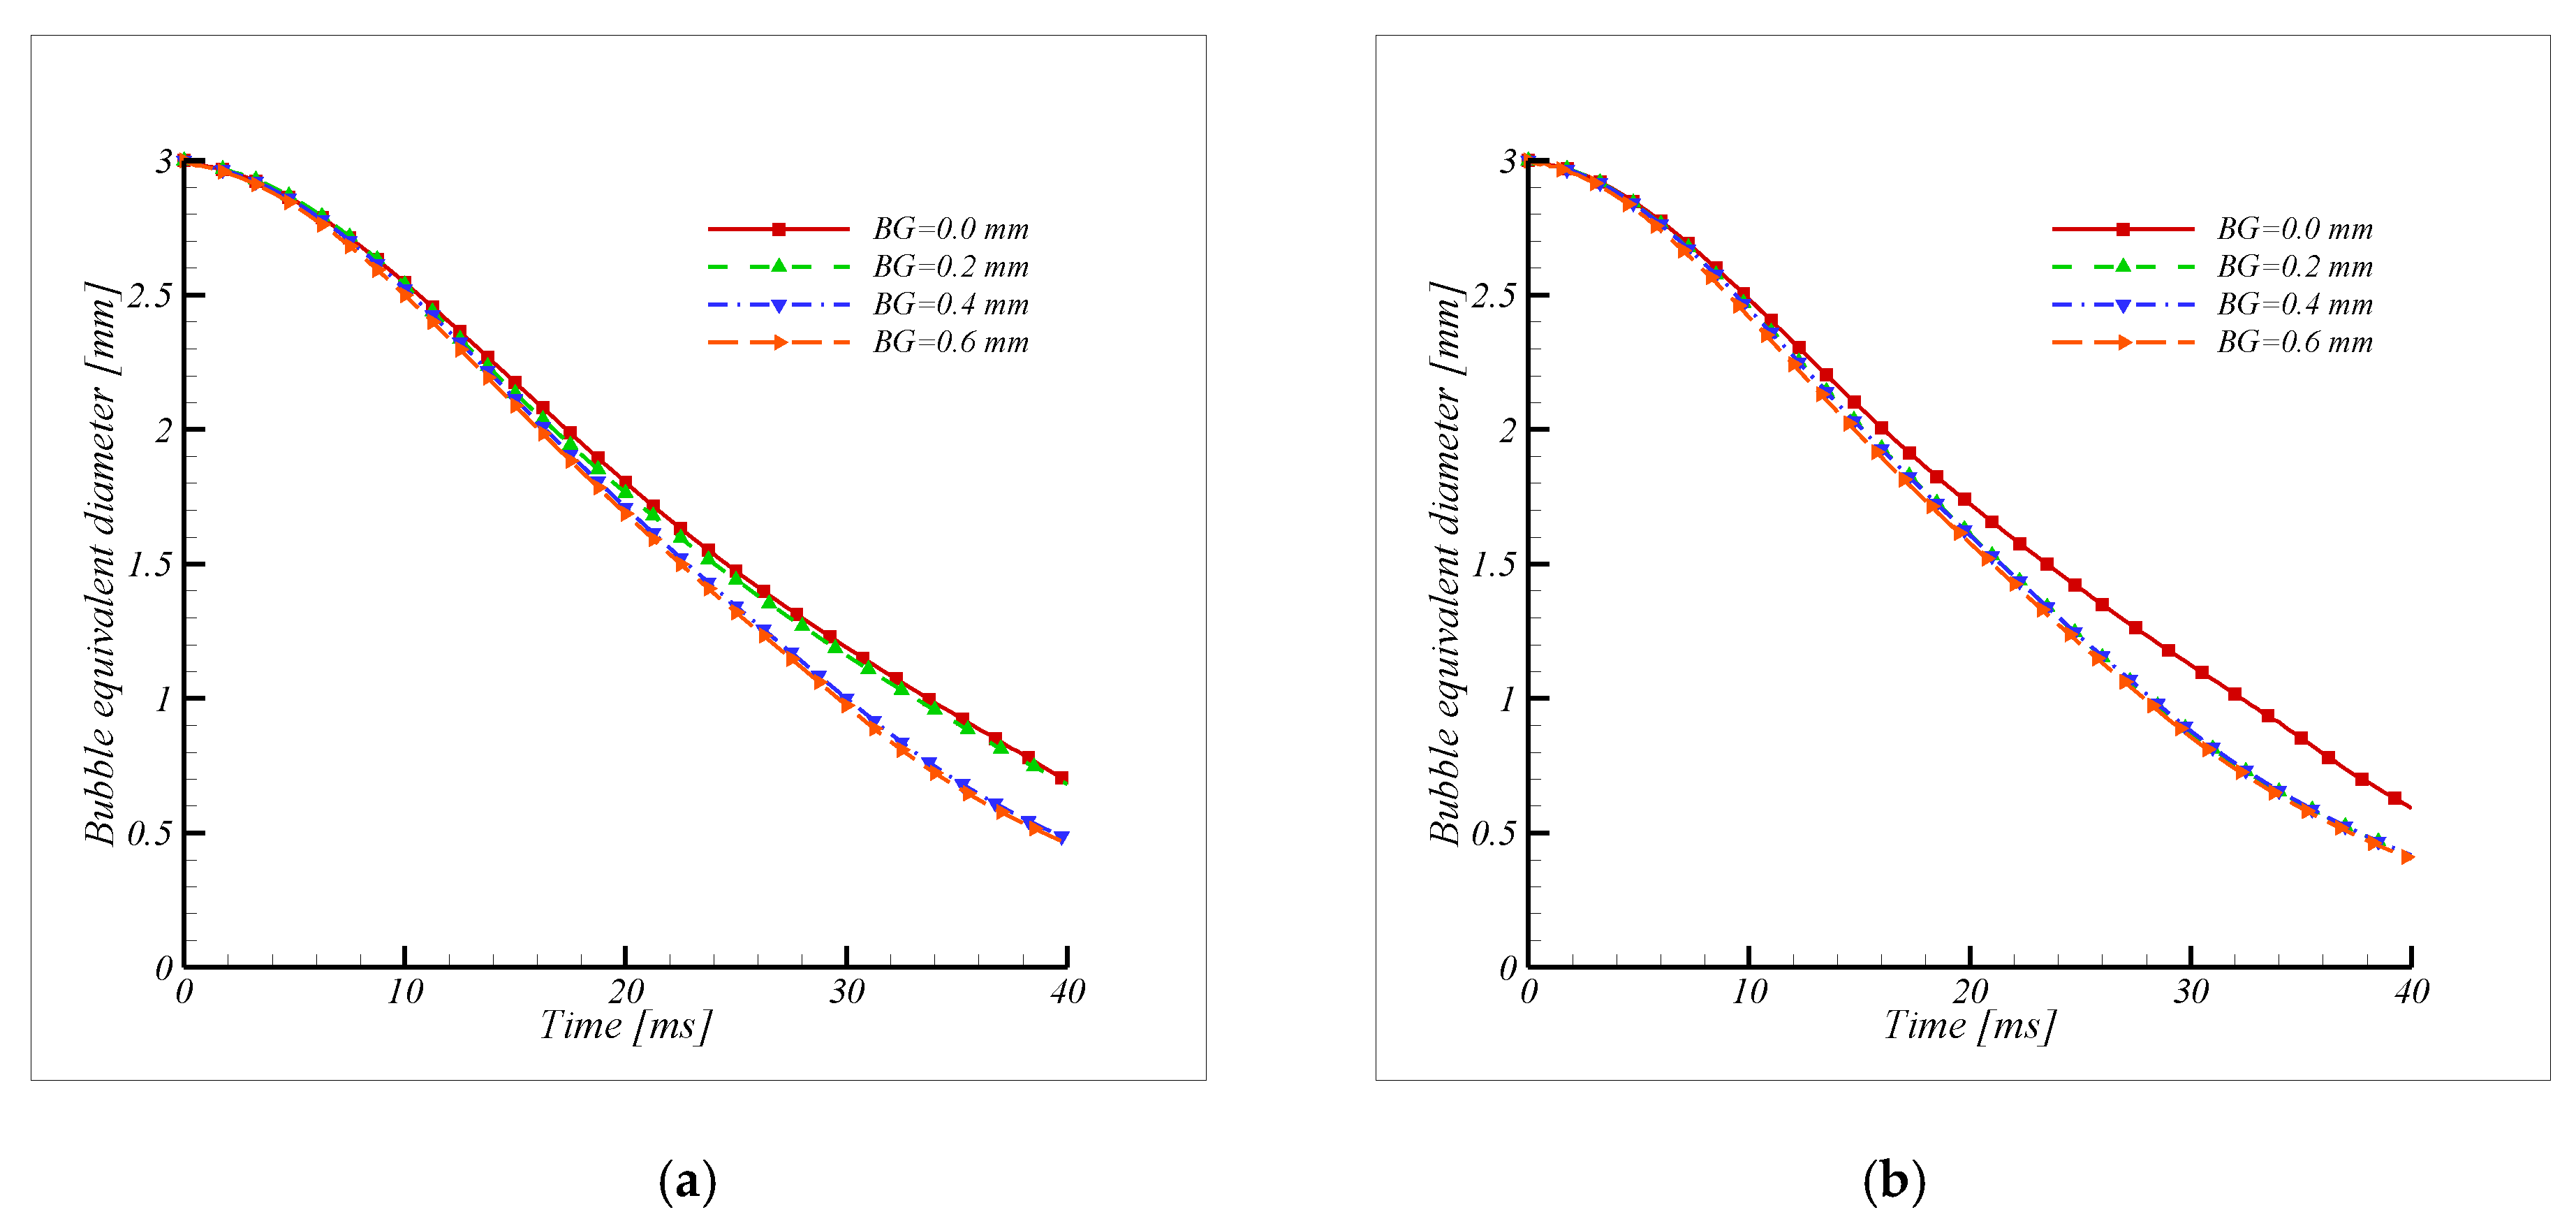
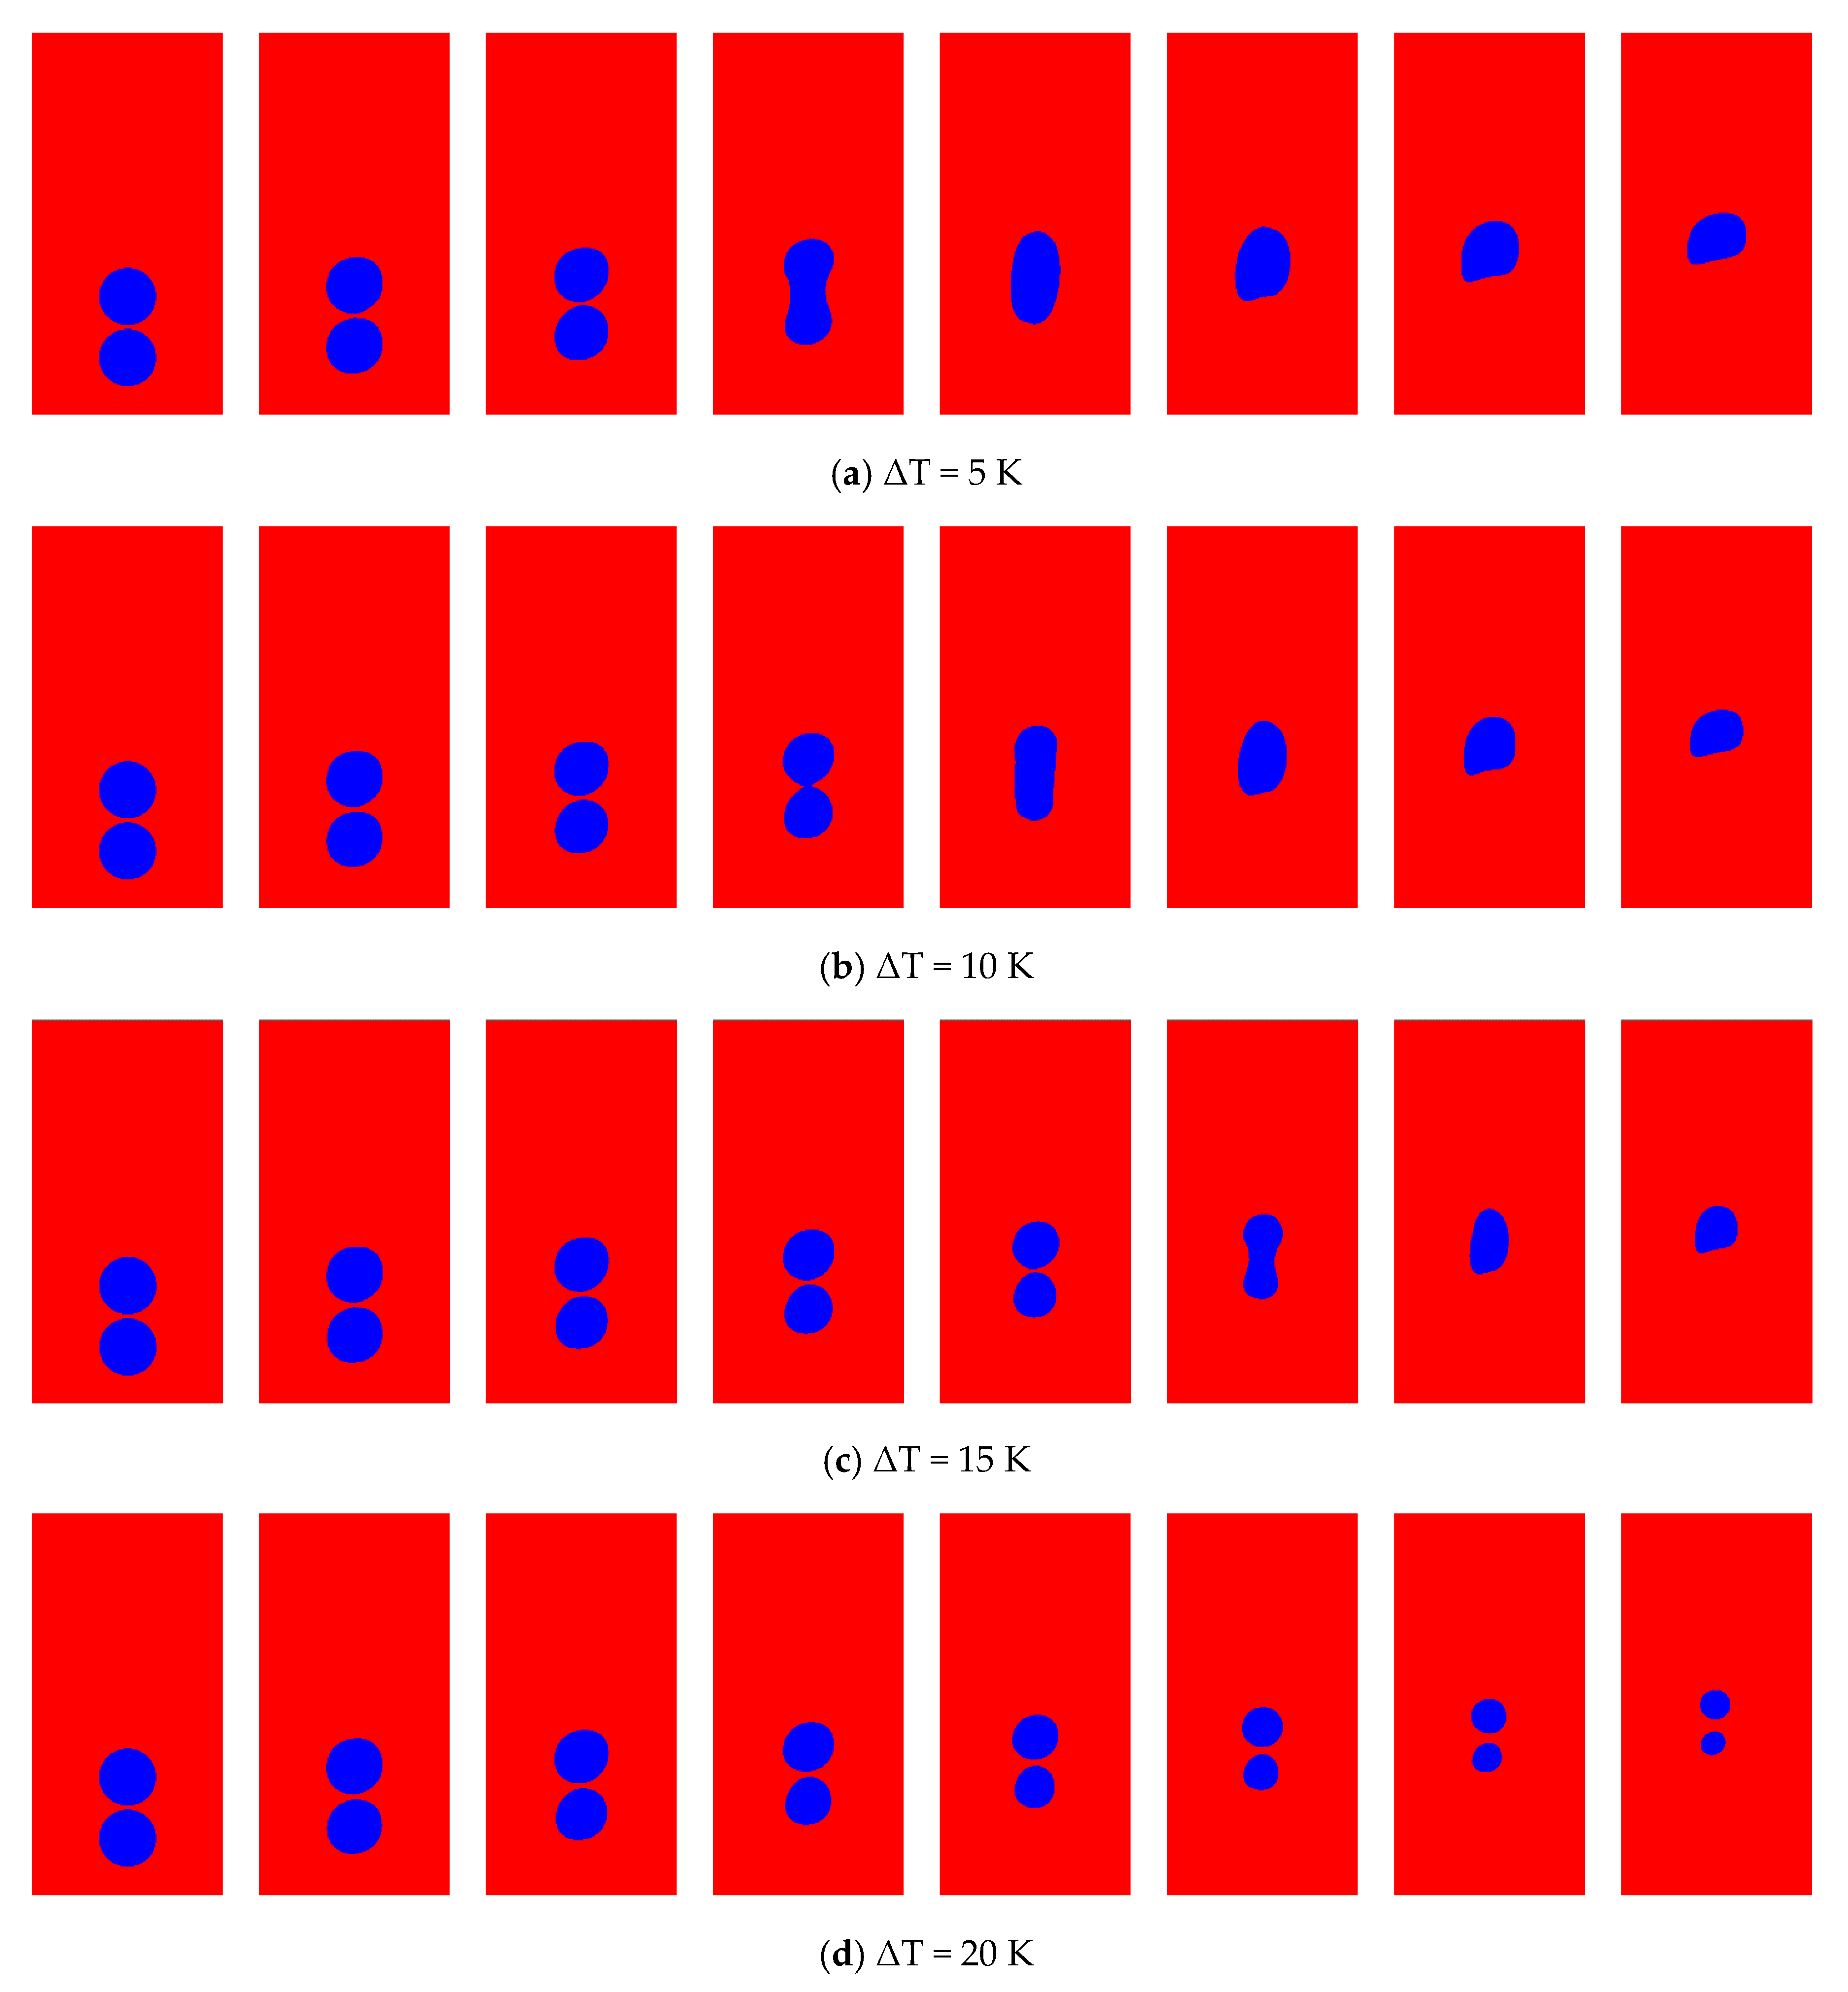
  • A similar shape and size bubble merger occurred when the gap in the bubble was sufficiently small (BG = 0.2 mm). This occurred up to a certain subcooled temperature; however, it was interrupted beyond the subcooled temperature ΔT = 15 K.
  • Compared to the three bubbles in a row condensation, the case without gradient flow condensation, the case with velocity and temperature gradient flow condensation affects the life of the bubble’s condensation, and this case causes the bubble merging process.
  • The bubble pattern affects the bubble shapes and condensation rates during the bubble condensation because of the attraction with the neighboring bubble. From these cases, the bubbles heat and mass transfer depend on the number of bubbles within a particular BG and subcooled temperature in the defined shape and random arrangements of bubble flow inside the bubble column.
  • When bubbles move vertically along the rising line, bubble coalescence did not occur because the lowest bubble condensed faster than the upper bubble due to the local perturbation were observed.

Author Contributions

Conceptualization, W.-G.P.; formal analysis, S.S.P.; funding acquisition, W.-G.P.; investigation, S.S.P.; methodology, S.S.P. and W.-G.P.; project administration, D.-H.K. and W.-G.P.; software, S.S.P.; supervision, W.-G.P.; validation, S.S.P.; writing—original draft preparation, S.S.P. and D.-H.K.; writing—review and editing, S.S.P. and W.-G.P. All authors have read and agreed to the published version of the manuscript.

Funding

This work supported by National Research Foundation of Korea (NRF) grant funder by the Korea government (MIST) (NRF-2018R1A2B6008864) and The Nuclear Research & Development Program of the NRF (National Research Foundation of Korea) grant funded by the MSIT (Ministry of Science and ICT). (Grant code: NRF-2019M2D2A1A03056998).

Conflicts of Interest

The authors declare no conflict of interest.

References

  1. Zuber, N. The dynamics of vapor bubbles in nonuniform temperature fields. Int. J. Heat Mass Transf. 1960, 2, 83–98. [Google Scholar] [CrossRef]
  2. Okhotsimskii, A.D. The thermal regime of vapour bubble collapse at different Jacob numbers. Int. J. Heat Mass Transf. 1988, 31, 1569–1576. [Google Scholar] [CrossRef]
  3. Lucasa, D.; Prasserb, H.M. Steam Bubble Condensation in Sub-Cooled Water in Case of Co-Current Vertical Pipe Flow. Nucl. Eng. Des. 2007, 237, 497–508. [Google Scholar] [CrossRef]
  4. Brucker, G.G.; Sparrow, E.M. Direct contact condensation of steam bubbles in water at high pressure. Int. J. Heat Mass Transf. 1977, 20, 371–381. [Google Scholar] [CrossRef]
  5. Eames, I. Momentum Conservation and Condensing Vapor Bubbles. ASME J. Heat Transf. 2010, 132, 091501. [Google Scholar] [CrossRef]
  6. Kim, S.J.; Park, G.C. Interfacial heat transfer of condensing bubble in subcooled boiling flow at low pressure. Int. J. Heat Mass Transf. 2011, 54, 2962–2974. [Google Scholar] [CrossRef]
  7. Harada, T.; Nagakura, H.; Okawa, T. Dependence of bubble behavior in subcooled boiling on surface wettability. Nucl. Eng. Des. 2010, 240, 3949–3955. [Google Scholar] [CrossRef]
  8. Kamei, S.; Hirata, M. Condensing Phenomena of a Single Vapor Bubble into Subcooled Water. Exp. Heat Transf. 1990, 3, 173–182. [Google Scholar] [CrossRef]
  9. Tian, W.; Ishiwatari, Y.; Ikejiri, S.; Yamakawa, M.; Oka, Y. Numerical computation of thermally controlled steam bubble condensation using Moving Particle Semi-implicit (MPS) method. Ann. Nucl. Energy 2010, 37, 5–15. [Google Scholar] [CrossRef]
  10. Chena, R.H.; Wenxi, T.; Su, G.H.; Suizheng, Q.; Yuki, I.; Yoshiaki, O. Numerical investigation on bubble dynamics during flow boiling using moving particle semi-implicit method. Nucl. Eng. Des. 2010, 240, 3830–3840. [Google Scholar] [CrossRef]
  11. Ganguli, A.A.; Pandit, B.A.; Joshi, B.J. Bubble Dynamics of a Single Condensing Vapor Bubble from Vertically Heated Wall in Subcooled Pool Boiling System: Experimental Measurements and CFD Simulations. Int. J. Chem. Eng. 2012, 2012, 1–11. [Google Scholar] [CrossRef] [Green Version]
  12. Bahreini, M.; Ramiar, A.; Ranjbar, A.A. Numerical simulation of bubble behavior in subcooled flow boiling under velocity and temperature gradient. Nucl. Eng. Des. 2015, 293, 238–248. [Google Scholar] [CrossRef]
  13. Lucas, D.; Frank, T.; Lifante, C.; Zwart, P.; Burns, A. Extension of the Inhomogeneous MUSIG Model for Bubble Condensation. Nucl. Eng. Des. 2011, 241, 4359–4367. [Google Scholar] [CrossRef]
  14. Jeon, S.S.; Kim, S.J.; Park, G.C. Numerical study of condensing bubble in subcooled boiling flow using volume of fluid model. Chem. Eng. Sci. 2011, 66, 5899–5909. [Google Scholar] [CrossRef]
  15. Juanli, Z.; Wenxi, T.; Ronghua, C.; Suizheng, Q.; Guanghui, S. Two-Dimensional numerical simulation of single bubble rising behavior in liquid metal using moving particle semi-implicit method. Progress Nucl. Energy 2013, 64, 31–40. [Google Scholar] [CrossRef]
  16. Samkhaniani, N.; Ansari, M.R. Numerical simulation of bubble condensation using CF-VOF. Progress Nucl. Energy 2016, 89, 120–131. [Google Scholar] [CrossRef]
  17. Qua, X.; Revankar, S.T.; Tian, M. Numerical simulation of bubble formation and condensation of steam air mixture injected in subcooled pool. Nucl. Eng. Des. 2017, 320, 123–132. [Google Scholar] [CrossRef]
  18. Ha, C.-T.; Park, W.-G. Axisymmetric simulation of bubble condensation of pure steam and steam–Air mixture. Nucl. Eng. Des. 2018, 337, 193–204. [Google Scholar] [CrossRef]
  19. Kharangate, C.R.; Mudawar, I. Review of computational studies on boiling and condensation. Int. J. Heat Mass Transf. 2017, 108, 1164–1196. [Google Scholar] [CrossRef]
  20. Abdollahzadeh Jamalabadi, M.Y. Electromagnetohydrodynamic two-phase flow-Induced vibrations in vertical heated upward flow. J. Comput. Des. Eng. 2019, 6, 92–104. [Google Scholar] [CrossRef]
  21. Abdollahzadeh Jamalabadi, M.Y.; Ghasemi, M.; Alamian, R.; Wongwises, S.; Afrand, M.; Shadloo, M.S. Modeling of subcooled flow boiling with nanoparticles under the influence of a magnetic field. Symmetry 2019, 11, 1275. [Google Scholar] [CrossRef] [Green Version]
  22. Paramanantham S, S.; Ha, C.-T.; Park, W.-G. Numerical investigation of single and multiple bubble condensing behaviors in subcooled flow boiling based on homogeneous mixture model. Int. J. Mech. Sci. 2018, 136, 220–233. [Google Scholar] [CrossRef]
  23. Liu, Z.; Sunden, B.; Wu, H. Numerical Modeling of Multiple Bubbles Condensation in Subcooled Flow Boiling. J. Therm. Sci. Eng. Appl. 2015, 7, 1–9. [Google Scholar] [CrossRef]
  24. Owoeye, E.J.; Schubring, D. Computational modeling of bubble coalescence in a high-pressure steam-Water flow. Nucl. Eng. Des. 2017, 319, 28–39. [Google Scholar] [CrossRef]
  25. Chena, R.H.; Tiana, W.X.; Sua, G.H.; Qiu, S.Z.; Yuki, I.; Yoshiaki, O. Numerical investigation on coalescence of bubble pairs rising in a stagnant liquid. Chem. Eng. Sci. 2011, 66, 5055–5063. [Google Scholar] [CrossRef]
  26. Ha, C.T.; Kim, D.H.; Park, W.G.; Jung, C.M. A compressive interface-capturing scheme for computation of compressible multi-Fluid flows. Comput. Fluids 2017, 152, 164–181. [Google Scholar] [CrossRef]
  27. Merkle, C.L.; Feng, J.; Buelow, P.E.O. Computational modeling of the dynamics of sheet cavitation. In Proceedings of the 3rd International Symposium on Cavitation, Grenoble, France, 7–10 April 1998. [Google Scholar]
  28. Kunz, R.F.; Boger, D.A.; Stinebring, D.R.; Chyczewski, T.S.; Lindau, J.W.; Gibeling, H.J.; Venkateswaran, S.; Govindan, T.R. A preconditioned Navier–Stokes method for two-phase flows with application to cavitation prediction. Comput. Fluids 2000, 29, 849–875. [Google Scholar] [CrossRef]
  29. Owis, F.M.; Nayfeh, A.H. Numerical Simulation of Super- and PartiallyCavitating Flows over an Axisymmetric Projectile. AIAA 2001, 1042, 1–9. [Google Scholar]
  30. Lindau, J.; Venkateswaran, S.; Kunz, R.; Merkle, C. Development of a fully-Compressible multi-Phase Reynolds-Averaged Navier-Stokes model. AIAA Paper 2001, 2648, 1–12. [Google Scholar] [CrossRef]
  31. Ha, C.T.; Park, W.G. Evaluation of a new scaling term in preconditioning schemes for computations of compressible cavitating and ventilated flows. Ocean Eng. 2016, 126, 432–466. [Google Scholar] [CrossRef]
  32. Ha, C.T.; Park, W.G. Application of preconditioning to compressible multi-Phase mixture flow computation. In Proceedings of the 5th International Symposium on Fluids Machinery and Fluids Engineering, Jejum South Korea, Jeju, Korea, 24–27 October 2012; pp. 24–27. [Google Scholar]
  33. Jin, M.S.; Park, W.G.; Jung, C.M. Numerical analysis of cavitating flow past an axisymmetric cylinder with comparison to experiments. J. Mech. Sci. Technol. 2013, 27, 3673–3681. [Google Scholar] [CrossRef]
  34. Venkateswaran, S.; Lindau, J.W.; Kunz, R.; Merkle, C.L. Computation of multiphase mixture flows with compressibility effects. J. Computat. Phys. 2002, 180, 54–77. [Google Scholar] [CrossRef]
  35. Jin, M.S.; Ha, C.T.; Park, W.G. Numerical study on heat transfer effects of cavitating and flashing flows based on homogeneous mixture model. Int. J. Heat Mass Transf. 2017, 109, 1068–1083. [Google Scholar] [CrossRef]
  36. Phan, T.-H.; Won, S.-S.; Park, W.-G. Numerical simulation of air–steam mixture condensation flows in a vertical tube. Int. J. Heat Mass Transf. 2018, 127, 568–578. [Google Scholar] [CrossRef]
  37. Kretzschmar, H.J.; Wager, W. International Steam Tables-Properties of Water and Steam Based on the Industrial Formulation IAPWS-IF97; Springer: Berlin/Heidelberg, Germany, 2007; Part-A. [Google Scholar]
  38. Brackbill, J.U.; Kothe, D.B.; Zemach, C. A continuum method for modeling surface tension. J. Comput. Phys. 1992, 100, 335–354. [Google Scholar] [CrossRef]
  39. Ha, C.-T.; Park, W.-G.; Jung, C.-M. Numerical simulations of compressible flows using multi-Fluid models. Int. J. Multiph. Flow 2015, 74, 5–18. [Google Scholar] [CrossRef]
  40. Lee, W.H. A pressure iteration scheme for two-Phase flow modeling. In Multiphase Transport Fundamentals, Reactor Safety, Applications; Veziroglu, T.N., Ed.; Hemisphere Publishing: Washington, DC, USA, 1980; Volume 1. [Google Scholar]
Figure 1. Geometrical models for (a) single-bubble rod validation, (b) velocity gradient flow, (c) temperature gradient flow, and (d) velocity and temperature gradient flow.
Symmetry 12 00611 g001
Figure 2. Bubble rising behavior of grid independence. Comparison of (a) bubble diameter and (b) bubble shape and position (t = 12 ms).
Symmetry 12 00611 g002
Figure 3. Multi-bubble flow pattern of (a) two similar bubbles, (b) two dissimilar bubbles (c) three bubbles in a row, and (d) three bubbles in a triangular shape.
Symmetry 12 00611 g003
Figure 4. Influence of the condensation coefficient (CRV) in Lee’s model on numerical results with experimental data, D = 4.9 mm, Psat = 0.113 MPa, and ΔT = 14.8 K from Kim and Park [6].
Symmetry 12 00611 g004
Figure 5. Comparison of present work with experimental and numerical results. (a) bubble volume, and (b) bubble surface area.
Symmetry 12 00611 g005
Figure 6. Comparison of predicted condensing bubble shape with experimental results of experiments by Kim and Park [6] (red color-numerical result, gray color-experiment).
Symmetry 12 00611 g006
Figure 7. (ad) Bubble rising behavior under the effect of velocity gradient.
Symmetry 12 00611 g007aSymmetry 12 00611 g007b
Figure 8. Comparison of condensing behavior with gradient (ΔT = 5 K).
Symmetry 12 00611 g008
Figure 9. Bubble rising behavior under the effect of the temperature gradient (Tmin = 343 K to Tmax = 373 K) for with different diameter and velocity (each time step t = 5 ms).
Symmetry 12 00611 g009aSymmetry 12 00611 g009b
Figure 10. Bubble rising behavior under the effect of velocity and temperature gradient for vmin = 0.1 m/s to vmax = 0.3 m/s and Tmin = 343 K to Tmax = 373 K (each time step t = 5 ms) with different values of D. (a) D = 4 mm, (b) D = 3 mm, and (c) D = 2 mm.
Symmetry 12 00611 g010
Figure 11. (a,b) Contour comparison of similar bubble condensation (bubble diameter, 3 mm) at different BGs without the gradient condition (each time step t = 3 ms).
Symmetry 12 00611 g011
Figure 12. (a,b) Contour comparison of dissimilar bubble condensation (upper bubble diameter, 2 mm and lower bubble, 3 mm) at different BGs without the gradient condition (each time step t = 3 ms).
Symmetry 12 00611 g012
Figure 13. Comparison of bubble condensation without the gradient flow with (a) similar size bubble flow and (b) dissimilar size bubble flow.
Symmetry 12 00611 g013
Figure 14. (ad) Contour comparison of bubble condensation under velocity gradient condition at different subcooled temperatures, BG = 0.2 mm, D = 3 mm, vmin = 0.1 m/s to vmax = 0.3 m/s (each time step t = 3 ms).
Symmetry 12 00611 g014
Figure 15. (a,b) Velocity contour comparison of bubble condensation at different subcooled temperatures under velocity gradient. BG = 0.2 mm, D = 3 mm, vmin = 0.1 m/s to vmax = 0.3 m/s (each time step t = 2 ms).
Symmetry 12 00611 g015
Figure 16. (a,b) Comparison of different velocity flow under temperature gradient, BG = 0.2 mm with D = 3 mm Tmin = 343 K to Tmax = 373 K (each time step t = 3 ms).
Symmetry 12 00611 g016
Figure 17. Condensation of bubble with velocity gradient and temperature gradient, vmin = 0.1 m/s to vmax = 0.3 m/s and Tmin = 343 K to Tmax = 373 K (each time step t = 3 ms).
Symmetry 12 00611 g017
Figure 18. Three bubbles in a row condensation (a) without the gradient and (b) with the gradient.
Symmetry 12 00611 g018
Figure 19. Comparison of three-bubbles condensation in a row with and without the gradient.
Symmetry 12 00611 g019
Figure 20. Comparison of condensation behavior with different bubble arrangement patterns, i.e., (a) with a triangular pattern bubble and (b) with a delta pattern bubble.
Symmetry 12 00611 g020
Table 1. Test conditions for velocity gradient simulation.
Case No.Bubble Diameter D (mm)Subcooled Temp. ΔT (K)Operating Pressure (MPa)Vel. Gradient (m/s)
VminVmax
a25, 10, 15, 20, 300.1010.10.3
b3
c4
d40.050.15
Table 2. Test conditions for temperature gradient simulation.
Case No.Bubble Diameter D (mm)Subcooled Temp. ΔT (K)Velocity (m/s)Temp. Gradient (K)
TminTmax
e40, 50.1, 0.2, 0.3343.15373.15
Table 3. Test conditions for velocity and temperature gradient simulation.
Case No.Bubble Diameter D (mm)Subcooled Temp. ΔT (K)Velocity Gradient (m/s)Temp. Gradient (K)
VminVmaxTminTmax
f20, 50.10.3343.15373.15
g3
h4

