Article

Dihedral Group D4—A New Feature Extraction Algorithm

Department of Automation and Process Engineering (IAP), UiT-The Arctic University of Norway, 9006 Tromsø, Norway
Symmetry 2020, 12(4), 548; https://doi.org/10.3390/sym12040548
Submission received: 6 March 2020 / Revised: 27 March 2020 / Accepted: 30 March 2020 / Published: 4 April 2020

Abstract

:
In this paper, we propose a new feature descriptor for images that is based on the dihedral group D 4 , the symmetry group of the square. The group action of the D 4 elements on a square image region is used to create a vector space that forms the basis for the feature vector. For the evaluation, we employed the Error-Correcting Output Coding (ECOC) algorithm and tested our model with four diverse datasets. The results from the four databases used in this paper indicate that the feature vectors obtained from our proposed D 4 algorithm are comparable in performance to that of Histograms of Oriented Gradients (HOG) model. Furthermore, as the D 4 model encapsulates a complete set of orientations pertaining to the D 4 group, it enables its generalization to a wide range of image classification applications.

1. Introduction

In computer vision, a feature vector or descriptor for an image region is usually defined by mathematical operations on a set of neighboring pixels in the image region. These operations generally result in a compact representation of the image region, which reduces the computational complexity associated with classification tasks. An optimal feature vector should provide a suitable representation of an object or image region that enables its discrimination from the other objects or image regions in the scene.
Histogram of Oriented Gradients (HOG), as outlined in the study by Dalal and Triggs [1], is a feature descriptor that is commonly used for object detection. Its applications include: people detection in images and videos [1], pedestrian detection [2], palmprint recognition [3], sketch based image retrieval [4], scene text recognition [5], traffic sign detection [6], traffic light detection [7], and vehicle detection [8].
HOG is based on the idea that an object’s shape and appearance can be characterized by the distribution of local intensity gradients [1]. A feature vector in HOG algorithm is calculated by dividing an image into smaller regions called cells and for each cell accumulating a histogram of gradients for all pixels in the cell [1]. The local gradients are contrast-normalized by selecting larger regions called blocks and using the results to normalize all the cells in a block [1]. In a study [1] by Dalal and Triggs, the authors observed that the HOG based feature vector outperformed the wavelet [9], PCA-SIFT [10], and Shape context [11] based descriptors for a human detection test case.
Based on the success obtained by using local gradients or edge orientation in the HOG model [1], we hypothesize that the use the D 4 elements on a square image region can capture the local gradients. We investigate if the inherent properties of the complete set of elements pertaining to the D 4 group can form a natural basis for calculating a feature vector suitable for image discrimination. The D 4 group has shown promising results in various computer vision applications [12,13,14,15,16,17], which motivated us to use this group for our proposed algorithm.
The rest of the article is organized as follows. In Section 2, we briefly discuss the theory behind the dihedral group D 4 . In Section 3, we outline the proposed D 4 algorithm for calculating feature vector associated with a given image. In Section 3.3, we briefly explain the databases used for testing the performance of the proposed model. In Section 3.4.1, we briefly explain the ECOC algorithm that used for classification. In Section 4, we discuss the results obtained for the different datasets used in this paper. In Section 5, we discuss the different customizable aspects of the proposed D 4 model and possible future research directions. Finally, based on the results, we outline our conclusions.

2. Theory

A dihedral group D n is the group of symmetries of an n-sided regular polygon, i.e., all sides have the same length and all angles are equal. D n has n rotational symmetries and n reflection symmetries. In other words, it has n axes of symmetry and a total of 2n different symmetries [18]. For instance, the polygons for n = 3–6 and the associated reflection symmetries are shown in Figure 1. Here, we can see that, if n is odd, each axis of symmetry connects the vertex with the midpoint of the opposite side. If n is even, there are n/2 symmetry axes connecting the midpoints of opposite sides and n/2 symmetry axes connecting opposite vertices.
A group is a set G together with a binary operation ∗ on its elements. This operation ∗ must behave such that:
(i)
G must be closed under ∗, that is, for every pair of elements g 1 , g 2 in G we must have that g 1 g 2 is again an element in G.
(ii)
The operation ∗ must be associative, that is, for all elements g 1 , g 2 , g 3 in G we must have that
g 1 ( g 2 g 3 ) = ( g 1 g 2 ) g 3 .
(iii)
There is an element e in G, called the identity element, such that for all g G we have that
e g = g = g e .
(iv)
For every element g in G there is an element g 1 in G, called the inverse of g, such that
g g 1 = e = g 1 g .

The Group D 4

The group D 4 has eight elements, four rotational symmetries and four reflection symmetries. The rotations are 0 , 90 , 180 , and 270 , and the reflections are defined along the four axes shown in Figure 1. We refer to these elements as σ 0 , σ 1 , , σ 7 . Note that the identity element is rotation by 0 , and that for each element there is another element that has the opposite effect on the square, as required in the definition of a group. As an example of one of the group elements, consider Figure 2, where we demonstrate rotation by 90 counterclockwise on a square with labeled corners.

3. Method

In this section, we describe the details of our proposed algorithm. First, we discuss the colorspace used for our proposed model. Second, we describe the procedure used to obtain the D 4 based feature vector from a given image. Third, we discuss the conditions under which the proposed model can generate sparse feature vectors and describe our proposed solution to mitigate that problem. Fourth, we briefly explain details of the four different databases used in our analysis. Fifth, we outline details of the procedure used for the analysis and discuss the ECOC algorithm.

3.1. De-Correlated Color Space

As a first step, to reduce redundant information across the color channels, the input RGB color image I is de-correlated. In line with the study by Sharma [17], the color channels are de-correlated as follows: First, the matrix entries of I are reorganized to create a two-dimensional matrix M of size w × n , where n is the number of channels and w is the length of vector, i.e., the product of the length of matrix rows and columns. In the case of an RGB image, n = 3 . After that, the matrix entries of M are normalized by the mean for each channel.Next, we calculate the correlation matrix of M as,
C = M T M ,
where the size of C is n by n. Following this, the Eigen decomposition of a symmetric matrix is calculated as,
C = V D V T ,
where V is a square matrix whose columns are Eigenvectors of C, while D is the diagonal matrix whose diagonal entries are the corresponding Eigenvalues. Finally, the RGB image channels are transformed into Eigenvector space (also known as principal components) as:
S = V T ( I μ ) ,
where μ is the mean for each channel and S is the transformed space matrix that represent the de-correlated channels. As an example, the de-correlated channels of an RGB image is shown in Figure 3.
If the input image is grayscale only, we perform a histogram equalization on the image and normalize it in the range [0 1].

3.2. Proposed D 4 Model

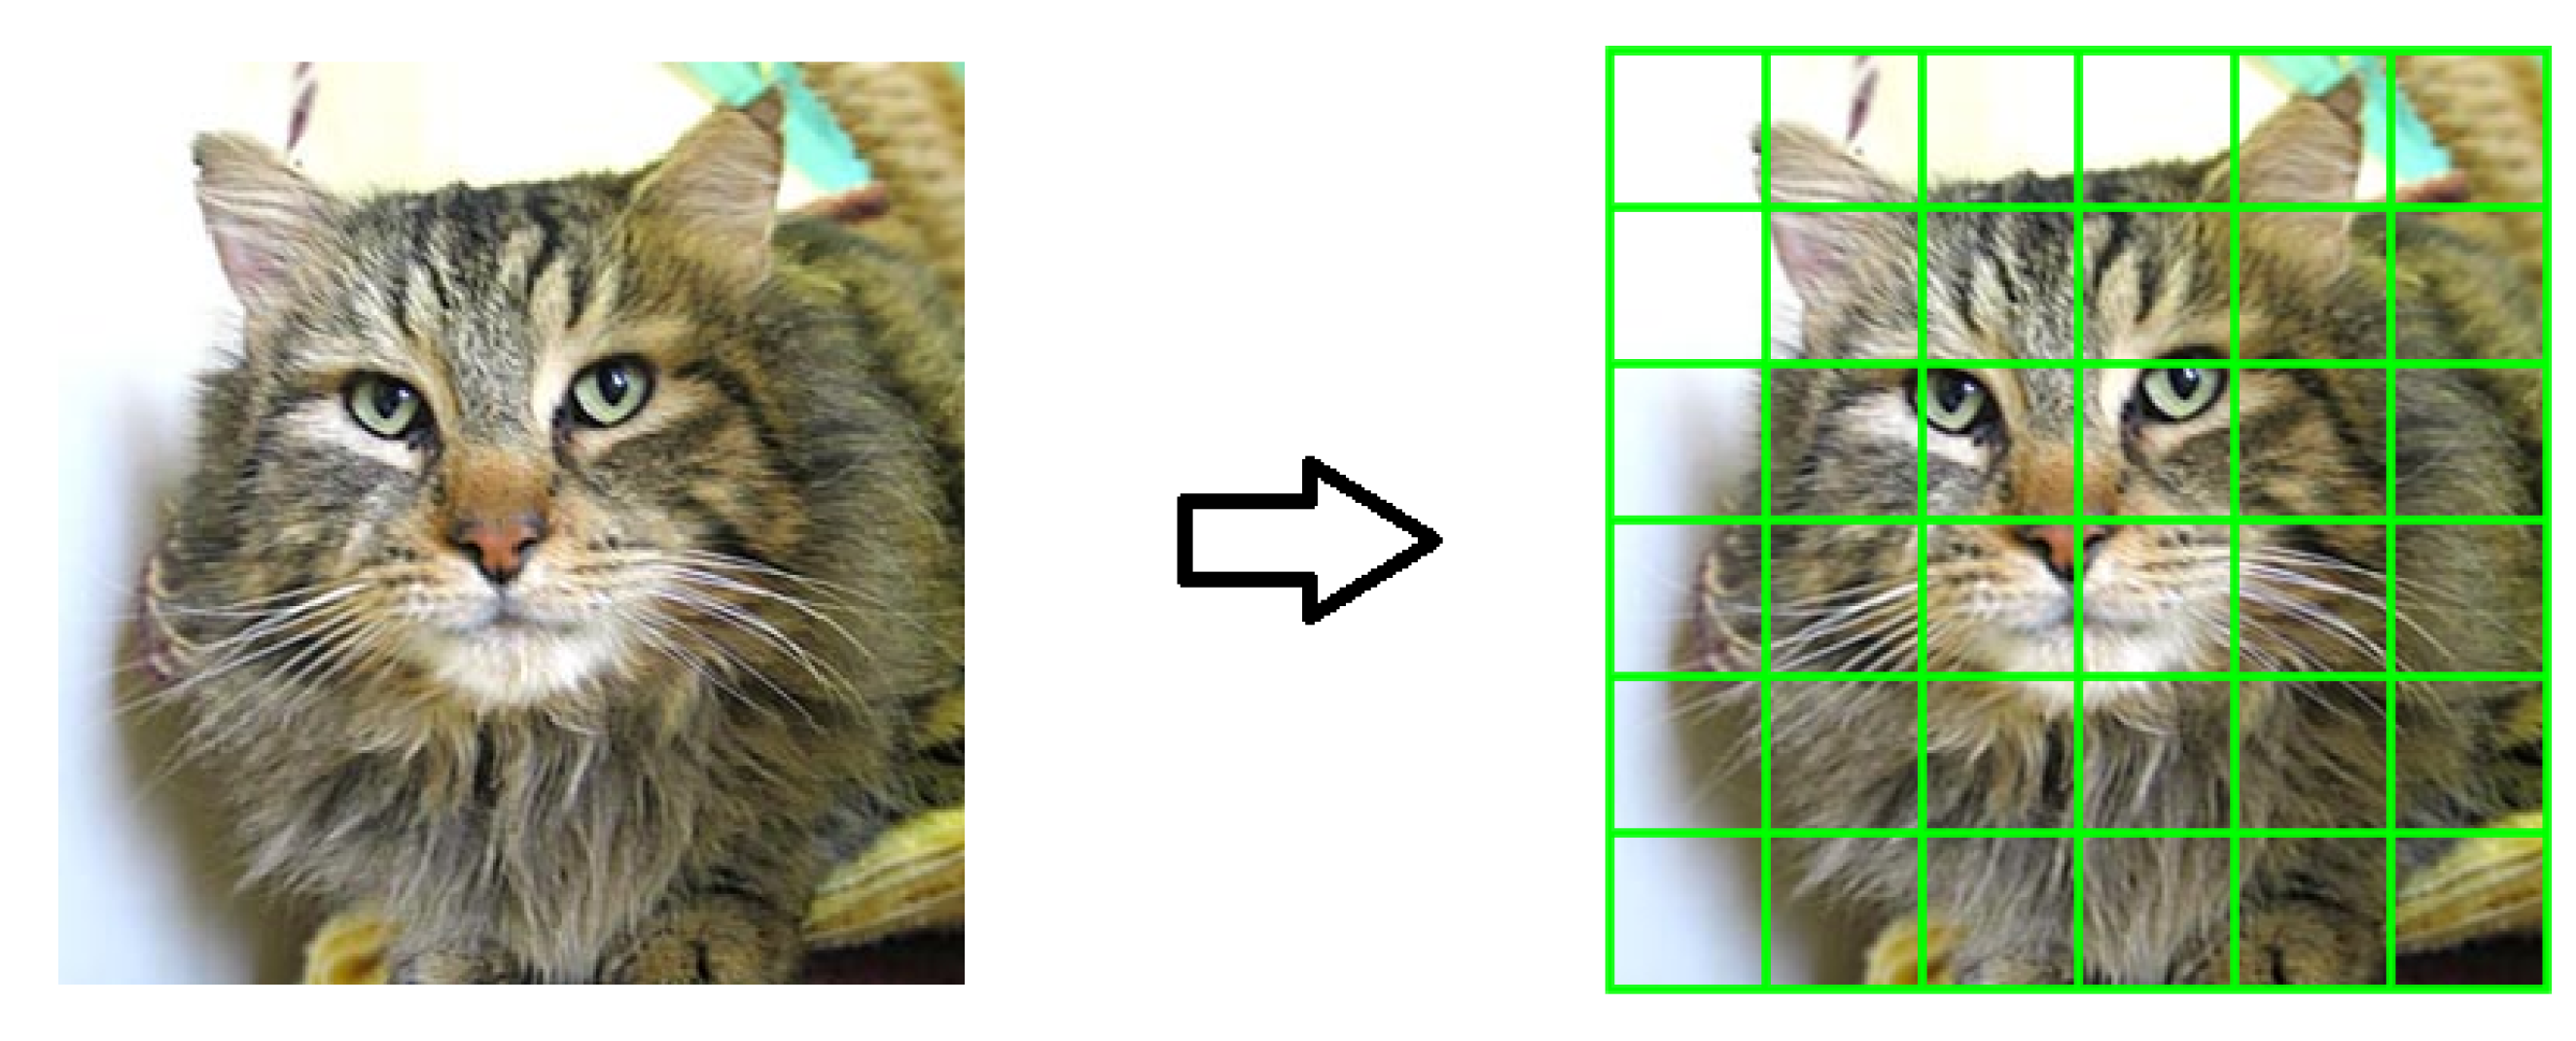
To calculate feature vector associated with an input image, we decompose the image into k square regions of size N by N pixels each as shown in Figure 4. Please note that the choice of N can influence the results, which is discussed below in Section 4. If an image size is not a multiple of the square region size, the image borders are extended by padding with neighboring information.
B (i.e., a square region) is defined as an N × N -matrix and σ i as one of the eight group elements of D 4 . The eight elements are the rotations along 0 , 90 , 180 , and 270 , and the reflections along the horizontal, vertical, and two diagonal axes of the square. As an example, the eight group transformations pertaining to a square block of an image are shown in Figure 5. As asymmetry associated with rotation by 0 is trivial, there are only seven unique asymmetries to be considered; these seven asymmetries are used in the proposed algorithm. The asymmetry of square region B by σ i is denoted by A i ( B ) to be,
A i ( B ) = 1 N 2 j = 1 N 2 | B j ( σ i B ) j | ,
where i = { 1 , 2 , 3 , 4 , 5 , 6 , 7 } and N 2 is the total number of pixels in each square region. In other words, asymmetry for each unique group element is represented by a positive real value that is obtained by the mean square root of the absolute value norm associated with the matrix differences of B and σ i B.
Finally, the seven scalar asymmetry values associated with each square region in the image are collected in a matrix R and normalized in the range [0 1] for each element.
Figure 6 shows the different features associated with a cat image captured by the different asymmetries R 1 to R 7 . This results in a k × 7 × 3 sized feature vector where k corresponds to the number of blocks into which an input image is divided, 7 corresponds to the number of different asymmetries, and 3 corresponds to the number of channels associated with the input RGB image. This resulting feature vector is then used for image classification tasks.
The proposed D 4 model was implemented using MATLAB and its implementation will be made available at the MathWorks file exchange website.

Special Case

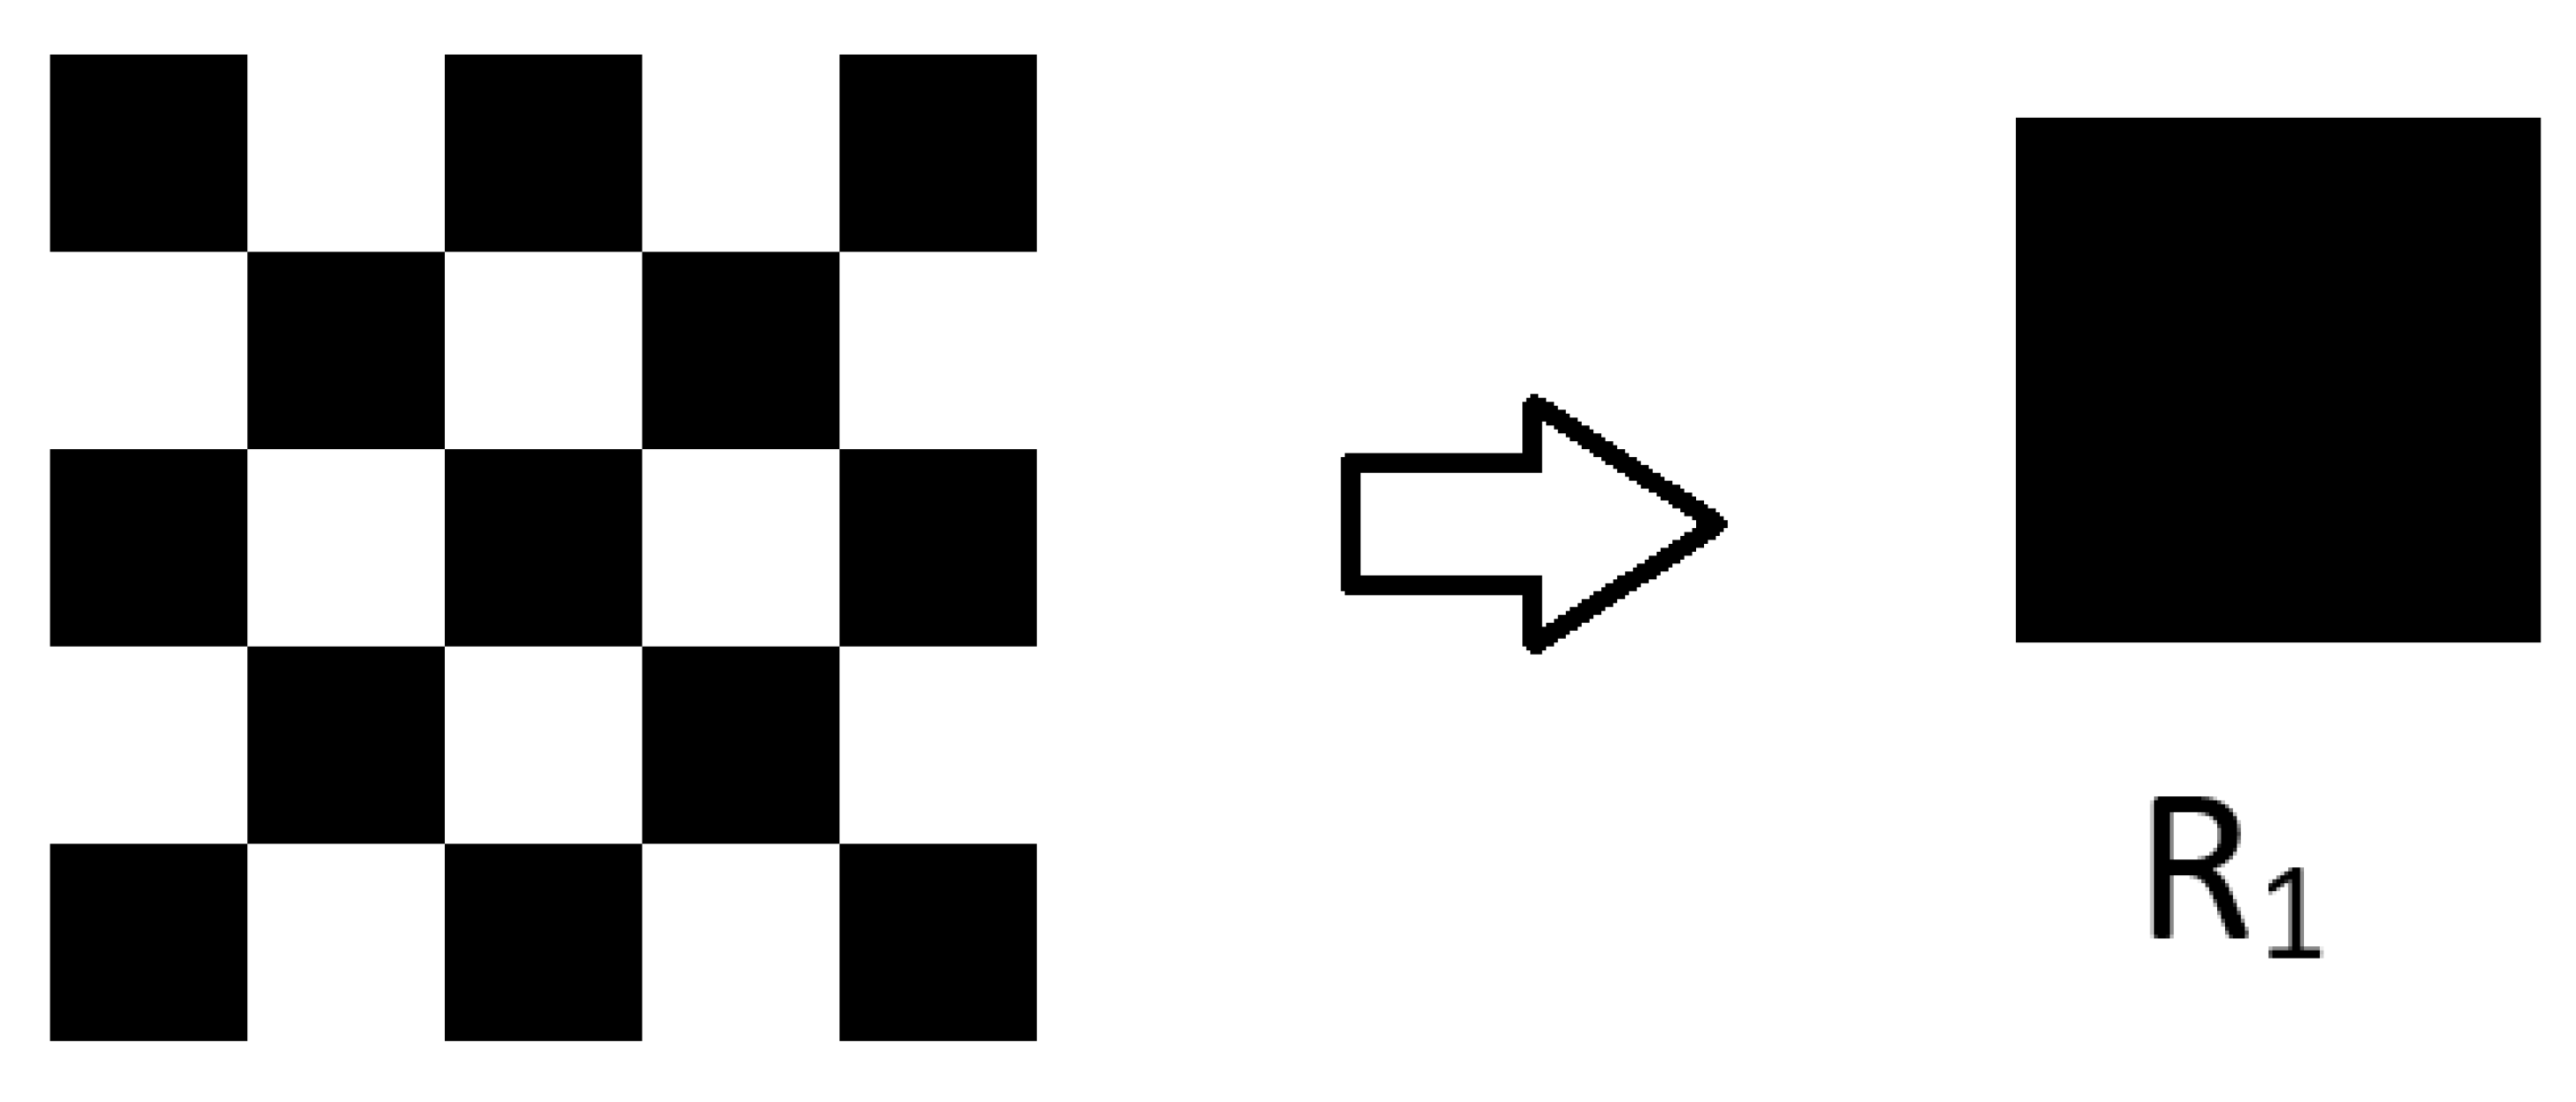
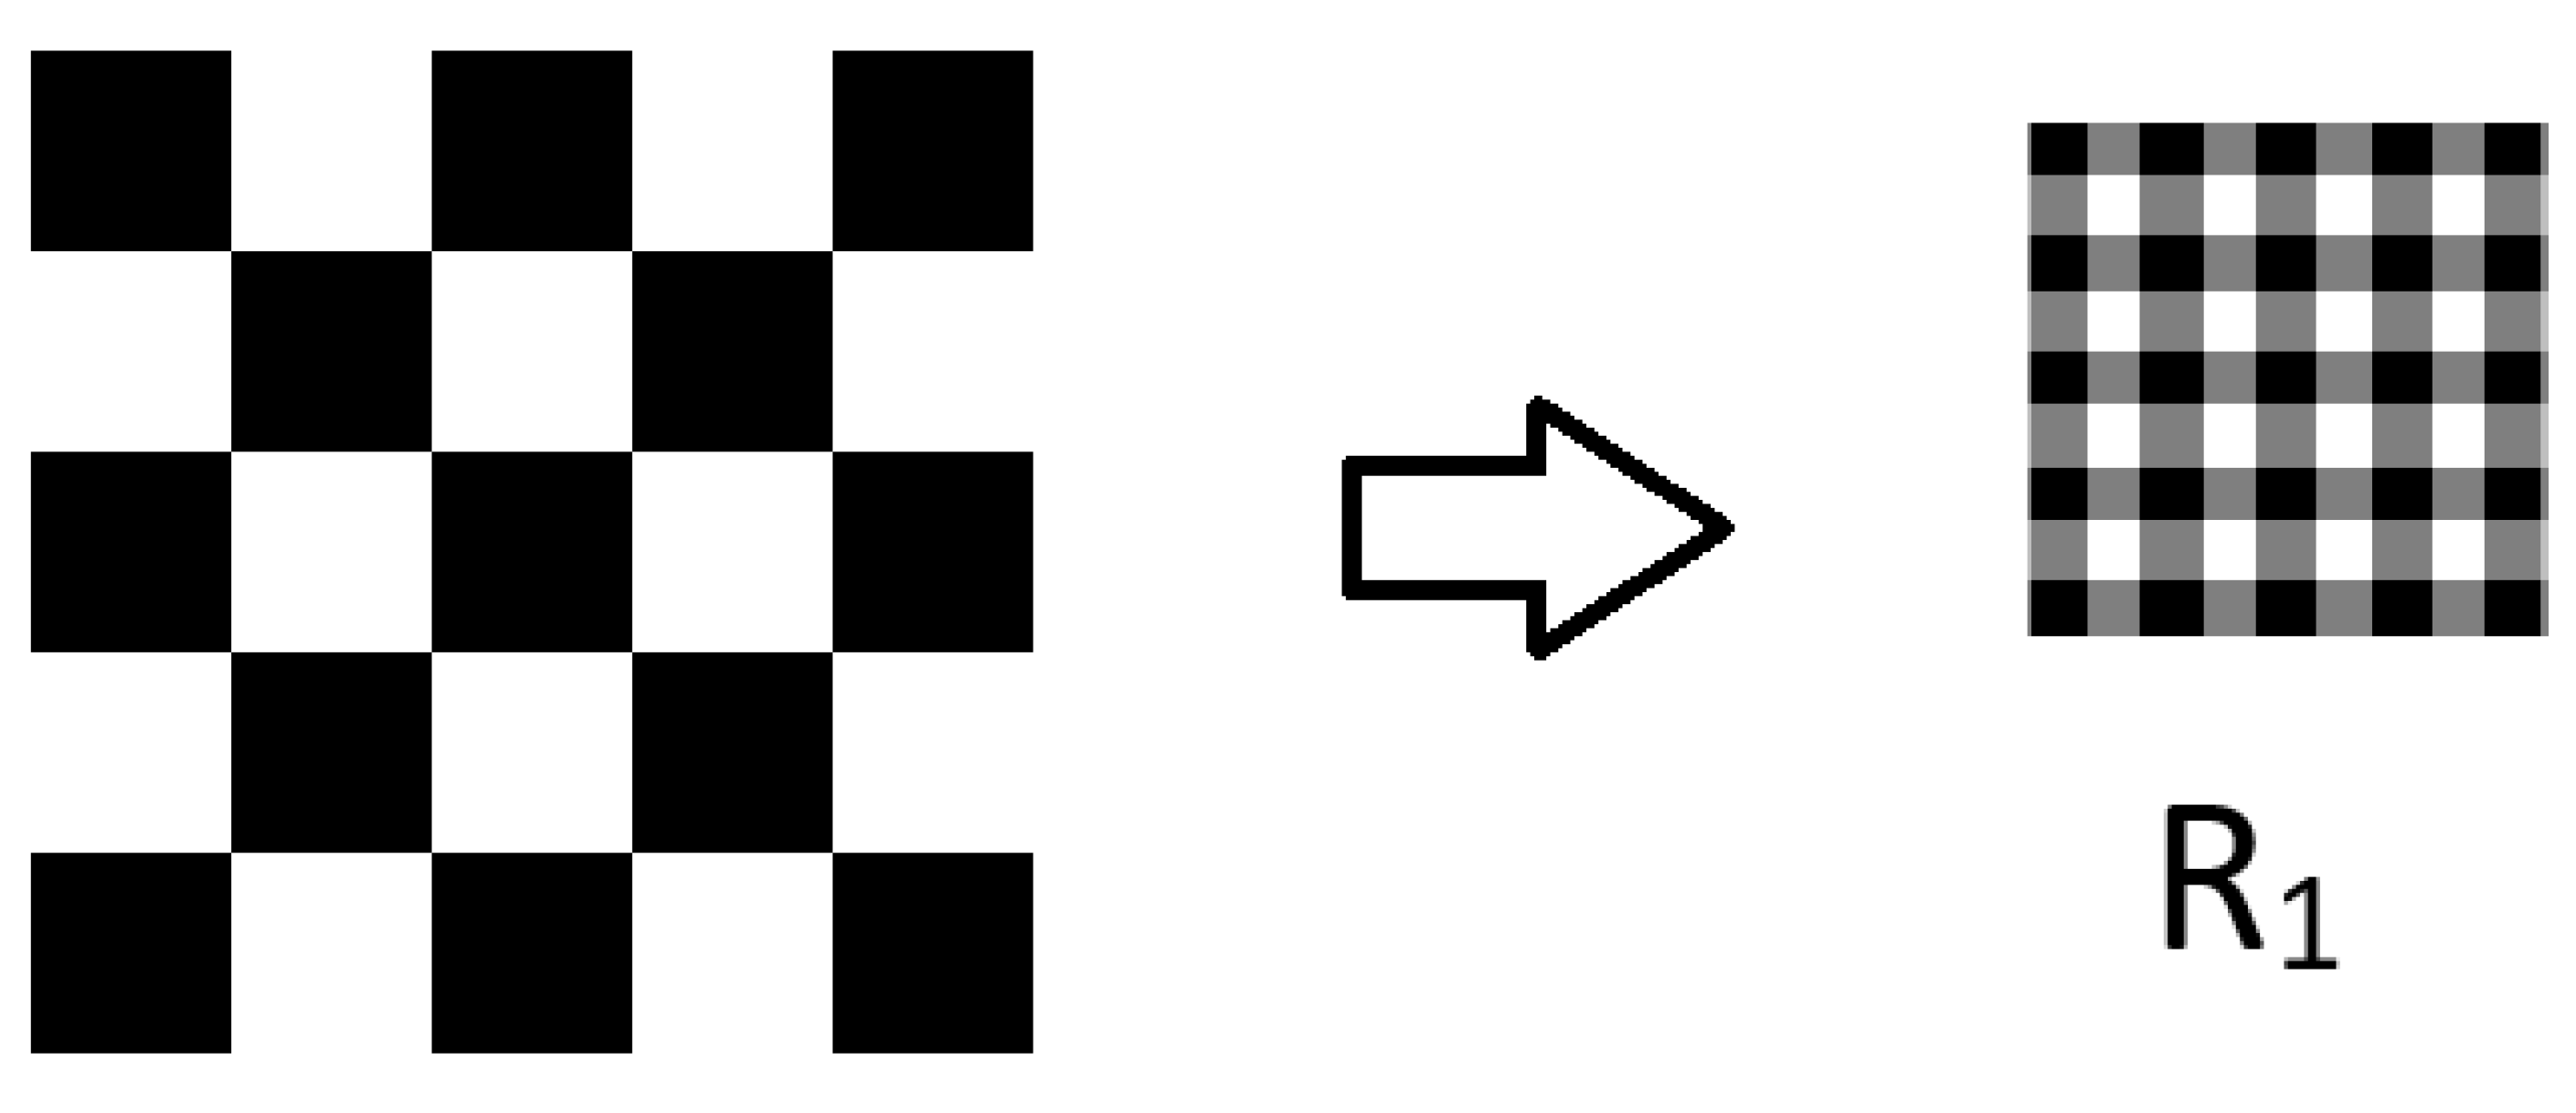
A typical limitation of the proposed algorithm is that, for completely symmetric patterns such as shown in Figure 7, the feature vectors generated will be sparse. This can be addressed by selecting the square blocks with an overlap, as shown in Figure 8. Please note that, for our calculations, we used an overlap of 50% for each block, which was an arbitrary choice.

3.3. Databases

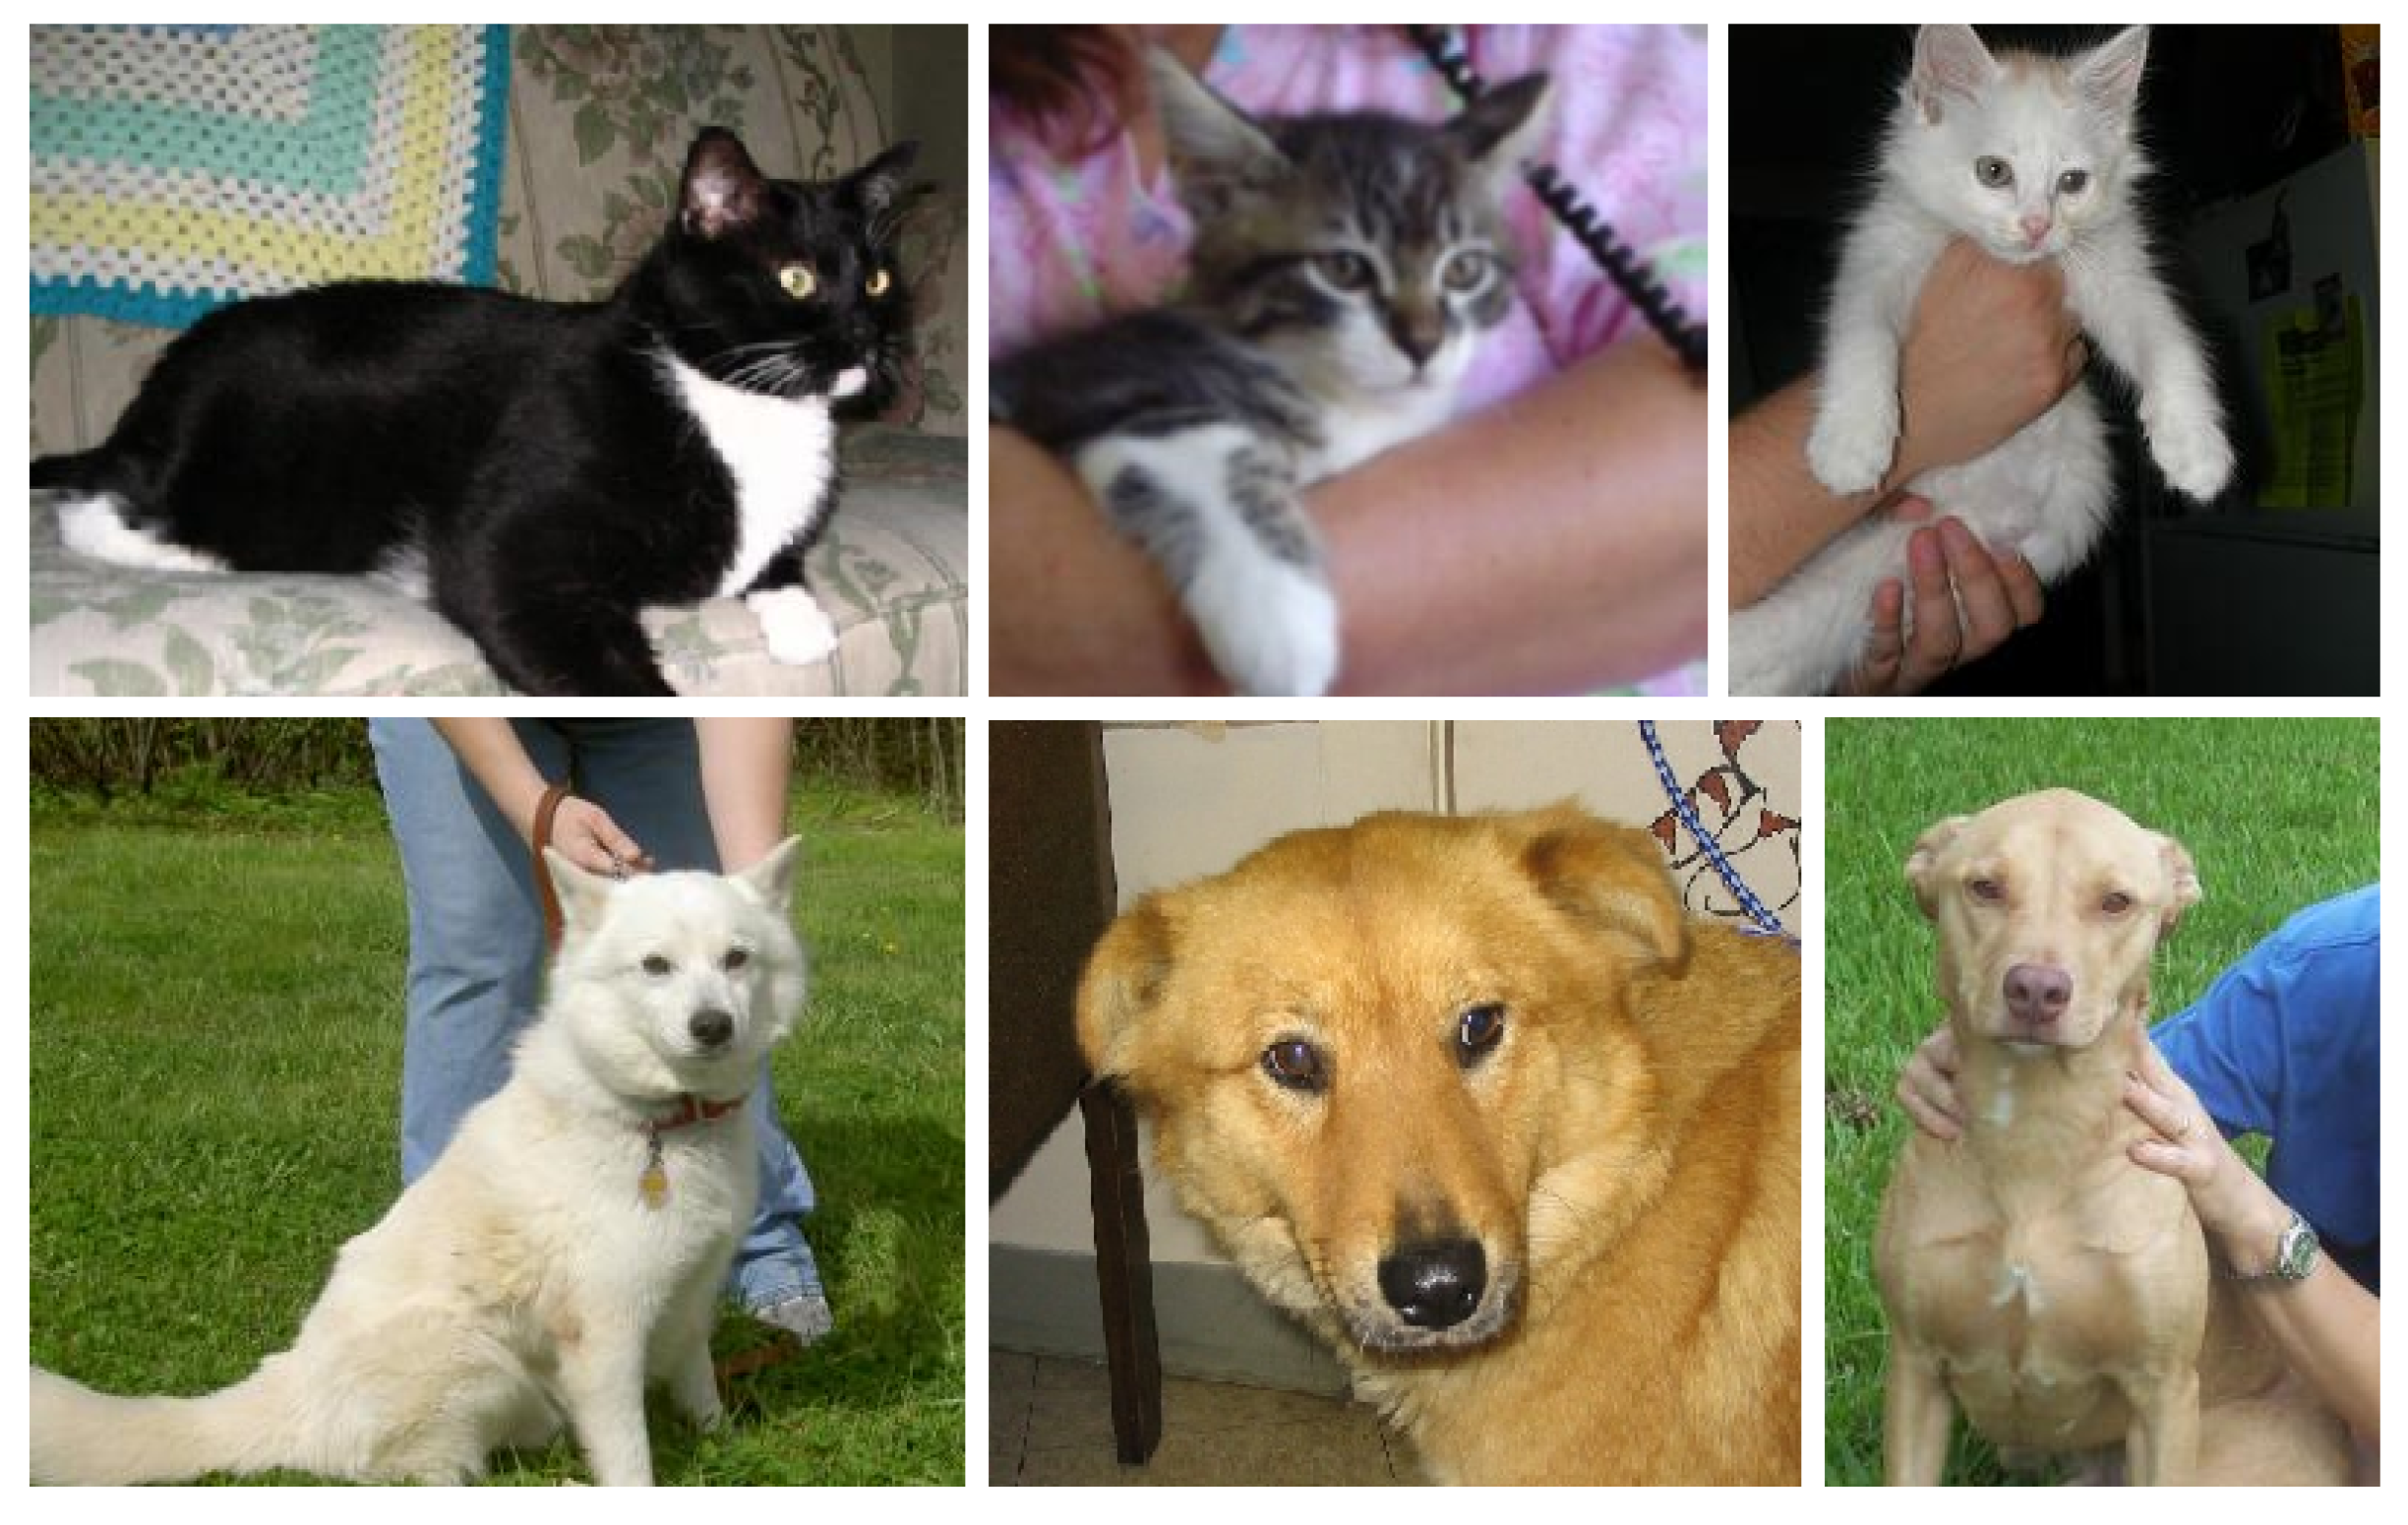
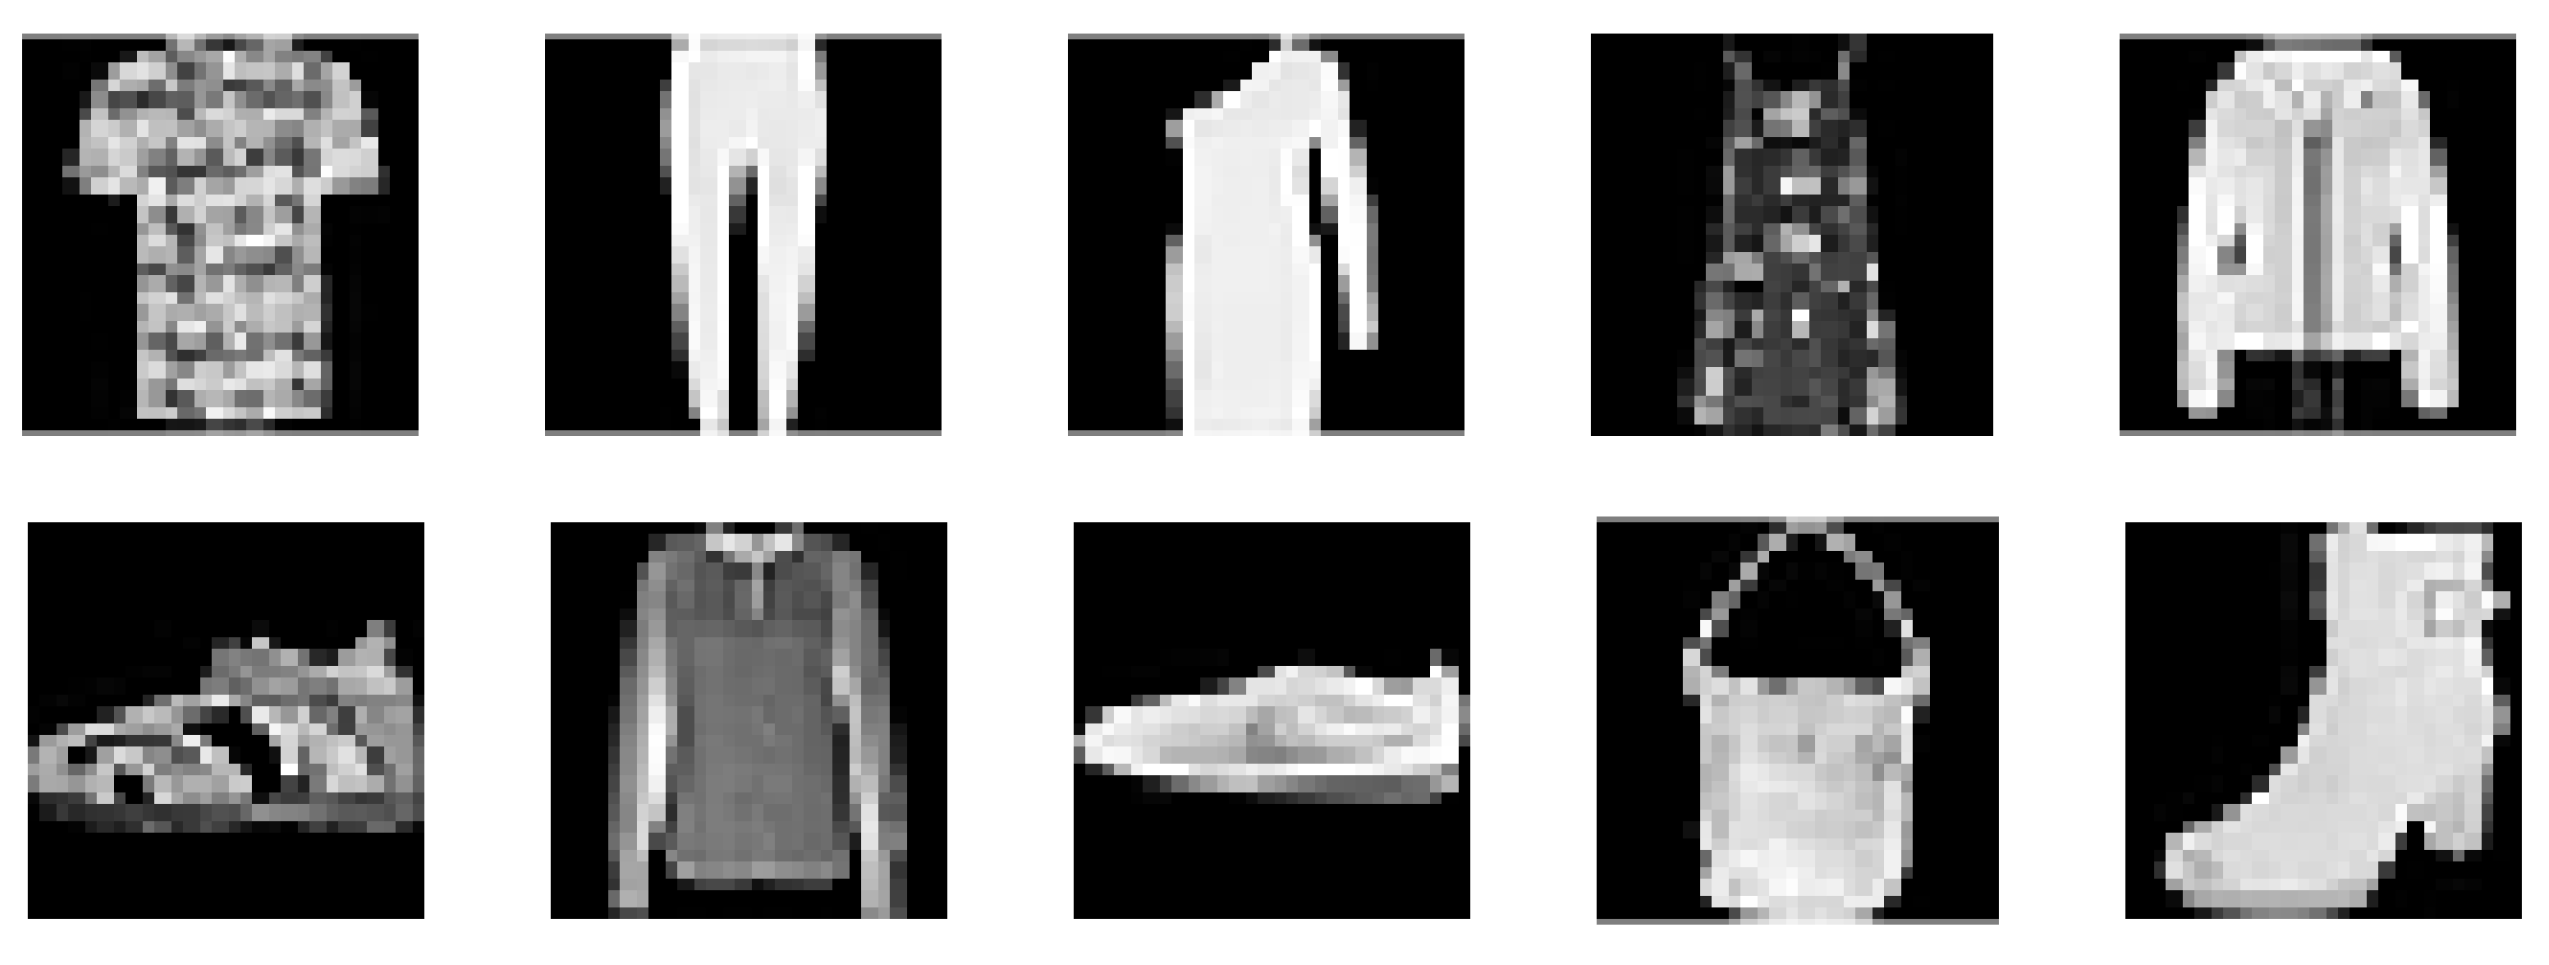
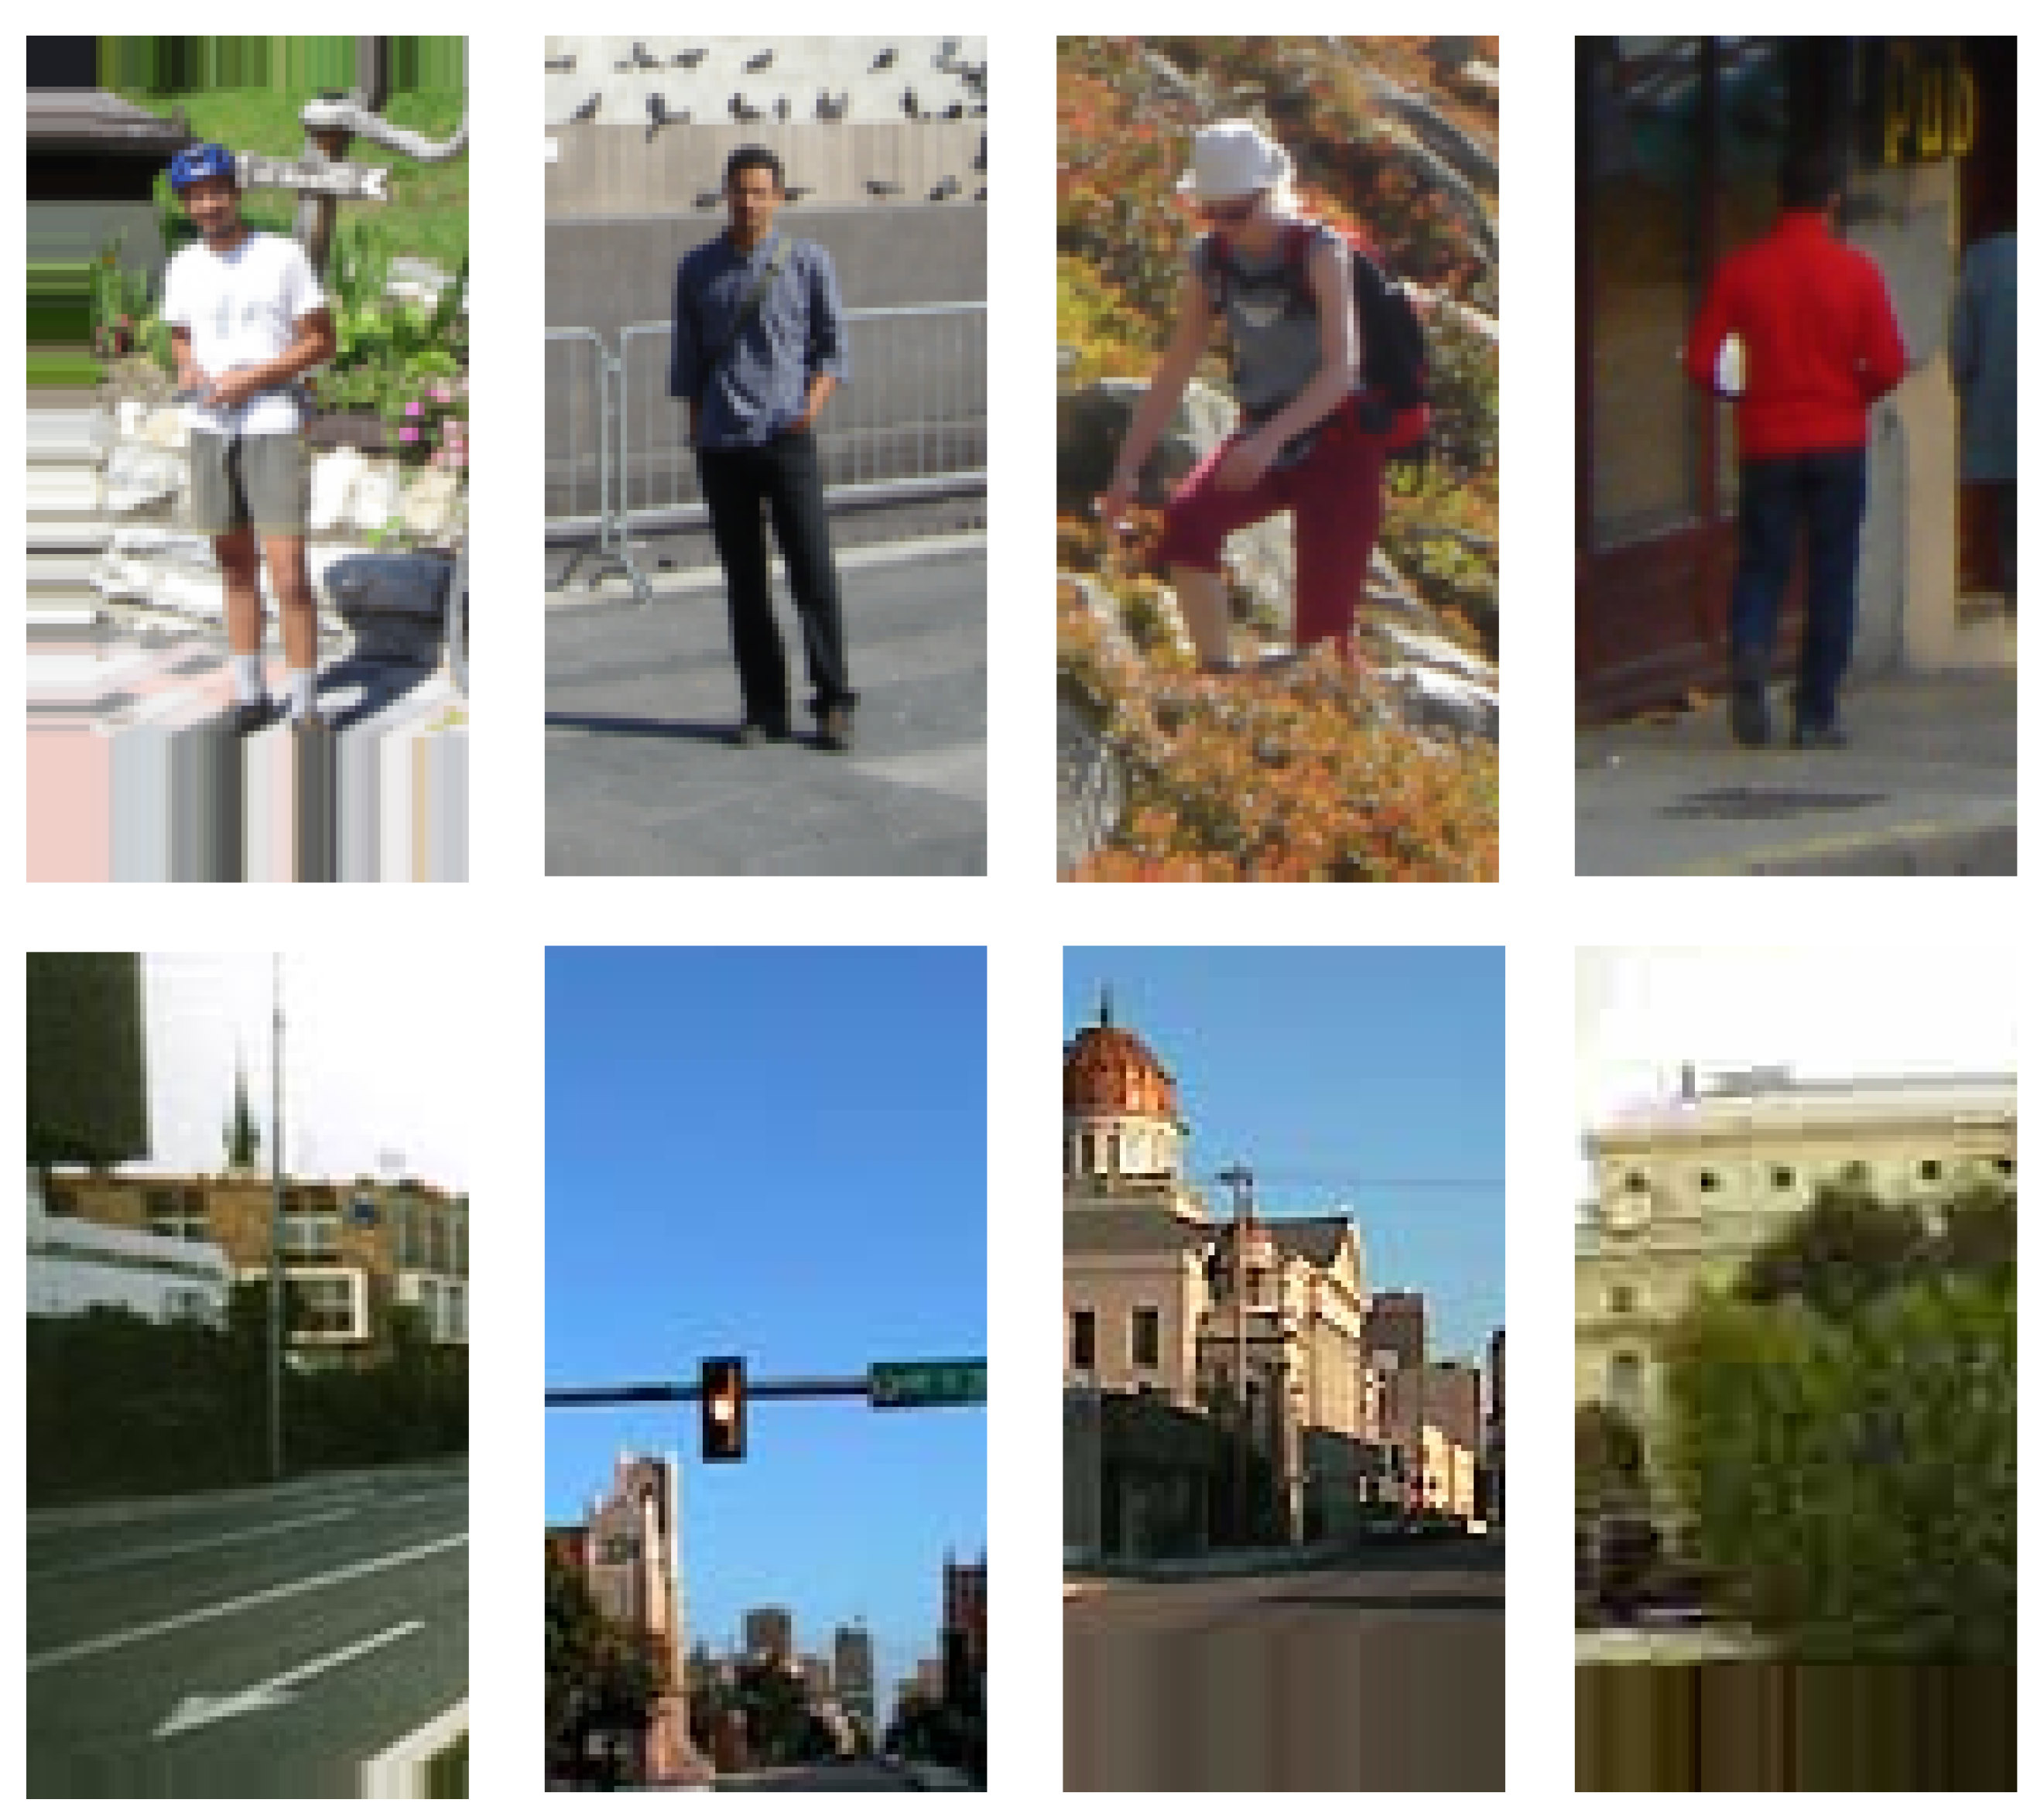
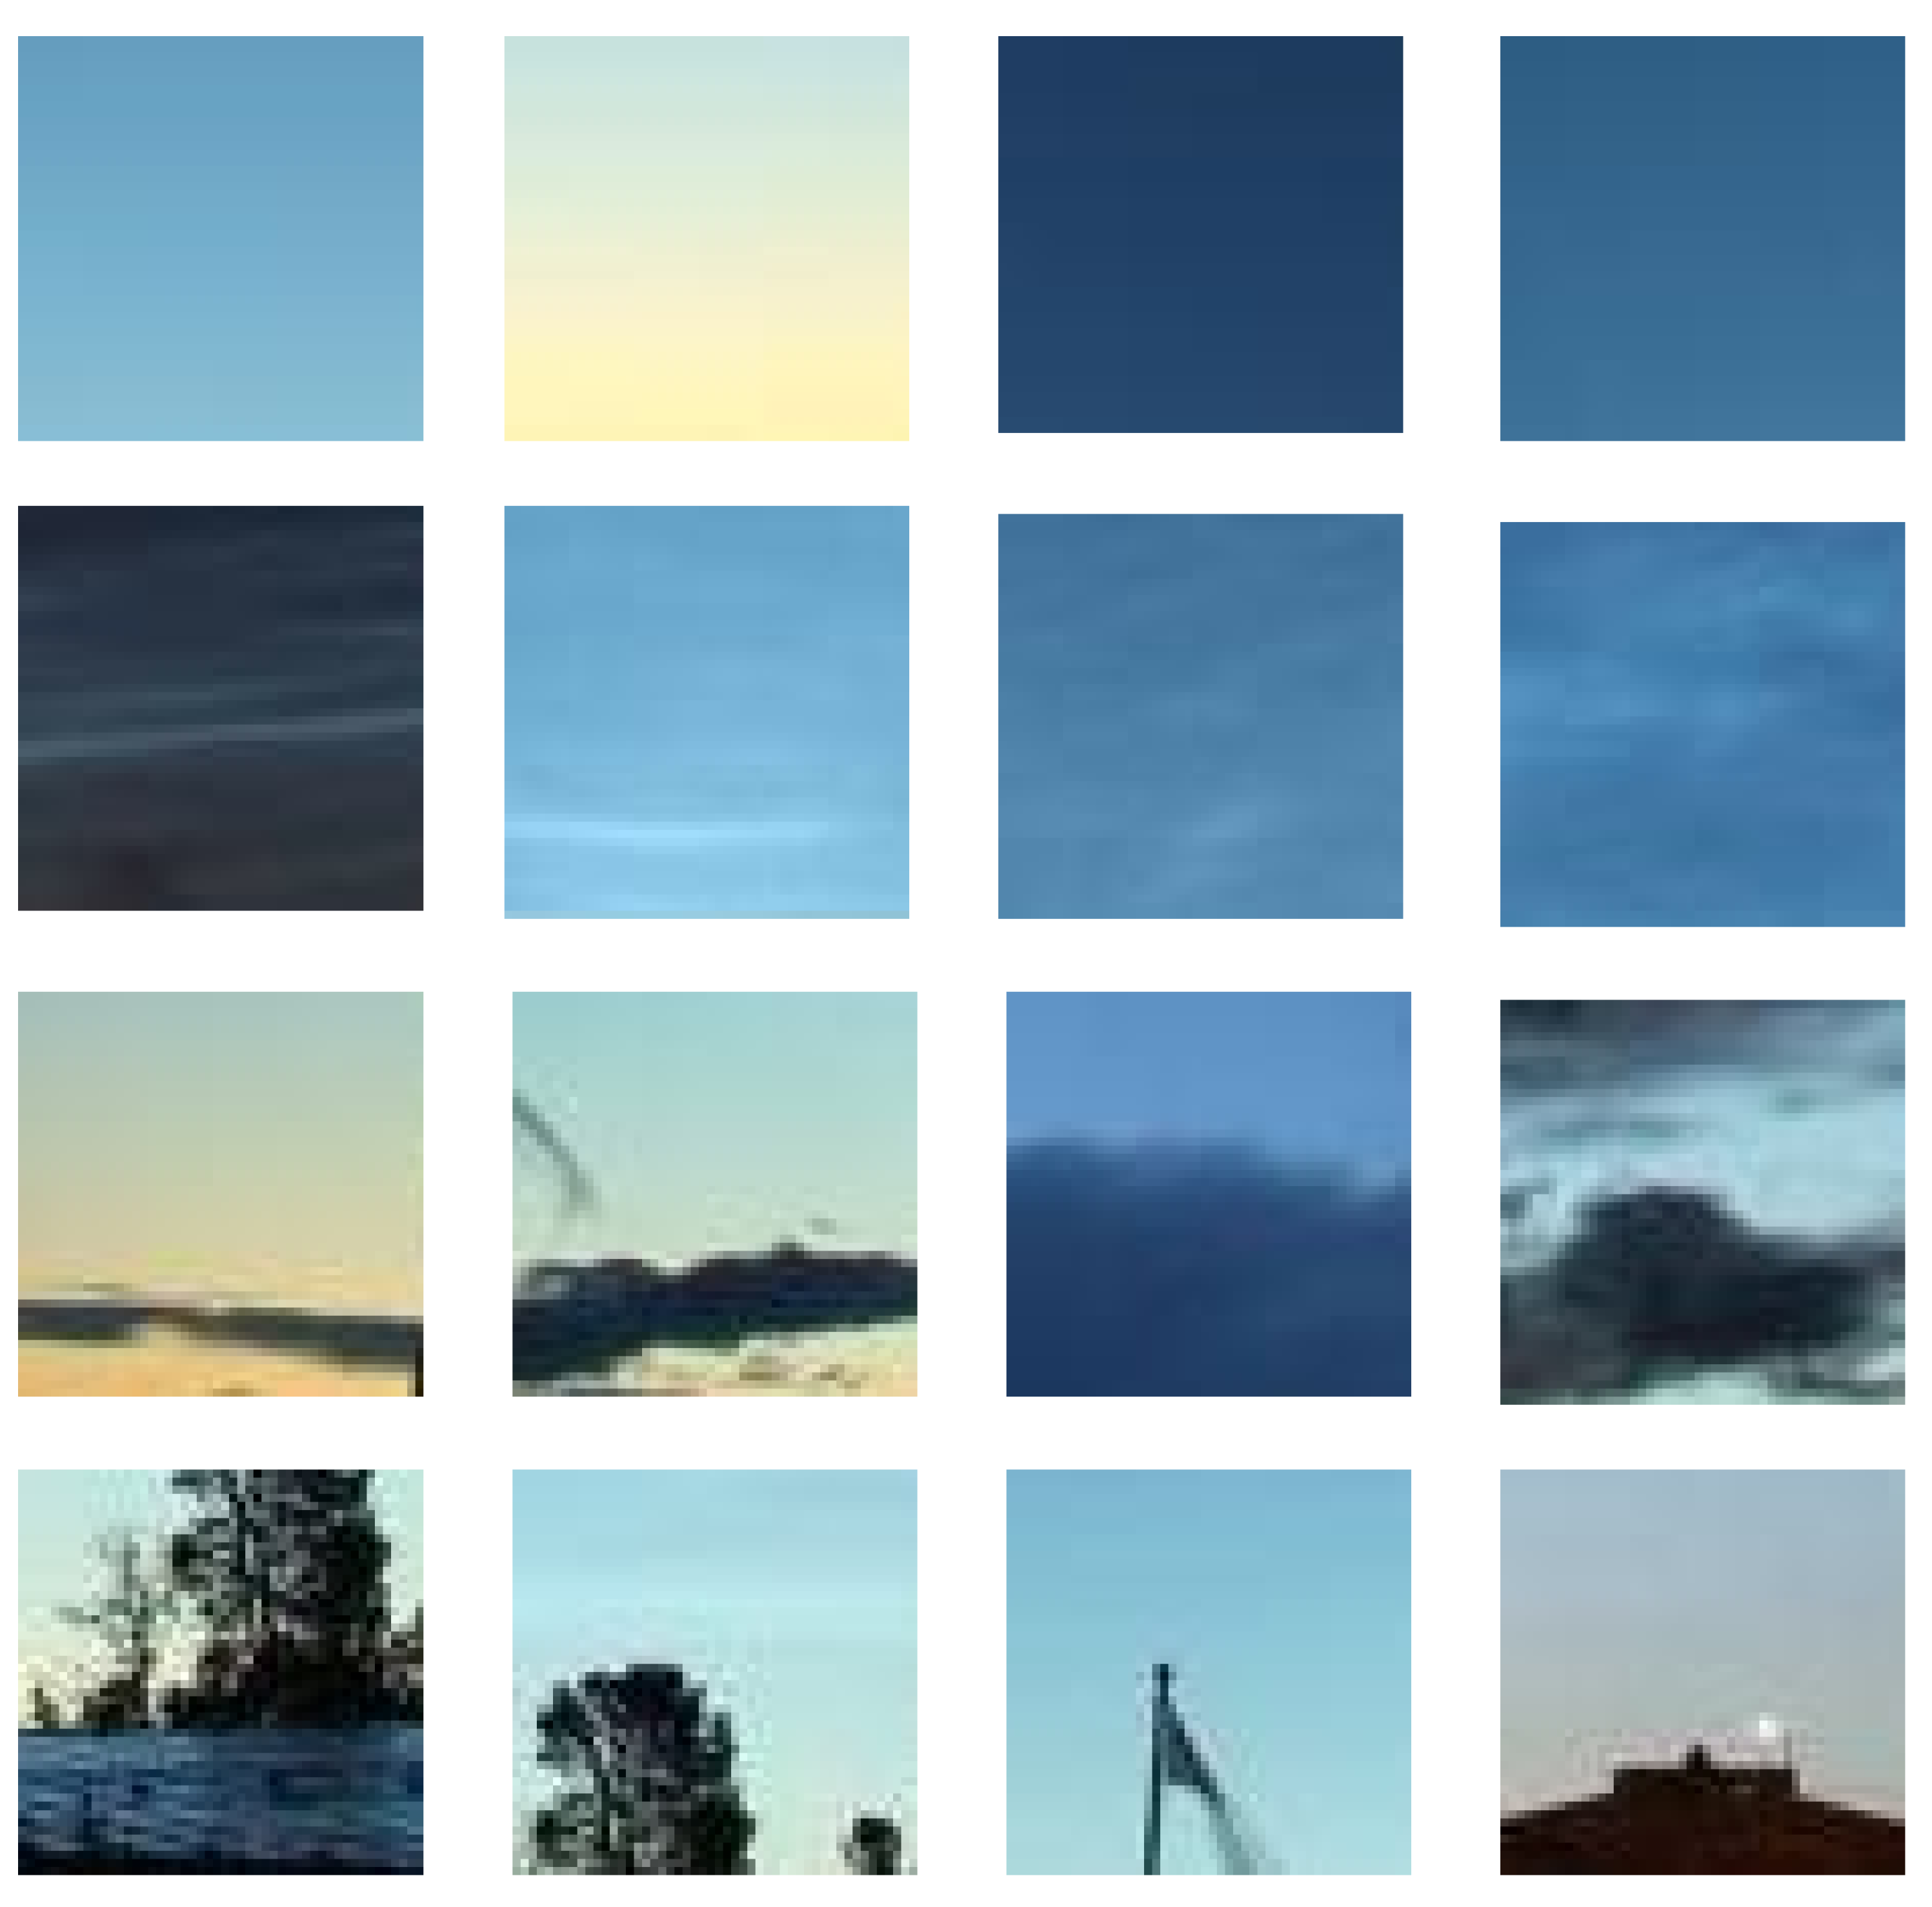
To evaluate the performance of the feature vector obtained from the D 4 model, we used four different datasets: Cats and Dogs [19], Fashion-MNIST [20], Person [1], and NLC [21]. The Cats and Dogs [19] dataset consists of 8192 RGB color images of cats and dogs. A few sample images of the two categories are shown in Figure 9. As the pictures are taken in complex backgrounds, this dataset is considered to be quite challenging for machine learning algorithms [22]. The Fashion-MNIST [20] dataset consists of grayscale images of clothing items belonging to 10 different categories. Using this dataset enables us to explore our proposed model for image data that lack color information. For instance, a few sample images belonging to the Fashion-MNIST [20] dataset are shown in Figure 10. The Person [1] dataset consists of color RGB images of people in different upright positions (as shown in Figure 11) and is divided into two categories consisting of positive samples with people and negative samples for images without people. The NLC [21] dataset consists of color images of sky, which are divided into four categories: noctilucent clouds, tropospheric clouds, clear sky, and rest. This is a unique dataset as it does not contain the usual shapes, such as people, animals, and clothing items, which exist in the other datasets. For example, a few samples of images belonging to the different categories are shown in Figure 12. For more details on the datasets, please see Table 1.

3.4. Procedure for Analysis

In this section, we outline the procedure used for analysis of proposed D 4 model for the four different datasets used in this paper. We compared the performance of the proposed D 4 model with that of the HOG [1] model by employing the ECOC algorithm. For the training phase of the ECOC algorithm, we used 60% of the samples for each dataset and for evaluating the performance we used 40% of the data. The total number of samples used in our analysis and the size of sample images for each dataset are shown in Table 1. The data samples for each database were randomized prior to selection for training and testing.

ECOC Algorithm

The ECOC algorithm is suitable for problems that involve instances belonging to multiple classes or categories [23]. For instance, in an optical digit recognition task, each handwritten character can belong to one of the ten different classes associated with digits from 0 to 9.
The ECOC algorithm [23] is based on the approach of distributed output code mentioned in the study by Sejnowski et al. [24]. Here, the general idea is to decompose a problem into several binary problems by using a binary classifier (such as a support vector machine [25]). This means that, for a given class i, it should be able to discriminate among the patterns of the class i and the rest of the classes [26]. In this manner, each class is assigned a unique n bit binary string called a codeword [23], where each bit identifies the membership of the class to a classifier [27]. In the evaluation stage, the classification decision is based on the output codeword obtained from the binary classifiers. The distances between codewords of the output and the classes are calculated and the class with the shortest distance is assigned as the predicted class. For our calculations, we used the ECOC model with SVM from MATLAB.

4. Results

In this section, we discuss the results obtained by testing different colorspaces, norm functions, and the comparison of the D 4 model and HOG [1] model across the four different datasets.

4.1. Colorspace Selection

We used percentage accuracy as a metric for judging the performance of a model, which is defined as the ratio of number of samples with correct classification to that of the total number of samples used for testing.
To see if the choice of a colorspace can influence the performance of the proposed D 4 model, we used the Person [1] dataset for testing. Our results, as shown in Table 2, indicate that for RGB colorspace the accuracy is slightly lower than that of the HSV and De-Corr colorspaces. For our analysis in the rest of the paper, we use the HSV colorspace for the D 4 model.

4.2. Norm Function Selection

We testrf different norm functions for calculation of the values associated with asymmetries as defined in Equation (4). Three functions, namely L 1 norm, L 2 norm, and our proposed norm defined by mean square-root of absolute differences, were evaluated for the Person [1] dataset. The results shown in Table 3 suggest that different norm functions influence the accuracy of the prediction with our proposed norm giving the highest accuracy. Thus, this norm function was employed in our proposed D 4 model.

4.3. Comparison for Different Databases

We compared the performance of feature vectors generated by using the proposed D 4 model and the HOG [1] model for four different datasets. As shown in Table 4, different block or cell sizes used in the D 4 and HOG [1] models lead of different feature vector sizes. Please note that N is the block size in case of the D 4 model and the cell size in case of the HOG [1] model.
A larger block or cell size can generate a compact feature vector for both D 4 and HOG [1] models. However, it can also reduce the accuracy, as illustrated by the results associated with the NLC [21] dataset, where the accuracy of both D 4 and HOG [1] models decrease when the block or cell size is increased from 8 to 16. A larger feature vector can capture more details associated with an image, but it also increases the computational complexity associated with the classification task.
The accuracy percentages in Table 4 indicate that, for the Cats and Dogs [19] dataset, the HOG [1] model performs better than that of the D 4 model. For the Person [1] dataset, the performance of both D 4 and HOG [1] models are quite similar. For the Fashion-MNIST [20] dataset, both models have identical accuracies. For the NLC [21] dataset, the D 4 model performs better than the HOG [1] model. These results indicate that, for the four different datasets used in this paper, both D 4 and HOG [1] models are quite similar in terms of their performance.
To see if combining the proposed D 4 and the HOG [1] models could provide a better classification accuracy, we combined the feature vectors from both algorithms. The associated accuracies can be observed in Table 4. We note that the combined models outperform the individual models for all four datasets. This indicates that there are differences in the feature vectors obtained from the proposed D 4 and the HOG [1] models that can further improve the performance of classification.

5. Discussion

As mentioned in Section 4.1, the proposed D 4 model is influenced by the choice of colorspace used for calculation of the feature vector. For images, the colorspaces that generate uncorrelated channels such as L*a*b*, HSV, and De-Corr give better classification accuracies as compared to traditional RGB channels.
The choice of norm function, as outlined in Section 4.2, can also influence the performance of the D 4 based feature vector. We employed a custom norm function that returns a scalar value associated with a particular asymmetry as defined by the D 4 group elements. The feature vectors generated by using this norm function give better accuracies than the feature vectors using the L 1 and L 2 norm functions. It should be noted that a recent study by Ballesteros and Salgado [28], where the authors explored the optimal parameters for the HOG [1] model, suggests that the choice of norm function depends on the task at hand.
As shown in Table 4, the choice of block size for calculating the feature vector for the D 4 model can influence the accuracy of the classification. Using a larger block size can generate a compact feature vector, but, it can also reduce the accuracy of prediction, as discussed in Section 4.3. This implies that the choice of block size is dependent on the type of classification problem.
The proposed D 4 model calculates a feature vector for a given image based on seven unique asymmetries associated with the dihedral group D 4 . These asymmetries encapsulate the local gradients in a suitable manner that renders them to be used as a feature vector. This can be observed from the results obtained in Section 4.3, where the performance of the D 4 model is comparable to that of the HOG [1] model. Furthermore, the simplicity of asymmetry calculations reduces the computational complexity of the D 4 model.
The combined D 4 and HOG models outperform the individual D 4 and HOG models for all the datasets used in this paper (as shown in Table 4). This implies that, for a given image, the feature vectors generated from the two models are not identical.
Studies by Bilgic et al. [29] and Hong et al. [30] on improving the robustness and using the HOG [1] model for real-time tasks suggest employing the AdaBoost algorithm to combine the results from a set of weak classifications by using multiple iterations to provide a robust classification output. Similar approaches can be applied to the proposed D 4 model to improve its robustness and enable its use in real-time applications. This is something we plan to address in the future.
In the future, the proposed D 4 model based feature vector approach can be extended to three-dimensional image data. This can achieved by dividing the three-dimensional image space into cube spaces and by employing the symmetry group associated with a cube, i.e., using the S 4 × S 2 group transformations. S 2 is the symmetric group of degree 2 and has two elements: the identity and the permutation interchanging the two points [18]. S 4 is a symmetric group of degree 4, i.e., all permutations on a set of size four [18]. This group has 24 elements that are obtained by rotations about opposite faces, opposite diagonals and opposite edges of the cube.

6. Conclusions

In this article, we propose a new feature descriptor for images that has its basis in the dihedral group D 4 elements. The group action of the D 4 elements on a square image region is used to create a vector space that forms the basis for the feature vector. For testing the performance of the D 4 based feature vector, we used an Error-Correcting Output Coding (ECOC) algorithm. An evaluation was performed using four different datasets. Our results show that the proposed D 4 algorithm is comparable in performance to that of Histograms of Oriented Gradients (HOG) model. In addition, as the D 4 model captures the complete set of orientations pertaining to the D 4 group, it enables its generalization to a wide range of image classification tasks. In addition, we outline a few approaches towards future research directions.

Funding

This research received no external funding.

Acknowledgments

The publication charges for this article have been funded by a grant from the publication fund of UiT The Arctic University of Norway. The author would like to thank Steven Jackson and Anders Nordli for proof-reading the manuscript.

Conflicts of Interest

The author declares no conflict of interest.

References

  1. Dalal, N.; Triggs, B. Histograms of oriented gradients for human detection. In Proceedings of the 2005 IEEE Computer Society Conference on Computer Vision and Pattern Recognition (CVPR’05), San Diego, CA, USA, 20–25 June 2005; Volume 1, pp. 886–893. [Google Scholar] [CrossRef] [Green Version]
  2. Ma, Y.; Chen, X.; Chen, G. Pedestrian Detection and Tracking Using HOG and Oriented-LBP Features. In Network and Parallel Computing; Altman, E., Shi, W., Eds.; Springer: Berlin/Heidelberg, Germany, 2011; pp. 176–184. [Google Scholar]
  3. Jia, W.; Hu, R.; Lei, Y.; Zhao, Y.; Gui, J. Histogram of Oriented Lines for Palmprint Recognition. IEEE Trans. Syst. Man Cybern. Syst. 2014, 44, 385–395. [Google Scholar] [CrossRef]
  4. Hu, R.; Collomosse, J. A performance evaluation of gradient field HOG descriptor for sketch based image retrieval. Comput. Vis. Image Underst. 2013, 117, 790–806. [Google Scholar] [CrossRef] [Green Version]
  5. Tian, S.; Lu, S.; Su, B.; Tan, C.L. Scene Text Recognition Using Co-occurrence of Histogram of Oriented Gradients. In Proceedings of the 2013 12th International Conference on Document Analysis and Recognition, Washington, DC, USA, 25–28 August 2013; pp. 912–916. [Google Scholar] [CrossRef]
  6. Kassani, P.H.; Hyun, J.; Kim, E. Application of soft Histogram of Oriented Gradient on traffic sign detection. In Proceedings of the 2016 13th International Conference on Ubiquitous Robots and Ambient Intelligence (URAI), Xian, China, 19–22 August 2016; pp. 388–392. [Google Scholar] [CrossRef]
  7. Cheng, R.; Wang, K.; Yang, K.; Long, N.; Bai, J.; Liu, D. Real-time pedestrian crossing lights detection algorithm for the visually impaired. Multimed. Tools Appl. 2017, 77. [Google Scholar] [CrossRef]
  8. Mao, L.; Xie, M.; Huang, Y.; Zhang, Y. Preceding vehicle detection using Histograms of Oriented Gradients. In Proceedings of the 2010 International Conference on Communications, Circuits and Systems (ICCCAS), Chengdu, China, 28–30 July 2010; pp. 354–358. [Google Scholar] [CrossRef]
  9. Mohan, A.; Papageorgiou, C.; Poggio, T. Example-Based Object Detection in Images by Components. IEEE Trans. Pattern Anal. Mach. Intell. 2001, 23, 349–361. [Google Scholar] [CrossRef] [Green Version]
  10. Ke, Y.; Sukthankar, R. PCA-SIFT: A more distinctive representation for local image descriptors. In Proceedings of the 2004 IEEE Computer Society Conference on Computer Vision and Pattern Recognition (CVPR 2004), Washington, DC, USA, 27 June–2 July 2004; Volume 2, p. 2. [Google Scholar] [CrossRef]
  11. Belongie, S.; Malik, J.; Puzicha, J. Matching shapes. In Proceedings of the Eighth IEEE International Conference on Computer Vision (ICCV 2001), Vancouver, BC, Canada, 7–14 July 2001; Volume 1, pp. 454–461. [Google Scholar] [CrossRef]
  12. Lenz, R. Using representations of the dihedral groups in the design of early vision filters. In Proceedings of the IEEE International Conference on Acoustics, Speech, and Signal Processing (ICASSP-93), Minneapolis, MN, USA, 27–30 April 1993; pp. 165–168. [Google Scholar]
  13. Lenz, R. Investigation of Receptive Fields Using Representations of the Dihedral Groups. J. Vis. Commun. Image Represent. 1995, 6, 209–227. [Google Scholar] [CrossRef]
  14. Foote, R.; Mirchandani, G.; Rockmore, D.N.; Healy, D.; Olson, T. A wreath product group approach to signal and image processing. I. Multiresolution analysis. IEEE Trans. Signal Process. 2000, 48, 102–132. [Google Scholar] [CrossRef]
  15. Lenz, R.; Bui, T.H.; Takase, K. A group theoretical toolbox for color image operators. In Proceedings of the ICIP 2005 IEEE International Conference on Image Processing, Genova, Italy, 14 September 2005; Volume 3, pp. 557–560. [Google Scholar]
  16. Sharma, P.; Eiksund, O. Group Based Asymmetry–A Fast Saliency Algorithm. In Advances in Visual Computing; Bebis, G., Boyle, R., Parvin, B., Koracin, D., Pavlidis, I., Feris, R., McGraw, T., Elendt, M., Kopper, R., Ragan, E., et al., Eds.; Springer International Publishing: Cham, Switzerland, 2015; pp. 901–910. [Google Scholar]
  17. Sharma, P. Modeling Bottom-Up Visual Attention Using Dihedral Group D4. Symmetry 2016, 8, 79. [Google Scholar] [CrossRef] [Green Version]
  18. Dummit, D.S.; Foote, R.M. Abstract Algebra; John Wiley & Sons: Hoboken, NJ, USA, 2004. [Google Scholar]
  19. Elson, J.; Douceur, J.J.; Howell, J.; Saul, J. Asirra: A CAPTCHA that Exploits Interest-Aligned Manual Image Categorization. In Proceedings of the 14th ACM Conference on Computer and Communications Security (CCS), Alexandria, VA, USA, 29 October–2 November 2007. [Google Scholar]
  20. Xiao, H.; Rasul, K.; Vollgraf, R. Fashion-MNIST: A Novel Image Dataset for Benchmarking Machine Learning Algorithms. arXiv 2017, arXiv:1708.07747. [Google Scholar]
  21. Sharma, P.; Dalin, P.; Mann, I. Towards a Framework for Noctilucent Cloud Analysis. Remote Sens. 2019, 11, 2743. [Google Scholar] [CrossRef] [Green Version]
  22. Trosten, D.J.; Sharma, P. Unsupervised Feature Extraction–A CNN-Based Approach. In Image Analysis; Felsberg, M., Forssén, P.E., Sintorn, I.M., Unger, J., Eds.; Springer International Publishing: Cham, Switzerland, 2019; pp. 197–208. [Google Scholar]
  23. Dietterich, T.G.; Bakiri, G. Solving Multiclass Learning Problems via Error-correcting Output Codes. J. Artif. Int. Res. 1995, 2, 263–286. [Google Scholar] [CrossRef] [Green Version]
  24. Sejnowski, T.J.; Rosenberg, C.R. Neurocomputing: Foundations of Research; Chapter NETtalk: A Parallel Network That Learns to Read Aloud; MIT Press: Cambridge, MA, USA, 1988; pp. 661–672. [Google Scholar]
  25. Cortes, C.; Vapnik, V. Support-vector networks. Mach. Learn. 1995, 20, 273–297. [Google Scholar] [CrossRef]
  26. Bagheri, M.; Montazer, G.A.; Escalera, S. Error correcting output codes for multiclass classification: Application to two image vision problems. In Proceedings of the The 16th CSI International Symposium on Artificial Intelligence and Signal Processing (AISP 2012), Fars, Iran, 2–3 May 2012; pp. 508–513. [Google Scholar] [CrossRef]
  27. Escalera, S.; Pujol, O.; Radeva, P. Separability of ternary codes for sparse designs of error-correcting output codes. Pattern Recognit. Lett. 2009, 30, 285–297. [Google Scholar] [CrossRef]
  28. Ballesteros, G.; Salgado, L. Optimized HOG for on-road video based vehicle verification. In Proceedings of the 2014 22nd European Signal Processing Conference (EUSIPCO), Lisbon, Portugal, 1–5 September 2014; pp. 805–809. [Google Scholar]
  29. Bilgic, B.; Horn, B.K.P.; Masaki, I. Fast human detection with cascaded ensembles on the GPU. In Proceedings of the 2010 IEEE Intelligent Vehicles Symposium, San Diego, CA, USA, 21–24 June 2010; pp. 325–332. [Google Scholar] [CrossRef]
  30. Liu, H.; Xu, T.; Wang, X.; Qian, Y. Related HOG Features for Human Detection Using Cascaded Adaboost and SVM Classifiers. In Advances in Multimedia Modeling; Li, S., El Saddik, A., Wang, M., Mei, T., Sebe, N., Yan, S., Hong, R., Gurrin, C., Eds.; Springer: Berlin/Heidelberg, Germany, 2013; pp. 345–355. [Google Scholar]
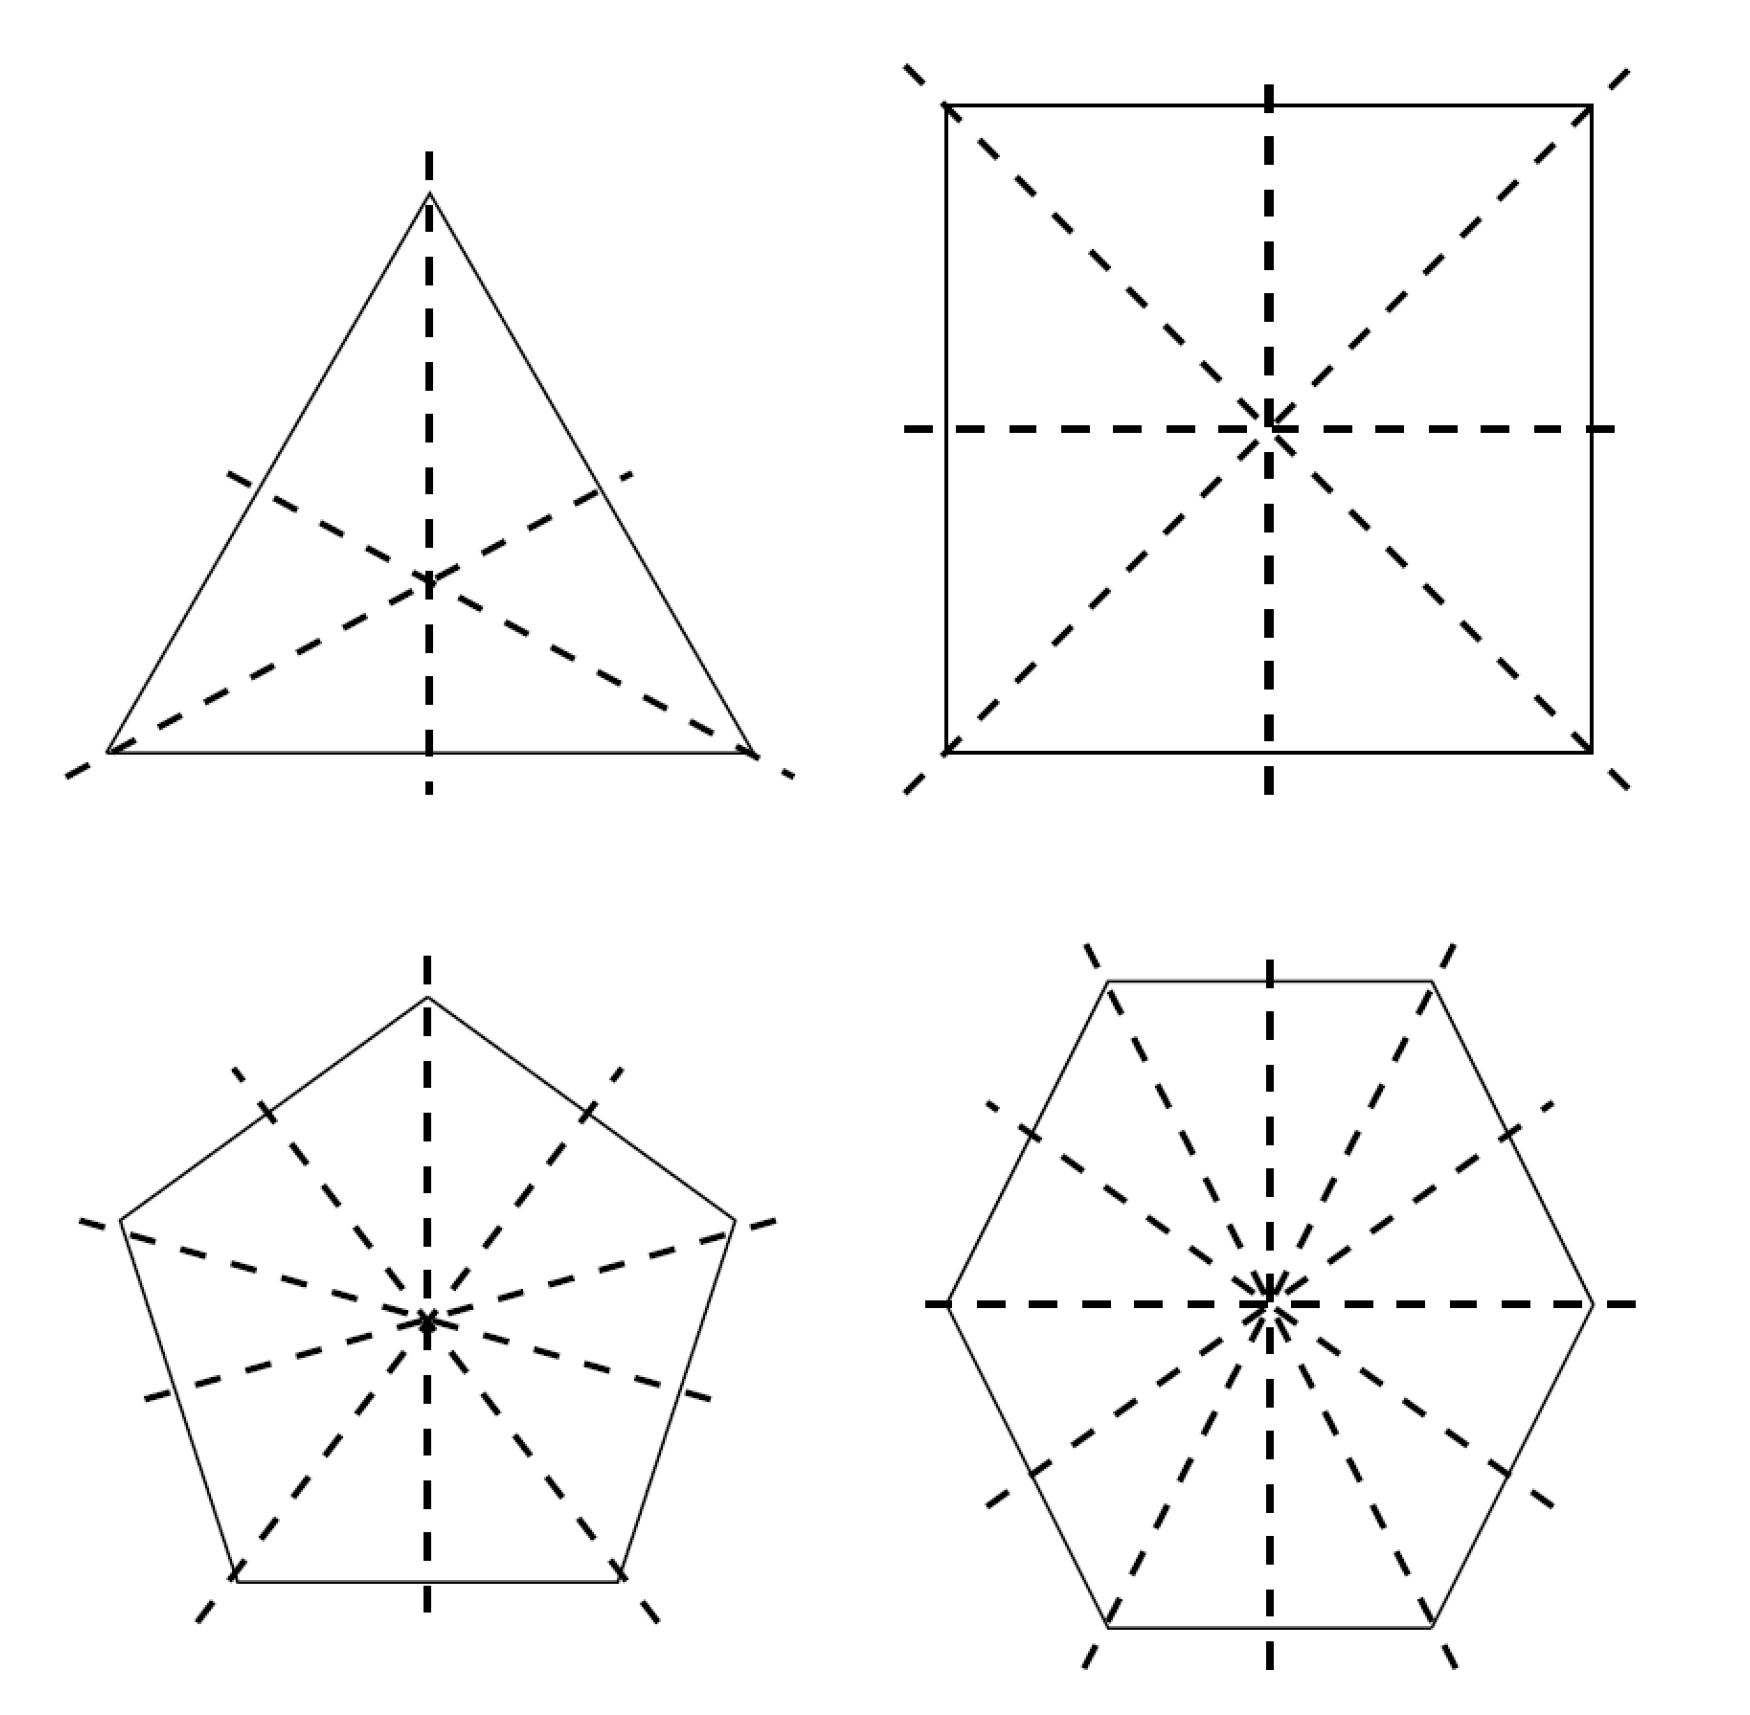
Figure 1. Polygons for n = 3–6 and the associated reflection symmetries.
Symmetry 12 00548 g001
Figure 2. Rotation of the square by 90 counterclockwise.
Symmetry 12 00548 g002
Figure 3. The Red, Green, and Blue channels of an input RGB image from dataset [19] are de-correlated into three channels: DeCorr 1 , DeCorr 2 , and DeCorr 3 .
Symmetry 12 00548 g003
Figure 4. An input image from dataset [19] is divided into square blocks.
Symmetry 12 00548 g004
Figure 5. The transformations obtained by using the different elements of the D 4 group.
Symmetry 12 00548 g005
Figure 6. The normalized asymmetry values associated with the different elements of the D 4 group. The resulting values were generated by using the red channel of the input RGB image.
Symmetry 12 00548 g006
Figure 7. R 1 , i.e., the normalized asymmetry values obtained for rotation along 90 for a pattern in which the block size matches the size of the checkerboard pattern creates a matrix with zeros.
Symmetry 12 00548 g007
Figure 8. R 1 , i.e., the normalized asymmetry values obtained for rotation along 90 for a pattern in which the block size matches the size of the checkerboard pattern and enabling an overlap of half block size creates a matrix with non zero values.
Symmetry 12 00548 g008
Figure 9. A few sample images from the Cats and Dogs [19] dataset, which has two categories of images: cats and dogs.
Symmetry 12 00548 g009
Figure 10. A few sample images from the Fashion-MNIST [20] dataset, which has ten different categories of images.
Symmetry 12 00548 g010
Figure 11. A few sample images from the Person [1] dataset, which has two categories of images: persons and rest.
Symmetry 12 00548 g011
Figure 12. A few sample images from the NLC [21] dataset, which has four categories of images: clear sky (first row from the top), noctilucent clouds (second row), tropospheric clouds (third row), and rest (fourth row).
Symmetry 12 00548 g012
Table 1. Details of the four databases used in the paper. Please note that the size and samples in the table represent the dimensions of images used for calculating feature vectors and the number of images, respectively.
DatasetSizeChannelsSamplesClasses
Cats and Dogs [19]60 × 602 (RGB)81922
Fashion-MNIST [20]28 × 281 (Gray)60,00010
Person [1]64 × 1283 (RGB)72642
NLC [21]50 × 503 (RGB)24,0004
Table 2. Performance of the D 4 model for the different norm functions used in this paper, here N = 16 means a block size of 16 by 16 pixels.
ColorspaceNAccuracy (in %)
RGB1694.80
L*a*b*1697.07
HSV1697.51
De-Corr1696.20
Table 3. Performance of the D 4 metric for the different colorspaces used in this paper, where N is the size of square region i.e., block size.
NormNAccuracy (in %)
L 1 1695.74
L 2 1695.91
As defined in Equation (4)1697.51
Table 4. Accuracy for the different datasets and different block/cell sizes (N), and feature vectors sizes used for the proposed D 4 and the HOG [1] models. Please note that N is the block size in case of the D 4 model and the cell size in case of the HOG [1] model.
ModelNFeature Vector SizeDatabaseAccuracy
D 4 84725Cats and Dogs [19]67.43%
HOG [1]83888Cats and Dogs [19]68.19%
D 4 161029Cats and Dogs [19]69.21%
HOG [1]16432Cats and Dogs [19]69.66%
D 4 + HOG161461Cats and Dogs [19]73.76%
D 4 162205Person [1]97.51%
HOG [1]162268Person [1]96.98%
D 4 + HOG164473Person [1]98.09%
D 4 41183Fashion-MNIST [20]90.61%
HOG [1]41296Fashion-MNIST [20]90.61%
D 4 + HOG42479Fashion-MNIST [20]91.50%
D 4 83549NLC [21]89.55%
HOG [1]82700NLC [21]84.11%
D 4 161029NLC [21]86.35%
HOG [1]16432NLC [21]80.94%
D 4 + HOG161461NLC [21]92.63%