Abstract
Symmetries play very important roles in the dynamics of electrical systems. The relevant electronic circuits with fault diagnostics, including the optimized neural network algorithm model, are designed on the basis of symmetry principles. In order to improve the efficiency of the circuit pressure test, a circuit pressure function equivalent compression test method based on the parallel neural network algorithm is proposed. For the implementation stage of the circuit pressure test, the improved modified node algorithm (MNA) is used to build an optimization model, and the circuit network is converted into an ordinary differential equation for the circuit pressure function equivalent compression test. The test aims to minimize flux. Then, backpropagation (BP) neural network algorithm data fusion is introduced to optimize the minimum flux model of the cyclic pressure functional equivalent compression test. Finally, a simulation experiment is carried out to verify the effectiveness of the algorithm in the accuracy and efficiency of the pressure test. The results show that the improved BP neural network improves the data fusion accuracy and shortens the sample training time; compared with the uncompressed algorithm, the running time of the proposed algorithm is greatly reduced and the execution efficiency is high; compared with the vascular pressure test method, there is no significant difference in the convergence accuracy and it is at a level of 10−5. Since the parallel computing problem is not considered in either of the two-pulse tube pressure test methods, the convergence time of the algorithm increases exponentially with the increase in the number of parallel threads. However, the algorithm in this research considers the problem of parallel execution and uses a quad-core processor, with no significant change in computing time and high computing efficiency. Therefore, BP neural network data fusion can be used for the fault diagnosis of electronic circuits, with a high operating efficiency and good development prospects.
1. Introduction
With the development of system-on-chip (SoC) integrated circuits, the number and diversity of mixed signal circuits using the molds have also increased significantly, such as high-speed interactive operating system (IOs), sensors, power supply, clocks and other different circuit forms [1]. The manufacturing test procedures are generally divided into the wafer/sequencing test, encapsulation test (using function and structural test), stress test/aging test and system test. These steps need to be performed on each component, thus resulting in a lot of testing workload on the components to be tested [2].
In order to shorten the product’s research and development cycle, the test time of each component should be shortened as much as possible. Although a short test time can be achieved by adding test equipment, this is not a preferred choice because of the resulting dramatic increase in capital costs. On the contrary, adopting a time compression mode for each test step is a cost-effective way to control testing [3]. Since the test steps themselves cannot be eliminated, reducing the time for each step is the best method. Therefore, reducing both the production and test costs have always been the research foci of simulation tests. There are three ways to reduce the test time: (1) in order to reduce the test time, the optimal sequencing of the test process should strategically place the module with the largest failure in the first place; (2) select the test subset based on the sampling method to achieve the same coverage; (3) develop better and more effective tests to provide more coverage; (4) reduce the communication time through compressing on-chip tests. Up to now, there are no effective methods to reduce the pressure test time of the circuit in the analog execution phase [4]. The test compression of analog and mixed signal circuits is a more challenging problem. Analog circuits are nonlinear systems with continuous working signals, and consecutive input compression is very complex. Maintaining the same precision and recall index for compression tests is challenging because compression simulation testing may increase the false alarm rate and cause unnecessary losses [5]. Therefore, the test compression algorithm should guarantee the functional equivalency as well as the consistent performance under the original test and compression test. Test compression methods usually require additional circuits, including on-chip and off-chip, so as to minimize communication and compression test time, while additional circuits may increase test costs [6]. In order to reduce the test time, we introduced the automatic test compression method of analog and mixed signal circuits, and applied the test compression algorithm to the pressure test in this work. In the pressure test, the integrated circuit (IC) executive function sequence is tested based on high electrical activity. During this process, the maximum and minimum values of voltage and current are obtained from the functional test section of the circuit, and the input test sequence in pressure test can be obtained through the functional test. Therefore, as long as the minimum electrical characteristics of the circuit can be provided, the length of each functional test can be reduced [7].
At the same time, for a series of problems in the above electronic circuit testing process, data fusion technology can be used to reduce redundancy and error data, reduce data transmission volume, improve information accuracy and energy and channel utilization, and achieve the purpose of reducing energy consumption. However, in this era of information explosion, information of various types and sources is widely available. The parallel structure and non-linear characteristics of neural networks enable them to accept and store large amounts of information data, like the human brain. The information can be simulated, to a large extent, on the basis of a nonlinear mechanism. The neural network is the abstraction and modeling of the human brain or biological nervous system, with the ability to learn from the environment and adapt to the environment alongside similar biological interactions. It has the characteristics of nonlinearity, nonlocality, nonconstancy, self-organization and self-learning ability, nonconvexity, etc. The ability to distribute fuzzy conditions in parallel requires more information processing problems. The neural network can process a large amount of information to reduce the amount of data, and it can also analyze some qualitative data. It has been widely used in data fusion, breaking the traditional reasoning mode, making data fusion technology no longer limited to strict logical reasoning and accurate calculation, and overcoming many problems that cannot be solved by traditional fusion technology [8,9,10].
Based on this, the improved MNA is used to build an optimization model for the implementation stage of the circuit pressure test, and the circuit network is converted into an ordinary differential equation for the circuit pressure function equivalent compression test. The test aims to minimize flux. Then, backpropagation (BP) neural network algorithm data fusion is introduced to optimize the minimum flux model of the cyclic pressure functional equivalent compression test. Finally, a simulation experiment is carried out to verify the effectiveness of the algorithm in the accuracy and efficiency of the pressure test.
2. Circuit Pressure Test Problems Based on Electric Flux
The symmetry principle was applied in the modeling method. The nonlinear time-varying circuit is modeled as a set of ordinary differential equations, and MNA is used to transform the electric network into an ordinary differential equation. Let represent the sectionally continuous time-varying nonlinear function of control circuit dynamics, . Let represent the continuous state space of the circuit, represents the circuit condition at time . The initial state of the circuit is . Let represent the input interval of the circuit, represent the state variable and the input variable of the circuit. The test is a continuous input signal. An N-dimensional ordinary differential equation is adopted to describe the nonlinear analog circuit:
A solution for a circuit at time interval is the path of the circuit from the state to the state of the given input test . For a given state and input , the differential constraint in Equation (1) determines the running path of the circuit in the interval . Then, the solving problem of the circuit running track of the initial state at time can be expressed as an initial value problem (IVP):
Let represent the length of the test sequence , represents the boundary value that denotes the final state of the test process; there may be multiple boundary values in the solution of the test sequence. Then, the problem can be decomposed into single boundary test compression problems, and each boundary value can be expressed as:
where and are the initial value and boundary value of the test compression problem. For simplicity, this paper only focuses on the case of one initial value and a single boundary value , because multiple boundary values can be divided into multiple unilateral value problems. The dynamics of the analog circuit are smooth and continuous, meeting the local Lipschitz property, which ensures the existence and uniqueness.
Definition 1.
(functional equivalence test) we define two test input signals as functionally equivalent ones, if and only if their initial and boundary values are the same for the same nonlinear system. That is, input signalandare equivalent under the following circumstance:
whereanddenote the length of the input signaland, respectively, which means that, if its initial valueis equal, the boundary value of initial test signalandis equal. For the test compression process, the functionally equivalent test length after compression should be less than the original test length. Therefore,.
The purpose of the compression test problem is to find all possible functionally equivalent input stimuli, which need to reach the boundary value from the initial value in as short a time as possible. We propose the following optimized objective function:
where is the time dimension of each state in the solution. denotes the state, which is a vector in . Equation (5) is an integral describing the electric flux of the circuit along the solution path . Flux is a physical entity that captures both voltage and time. The magnetic flux is measured and quantized by weber and expressed as voltage times time in seconds . We can measure flux by integrating voltage or time . Since we want to minimize the time while keeping the boundary voltage unchanged, we use the Lebasque integral in Equation (5) to define the test compression objective function.
Because the initial value and boundary value are fixed, the minimization of the integral result can be directly realized by minimizing . Although reducing flux function does not necessarily reduce time, the test of the minimum flux function is consistent with that of the minimum time, which means that minimizing the flux function is necessary, but not sufficient to minimize the test time. When the flux function converges to the minimum value, we also prove that the test time converges to the optimal value. Since the time required to reach the boundary value in the output is the same as the input test time, the minimization Equation (5) also compresses the input test signal.
3. Neural Network Model Based on BP Algorithm
3.1. Algorithm Description
The three-layer BP neural network model adopted in this paper is composed of input layer, hidden layer and output layer. Figure 1 shows a typical three-layer BP neural network model.
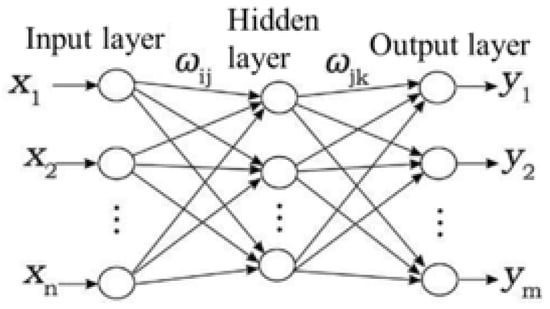
Figure 1.
A simple backpropagation (BP) neural network model.
The feedforward significance of the network is that the input of each layer node only comes from the output of the previous layer nodes. For the input signal, it is transmitted to the hidden layer node first, and then the output information of the hidden layer nodes is transmitted to the output nodes after the activation function and, finally, the output results are obtained.
(1) For the input layer nodes their output is equal to the input , and the variable value is transmitted to the second layer;
(2) For the hidden layer nodes their input and output are:
where is the weight between hidden layer node and input layer node , is the bias of hidden layer node , and is a Sigmoid function with the following expression:
(3) For output layer nodes their input and output are:
where is the connection weight between input layer node and hidden layer node , and is the bias of output layer node .
For a given training sample , is the number of samples , and the mean square error between network output and training target can be expressed as:
where is the number of samples, is the target output result of the lth output unit of the pth sample, and is the network operation result of the lth output unit of the pth sample. The process of BP network training includes the forward calculation within the network and the backpropagation of error, and it aims to minimize the output error of the network through adjusting the connection weight within the network. The connection weight between the input layer and the hidden layer and between the hidden layer and the output layer in the multi-layer feedforward network is adjusted by the BP algorithm.
The essence of data fusion using the BP neural network is to use the gradient descent method to train the weights according to the error function to minimize the error value. The weight training is described as follows.
(1) The correction coefficient of connection weight between hidden layer and output layer is calculated. At the time, , the network training rules make descend by gradient in each training cycle, then the modified equation of weight coefficient is as follows:
where is the input of node in the output layer, is the step length searched by the gradient, , then the equation as below is obtained.
The backpropagation error signal of the output layer is defined as follows:
Taking the derivative of both sides, the equation below is obtained.
The correction equation of weight coefficient is as follows:
Therefore, error backpropagation adjusts the weight from the hidden layer to the output layer as follows:
(2) The correction coefficient of connection weight between the input layer and hidden layer is calculated. At the time, , the correction equation of weight coefficient is as follows:
where is the input of node in the hidden layer, is the step length searched by the gradient, , then the equation below is obtained.
The backpropagation error signal of hidden layer is defined as follows:
Taking the derivative of both sides, the equation as below is obtained.
Therefore, the error backpropagation adjusts the weight from the input layer to the hidden layer as follows:
The training process of the BP neural network is shown in Figure 2. When the network structure is determined, the training of the BP neural network begins. BP neural network learning is composed of two processes: forward signal propagation and back error propagation. In the case of forward propagation, the input sample signal enters the network from the input layer and is finally transmitted to the output layer through hidden layer processing. If the output result is not consistent with the expected value, the error will be backpropagated and the weight will be adjusted according to the above weight adjustment coefficient until the output result of the network output layer meets the requirements.
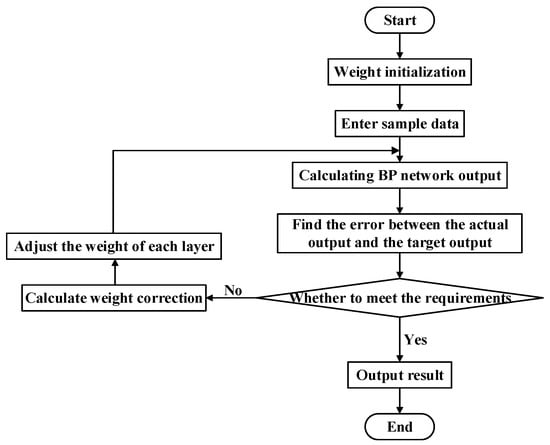
Figure 2.
The training process of BP neural network.
3.2. Diagnosis Steps of Neural Network Information Fusion Fault
Neural network knowledge representation is an implicit representation of knowledge, and knowledge shows the topology structure and connection weight of the network. Meanwhile, it adopts the expert system of neural network technology, because the neural network is a unified network system of information storage and processing. Therefore, among expert systems adopting neural network technology, knowledge storage and reasoning in the problem-solving process are carried out in the neural network module of the system, and they are the unity of the knowledge base and inference machine. First of all, the feature data is extracted from the existing equipment characteristic signal, then, after data preprocessing (normalized processing), it is used as the input of the neural network. The data extracted from known fault results is used as the neural network output to build the BP neural network, and the training sample set formed by the existing characteristic data and known fault data is used to carry out the learning and network self-learning of the BP neural network, so as to make the corresponding relation between the weights, threshold values and known fault results of the BP neural network achieve the expected results output. When the BP neural network training is completed, the BP neural network which has successfully completed training can be used for fault diagnosis. The process of fault diagnosis is as follows:
(1) Input the fault sample to each node of the input layer, and it is also the output of neurons in this layer;
(2) Obtain the output of hidden layer neurons by Equation (22) and take it as the input of the output layer;
(3) Obtain the output of neurons in the output layer from Equations (2)–(5);
(4) Determine the final output result of neurons in the output layer by the threshold function.
The fault diagnosis of diesel engine firstly extracts data from the fault signals to be diagnosed for preprocessing, and then the fault data to be diagnosed is input into the neural network which has finished training successfully. The fault diagnosis steps of using neural network information fusion are shown in Figure 3. Firstly, the pressure sensor is used to measure the voltage signal at the key points of the components to be diagnosed, the temperature sensor is used to test the temperature signal of the components to be diagnosed, and then the fuzzy set theory is used for analysis.

Figure 3.
Steps of information fusion for fault diagnosis.
4. Experimental Analysis
According to the theory of symmetry in electronic circuit research, a prototype tool C++ was developed to evaluate the accuracy and efficiency of our algorithm. The input of our tool is the circuit meshwork list in Simulation Program with ICEmphasis (HSPICE) format. The user-defined test input signal is a piecewise linear (PWL) signal source. The tool’s other level signal output can be used for the test circuit, with 100,000 iterations for each experiment. Each iteration includes a small HSPICE simulation with a duration of . The hardware selected in the experiment in this paper is equipped with four-core Central Processing Unit (CPU) 2.5GHz, 6 MB of L3 buffer memory and 16 GB of memory size, and there is no hyperthreading. The parameters and operational amplifier circuit used in the experiment are listed in Table 1, as shown in Figure 4.

Table 1.
Parameter setting of neural network.
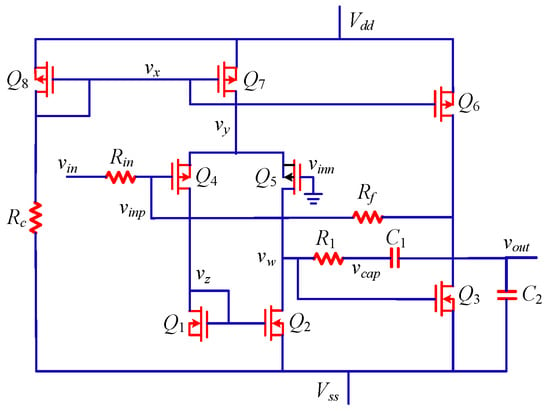
Figure 4.
Schematic diagram of operational amplifier circuit.
First of all, the proposed algorithm is set to generate a single test compression experiment which saturates the output of the operational amplifier, and then sets the hyperplane and as the target boundary conditions. The neural network is used to generate two input stimuli, so that the output voltage of the saturated circuit is 0.4 and -0.8V, respectively (and the process is run twice).
Table 2 shows the temperature and pressure signal values measured by pressure and temperature sensors and the fault identification results of single sensor and double sensor signal data fusion. The first and second terms are the fault signal values of each component measured from temperature and voltage, and the third term is the fault signal values after fusion. It can be found from the table that when three fault components are diagnosed, part of the fault signal values extracted by the two sensors are close to each other. If only the signal values of one sensor are used to identify the fault components, the fault components cannot be determined. For example, when Element 3 fails, the fault signal value extracted by the temperature sensor is very close to that of the fault, and the fault element cannot be determined when identified separately. However, the signal value of Element 3 after data fusion is greatly improved, and the signal value is quite different from that of the other two elements, which can accurately identify the fault element—that is, compared with the signal value of a single sensor, the fused signal value can reduce the uncertainty of fault diagnosis and increase the signal value assignment of the actual target component.

Table 2.
The fault identification results of single fault identification of two kinds of sensors and fusion fault identification of multi-sensor.
Figure 5 shows the average error comparison curve of the BP neural network and the BP neural network after weight adjustment and improvement in the training process. The downward slope of the curve represents the convergence rate of the training samples. The higher the slope of the curve, the faster the convergence rate, and the shorter the training time of the samples as the convergence rate increases [11]. With the increase in the training times of the samples, the average error becomes smaller and smaller, indicating that the weights of training samples tend towards the optimal weight vector, and the data fusion precision gradually improves. As shown in the figure, when the improved BP neural network data fusion algorithm based on weight adjustment is used, the sample converges faster in the training process and the training time of the sample can be shortened [12]. Although the average error of the samples of the BP neural network data fusion algorithm before and after the weight adjustment and improvement is the same at the beginning of the training, the average error value of the improved sample after 15 training sessions is close to 0.7, less than 0.8 before the algorithm improvement, indicating that the sample fusion accuracy under the improved algorithm is higher [13].
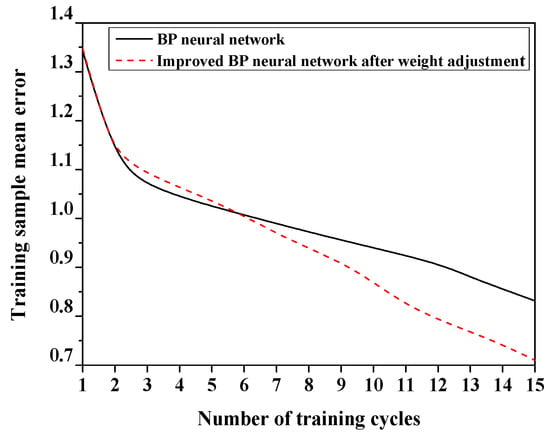
Figure 5.
Average error of training samples before and after weight adjustment and improvement.
Figure 6 shows the accuracy of data fusion between the BP neural network and the BP neural network after weight adjustment and improvement. The higher the accuracy, the better the fusion effect. For the improved BP neural network fusion after weight adjustment, the fusion accuracy of each type of signal is higher than that before the improvement, and the data fusion effect is better.
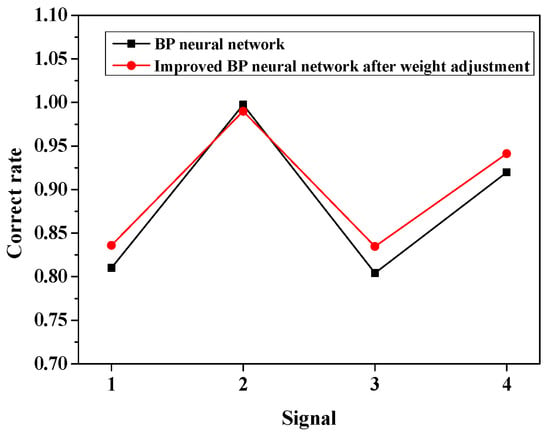
Figure 6.
The accuracy of data fusion before and after weight adjustment.
Figure 7 shows the comparison of the output curve between the circuit pressure test compression process and the uncompressed process of the proposed algorithm. As shown in Figure 4, the output of the proposed algorithm can be greatly reduced in execution time compared with that of the uncompressed algorithm, which embodies the efficiency advantage of the proposed method.
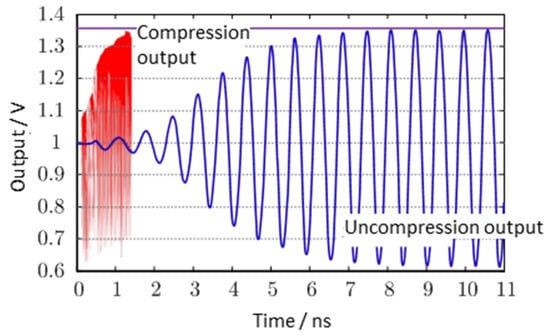
Figure 7.
Comparison of compression test output.
To further verify the algorithm’s performance advantages in test accuracy and efficiency, the circuit pressure test methods proposed by the authors in [14] and the authors in [15] are selected for contrast experiment. The study in [14] is a single-threaded pressure test process which takes no account of test compression, and the study in [15] is a pressure test process which takes account of test compression in the setup phase. The experimental indexes select the boundary state convergence value and convergence time, and select the circuit pressure test to execute one, five, 10 and 15 times in parallel—that is, the algorithm in [15] executes one, five, 10 and 15 times in serial because it does not design the parallel execution process. The experimental results are shown in Table 3.

Table 3.
Test results of algorithm performance.
On the basis of the results in Table 3, the performance indexes of the three algorithms do not have significant differences in convergence accuracy, and they are at a level of . Although there are slight differences in numbers, the differences are almost negligible. However, in terms of convergence time, the two methods in [14,15] did not consider the parallel computing problem, so the convergence time of the algorithm increased exponentially with the increase in the number of parallel threads. In the meantime, since the algorithm in [16,17] takes account of the compression problem in the setting stage, its calculation time is slightly better than the algorithm in [18,19]. In addition, the algorithm in this paper considers the problem of parallel execution and uses a quad-core processor, so there is no obvious change in the computing time, thus showing the higher computational efficiency of the algorithm [20,21].
5. Conclusions
In this paper, a circuit pressure functional equivalent compression test method based on the parallel neural network algorithm is proposed and minimizing the flux is the optimization goal to establish the circuit pressure functional equivalent compression test model. Meanwhile, the neural network algorithm is introduced to optimize the flux minimization model of the circuit pressure functional equivalent compression test, and a parallel execution algorithm is specially designed to promote the computational efficiency of the algorithm. The improved BP neural network with weight adjustment improves the data fusion accuracy and shortens the sample training time. Compared to the uncompressed algorithm, the proposed algorithm has a shorter running time and a higher execution efficiency. Compared to the vascular pressure test method, this algorithm considers the problem of parallel execution and uses a quad-core processor. There is no significant change in calculation time and the calculation efficiency is high. Therefore, this method can be used for multi-threaded parallel optimization tests of large-scale circuits, as well as to effectively reduce the product’s R&D cycle.
Funding
This research received no external funding.
Conflicts of Interest
The authors declare no conflict of interest.
References
- Gan, X.S.; Gao, W.M.; Zhe, D.; Liu, W.D. Research on WNN soft fault diagnosis for analog circuit based on adaptive UKF algorithm. Appl. Soft Comput. 2017, 50, 252–259. [Google Scholar]
- Chen, H.X. Research on multi-sensor data fusion technology based on BP neural network. In Proceedings of the 2015 International Workshop on Wireless Communication and Network (IWWCN2015), Kunming, China, 21−23 August 2015. [Google Scholar]
- Si, L.; Wang, Z.; Liu, X.; Tan, C.; Xu, J.; Zheng, K. Multi-Sensor Data Fusion Identification for Shearer Cutting Conditions Based on Parallel Quasi-Newton Neural Networks and the Dempster-Shafer Theory. Sensors 2015, 15, 28772–28795. [Google Scholar] [CrossRef] [PubMed]
- Tadeusiewicz, M.; Kuczyński, A.; Hałgas, S. Catastrophic Fault Diagnosis of a Certain Class of Nonlinear Analog Circuits. Circuits Syst. Signal Process. 2015, 34, 353–375. [Google Scholar] [CrossRef]
- Zhang, J.; Wu, Y.; Liu, Q.; Gu, F.; Mao, X.; Li, M. Research on High-Precision, Low Cost Piezoresistive MEMS-Array Pressure Transmitters Based on Genetic Wavelet Neural Networks for Meteorological Measurements. Micromachines 2015, 6, 554–573. [Google Scholar] [CrossRef]
- Zhang, B.C.; Xu, R.; Yin, X.J.; Gao, Z. Research on fault diagnosis for rail vehicle compartment of LED lighting system of analog circuit based on WP-EE and BP neural network. In Proceedings of the Control & Decision Conference, Yinchuan, China, 28−30 May 2016. [Google Scholar]
- Liu, M.; Zhang, C.; Liu, X. The study of data fusion for high suspended sediment concentration measuring based on BP neural network. In Proceedings of the 12th IEEE International Conference on Electronic Measurement & Instruments, Qingdao, China, 16−18 July 2015. [Google Scholar]
- Sun, B.; Jiang, C.; Li, M. Fuzzy Neural Network-Based Interacting Multiple Model for Multi-Node Target Tracking Algorithm. Sensors 2016, 16, 1823. [Google Scholar] [CrossRef] [PubMed]
- Wang, B.; Du, X.; Hong, Y. Mine Internet of Things Data Collection Algorithm Based on Neural Network and Rough Set. J. Comput. Theor. Nanosci. 2015, 12, 6304–6308. [Google Scholar] [CrossRef]
- Shen, C.W.; Ho, J.; Pham, L.; Ting, K. Behavioural Intentions of Using Virtual Reality in Learning: Per-spectives of Acceptance of Information Technology and Learning Style. Virtual Real. 2019, 23, 313–324. [Google Scholar] [CrossRef]
- Zhang, C.; He, Y.; Yuan, L.; Xiang, S. Analog circuit incipient fault diagnosis method using DBN based features extraction. IEEE Access 2018, 6, 23053–23064. [Google Scholar] [CrossRef]
- Ji, L.; Hu, X. Analog circuit soft-fault diagnosis based on sensitivity analysis with minimum fault number rule. Analog Integr. Circuits Signal Process. 2018, 95, 163–171. [Google Scholar] [CrossRef]
- Sobanski, P.; Kaminski, M. Application of artificial neural networks for transistor open-circuit fault diagnosis in three-phase rectifiers. IET Power Electron. 2019, 12, 2189–2200. [Google Scholar] [CrossRef]
- Li, J.W.; Feng, Z.X. Application of the Circuit Theory to the High-Precision Pressure Regulation System in Nuclear Power Plants. J. Comput. Theor. Nanosci. 2016, 13, 1852–1860. [Google Scholar]
- Song, M.; Xu, T.; Xiang, J.; Zhang, X.; Wang, H.; Shou, B.A. Permeability Test Method of the Material for Graphite Pressure Vessel. Materials Science Forum. Trans Tech Publ. Ltd 2017, 898, 1732–1736. [Google Scholar]
- Rida, I.; Almaadeed, N.; Almaadeed, S. Robust gait recognition: A comprehensive survey. IET Biom. 2018, 8, 14–28. [Google Scholar] [CrossRef]
- Jafari, H.P. Stator winding short-circuit fault diagnosis based on multi-sensor fuzzy data fusion. Modares J. Electr. Eng. 2016, 15, 27–34. [Google Scholar]
- Xu, L.; Cao, M.; Song, B.; Zhang, J.; Liu, Y.; Alsaadi, F.E. Open-circuit fault diagnosis of power rectifier using sparse autoencoder based deep neural network. Neurocomputing 2018, 311, 1–10. [Google Scholar] [CrossRef]
- Zhao, G.; Liu, X.; Zhang, B.; Niu, Y.; Liu, G.; Hu, C. A novel approach for analog circuit fault diagnosis based on deep belief network. Measurement 2018, 121, 170–178. [Google Scholar] [CrossRef]
- Shen, C.-W.; Min, C.; Wang, C.-C. Analyzing the trend of O2O commerce by bilingual text mining on social media. Comput. Hum. Behav. 2019, 101, 474–483. [Google Scholar] [CrossRef]
- Wang, X.; Hu, H.; Xiao, L. Multisensor Data Fusion Techniques with ELM for Pulverized-Fuel Flow Concentration Measurement in Cofired Power Plant. IEEE Trans. Instrum. Meas. 2015, 64, 2769–2780. [Google Scholar] [CrossRef]
© 2020 by the author. Licensee MDPI, Basel, Switzerland. This article is an open access article distributed under the terms and conditions of the Creative Commons Attribution (CC BY) license (http://creativecommons.org/licenses/by/4.0/).