Residual Control Chart for Binary Response with Multicollinearity Covariates by Neural Network Model
Abstract
1. Introduction
2. Statistical Methods
2.1. Generalized Linear Model and Neural Network Model for Binary Response Data
2.2. Dimension Reduction by Principal Component Analysis
2.3. Dimension Reduction by Functional Principal Component Analysis
2.4. New Binary response statistical process control Procedure
- Apply the (functional) principal component analysis in input variables and obtain the principal components from (8).
- Fit the binary response regression model by using the binary response variable y and the (functional) principal components through probit link function, logit link function, and neural network regression models, respectively.
- Obtain the deviance residuals from each model.
3. Illustrated Examples
3.1. Simulation Study
3.2. Real Data Analysis
4. Conclusions
Author Contributions
Funding
Conflicts of Interest
References
- Hotelling, H. Multivariate Quality Control; McGraw-Hill: New York, NY, USA, 1947. [Google Scholar]
- Lowry, C.A.; Woodall, W.H.; Champ, C.W.; Rigdon, S.E. Multivariate exponentially weighted moving average control chart. Technometrics 1992, 34, 46–53. [Google Scholar] [CrossRef]
- Crosier, R.B. Multivariate generalizations of cumulative sum qualitycontrol schemes. Technometrics 1988, 30, 291–303. [Google Scholar] [CrossRef]
- Park, K.; Kim, J.-M.; Jung, D. GLM-based statistical control r-charts for dispersed count data with multicollinearity between input variables. Qual. Reliab. Eng. Int. 2018, 34, 1103–1109. [Google Scholar] [CrossRef]
- Montgomery, D.C. Statistical Quality Control, 7th ed.; John Wiley and Sons Press: New York, NY, USA, 2012. [Google Scholar]
- Qiu, P. Introduction to Statistical Process Control, 1st ed.; Chapman & Hall/CRC Texts in Statistical Science: Boca Raton, FL, USA, 2013. [Google Scholar]
- Bolker, B.M.; Brooks, M.E.; Clark, C.J.; Geange, S.W.; Poulsen, J.R.; Stevens, M.H.; White, J.S. Generalized linear mixed models: A practical guide for ecology and evolution. Trends Ecol Evol. 2009, 24, 127–235. [Google Scholar] [CrossRef] [PubMed]
- Myers, R.H.; Montgomery, D.C.; Vining, G.G. Generalized Linear Models, with Applications in Engineering and the Sciences; John Wiley and Sons Press: New York, NY, USA, 2002. [Google Scholar]
- Nelder, J.A.; Wendderburn, R.W.M. Generalized linear model. J. R. Stat. Hence,c. A 1972, 35, 370–384. [Google Scholar] [CrossRef]
- Agatonovic-Kustrin, S.; Beresford, R. Basic concepts of artificial neural network (ANN) modeling and its application in pharmaceutical research. J. Pharm. Biomed. Anal. 2000, 22, 717–727. [Google Scholar] [CrossRef]
- LeCun, Y.; Bengio, Y.; Hinton, G. Deep learning. Nature 2015, 521, 436. [Google Scholar] [CrossRef] [PubMed]
- Hassabis, D.; Kumaran, D.; Summerfield, C.; Botvinick, M. Neuroscience-inspired artificial intelligence. Neuron 2017, 95, 245–258. [Google Scholar] [CrossRef] [PubMed]
- Masood, I.; Hassan, A. Pattern Recognition for Bivariate Process Mean Shifts Using Feature-Based Artificial Neural Network. Int. J. Adv. Manuf. Technol. 2013, 66, 1201–1218. [Google Scholar] [CrossRef]
- Addeh, A.; Khormali, A.; Golilarz, N.A. Control Chart Pattern Recognition Using RBF Neural Network with New Training Algorithm and Practical Features. ISA Trans. 2018, 79, 202–216. [Google Scholar] [CrossRef] [PubMed]
- Zan, T.; Liu, Z.; Su, Z.; Wang, M.; Gao, X.; Chen, D. Statistical Process Control with Intelligence Based on the Deep Learning Model. Appl. Sci. 2020, 10, 308. [Google Scholar] [CrossRef]
- Ripley, B.; Venables, W. Feed-Forward Neural Networks and Multinomial Log-Linear Models; R Package, mlbench; R Foundation for Statistical Computing: Vienna, Austria, 2016. [Google Scholar]
- Skinner, K.R.; Montgomery, D.C.; Runger, G.C. Process monitoring for multiple count data using generalized linear model-based control charts. Int. J. Prod. Res. 2003, 41, 1167–1180. [Google Scholar] [CrossRef]
- Ramsay, J.; Silverman, B. Functional Data Analysis; Springer: New York, NY, USA, 2005. [Google Scholar]
- Chen, Y.; Carroll, C.; Dai, X.; Fan, J.; Hadjipantelis, P.Z.; Han, K.; Ji, H.; Lin, S.-C.; Dubey, P.; Mueller, H.-G.; et al. fdapace:Functional Data Analysis and Empirical Dynamics; The R Project for Statistical Computing: Vienna, Austria, 2019. [Google Scholar]
- Yao, F.; Múller, H.-G.; Wang, J.-L. Functional Data Analysis for Sparse Longitudinal Data. J. Am. Assoc. 2005, 100, 577–590. [Google Scholar] [CrossRef]
- Liu, B.; Múller, H.-G. Estimating Derivatives for Samples of Sparsely Observed Functions, with Application to Online Auction Dynamics. J. Am. Stat. 2009, 104, 704–717. [Google Scholar] [CrossRef]
- Leisch, F.; Dimitriadou, E. Machine Learning Benchmark Problems; R Package, mlbench; R Foundation for Statistical Computing: Vienna, Austria, 2015. [Google Scholar]
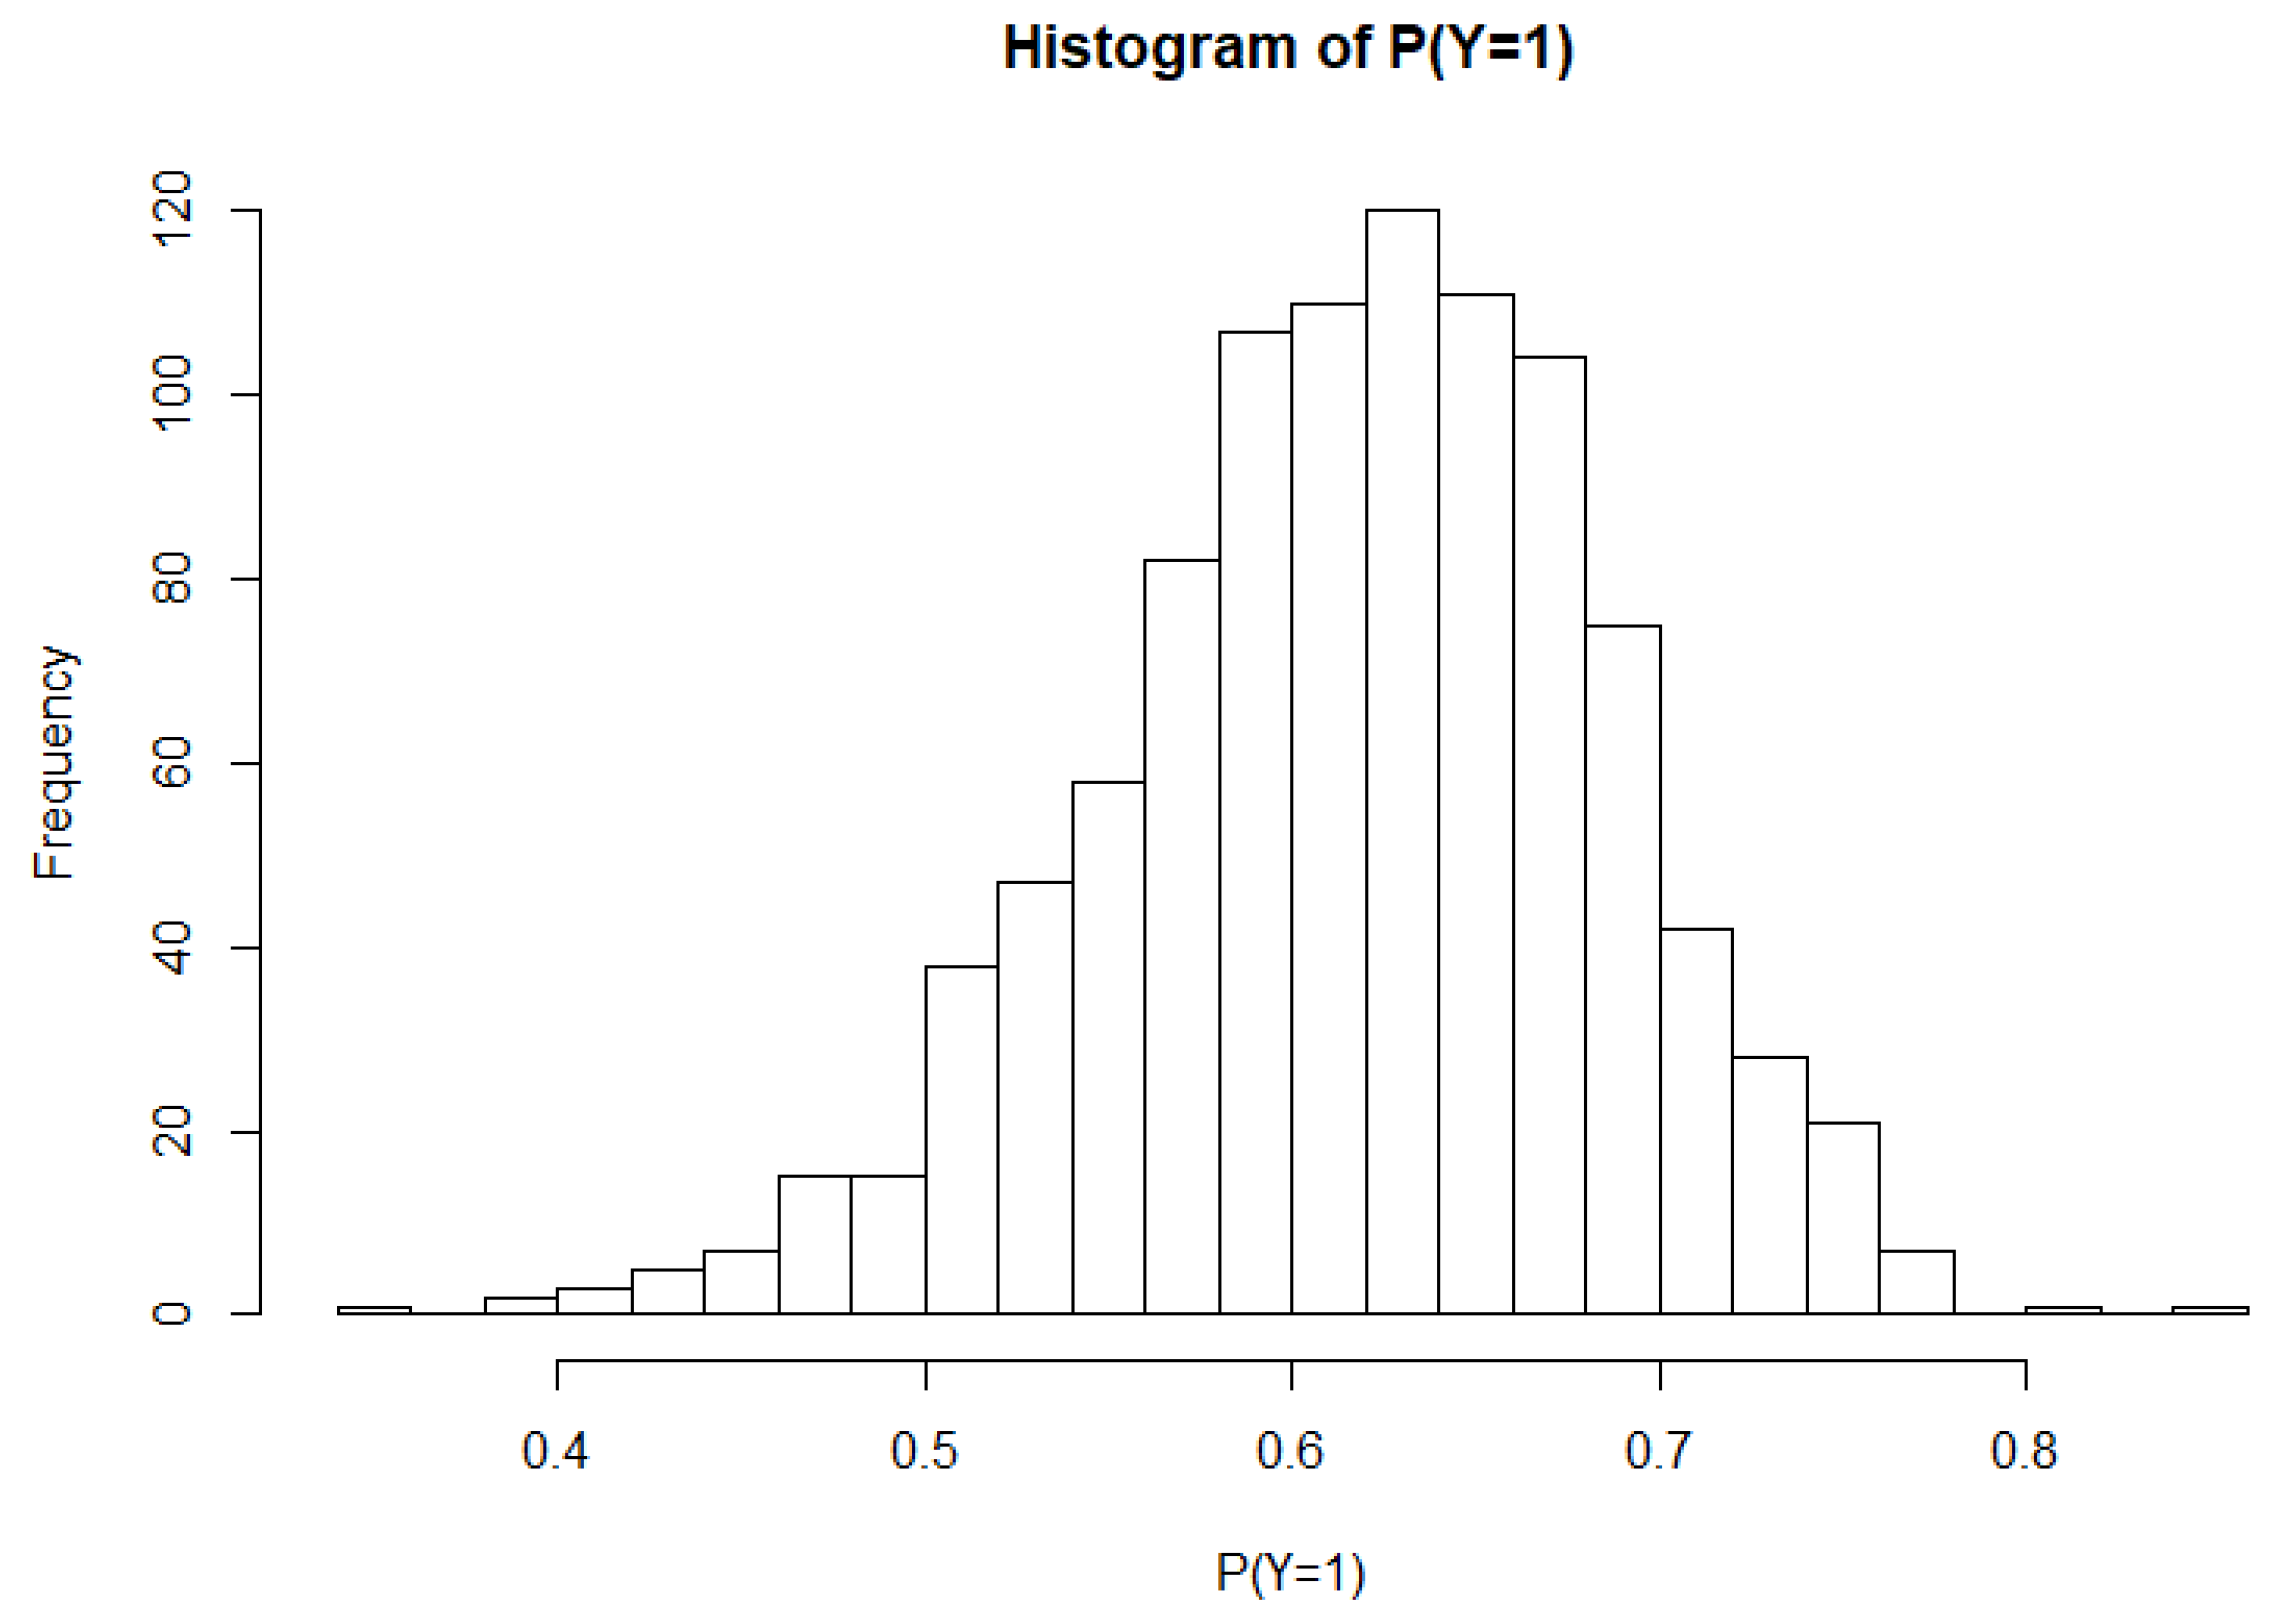
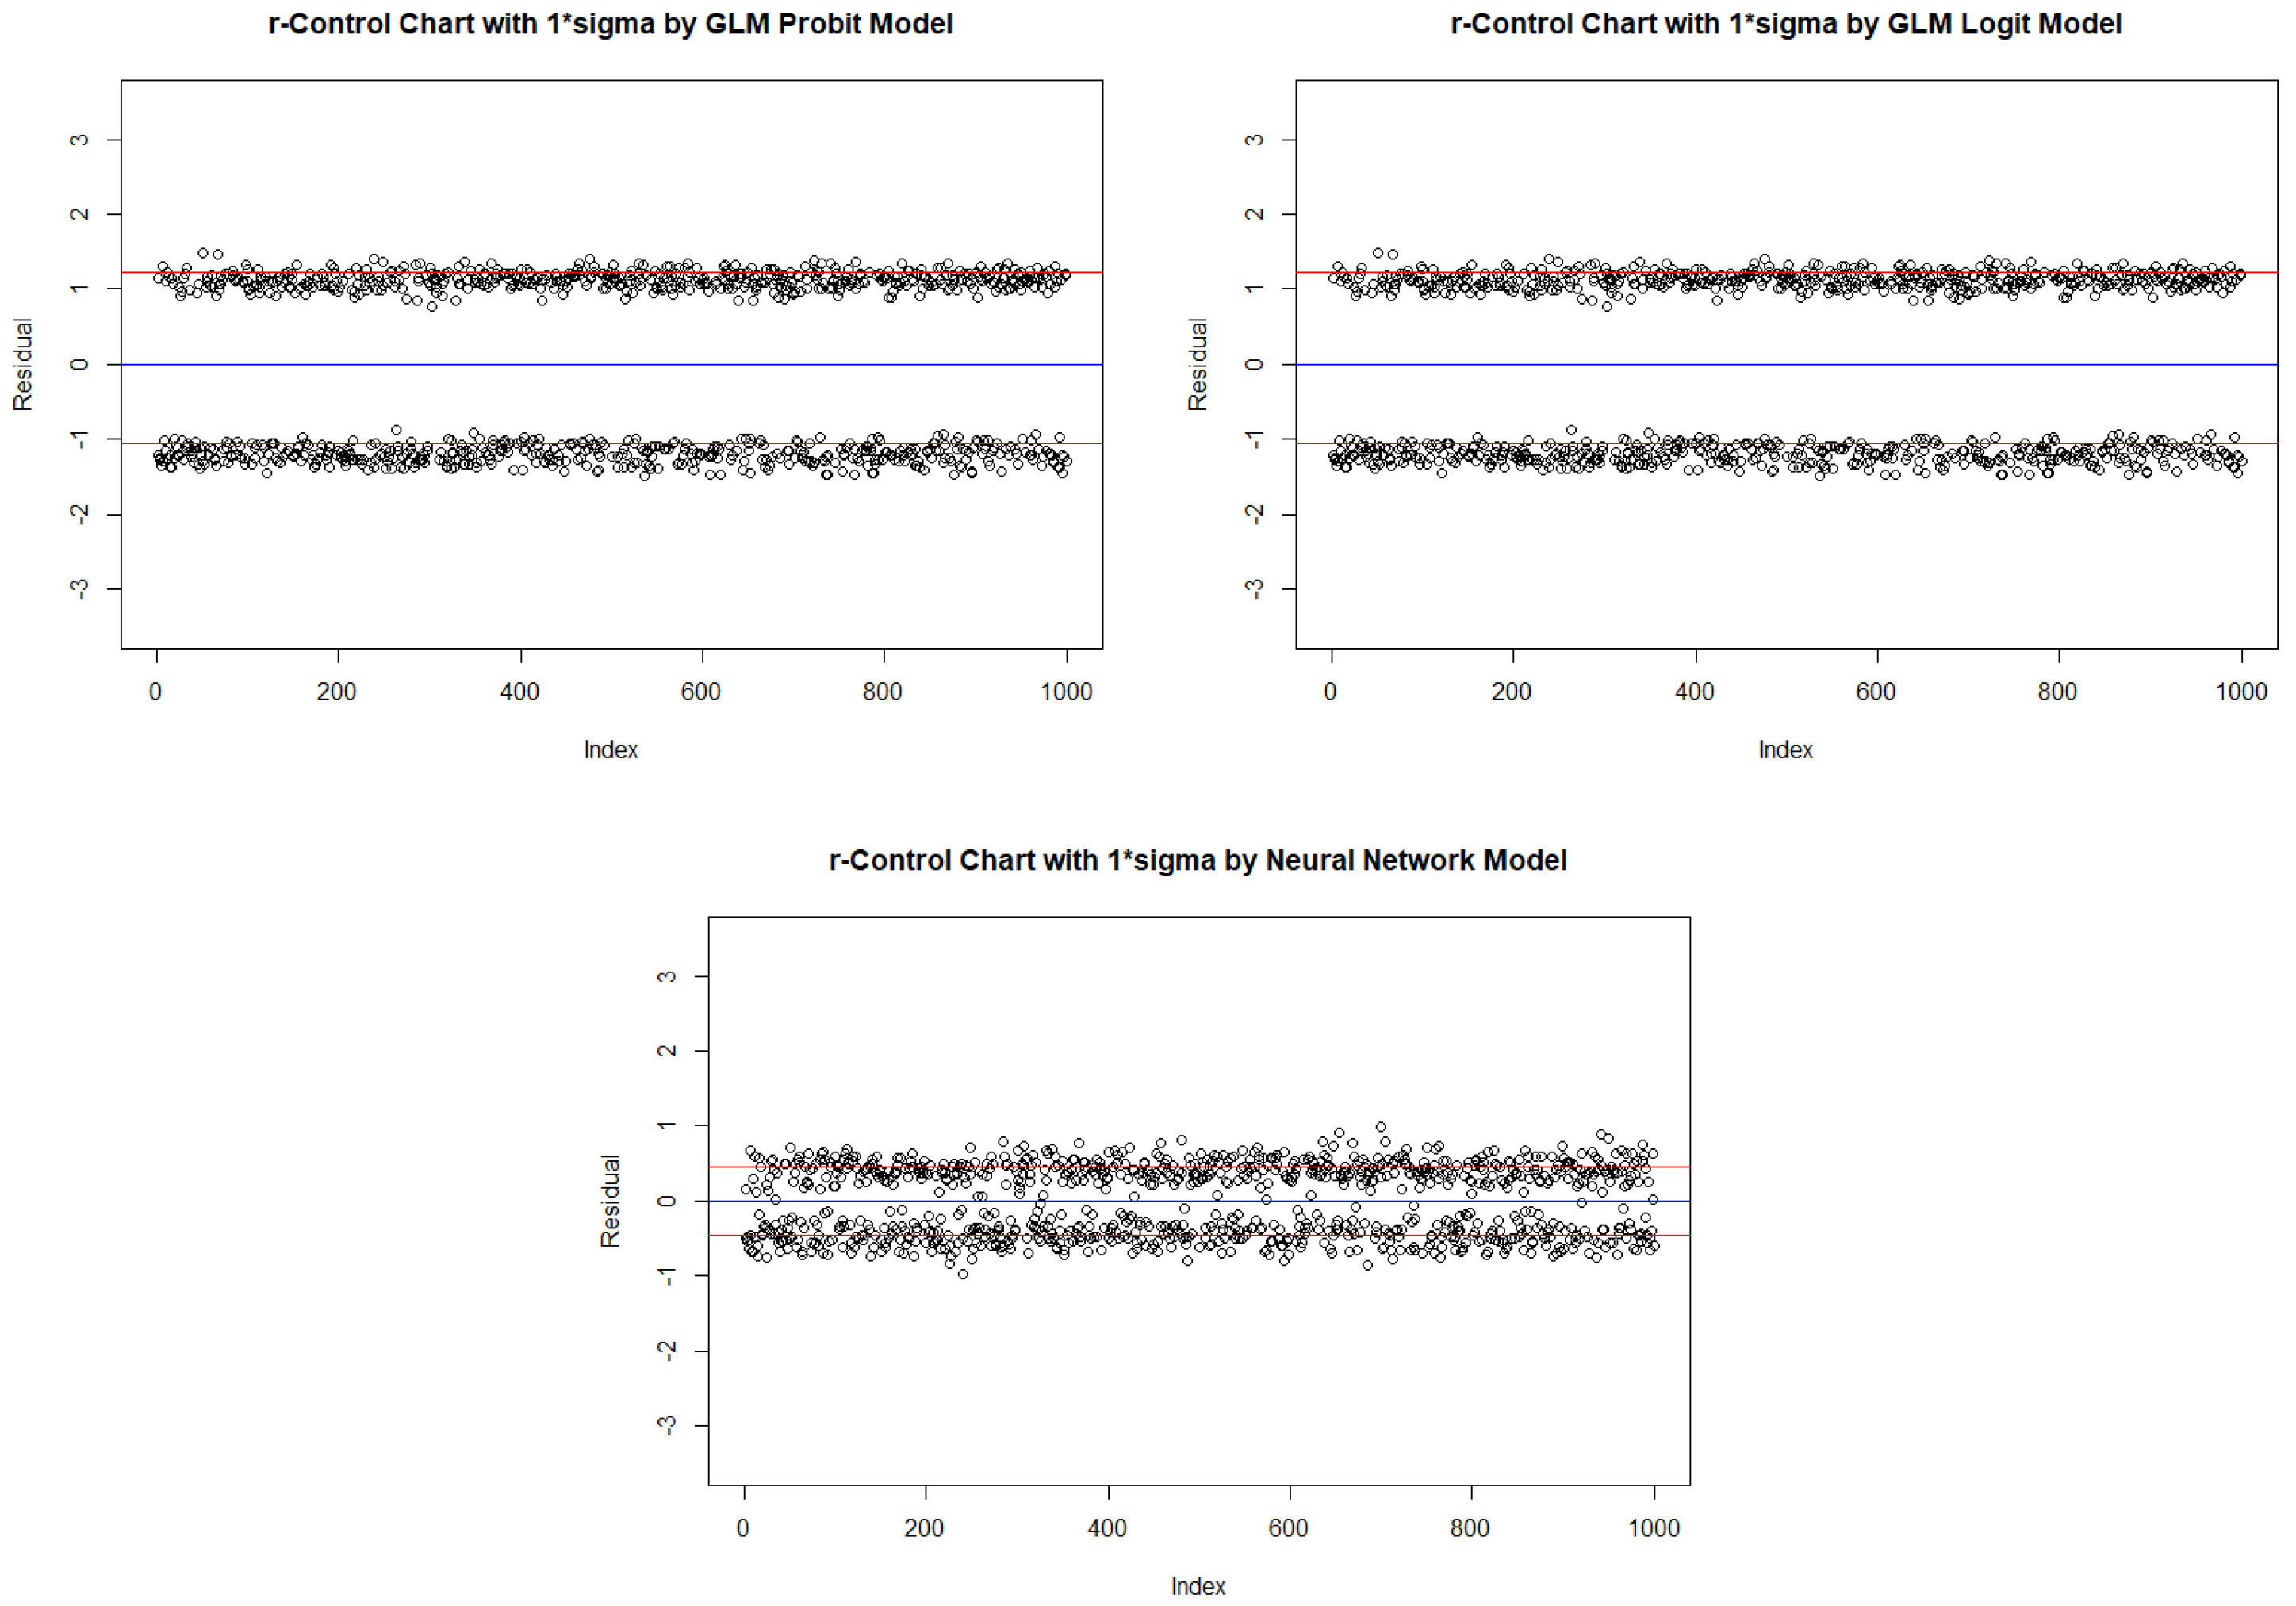
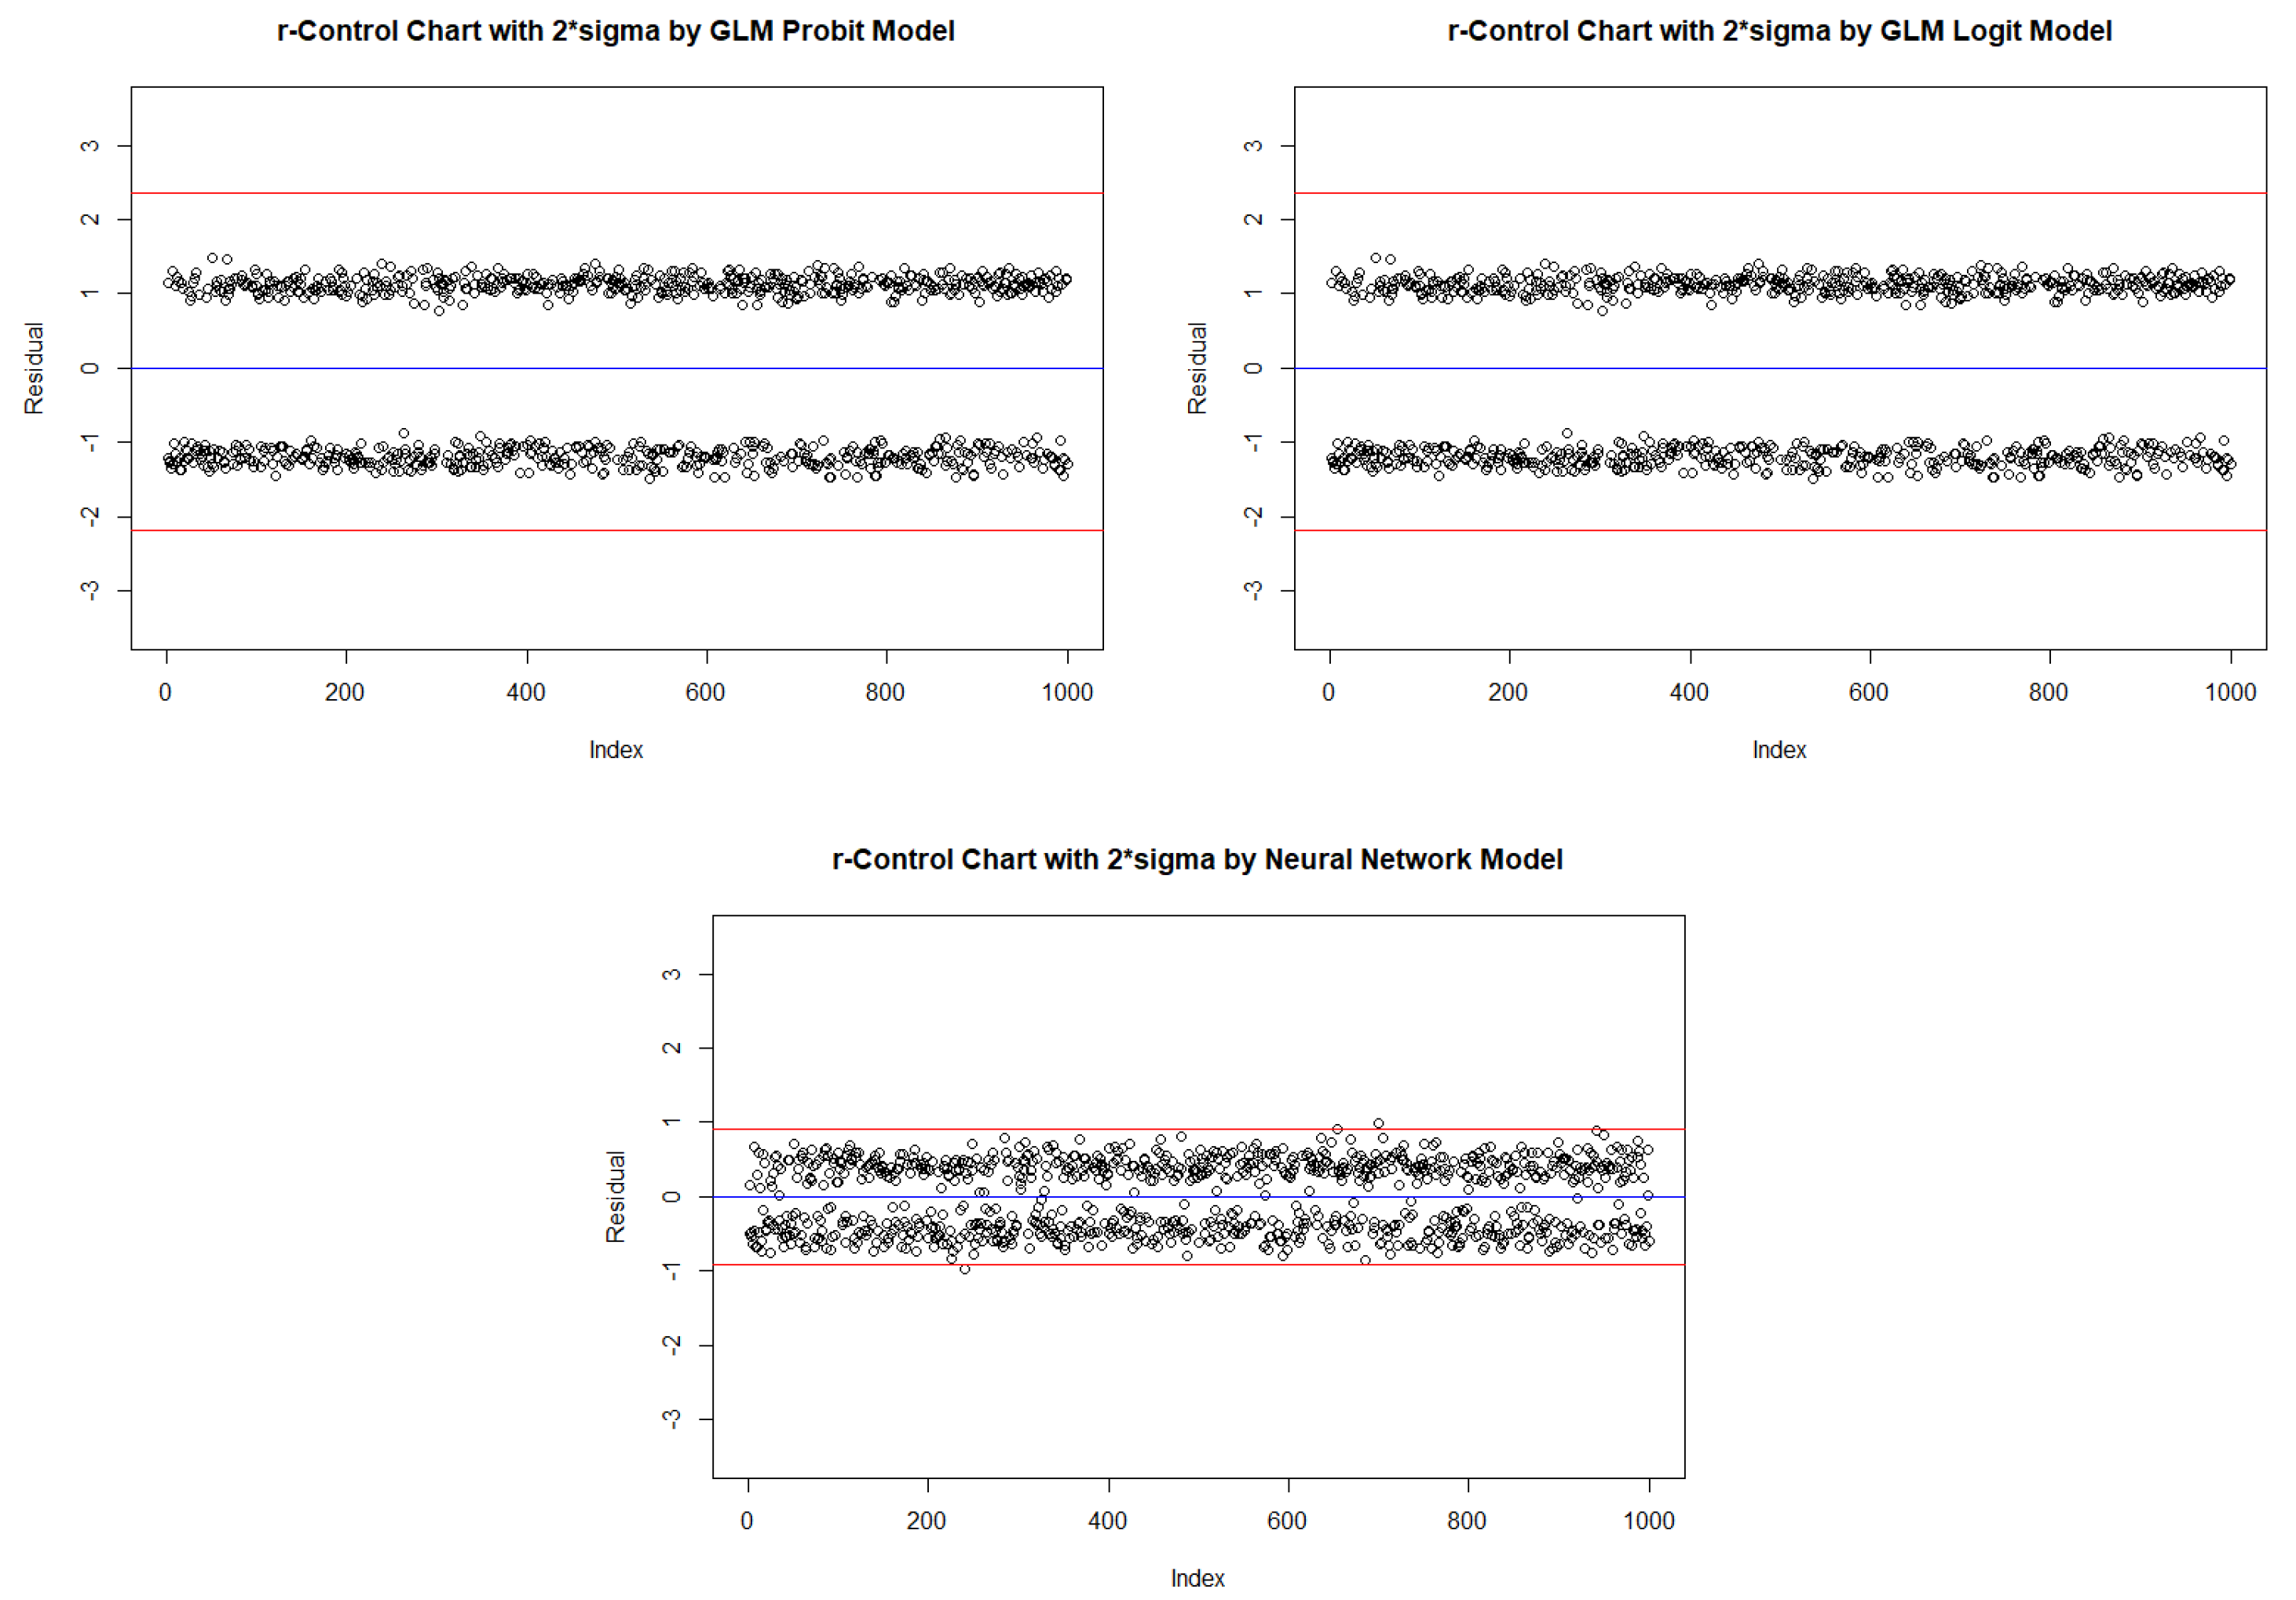
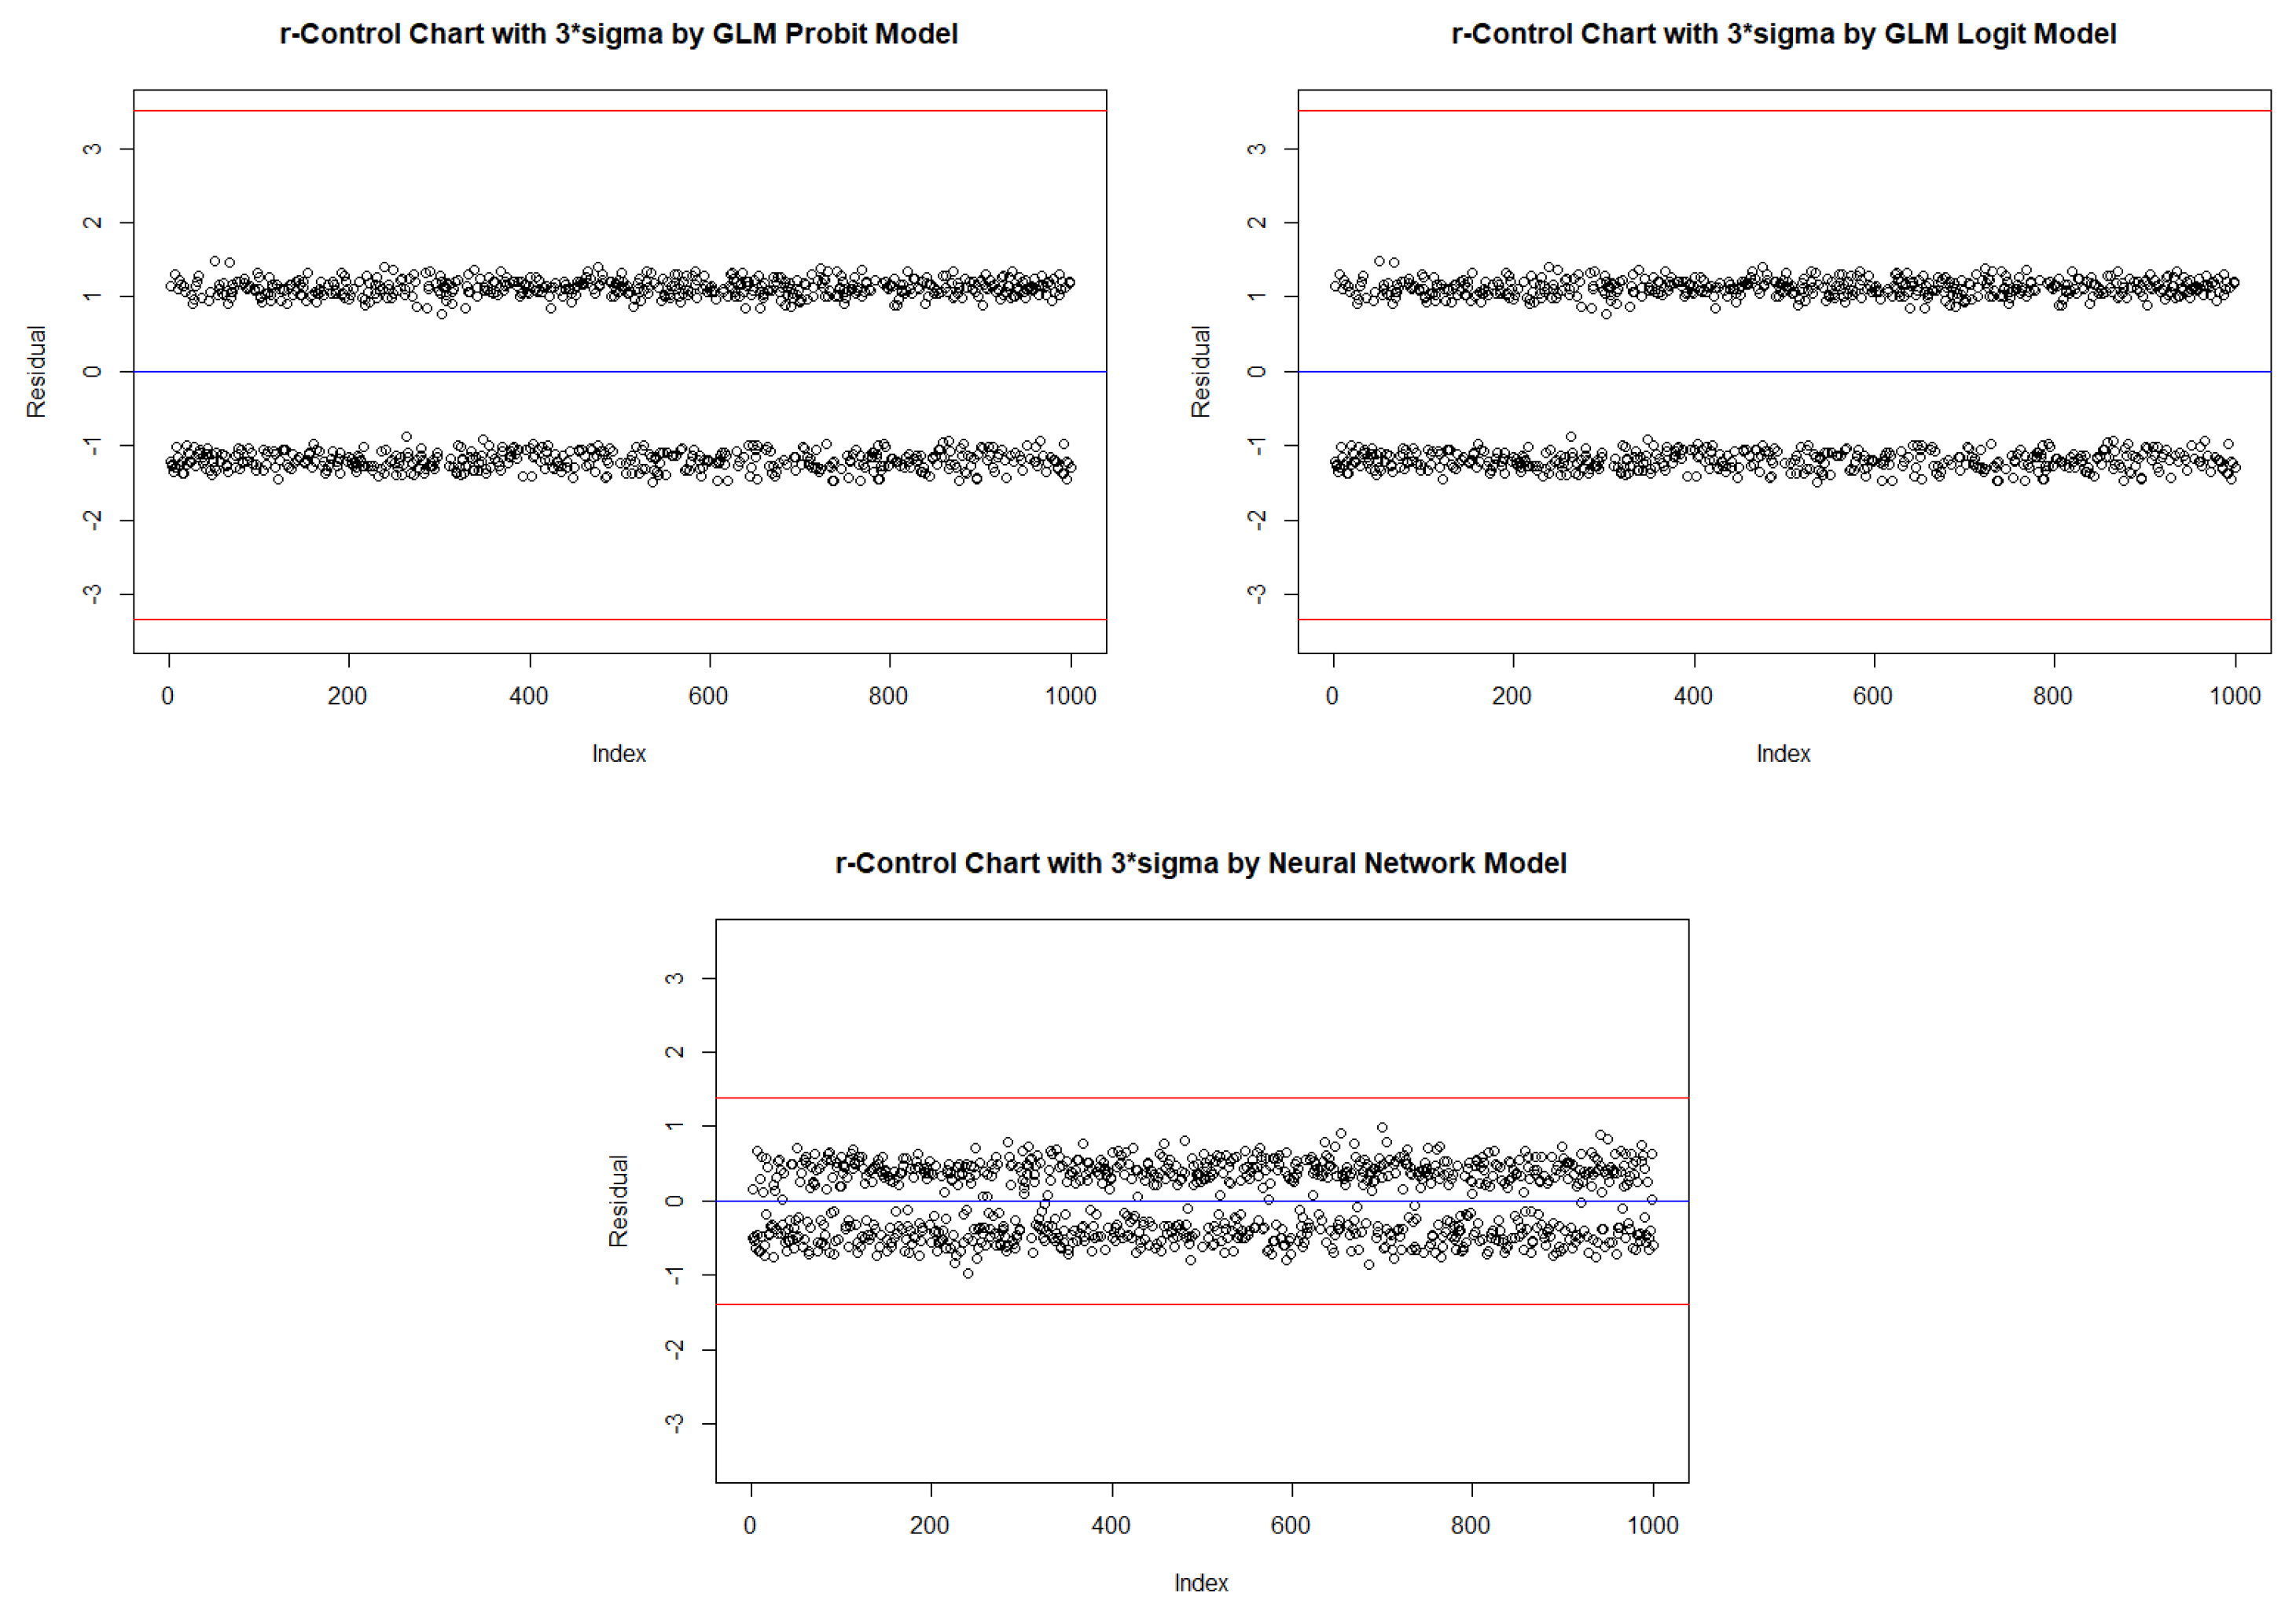






| Probit | Logit | Neural Network | ||||||||
|---|---|---|---|---|---|---|---|---|---|---|
| Case | ||||||||||
| In-control | ARL | 2.590 | 520.152 | NA | 2.586 | 536.938 | NA | 2.453 | 322.806 | NA |
| Center | 0.013 | 0.013 | 0.013 | 0.013 | 0.013 | 0.013 | 0.000 | 0.000 | 0.000 | |
| LCL | −1.063 | −2.202 | −3.340 | −1.063 | −2.201 | −3.340 | −0.455 | −0.911 | −1.366 | |
| UCL | 1.215 | 2.354 | 3.492 | 1.215 | 2.354 | 3.492 | 0.455 | 0.911 | 1.366 | |
| CI Length | 2.278 | 4.555 | 6.833 | 2.278 | 4.555 | 6.833 | 0.911 | 1.821 | 2.732 | |
| Coverage | 0.610 | 1.000 | 1.000 | 0.610 | 1.000 | 1.000 | 0.591 | 0.998 | 1.000 | |
| One Inflated | ARL | 3.532 | 291.492 | NA | 3.528 | 302.546 | NA | 3.094 | 62.599 | 429.500 |
| Center | 0.013 | 0.013 | 0.013 | 0.013 | 0.013 | 0.013 | 0.000 | 0.000 | 0.000 | |
| LCL | −0.934 | −2.002 | −3.069 | −0.934 | −2.002 | −3.069 | −0.421 | −0.842 | −1.263 | |
| UCL | 1.200 | 2.268 | 3.335 | 1.200 | 2.268 | 3.335 | 0.421 | 0.842 | 1.263 | |
| CI Length | 2.135 | 4.269 | 6.404 | 2.135 | 4.269 | 6.404 | 0.842 | 1.684 | 2.527 | |
| Coverage | 0.717 | 0.997 | 1.000 | 0.717 | 0.998 | 1.000 | 0.677 | 0.981 | 1.000 | |
| Zero Inflated | ARL | 2.177 | NA | NA | 2.178 | NA | NA | 2.197 | 429.347 | NA |
| Center | 0.013 | 0.013 | 0.013 | 0.013 | 0.013 | 0.013 | 0.000 | 0.000 | 0.000 | |
| LCL | −1.154 | −2.320 | −3.486 | −1.154 | −2.320 | −3.486 | −0.469 | −0.938 | −1.406 | |
| UCL | 1.179 | 2.345 | 3.512 | 1.179 | 2.345 | 3.512 | 0.469 | 0.938 | 1.406 | |
| CI Length | 2.333 | 4.665 | 6.998 | 2.333 | 4.665 | 6.998 | 0.938 | 1.875 | 2.813 | |
| Coverage | 0.536 | 1.000 | 1.000 | 0.536 | 1.000 | 1.000 | 0.555 | 0.999 | 1.000 | |
| Probit | Logit | Neural Network | ||||||||
|---|---|---|---|---|---|---|---|---|---|---|
| Case | ||||||||||
| In-control | ARL | 2.9 | NA | NA | 2.9 | NA | NA | 3.0 | NA | NA |
| Center | 0.076 | 0.076 | 0.076 | 0.076 | 0.076 | 0.076 | 0.000 | 0.000 | 0.000 | |
| LCL | −1.074 | −2.225 | −3.375 | −1.074 | −2.225 | −3.375 | −0.482 | −0.964 | −1.446 | |
| UCL | 1.226 | 2.376 | 3.527 | 1.226 | 2.376 | 3.527 | 0.482 | 0.964 | 1.446 | |
| CI Length | 2.301 | 4.601 | 6.902 | 2.301 | 4.601 | 6.902 | 0.964 | 1.927 | 2.891 | |
| Coverage | 0.617 | 1.000 | 1.000 | 0.617 | 1.000 | 1.000 | 0.604 | 1.000 | 1.000 | |
| One Inflated | ARL | 4.467 | NA | NA | 4.467 | NA | NA | 4.533 | 423.833 | NA |
| Center | 0.139 | 0.139 | 0.139 | 0.139 | 0.139 | 0.139 | 0.001 | 0.001 | 0.001 | |
| LCL | −0.935 | −2.009 | −3.084 | −0.935 | −2.009 | −3.084 | −0.442 | −0.884 | −1.326 | |
| UCL | 1.214 | 2.288 | 3.362 | 1.214 | 2.288 | 3.362 | 0.443 | 0.885 | 1.328 | |
| CI Length | 2.149 | 4.298 | 6.446 | 2.149 | 4.298 | 6.446 | 0.885 | 1.769 | 2.654 | |
| Coverage | 0.725 | 1.000 | 1.000 | 0.725 | 1.000 | 1.000 | 0.723 | 0.999 | 1.000 | |
| Zero Inflated | ARL | 2.100 | NA | NA | 2.100 | NA | NA | 2.400 | NA | NA |
| Center | 0.016 | 0.016 | 0.016 | 0.016 | 0.016 | 0.016 | 0.000 | 0.000 | 0.000 | |
| LCL | −1.160 | −2.335 | −3.510 | −1.160 | −2.335 | −3.510 | −0.495 | −0.990 | −1.484 | |
| UCL | 1.191 | 2.366 | 3.542 | 1.191 | 2.366 | 3.542 | 0.495 | 0.989 | 1.484 | |
| CI Length | 2.351 | 4.701 | 7.052 | 2.351 | 4.701 | 7.052 | 0.990 | 1.979 | 2.969 | |
| Coverage | 0.527 | 1.000 | 1.000 | 0.527 | 1.000 | 1.000 | 0.520 | 1.000 | 1.000 | |
| Cl.thickness | Cell.size | Cell.shape | Marg.adhesion | Epith.c.size | Bare.nuclei | Bl.cromatin | Normal.nucleoli | Mitoses | |
|---|---|---|---|---|---|---|---|---|---|
| Cl.thickness | 1.000 | 0.642 | 0.653 | 0.488 | 0.524 | 0.593 | 0.554 | 0.534 | 0.355 |
| Cell.size | 0.642 | 1.000 | 0.907 | 0.707 | 0.754 | 0.692 | 0.756 | 0.719 | 0.465 |
| Cell.shape | 0.653 | 0.907 | 1.000 | 0.686 | 0.722 | 0.714 | 0.735 | 0.718 | 0.447 |
| Marg.adhesion | 0.488 | 0.707 | 0.686 | 1.000 | 0.595 | 0.671 | 0.669 | 0.603 | 0.425 |
| Epith.c.size | 0.524 | 0.754 | 0.722 | 0.595 | 1.000 | 0.586 | 0.618 | 0.629 | 0.481 |
| Bare.nuclei | 0.593 | 0.692 | 0.714 | 0.671 | 0.586 | 1.000 | 0.681 | 0.584 | 0.349 |
| Bl.cromatin | 0.554 | 0.756 | 0.735 | 0.669 | 0.618 | 0.681 | 1.000 | 0.666 | 0.354 |
| Normal.nucleoli | 0.534 | 0.719 | 0.718 | 0.603 | 0.629 | 0.584 | 0.666 | 1.000 | 0.437 |
| Mitoses | 0.355 | 0.465 | 0.447 | 0.425 | 0.481 | 0.349 | 0.354 | 0.437 | 1.000 |
| Comp.1 | Comp.2 | Comp.3 | Comp.4 | Comp.5 | Comp.6 | Comp.7 | Comp.8 | Comp.9 | |
|---|---|---|---|---|---|---|---|---|---|
| Standard deviation | 2.430 | 0.875 | 0.734 | 0.680 | 0.617 | 0.550 | 0.543 | 0.511 | 0.297 |
| Proportion of Variance | 0.656 | 0.085 | 0.060 | 0.051 | 0.042 | 0.034 | 0.033 | 0.029 | 0.010 |
| Cumulative Proportion | 0.656 | 0.741 | 0.801 | 0.853 | 0.895 | 0.928 | 0.961 | 0.990 | 1.000 |
| Probit | Logit | Neural Network | |||||||
|---|---|---|---|---|---|---|---|---|---|
| Center | 0.022 | 0.022 | 0.022 | 0.038 | 0.038 | 0.038 | −0.002 | −0.002 | −0.002 |
| LCL | −0.381 | −0.785 | −1.188 | −0.368 | −0.773 | −1.178 | −0.123 | −0.244 | −0.365 |
| UCL | 0.426 | 0.829 | 1.233 | 0.443 | 0.849 | 1.254 | 0.119 | 0.240 | 0.361 |
| CL Length | 0.807 | 1.614 | 2.421 | 0.811 | 1.622 | 2.433 | 0.242 | 0.485 | 0.727 |
| Probit | Logit | Neural Network | |||||||
|---|---|---|---|---|---|---|---|---|---|
| Center | 0.095 | 0.095 | 0.095 | 0.095 | 0.095 | 0.095 | −0.003 | −0.003 | −0.003 |
| LCL | −1.034 | −2.163 | −3.293 | −1.034 | −2.163 | −3.293 | −0.470 | −0.937 | −1.403 |
| UCL | 1.225 | 2.354 | 3.484 | 1.225 | 2.354 | 3.483 | 0.464 | 0.930 | 1.397 |
| CL Length | 2.259 | 4.518 | 6.776 | 2.259 | 4.518 | 6.776 | 0.933 | 1.867 | 2.800 |
© 2020 by the authors. Licensee MDPI, Basel, Switzerland. This article is an open access article distributed under the terms and conditions of the Creative Commons Attribution (CC BY) license (http://creativecommons.org/licenses/by/4.0/).
Share and Cite
Kim, J.-M.; Wang, N.; Liu, Y.; Park, K. Residual Control Chart for Binary Response with Multicollinearity Covariates by Neural Network Model. Symmetry 2020, 12, 381. https://doi.org/10.3390/sym12030381
Kim J-M, Wang N, Liu Y, Park K. Residual Control Chart for Binary Response with Multicollinearity Covariates by Neural Network Model. Symmetry. 2020; 12(3):381. https://doi.org/10.3390/sym12030381
Chicago/Turabian StyleKim, Jong-Min, Ning Wang, Yumin Liu, and Kayoung Park. 2020. "Residual Control Chart for Binary Response with Multicollinearity Covariates by Neural Network Model" Symmetry 12, no. 3: 381. https://doi.org/10.3390/sym12030381
APA StyleKim, J.-M., Wang, N., Liu, Y., & Park, K. (2020). Residual Control Chart for Binary Response with Multicollinearity Covariates by Neural Network Model. Symmetry, 12(3), 381. https://doi.org/10.3390/sym12030381


