Implementing a Novel Use of Multicriteria Decision Analysis to Select IIoT Platforms for Smart Manufacturing

 , ,
, ,  , and
, and
Abstract
1. Introduction
1.1. Literature Review
1.1.1. MCDA as a Tool to Select an IIoT Platform
1.1.2. Use of MCDA to Select IIoT Platforms or Technology Platforms—Related Work
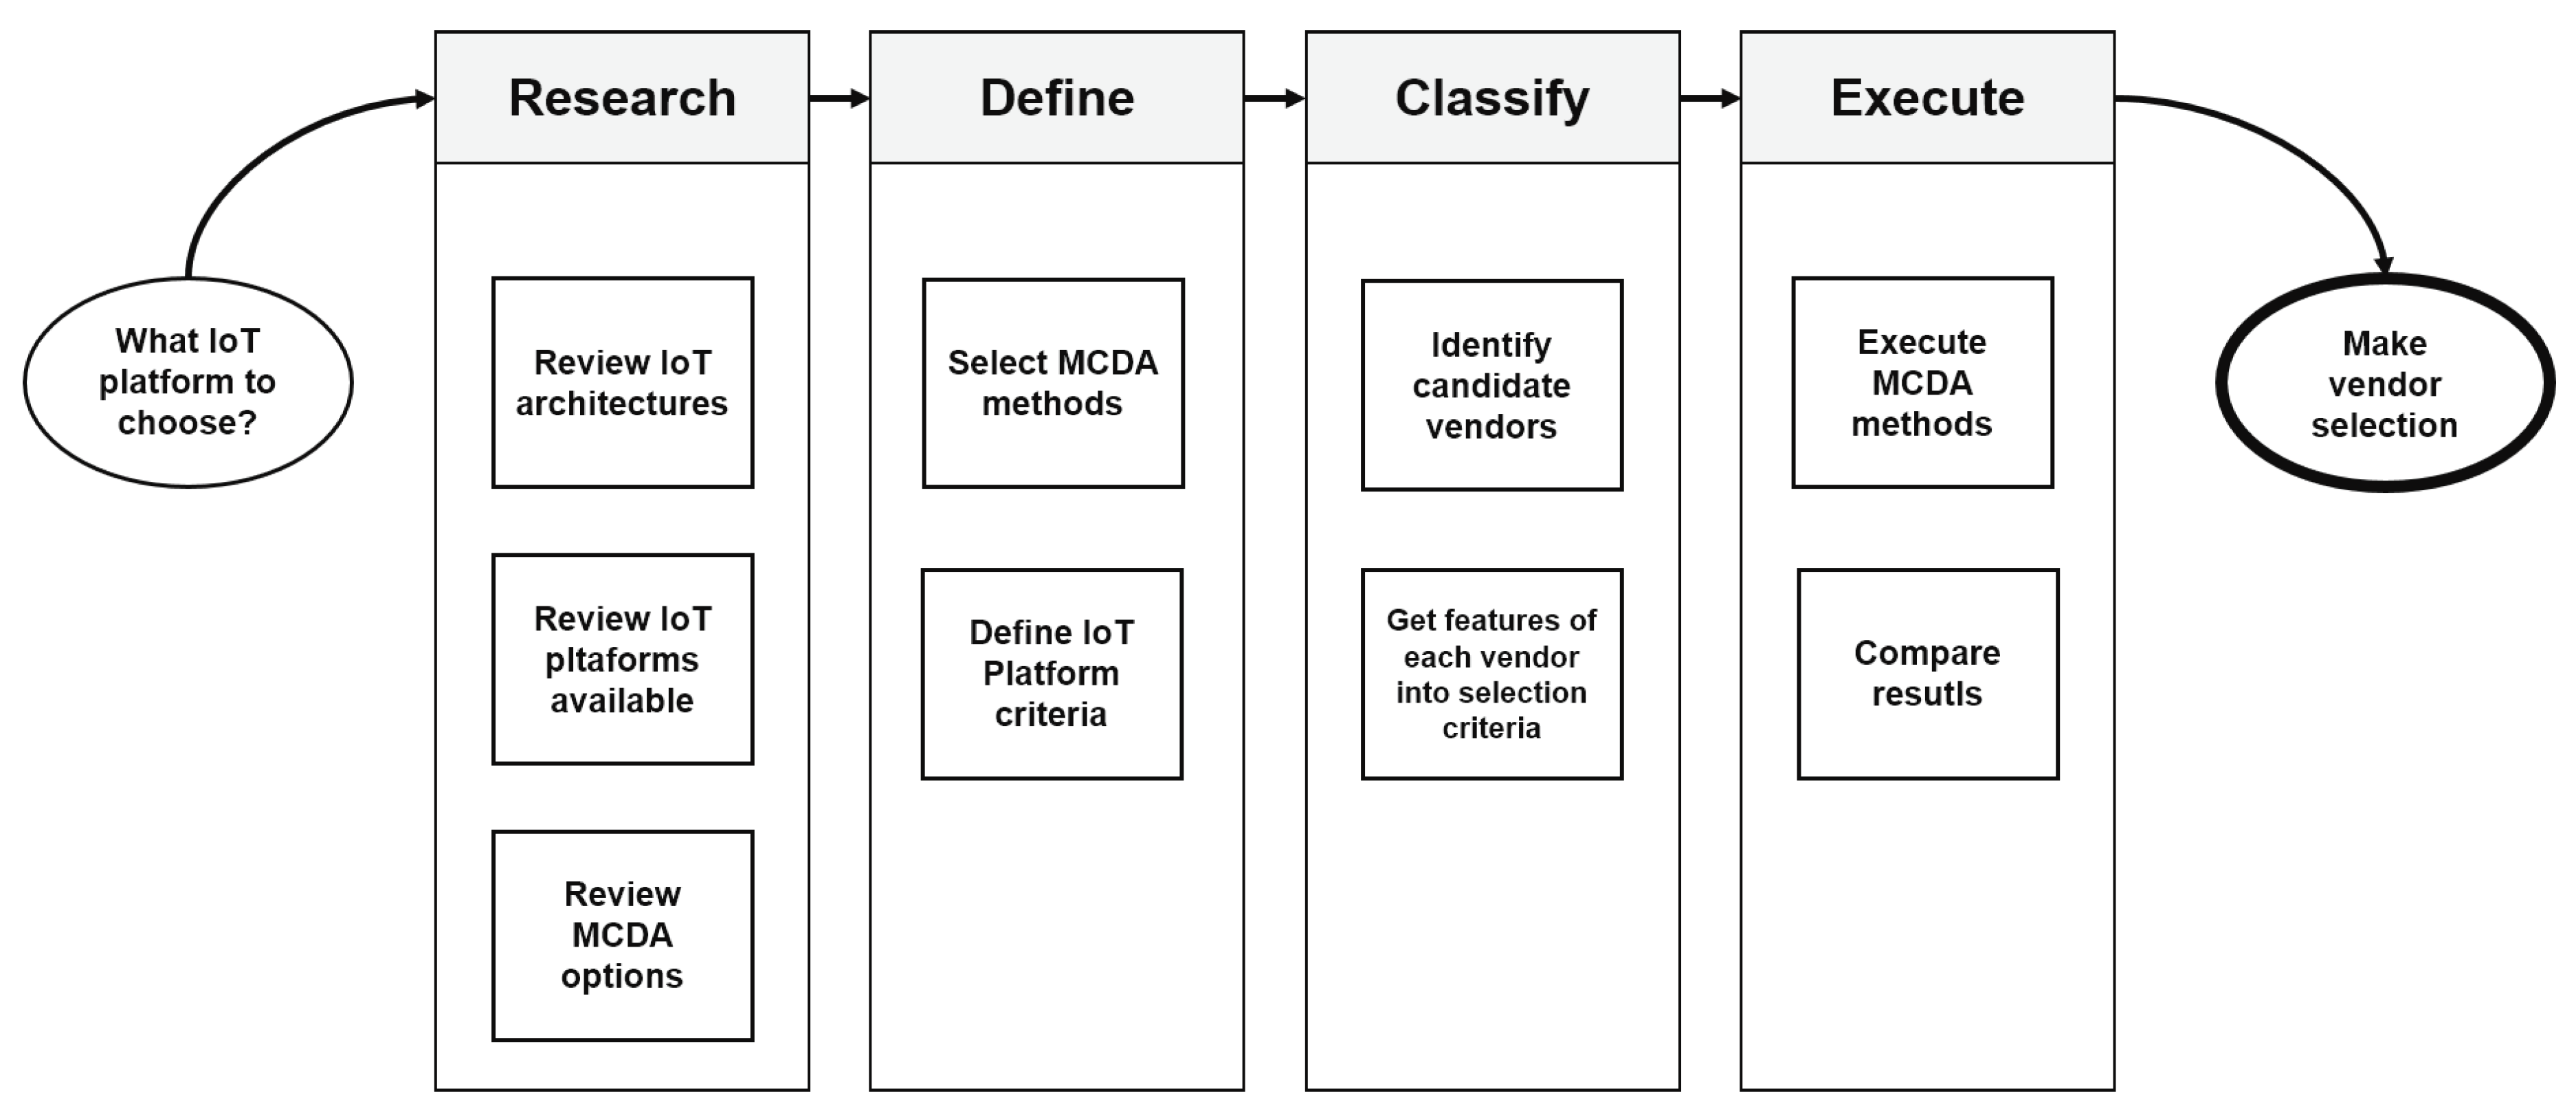
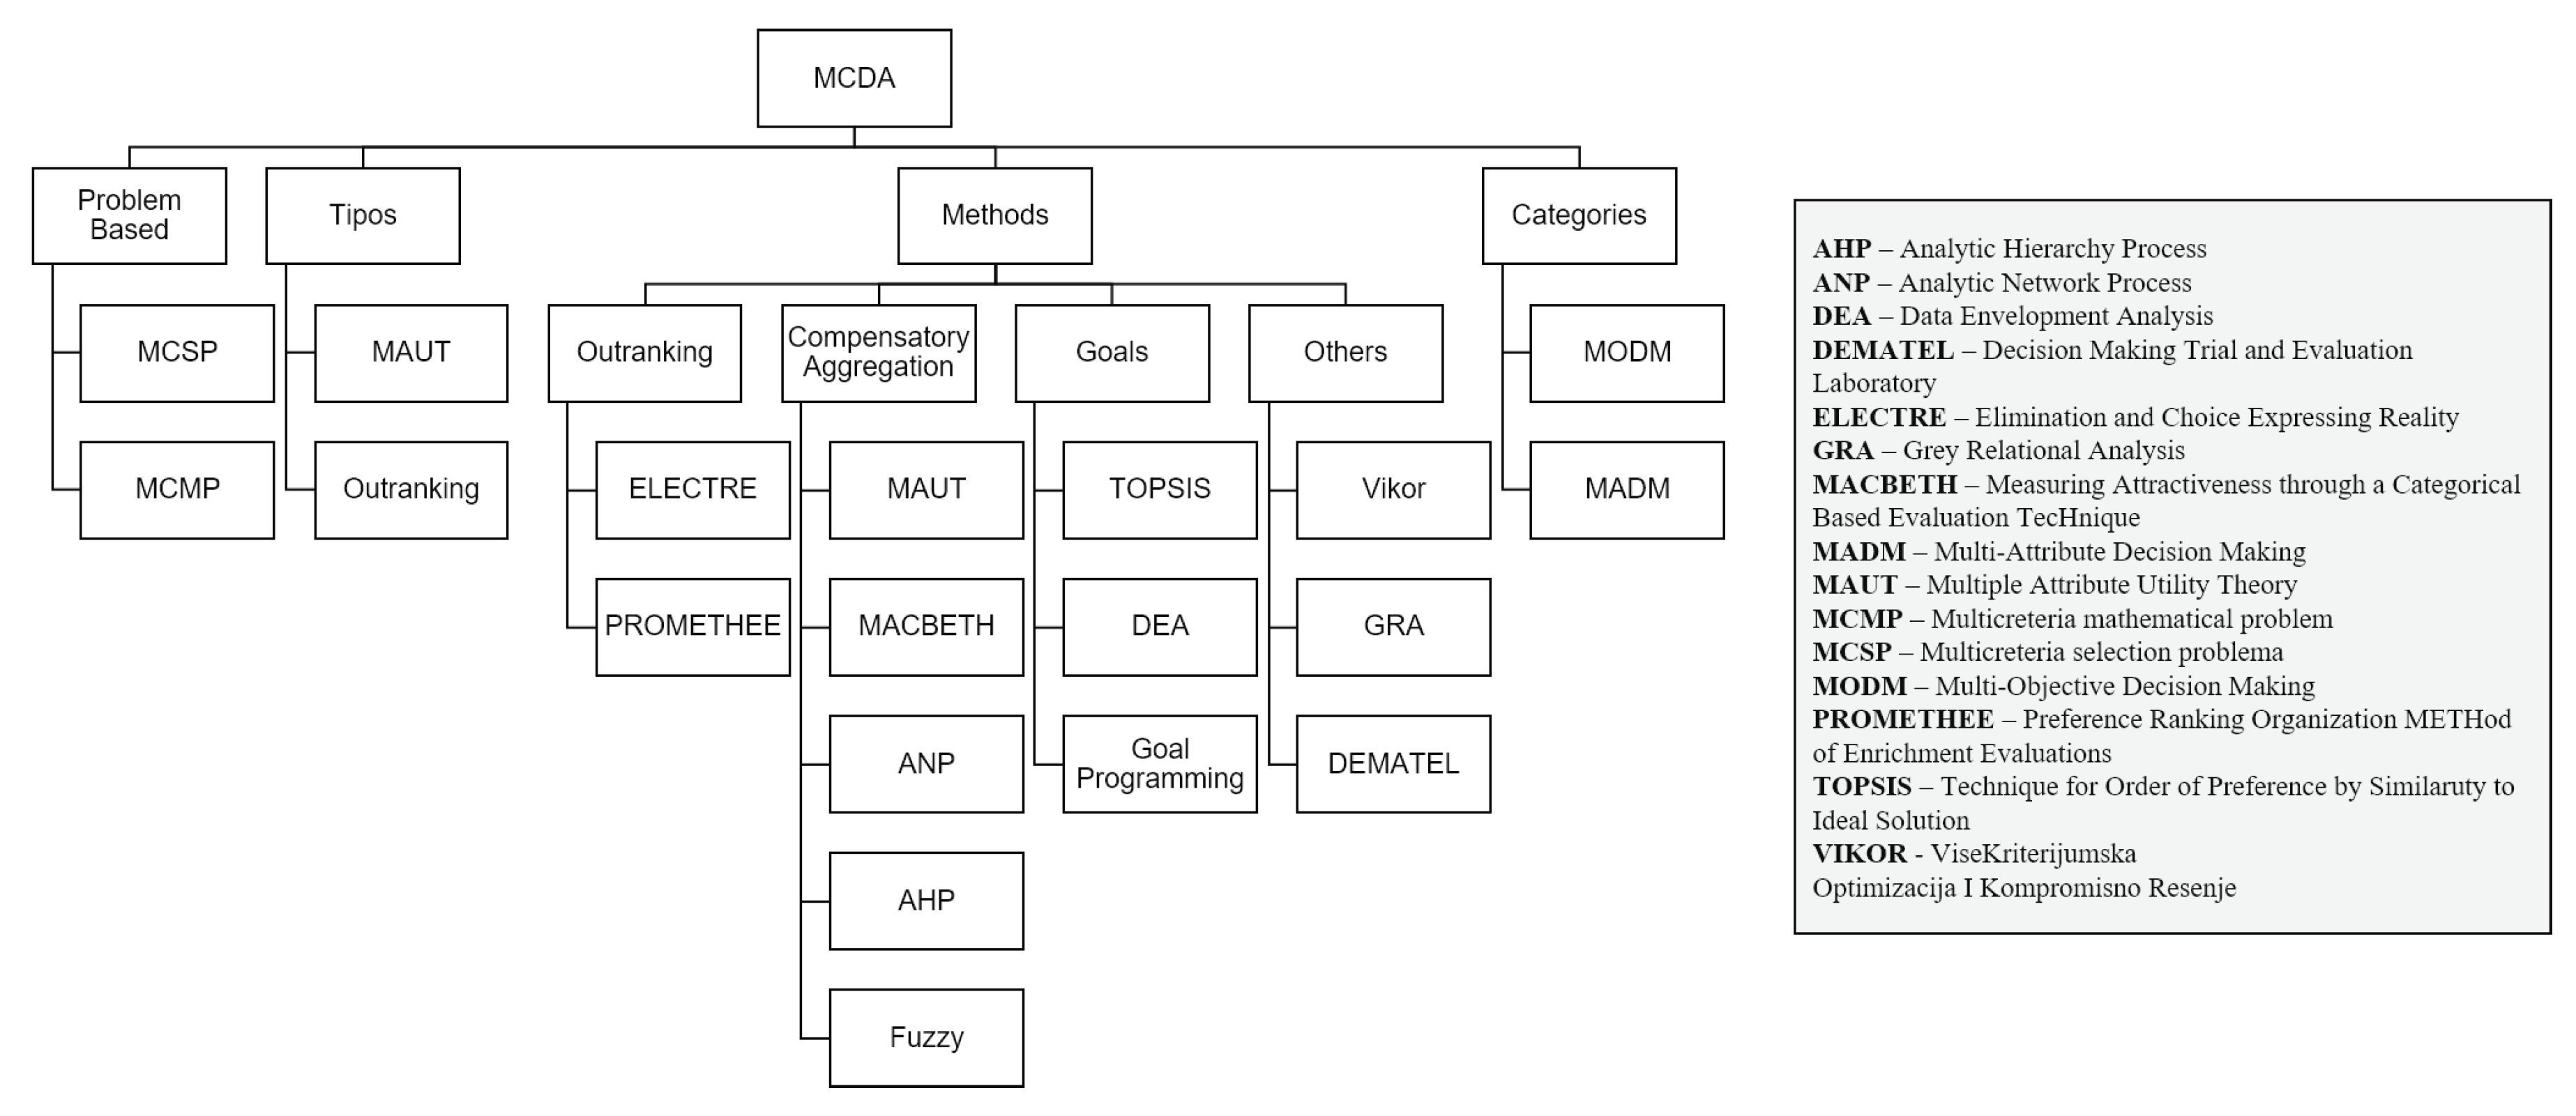
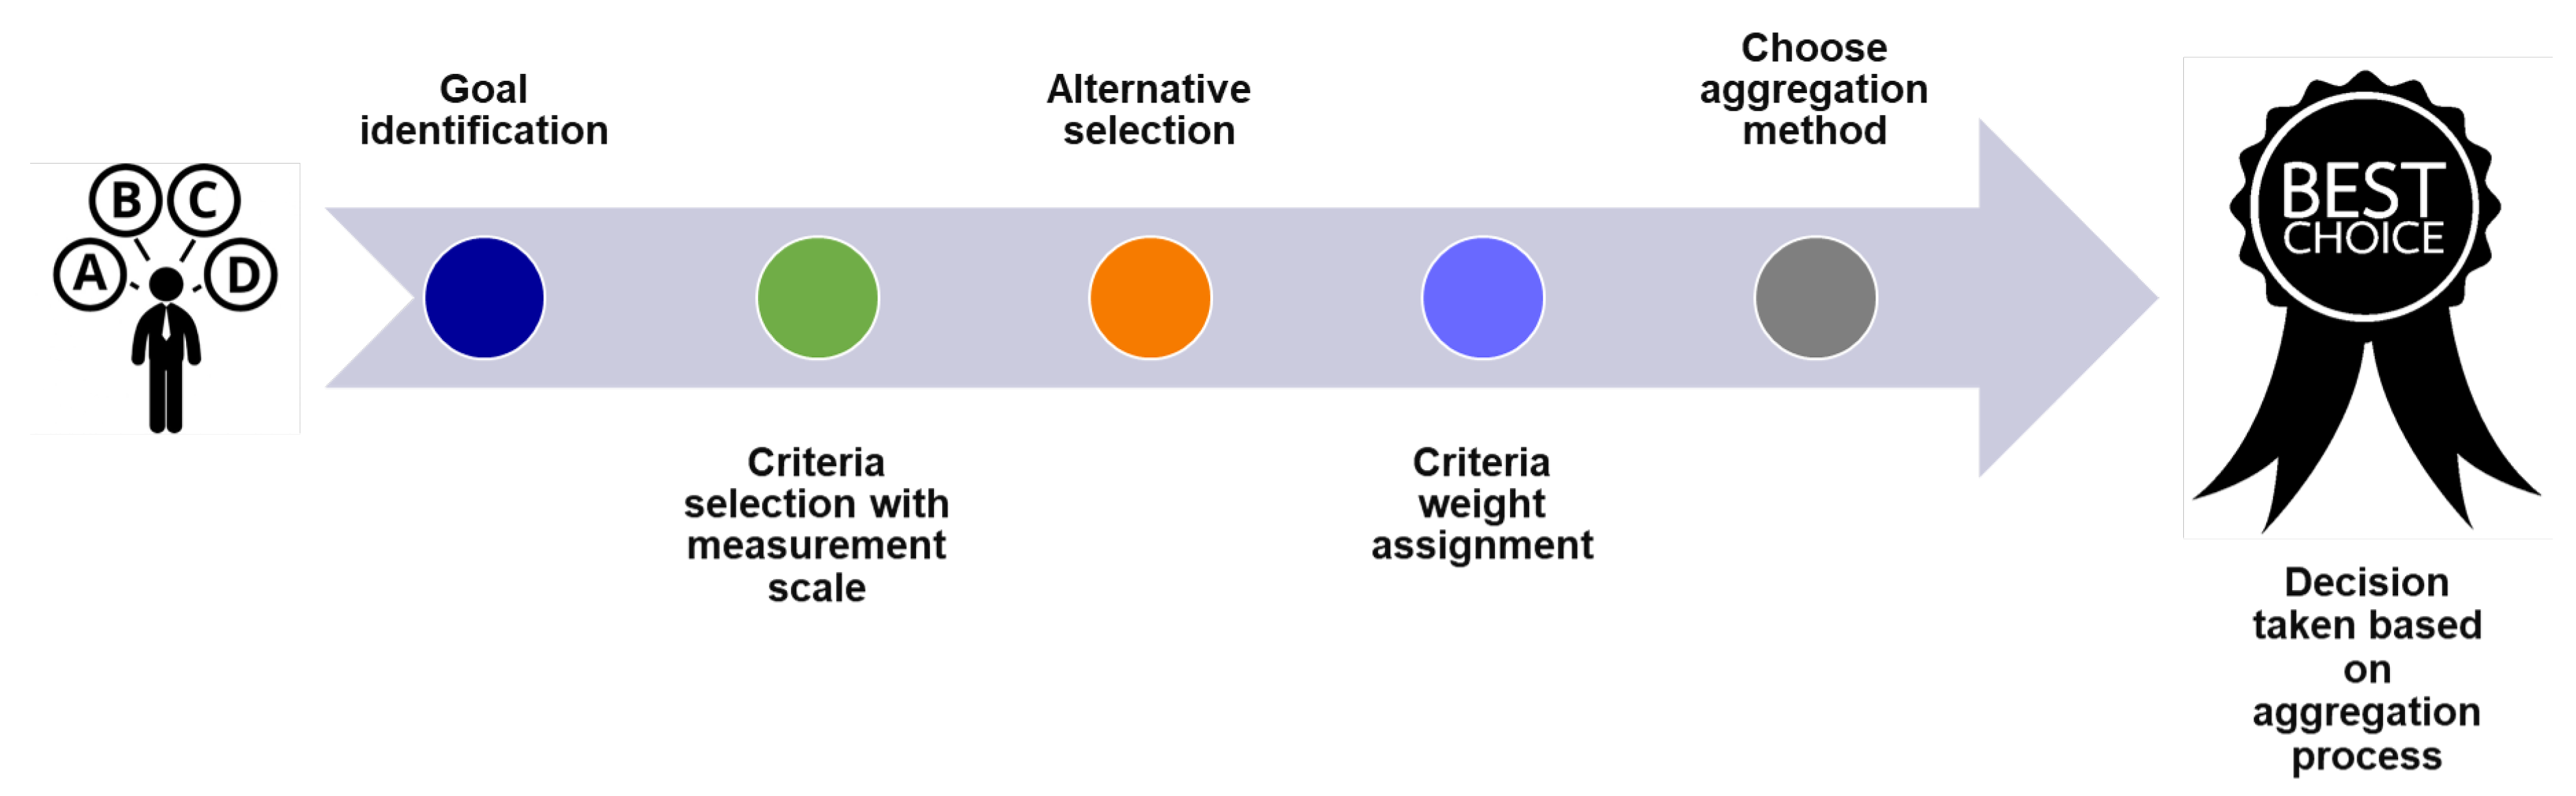
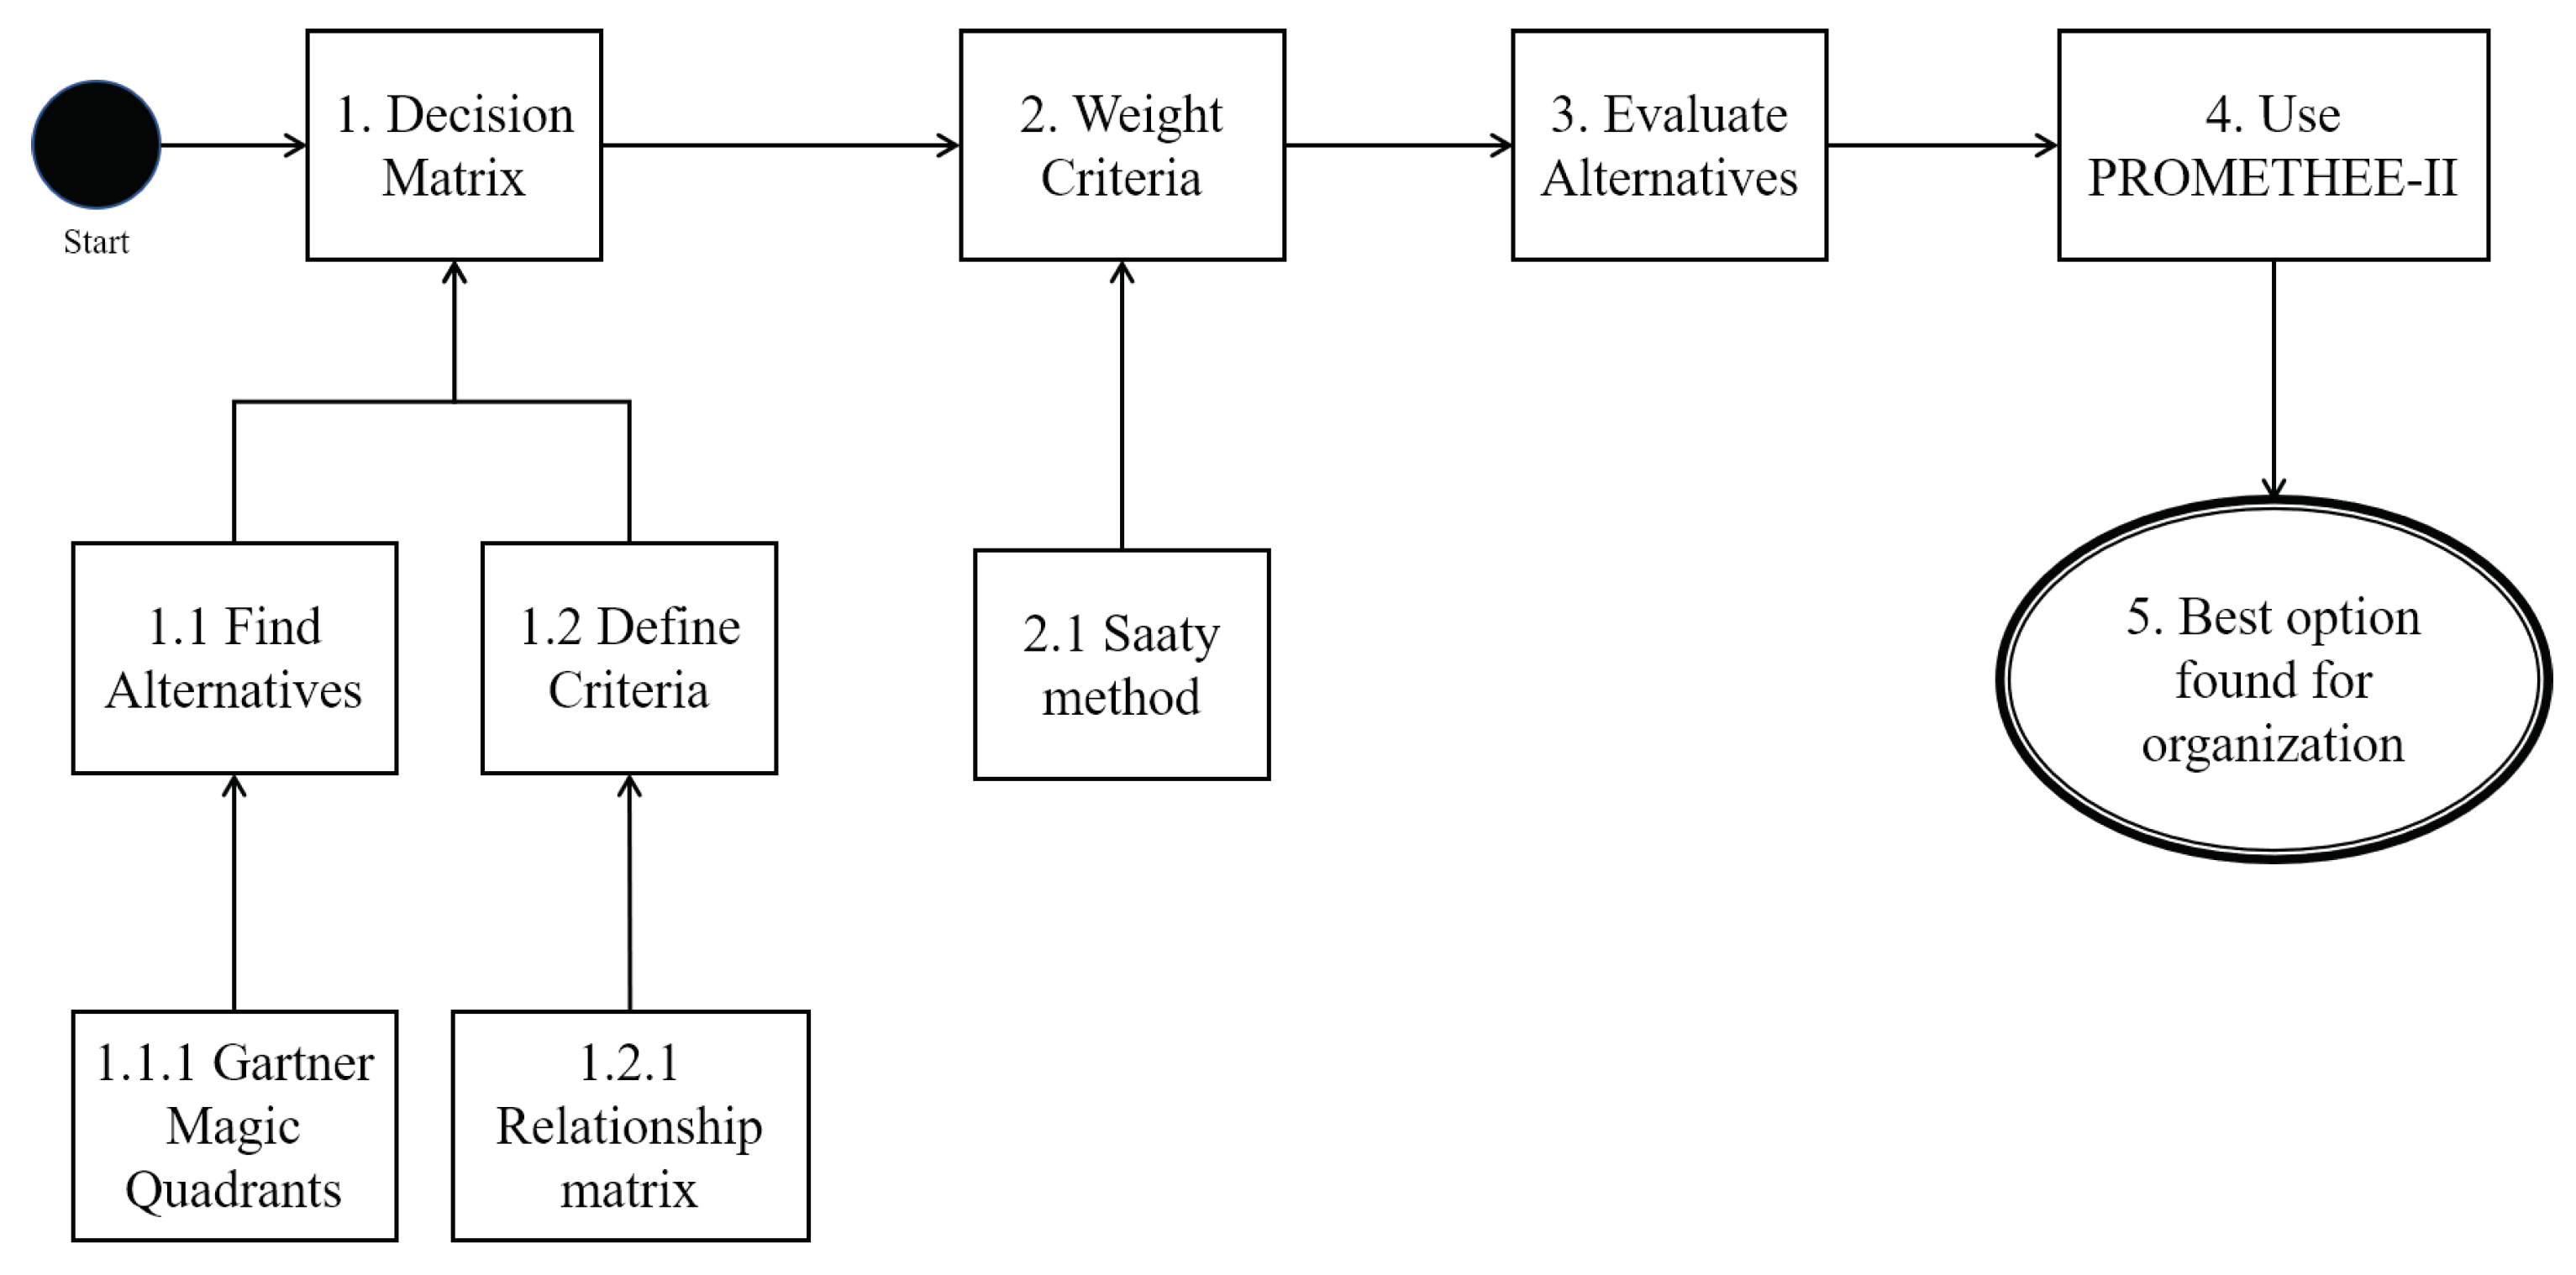
2. Materials and Methods
Methods
3. Results
3.1. Weight Criteria Calculation
3.2. IIoT Platform Selection
4. Discussion
5. Conclusions
Author Contributions
Funding
Conflicts of Interest
Abbreviations
| IoT | Internet of Things |
| IIoT | Industrial Internet of Things |
| MQTT | Message Queue Telemetry Transport |
| HTTP | Hypertext Transfer Protocol |
| AMQP | Advanced Message Queuing Protocol |
| S1 | Type of Azure IoT Hub |
| AWS | Amazon Web Services |
| GCP | Google Cloud Platform |
| MCDA | Multiple Criteria Decision Analysis |
References
- Rüßmann, M.; Lorenz, M.; Gerbert, P.; Waldner, M.; Justus, J.; Engel, P.; Harnisch, M. Industry 4.0: The future of productivity and growth in manufacturing industries. Boston Consult. Group 2015, 9, 54–89. [Google Scholar]
- Hatzivasilis, G.; Fysarakis, K.; Soultatos, O.; Askoxylakis, I.; Papaefstathiou, I.; Demetriou, G. The Industrial Internet of Things as an enabler for a Circular Economy Hy- LP: A novel IIoT protocol, evaluated on a wind park’s SDN/NFV-enabled 5G industrial network. Comput. Commun. 2018. [Google Scholar] [CrossRef]
- Höller, J.; Tsiatsis, V.; Mulligan, C.; Karnouskos, S.; Avesand, S.; Boyle, D. IoT Architecture—State of the Art. In From Machine-To-Machine to the Internet of Things; Academic Press: Oxford, UK, 2014. [Google Scholar] [CrossRef]
- Lanotte, R.; Merro, M. A semantic theory of the Internet of Things. Inf. Comput. 2018, 259, 72–101. [Google Scholar] [CrossRef]
- Rathore, M.M.; Ahmad, A.; Paul, A.; Rho, S. Urban planning and building smart cities based on the Internet of Things using Big Data analytics. Comput. Netw. 2016, 101, 63–80. [Google Scholar] [CrossRef]
- Figueira, J.; Greco, S.; Ehrgott, M. Multiple Criteria Decision analysis: State of the Art Surveys; Springer Science & Business Media: Berlin, Germany, 2005; Volume 78. [Google Scholar]
- Huang, I.B.; Keisler, J.; Linkov, I. Multi-criteria decision analysis in environmental sciences: Ten years of applications and trends. Sci. Total Environ. 2011, 409, 3578–3594. [Google Scholar] [CrossRef] [PubMed]
- Weyrich, M.; Ebert, C. Reference architectures for the internet of things. IEEE Softw. 2016, 33, 112–116. [Google Scholar] [CrossRef]
- Vasilomanolakis, E.; Daubert, J.; Luthra, M.; Gazis, V.; Wiesmaier, A.; Kikiras, P. On the Security and Privacy of Internet of Things Architectures and Systems. In Proceedings of the 2015 International Workshop on Secure Internet of Things, SIoT 2015, Vienna, Austria, 21–25 September 2015. [Google Scholar] [CrossRef]
- Gironés, T.; Canovas Solbes, J.; Parra-Boronat, A. An Integrated IoT Architecture for Smart Metering. IEEE Commun. Mag. 2016, 54, 50–57. [Google Scholar] [CrossRef]
- Krishnamurthy, R.; Cecil, J.; Perera, D. IMECE2017-72293 an Internet of Things (iot) Based Frameworks for Colloborative Manufacturing. In Proceedings of the International Mechanical Engineering Congress & Exposition, Tampa, FL, USA, 3–9 November 2017. [Google Scholar]
- Ray, P.P. A survey on Internet of Things architectures. J. King Saud Univ. Comput. Inf. Sci. 2018, 30, 291–319. [Google Scholar] [CrossRef]
- Ferreira, H.G.C.; Dias Canedo, E.; De Sousa, R.T. IoT architecture to enable intercommunication through REST API and UPnP using IP, ZigBee and arduino. In Proceedings of the International Conference on Wireless and Mobile Computing, Networking and Communications, Lyon, France, 7–9 Octpber 2013. [Google Scholar] [CrossRef]
- Gazis, V.; Goertz, M.; Huber, M.; Leonardi, A.; Mathioudakis, K.; Wiesmaier, A.; Zeiger, F. Short paper: IoT: Challenges, projects, architectures. In Proceedings of the IEEE 2015 18th International Conference on Intelligence in Next, Generation Networks, Paris, France, 17–19 Febuary 2015; pp. 145–147. [Google Scholar]
- Firdous, F.; Mohd Umair, M.; Alikhan Siddiqui, D.; Mohd Umair, A. IoT Based Home Automation System over the Cloud. Int. J. Innov. Adv. Comput. Sci. (IJIACS) 2018, 7, 512–517. [Google Scholar]
- Nitti, M.; Pilloni, V.; Giusto, D.; Popescu, V. IoT Architecture for a sustainable tourism application in a smart city environment. Mob. Inf. Syst. 2017. [Google Scholar] [CrossRef]
- Contreras-Castillo, J.; Zeadally, S.; Guerrero Ibáñez, J.A. A seven-layered model architecture for Internet of Vehicles. J. Inf. Telecommun. 2017. [Google Scholar] [CrossRef]
- Rahimi, H.; Zibaeenejad, A.; Safavi, A.A. A Novel IoT Architecture Based on 5G-IoT and Next, Generation Technologies. In Proceedings of the 2018 IEEE 9th Annual Information Technology, Electronics and Mobile Communication Conference (IEMCON), Vancouver, BC, Canada, 1–3 November 2018. [Google Scholar]
- Dumitru, R.L. IoT Platforms: Analysis for Building Projects. Inf. Econ. 2017. [Google Scholar] [CrossRef]
- Zanakis, S.H.; Solomon, A.; Wishart, N.; Dublish, S. Multi-attribute decision-making: A simulation comparison of select methods. Eur. J. Oper. Res. 1998, 107, 507–529. [Google Scholar] [CrossRef]
- Henig, M.I.; Buchanan, J.T. Solving MCDM problems: Process concepts. J. Multi-Criteria Decis. Anal. 1996, 5, 3–21. [Google Scholar] [CrossRef]
- Whaiduzzaman, M.; Gani, A.; Anuar, N.B.; Shiraz, M.; Haque, M.N.; Haque, I.T. Cloud service selection using multicriteria decision analysis. Sci. World J. 2014, 2014, 459375. [Google Scholar] [CrossRef]
- Watrobski, J.; Jankowski, J.; Pawel, Z.; Karczmarczyk, A.; Ziolo, M. Generalised framework for multi-criteria method selection. Omega 2018, 86, 107–124. [Google Scholar] [CrossRef]
- Silva, E.M.; Jardim-Goncalves, R. Multi-criteria analysis and decision methodology for the selection of internet-of-things hardware platforms. In Doctoral Conference on Computing, Electrical and Industrial Systems; Springer: Cham, Switzerland, 2017; pp. 111–121. [Google Scholar]
- Soltani, S.; Martin, P.; Elgazzar, K. A hybrid approach to automatic IaaS service selection. J. Cloud Comput. 2018, 7, 12. [Google Scholar] [CrossRef]
- Kondratenko, Y.; Kondratenko, G.; Sidenko, I. Multi-criteria decision-making for selecting a rational IoT platform. In Proceedings of the 2018 IEEE 9th International Conference on Dependable Systems, Services and Technologies (DESSERT), Kiev, Ukraine, 24–27 May 2018; pp. 147–152. [Google Scholar]
- Uslu, B.; Eren, T.; Gür, S.; Özcan, E. Evaluation of the Difficulties in the Internet of Things (IoT) with Multi-Criteria Decision-Making. Processes 2019, 7, 164. [Google Scholar] [CrossRef]
- Singla, C.; Mahajan, N.; Kaushal, S.; Verma, A.; Sangaiah, A.K. Modelling and Analysis of Multi-objective Service Selection Scheme in IoT-Cloud Environment. In Cognitive Computing for Big Data Systems Over IoT; Springer: Berlin, Germany, 2018; pp. 63–77. [Google Scholar]
- Alelaiwi, A. Evaluating distributed IoT databases for edge/cloud platforms using the analytic hierarchy process. J. Parallel Distrib. Comput. 2019, 124, 41–46. [Google Scholar] [CrossRef]
- Silva, E.M.; Agostinho, C.; Jardim-Goncalves, R. A multi-criteria decision model for the selection of a more suitable Internet-of-Things device. In Proceedings of the IEEE 2017 International Conference on Engineering, Technology and Innovation (ICE/ITMC), Funchal, Portugal, 27–29 June 2017; pp. 1268–1276. [Google Scholar]
- Garg, S.K.; Versteeg, S.; Buyya, R. A framework for ranking of cloud computing services. Future Gener. Comput. Syst. 2013, 29, 1012–1023. [Google Scholar] [CrossRef]
- Guth, J.; Breitenbucher, U.; Falkenthal, M.; Leymann, F.; Reinfurt, L. Comparison of IoT platform architectures: A field study based on a reference architecture. In Proceedings of the 2016 Cloudification of the Internet of Things, CIoT 2016, Paris, France, 23–25 November 2016. [Google Scholar] [CrossRef]
- Mitkova, V.; Mlynarovič, V. Investment Opportunities Identification Based on Macroeconomic Development, the Multiple Criteria Decision Approach. Symmetry 2019, 11, 827. [Google Scholar] [CrossRef]
- Wątróbski, J.; Małecki, K.; Kijewska, K.; Iwan, S.; Karczmarczyk, A.; Thompson, R.G. Multi-criteria analysis of electric vans for city logistics. Sustainability 2017, 9, 1453. [Google Scholar] [CrossRef]
- Palevičius, V.; Podviezko, A.; Sivilevičius, H.; Prentkovskis, O. Decision-aiding evaluation of public infrastructure for electric vehicles in cities and resorts of Lithuania. Sustainability 2018, 10, 904. [Google Scholar] [CrossRef]
- Google Cloud Platform Breaks into Leader Category in Gartner’s Magic Quadrant. Available online: https://www.zdnet.com/article/google-cloud-platform-breaks-into-leader-category-in-gartners-magic-quadrant/ (accessed on 28 January 2020).
- Amazon and Microsoft Top Gartner’s IaaS Magic Quadrant. Available online: https://www.zdnet.com/article/amazon-and-microsoft-top-gartners-iaas-magic-quadrant/ (accessed on 28 January 2020).
- Saaty, T.L. Decision making with the analytic hierarchy process. Int. J. Serv. Sci. 2008, 1, 83–98. [Google Scholar] [CrossRef]
- Setiawan, A.; Sediyono, E.; Moekoe, D.A. Application of AHP method in determining priorities of conversion of unusedland to food land in Minahasa Tenggara. Int. J. Comput. Appl. 2014, 89, 8. [Google Scholar] [CrossRef]
- Vulević, T.; Dragović, N. Multi-criteria decision analysis for sub-watersheds ranking via the PROMETHEE method. Int. Soil Water Conserv. Res. 2017, 5, 50–55. [Google Scholar] [CrossRef]
- Brans, J.P.; De Smet, Y. PROMETHEE methods. In Multiple Criteria Decision Analysis; Springer: Berlin, Germany, 2016; pp. 187–219. [Google Scholar]


| Num. | Layers | References |
|---|---|---|
| 2 | Devices and Communication | [9] |
| 3 | Devices, Communication and Application | [10,11,12] |
| 4 | Devices, Communication, Transport and Application | [9,12,13,14,15,16] |
| 5 | Devices, Local processing, Communication, Transport and Applications | [12] |
| 7 | Business, Management, Communication, Processing, Acquisition, User interaction and Security | [15,17] |
| 8 | Physical devices, Communication, Edge or Fog processing, Data storage, Applications, Collaboration and process, Security | [18] |
| Year | Application | MCDA | Criteria | Ref. |
|---|---|---|---|---|
| 2019 | IoT Challenges | AHP, ANP | Communication, Technology, Privacy and security, Legal regulations, Culture | [27] |
| 2018 | Cloud service for IoT | FAHP, FTOPSIS | Availability, Privacy, Capacity, Speed, Cost | [28] |
| 2018 | Platform IoT | Fuzzy | Security, Device management, Integration level, Processing level, Database functionality, Data collection protocols, Visualization, Analytics variety | [26] |
| 2018 | IaaS | TOPSIS | Cost, Computing required, Storage capacity, Operating system | [25] |
| 2018 | Distributed IoT Databases | AHP | Usability, Prtability, Support | [29] |
| 2017 | IoT Device | AHP | Energy consumption, Implementation time, Difficulty of implementation, Cost, Clock device | [24] |
| 2017 | IoT Platform | AHP | Energy, Cost, Computing speed, Data memory, Program memory, device weight | [30] |
| 2013 | Ranking cloud services | AHP | Responsibility, Agility, Service assurance, Cost, Performance, Security and privacy, Usability | [31] |
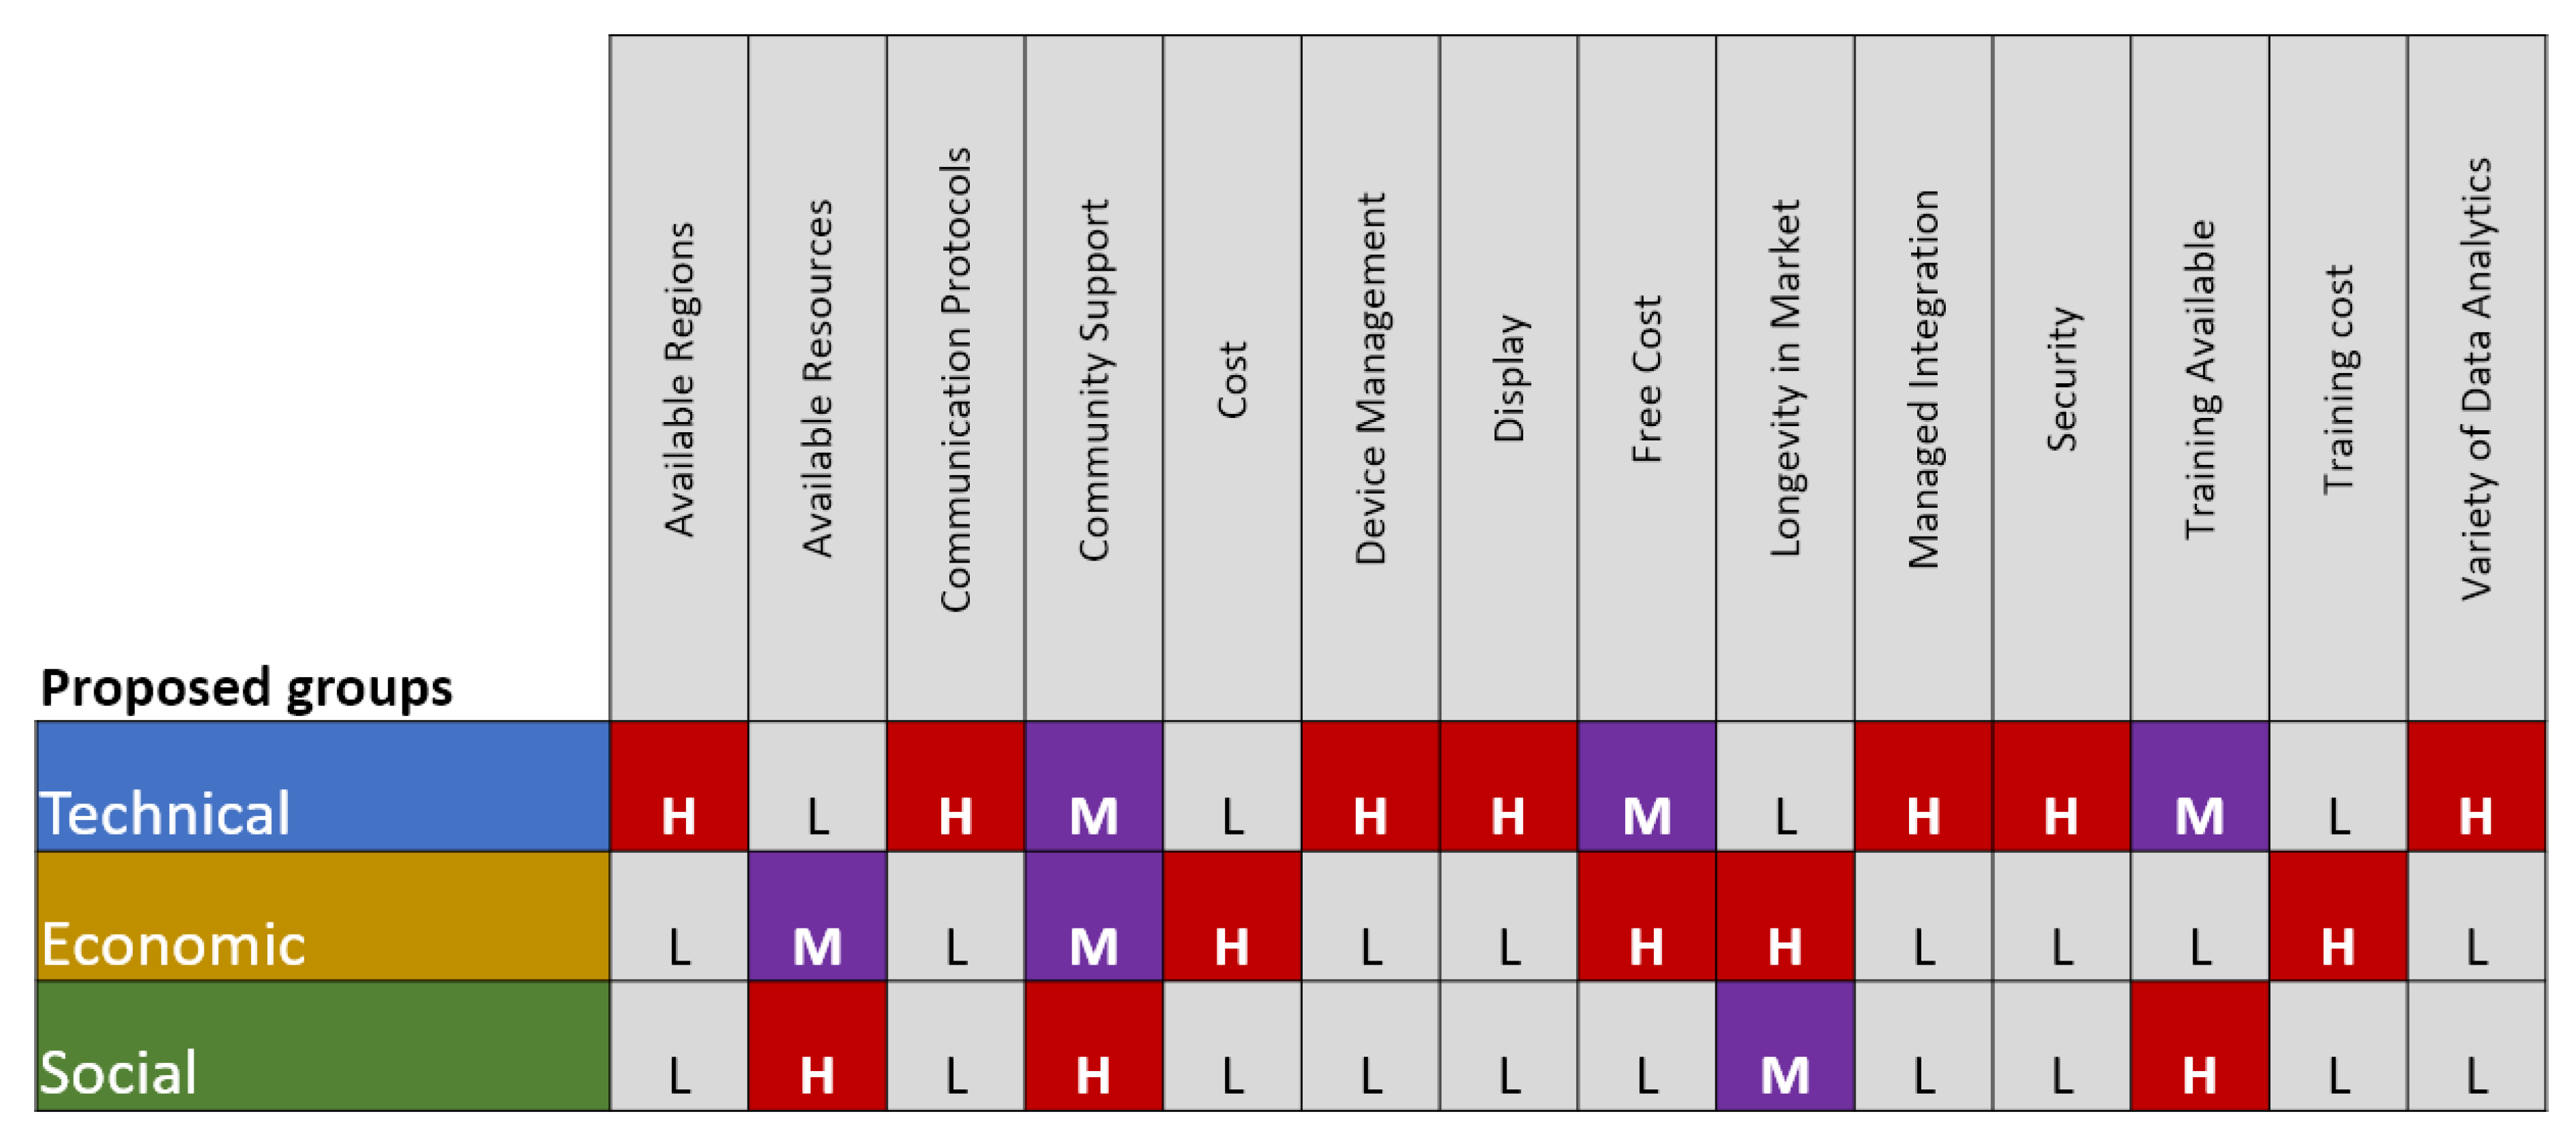
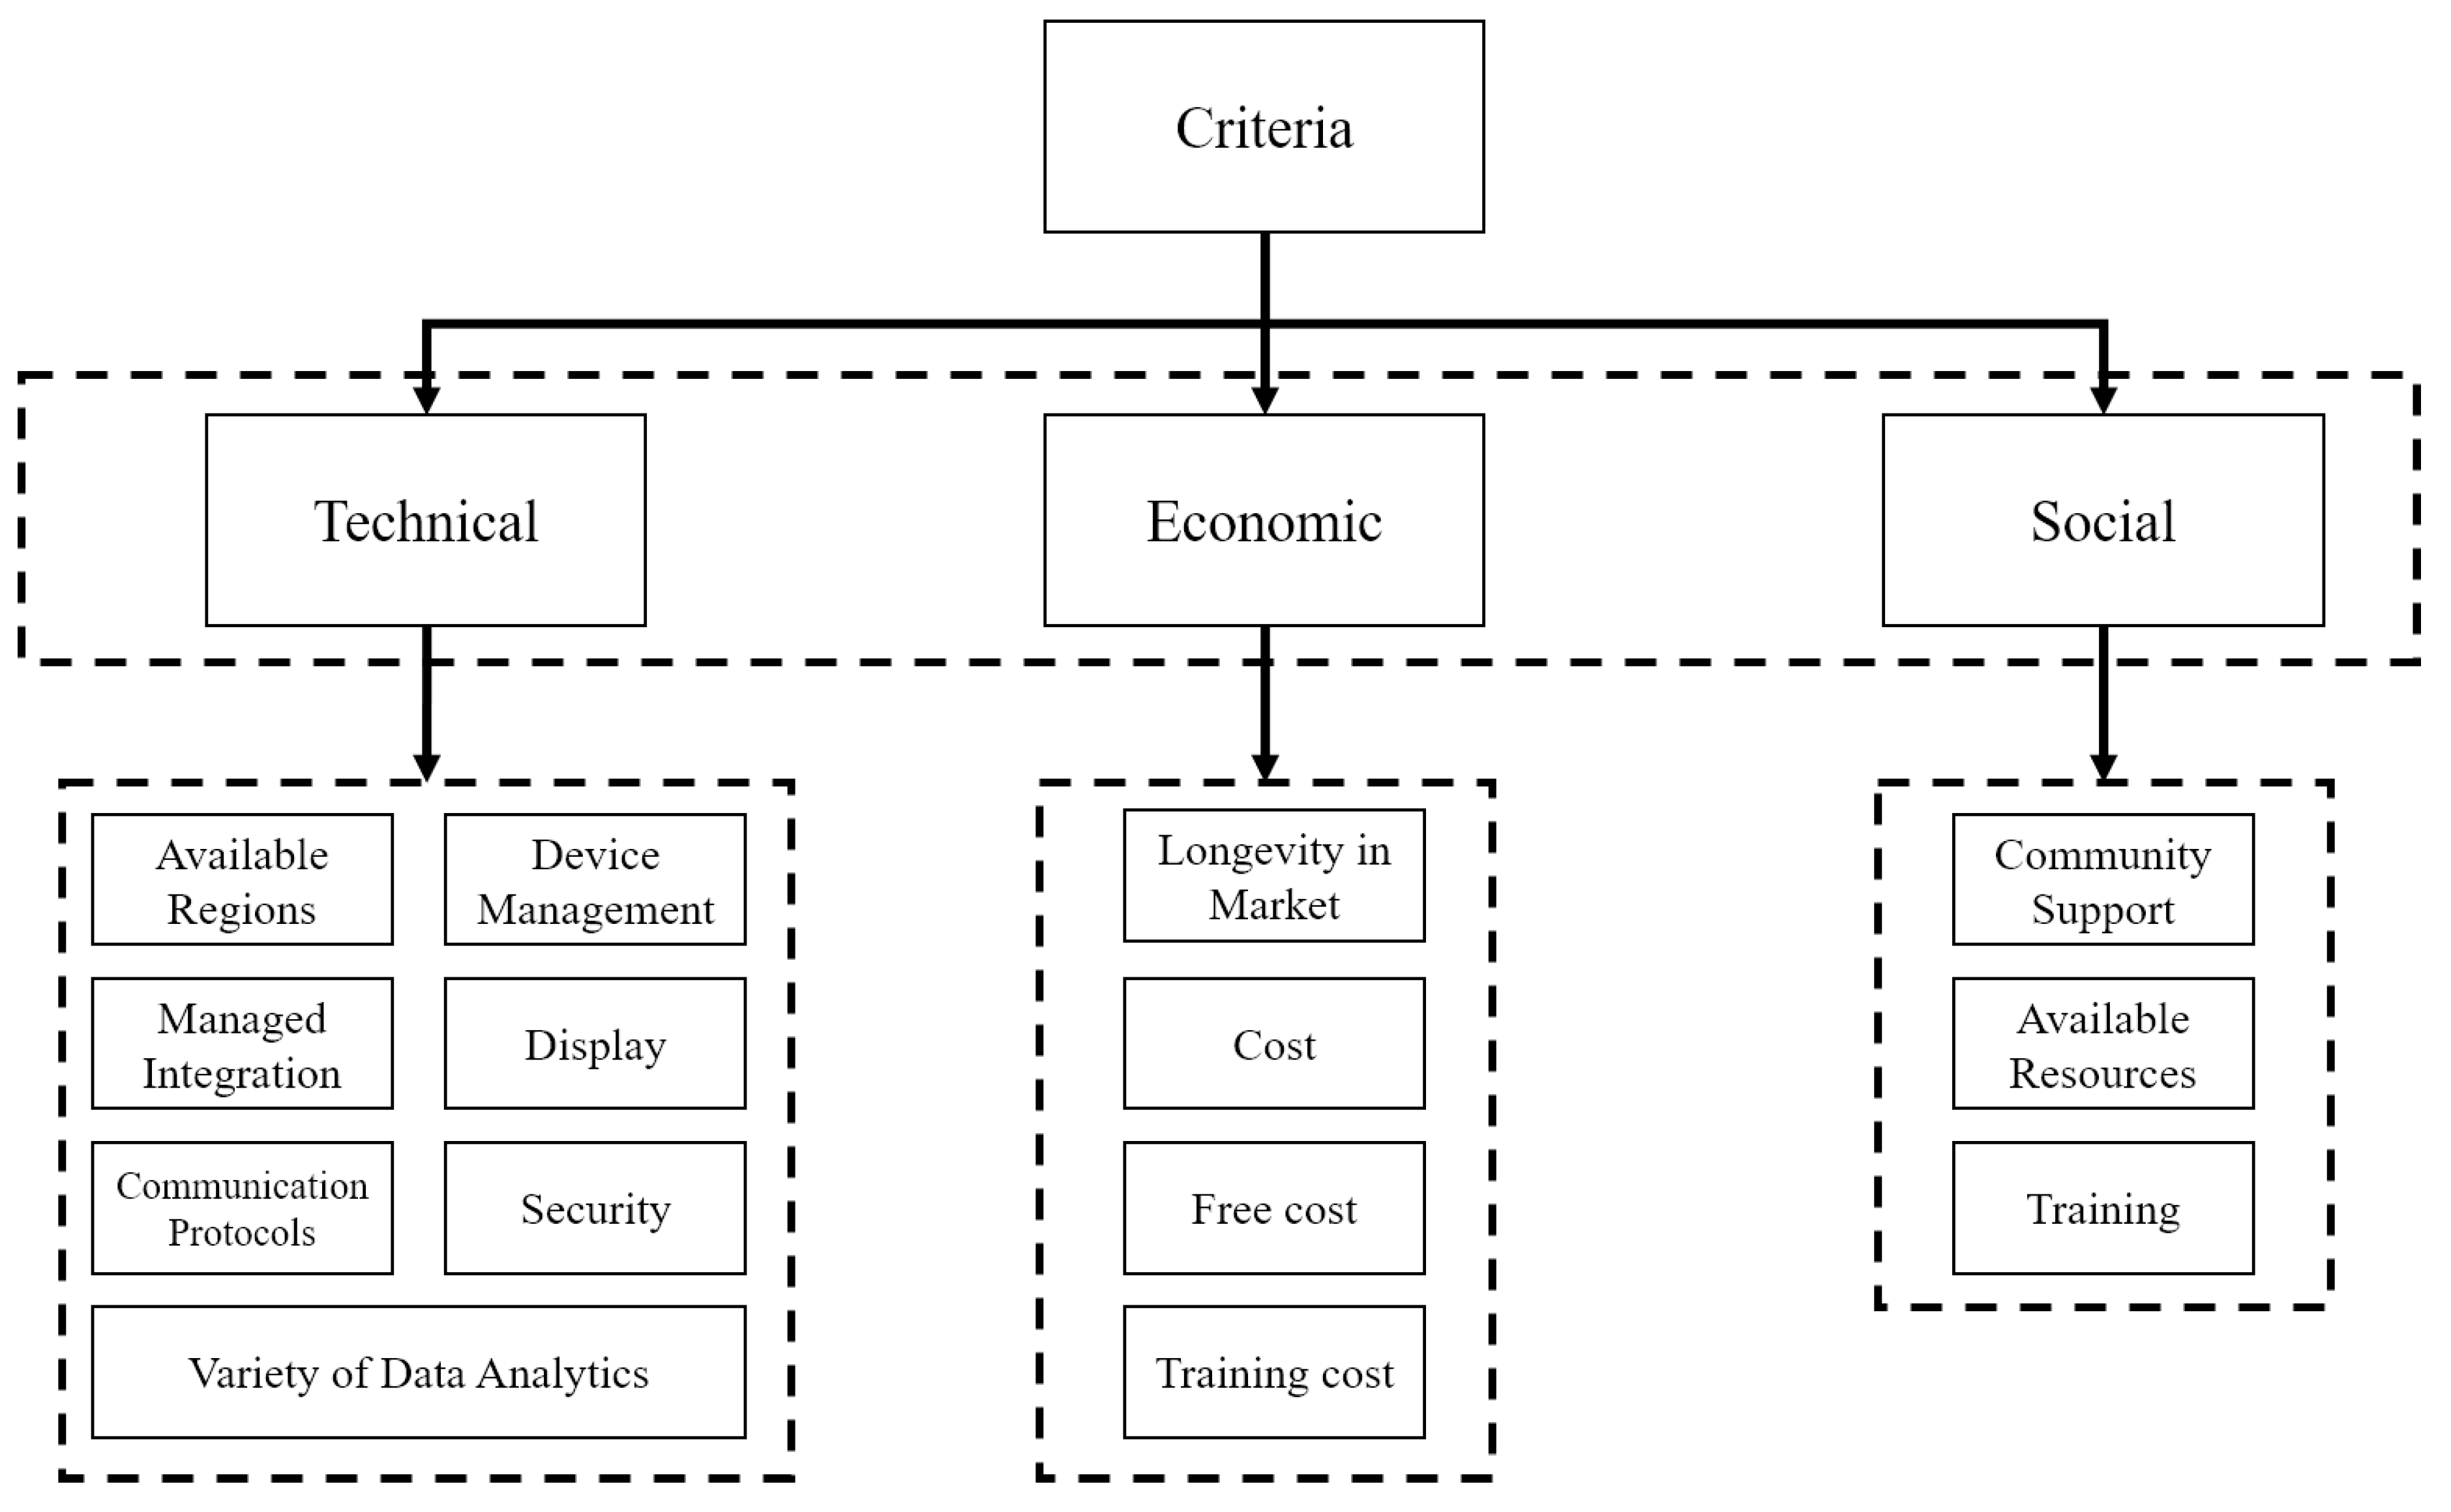
| Area | Criterion (Abbreviation) | Definition (Qualitative (Q) or Quantitative (C). All are maximization except when noted Minimization (min) ) | Type |
|---|---|---|---|
| Technical (T) | Available region (TAr) | In cloud-based solutions, it is important to identify the regions where the provider is present and that are suited to the geographical situation of the industry. | C |
| Managed Integration (TMi) | The platform has the ability to offer an integration engine with services and applications. | Q | |
| Communication Protocols (TCp) | IoT devices can communicate telemetry and receive messages with different protocols such as HTTP, MQTT, AMQP, CoAP, or even private. | C | |
| Security (TS) | The security of the platform must include security for the transmission, registration of devices, avoiding apocryphal devices, authentication and authorization, preferably from start to finish. | Q | |
| Device Management (TDm) | Devices that can be connected, device identification, device monitoring, send software updates to devices and specify alert conditions. The digital twin refers to the digital replica of the physical asset. | Q | |
| Display (TD) | It allows that the data and the behavior of the devices can be seen by humans. It is better if a native and customizable dashboard is offered to show the relevant data to each person. | Q | |
| Variety of Data Analytics (TAi) | The data collected must be analyzed in different ways. It is important to consider the data flow, real-time analysis, batch, and machine learning algorithms available on the platform. | Q | |
| Longevity in market (EM) | Years that the provider has in the market. It is expected that the reputation of a supplier will increase over the years. | Q | |
| Economic (E) | Cost (EC) | Calculate the monthly cost (30 days average) for the devices that will be connected. Use constant message size and the frequency of constant message sending. | C(Min) |
| Free Cost (EFc) | The providers offer a free amount of messages that are subtracted from the monthly consumption. | Q | |
| Training Cost (ETc) | Providers can offer access to training with cost or free, and staff certification plans. | C(Min) | |
| Community support (SCs) | Informative resources about the platform, including the available documentation of the provider and external resources of the expert community (blogs, tutorials, discussion forums, etc.) | Q | |
| Social (S) | Available Resources (SHr) | Availability of human resources with expert knowledge in the platform. | Q |
| Training (ST) | Providers offer training and certifications, which can be complicated to follow and hinder the learning curve. One measure may be the estimated time to complete the courses and certifications. | C |
| Alternative | Criterion | Criterion | … | Criterion |
|---|---|---|---|---|
| AWS () | ||||
| Azure () | ||||
| GCP () |
| Role | Description | Interest |
|---|---|---|
| CIO | Chief Information Officer In terms usually is, it is the most important person responsible for technology in any company. Their tasks range from buying IT equipment to directing the workforce to the use of technology. | T, E, S |
| CTO | Chief Technology Officer The technology director reports to the CIO, which means that it acts as support for IIoT projects. That said, in larger organizations, the work may be too much for just one person, so the CTO has this responsibility. | T |
| CInO | Chief Innovation Officer This role has been recently created and is the one that can counteract the wild instinct oriented to sales of the business units of a company and design an organizational environment more favorable to innovation. | T, S |
| CSO | Chief Security Officer He is the main person responsible for the information security program of an organization and should be consulted before any deployment of technology. | T |
| COO | Chief Operations Officer Oversees the business operations of an organization and work to create an operations strategy and communicate it to employees. He is very involved in the day to day of the company and will be one of the main impacted in an IIoT project. | E |
| CMO | Chief Marketing Officer The technology and the business aspects of the company are converging. This convergence of technology and marketing reflects the need for the traditional Commercial Director to adapt to a digital world and, therefore, participates in any IIoT project in which they are working, to express their opinion so as to obtain commercial benefit for the company. | E |
| CFO | Chief Financial Officer In all the projects of the company, there must be the support of the Finance Director, who controls the economic resources of the company. In an IIoT project, he is interested in the investment required, and especially in the return of investment to exercise. | E |
| HRO | Human Resources Officer It is the person who needs to know if the necessary skills to the project exist in the market, how easy it is to obtain them, and the sources where they can be obtained. Among his responsibilities are the personnel development plans and the recruitment of human resources. | S |
| BUL | Business Unit Leaders The deputy directors and managers who report within each hierarchy are key personnel that can provide good opinions and issue a more tactical than strategic judgement. By being more focused on specific projects, their knowledge and sensitivity also become specific, giving value to expert judgements. | T, E, S |
| Intensity of Importance | Definition | Explanation |
|---|---|---|
| 1 | Equal importance | Two elements contribute equally to the objective |
| 3 | Moderate importance | Experience and judgement slightly favor one element over another |
| 5 | Strong importance | Experience and judgement strongly favor one element over another |
| 7 | Very strong importance | One element is favored very strongly over another, its dominance is demonstrated in practice |
| 9 | Extreme importance | The evidence favoring one activity over another is of the highest possible order of affirmation |
| 2, 4, 6, 8 | Intermediate values | Importance between above and below value |
| N | Random Index (RI) |
|---|---|
| 1 | 0.00 |
| 2 | 0.00 |
| 3 | 0.58 |
| 4 | 0.90 |
| 5 | 1.12 |
| 6 | 1.24 |
| 7 | 1.32 |
| 8 | 1.41 |
| 9 | 1.45 |
| 10 | 1.49 |
| 11 | 1.51 |
| 12 | 1.48 |
| 13 | 1.56 |
| 14 | 1.57 |
| 15 | 1.59 |
| Perception | Value |
|---|---|
| Excellent | 5 |
| Good | 4 |
| Average | 3 |
| Below Average | 2 |
| Low | 1 |
| TAr | TMi | TCp | TS | TDm | D | TAi | EM | EC | EFc | ETc | SCs | SHr | ST | |
|---|---|---|---|---|---|---|---|---|---|---|---|---|---|---|
| TAr | 1 | 1/2 | 1/5 | 1/2 | 1/5 | 1/2 | 2 | 1/2 | 1 | 1/2 | 1/2 | 1/2 | 1/2 | |
| TMi | 2 | 1 | 1 | 1 | 1 | 1 | 1 | 5 | 1 | 3 | 3 | 5 | 1 | 3 |
| TCp | 2 | 1 | 1 | 1 | 3 | 1 | 1 | 5 | 1 | 3 | 5 | 5 | 3 | 5 |
| TS | 5 | 1 | 1 | 1 | 1 | 5 | 5 | 2 | 1 | 5 | 3 | 5 | 5 | 5 |
| TDm | 2 | 1 | 1/3 | 1 | 1 | 3 | 3 | 3 | 1 | 3 | 3 | 2 | 1 | 1 |
| D | 5 | 1 | 1 | 1/5 | 1/3 | 1 | 1 | 3 | 1 | 3 | 4 | 3 | 2 | 3 |
| TAi | 2 | 1 | 1 | 1/5 | 1/3 | 1 | 1 | 3 | 1 | 2 | 1 | 2 | 1 | 2 |
| EM | 1/2 | 1/5 | 1/5 | 1/2 | 1/3 | 1/3 | 1/3 | 1 | 1/2 | 1 | 1/3 | 1/3 | 1/3 | 1/3 |
| EC | 2 | 1 | 1 | 1 | 1 | 1 | 1 | 2 | 1 | 1 | 2 | 2 | 2 | 3 |
| EFc | 1 | 1/3 | 1/3 | 1/5 | 1/3 | 1/3 | 1/2 | 1 | 1 | 1 | 1/2 | 1/3 | 1/2 | 1/3 |
| ETc | 2 | 1/3 | 1/5 | 1/3 | 1/3 | 1/55 | 1 | 3 | 1/2 | 2 | 1 | 1 | 1/2 | 1 |
| SCs | 2 | 1/5 | 1/5 | 1/5 | 1/2 | 1/3 | 1/2 | 3 | 1/2 | 3 | 1 | 1 | 1 | 1 |
| SHr | 2 | 1 | 1/3 | 1/5 | 1 | 1/2 | 1 | 3 | 1/2 | 2 | 2 | 1 | 1 | 1 |
| ST | 2 | 1/3 | 1/5 | 1/5 | 1 | 1/3 | 1/2 | 3 | 1/3 | 3 | 1 | 1 | 1 | 1 |
| 30.5 | 9.9 | 8.3 | 7.23 | 11.67 | 15.283 | 17.33 | 39 | 10.83 | 33 | 27.33 | 29.167 | 19.83 | 27.167 |
| TAr | TMi | TCp | TS | TDm | TD | TAi | EM | EC | EFc | ETc | SCs | SHr | ST | |
|---|---|---|---|---|---|---|---|---|---|---|---|---|---|---|
| TAr | 0.033 | 0.051 | 0.060 | 0.028 | 0.043 | 0.013 | 0.029 | 0.051 | 0.046 | 0.030 | 0.018 | 0.017 | 0.025 | 0.018 |
| TMi | 0.066 | 0.101 | 0.120 | 0.138 | 0.086 | 0.065 | 0.058 | 0.128 | 0.092 | 0.091 | 0.110 | 0.171 | 0.050 | 0.110 |
| TCp | 0.066 | 0.101 | 0.120 | 0.138 | 0.257 | 0.065 | 0.058 | 0.128 | 0.092 | 0.091 | 0.183 | 0.171 | 0.151 | 0.184 |
| TS | 0.164 | 0.101 | 0.120 | 0.138 | 0.086 | 0.327 | 0.288 | 0.051 | 0.092 | 0.152 | 0.110 | 0.171 | 0.252 | 0.184 |
| TDm | 0.066 | 0.101 | 0.040 | 0.138 | 0.086 | 0.196 | 0.173 | 0.077 | 0.092 | 0.091 | 0.110 | 0.069 | 0.050 | 0.037 |
| TD | 0.164 | 0.101 | 0.120 | 0.028 | 0.029 | 0.065 | 0.058 | 0.077 | 0.092 | 0.091 | 0.146 | 0.103 | 0.101 | 0.110 |
| TAi | 0.066 | 0.101 | 0.120 | 0.028 | 0.029 | 0.065 | 0.058 | 0.077 | 0.092 | 0.061 | 0.037 | 0.069 | 0.050 | 0.074 |
| EM | 0.016 | 0.020 | 0.024 | 0.069 | 0.029 | 0.022 | 0.019 | 0.026 | 0.046 | 0.030 | 0.012 | 0.011 | 0.017 | 0.012 |
| EC | 0.066 | 0.101 | 0.120 | 0.138 | 0.086 | 0.065 | 0.058 | 0.051 | 0.092 | 0.030 | 0.073 | 0.069 | 0.101 | 0.110 |
| EFc | 0.033 | 0.034 | 0.040 | 0.028 | 0.029 | 0.022 | 0.029 | 0.026 | 0.092 | 0.030 | 0.018 | 0.011 | 0.025 | 0.012 |
| ETc | 0.066 | 0.034 | 0.024 | 0.046 | 0.029 | 0.016 | 0.058 | 0.077 | 0.046 | 0.061 | 0.037 | 0.034 | 0.025 | 0.037 |
| SCs | 0.066 | 0.020 | 0.024 | 0.028 | 0.043 | 0.022 | 0.029 | 0.077 | 0.046 | 0.091 | 0.037 | 0.034 | 0.050 | 0.037 |
| SHr | 0.066 | 0.101 | 0.040 | 0.028 | 0.086 | 0.033 | 0.058 | 0.077 | 0.046 | 0.061 | 0.073 | 0.034 | 0.050 | 0.037 |
| ST | 0.066 | 0.034 | 0.024 | 0.028 | 0.086 | 0.022 | 0.029 | 0.077 | 0.031 | 0.091 | 0.037 | 0.034 | 0.050 | 0.037 |
| Criterion | Weight Calculated |
|---|---|
| TAr | 0.033054398 |
| TMi | 0.099114871 |
| TCp | 0.129047676 |
| TS | 0.159817455 |
| TDm | 0.094698157 |
| TD | 0.091812783 |
| TAi | 0.066103106 |
| EM | 0.025301927 |
| EC | 0.082932622 |
| EFc | 0.030639156 |
| ETc | 0.042044181 |
| SCs | 0.043080184 |
| SHr | 0.056348976 |
| ST | 0.046004508 |
| TAr | TMi | TCp | TS | TDm | TD | TAi | EM | EC | EFc | ETc | SCs | SHr | ST | |
|---|---|---|---|---|---|---|---|---|---|---|---|---|---|---|
| TAr | 0.033 | 0.050 | 0.065 | 0.032 | 0.047 | 0.018 | 0.033 | 0.051 | 0.041 | 0.031 | 0.021 | 0.022 | 0.028 | 0.023 |
| TMi | 0.066 | 0.099 | 0.129 | 0.160 | 0.095 | 0.092 | 0.066 | 0.127 | 0.083 | 0.092 | 0.126 | 0.215 | 0.056 | 0.138 |
| TCp | 0.066 | 0.099 | 0.129 | 0.160 | 0.284 | 0.092 | 0.066 | 0.127 | 0.083 | 0.092 | 0.210 | 0.215 | 0.169 | 0.230 |
| TS | 0.165 | 0.099 | 0.129 | 0.160 | 0.095 | 0.459 | 0.331 | 0.051 | 0.083 | 0.153 | 0.126 | 0.215 | 0.282 | 0.230 |
| TDm | 0.066 | 0.099 | 0.043 | 0.160 | 0.095 | 0.275 | 0.198 | 0.076 | 0.083 | 0.092 | 0.126 | 0.086 | 0.056 | 0.046 |
| TD | 0.165 | 0.099 | 0.129 | 0.032 | 0.032 | 0.092 | 0.066 | 0.076 | 0.083 | 0.092 | 0.168 | 0.129 | 0.113 | 0.138 |
| TAi | 0.066 | 0.099 | 0.129 | 0.032 | 0.032 | 0.092 | 0.066 | 0.076 | 0.083 | 0.061 | 0.042 | 0.086 | 0.056 | 0.092 |
| EM | 0.017 | 0.020 | 0.026 | 0.080 | 0.032 | 0.031 | 0.022 | 0.025 | 0.041 | 0.031 | 0.014 | 0.014 | 0.019 | 0.015 |
| EC | 0.066 | 0.099 | 0.129 | 0.160 | 0.095 | 0.092 | 0.066 | 0.051 | 0.083 | 0.031 | 0.084 | 0.086 | 0.113 | 0.138 |
| EFc | 0.033 | 0.033 | 0.043 | 0.032 | 0.032 | 0.031 | 0.033 | 0.025 | 0.083 | 0.031 | 0.021 | 0.014 | 0.028 | 0.015 |
| ETc | 0.066 | 0.033 | 0.026 | 0.053 | 0.032 | 0.023 | 0.066 | 0.076 | 0.041 | 0.061 | 0.042 | 0.043 | 0.028 | 0.046 |
| SCs | 0.066 | 0.020 | 0.026 | 0.032 | 0.047 | 0.031 | 0.033 | 0.076 | 0.041 | 0.092 | 0.042 | 0.043 | 0.056 | 0.046 |
| SHr | 0.066 | 0.099 | 0.043 | 0.032 | 0.095 | 0.046 | 0.066 | 0.076 | 0.041 | 0.061 | 0.084 | 0.043 | 0.056 | 0.046 |
| ST | 0.066 | 0.033 | 0.026 | 0.032 | 0.095 | 0.031 | 0.033 | 0.076 | 0.028 | 0.092 | 0.042 | 0.043 | 0.056 | 0.046 |
| Criterion | Weight Value ∑ (WVS) | Ratio |
|---|---|---|
| TAr | 0.494310596 | 14.95445755 |
| TMi | 1.543958531 | 15.57746603 |
| TCp | 2.022150174 | 15.66979151 |
| TS | 2.577562734 | 16.12816779 |
| TDm | 1.501905104 | 15.85991904 |
| TD | 1.413764592 | 15.39834154 |
| TAi | 1.012396031 | 15.31540793 |
| EM | 0.386173129 | 15.26259755 |
| EC | 1.291838682 | 15.57696654 |
| EFc | 0.454059119 | 14.81956987 |
| ETc | 0.636805226 | 15.14609676 |
| SCs | 0.651477099 | 15.12243086 |
| SHr | 0.855083138 | 15.17477683 |
| ST | 0.69821939 | 15.17719502 |
| = 15.37023 |
| Qualitative Label | Pre-Defined Value |
|---|---|
| Low | 1 |
| Below Avg | 2 |
| Average | 3 |
| Good | 4 |
| Excellent | 5 |
| AWS | Azure | GCP |
|---|---|---|
| $ 3.46 Connectivity $86.40 of messaging $36.00 device shadow $ 4.32 rules triggered $ 8.64 rules actions | 2880 meessages/device 2,880,000 msg/day S1 node provides 400,00 msg/day unlimited access Need 8 X S1 nodes | 675,000 MB/month $0.0045/MB |
| Total Cost: $138.32 | Total Cost: $180.00 | Total Cost: $3,037.50 |
| TAr | TMi | TCp | TS | TDm | TD | TAi | EM | EC | EFc | ETc | SCs | SHr | ST | |
|---|---|---|---|---|---|---|---|---|---|---|---|---|---|---|
| AWS | 22 | 4 | 3 | 5 | 3 | 4 | 5 | 5 | 138.82 | 3 | 150 | 4 | 5 | 4 |
| Azure | 55 | 5 | 4 | 4 | 4 | 5 | 5 | 4 | 182.53 | 5 | 165 | 5 | 5 | 3 |
| GCP | 21 | 3 | 3 | 3 | 3 | 5 | 4 | 3 | 3037.5 | 4 | 200 | 3 | 3 | 3 |
| 55 | 5 | 4 | 5 | 4 | 5 | 5 | 5 | 3037.5 | 5 | 200 | 5 | 5 | 4 | |
| 21 | 3 | 3 | 3 | 3 | 4 | 4 | 3 | 138.82 | 3 | 150 | 3 | 3 | 3 |
| TAr | TMi | TCp | TS | TDm | TD | TAi | EM | EC | EFc | ETc | SCs | SHr | ST | |
|---|---|---|---|---|---|---|---|---|---|---|---|---|---|---|
| 0.029 | 0.5 | 0 | 1 | 0 | 0 | 1 | 1 | 1 | 0 | 1 | 0.5 | 1 | 1 | |
| 1 | 1 | 1 | 0.5 | 1 | 1 | 1 | 0.5 | 0.985 | 1 | 0.7 | 1 | 1 | 0 | |
| 0 | 0 | 0 | 0 | 0 | 1 | 0 | 0 | 0 | 0.5 | 0 | 0 | 0 | 0 |
| TAr | TMi | TCp | TS | TDm | TD | TAi | EM | EC | EFc | ETc | SCs | SHr | ST | |
|---|---|---|---|---|---|---|---|---|---|---|---|---|---|---|
| −0.971 | −0.5 | −1 | 0.5 | −1 | −1 | 0 | 0.5 | 0.015 | −1 | 0.3 | −0.5 | 0 | 1 | |
| 0.029 | 0.5 | 0 | 1 | 0 | −1 | 1 | 1 | 1 | −0.5 | 1 | 0.5 | 1 | 1 | |
| 0.971 | 0.5 | 1 | −0.5 | 1 | 1 | 0 | −0.5 | −0.015 | 1 | −0.3 | 0.5 | 0 | −1 | |
| 1 | 1 | 1 | 0.5 | 1 | 0 | 1 | 0.5 | 0.985 | 0.5 | 0.7 | 1 | 1 | 0 | |
| −0.029 | −0.5 | 0 | −1 | 0 | 1 | −1 | −1 | −1 | 0.5 | −1 | −0.5 | −1 | −1 | |
| −1 | −1 | −1 | −0.5 | −1 | 0 | −1 | −0.5 | −0.985 | −0.5 | −0.7 | −1 | −1 | 0 |
| TAr | TMi | TCp | TS | TDm | TD | TAi | EM | EC | EFc | ETc | SCs | SHr | ST | |
|---|---|---|---|---|---|---|---|---|---|---|---|---|---|---|
| 0 | 0 | 0 | 0.5 | 0 | 0 | 0 | 0.5 | 0.0151 | 0 | 0.3 | 0 | 0 | 1 | |
| 0.023 | 0.5 | 0 | 1 | 0 | 0 | 1 | 1 | 1 | 0 | 1 | 0.5 | 1 | 1 | |
| 0.971 | 0.5 | 1 | 0 | 1 | 1 | 0 | 0 | 0 | 1 | 0 | 0.5 | 0 | 0 | |
| 1 | 1 | 1 | 0.5 | 1 | 0 | 1 | 0.5 | 0.985 | 0.5 | 0.7 | 1 | 1 | 0 | |
| 0 | 0 | 0 | 0 | 0 | 1 | 0 | 0 | 0 | 0.5 | 0 | 0 | 0 | 0 | |
| 0 | 0 | 0 | 0 | 0 | 0 | 0 | 0 | 0 | 0 | 0 | 0 | 0 | 0 |
| TAr | TMi | TCp | TS | TDm | TD | TAi | EM | EC | EFc | ETc | SCs | SHr | ST | |
|---|---|---|---|---|---|---|---|---|---|---|---|---|---|---|
| 0.033 | 0.099 | 0.129 | 0.160 | 0.095 | 0.092 | 0.066 | 0.025 | 0.083 | 0.031 | 0.042 | 0.043 | 0.056 | 0.046 | |
| 0.000 | 0.000 | 0.000 | 0.080 | 0.000 | 0.000 | 0.000 | 0.013 | 0.001 | 0.000 | 0.013 | 0.000 | 0.000 | 0.046 | |
| 0.001 | 0.050 | 0.000 | 0.160 | 0.000 | 0.000 | 0.066 | 0.025 | 0.083 | 0.000 | 0.042 | 0.022 | 0.056 | 0.046 | |
| 0.032 | 0.050 | 0.129 | 0.000 | 0.095 | 0.092 | 0.000 | 0.000 | 0.000 | 0.031 | 0.000 | 0.022 | 0.000 | 0.000 | |
| 0.033 | 0.099 | 0.129 | 0.080 | 0.095 | 0.000 | 0.066 | 0.013 | 0.082 | 0.015 | 0.029 | 0.043 | 0.056 | 0.000 | |
| 0.000 | 0.000 | 0.000 | 0.000 | 0.000 | 0.092 | 0.000 | 0.000 | 0.000 | 0.015 | 0.000 | 0.000 | 0.000 | 0.000 | |
| 0.000 | 0.000 | 0.000 | 0.000 | 0.000 | 0.000 | 0.000 | 0.000 | 0.000 | 0.000 | 0.000 | 0.000 | 0.000 | 0.000 |
| 0.152428017 | |
| 0.55062249 | |
| 0.44937751 | |
| 0.740439621 | |
| 0.107132361 | |
| 0 |
| AWS | Azure | GCP | ||
|---|---|---|---|---|
| AWS | 0.152428017 | 0.55062249 | 0.351525254 | |
| Azure | 0.44937751 | 0.740439621 | 0.594908565 | |
| GCP | 0.107132361 | 0 | 0.053566181 | |
| 0.278254935 | 0.076214009 | 0.645531056 |
| Leaving flow | Entering flow | Net Flow | Rank | |
|---|---|---|---|---|
| AWS | 0.351525254 | 0.278254935 | 0.073270318 | 2 |
| Azure | 0.594908565 | 0.076214009 | 0.518694557 | 1 |
| GCP | 0.053566181 | 0.645531056 | −0.591964875 | 3 |
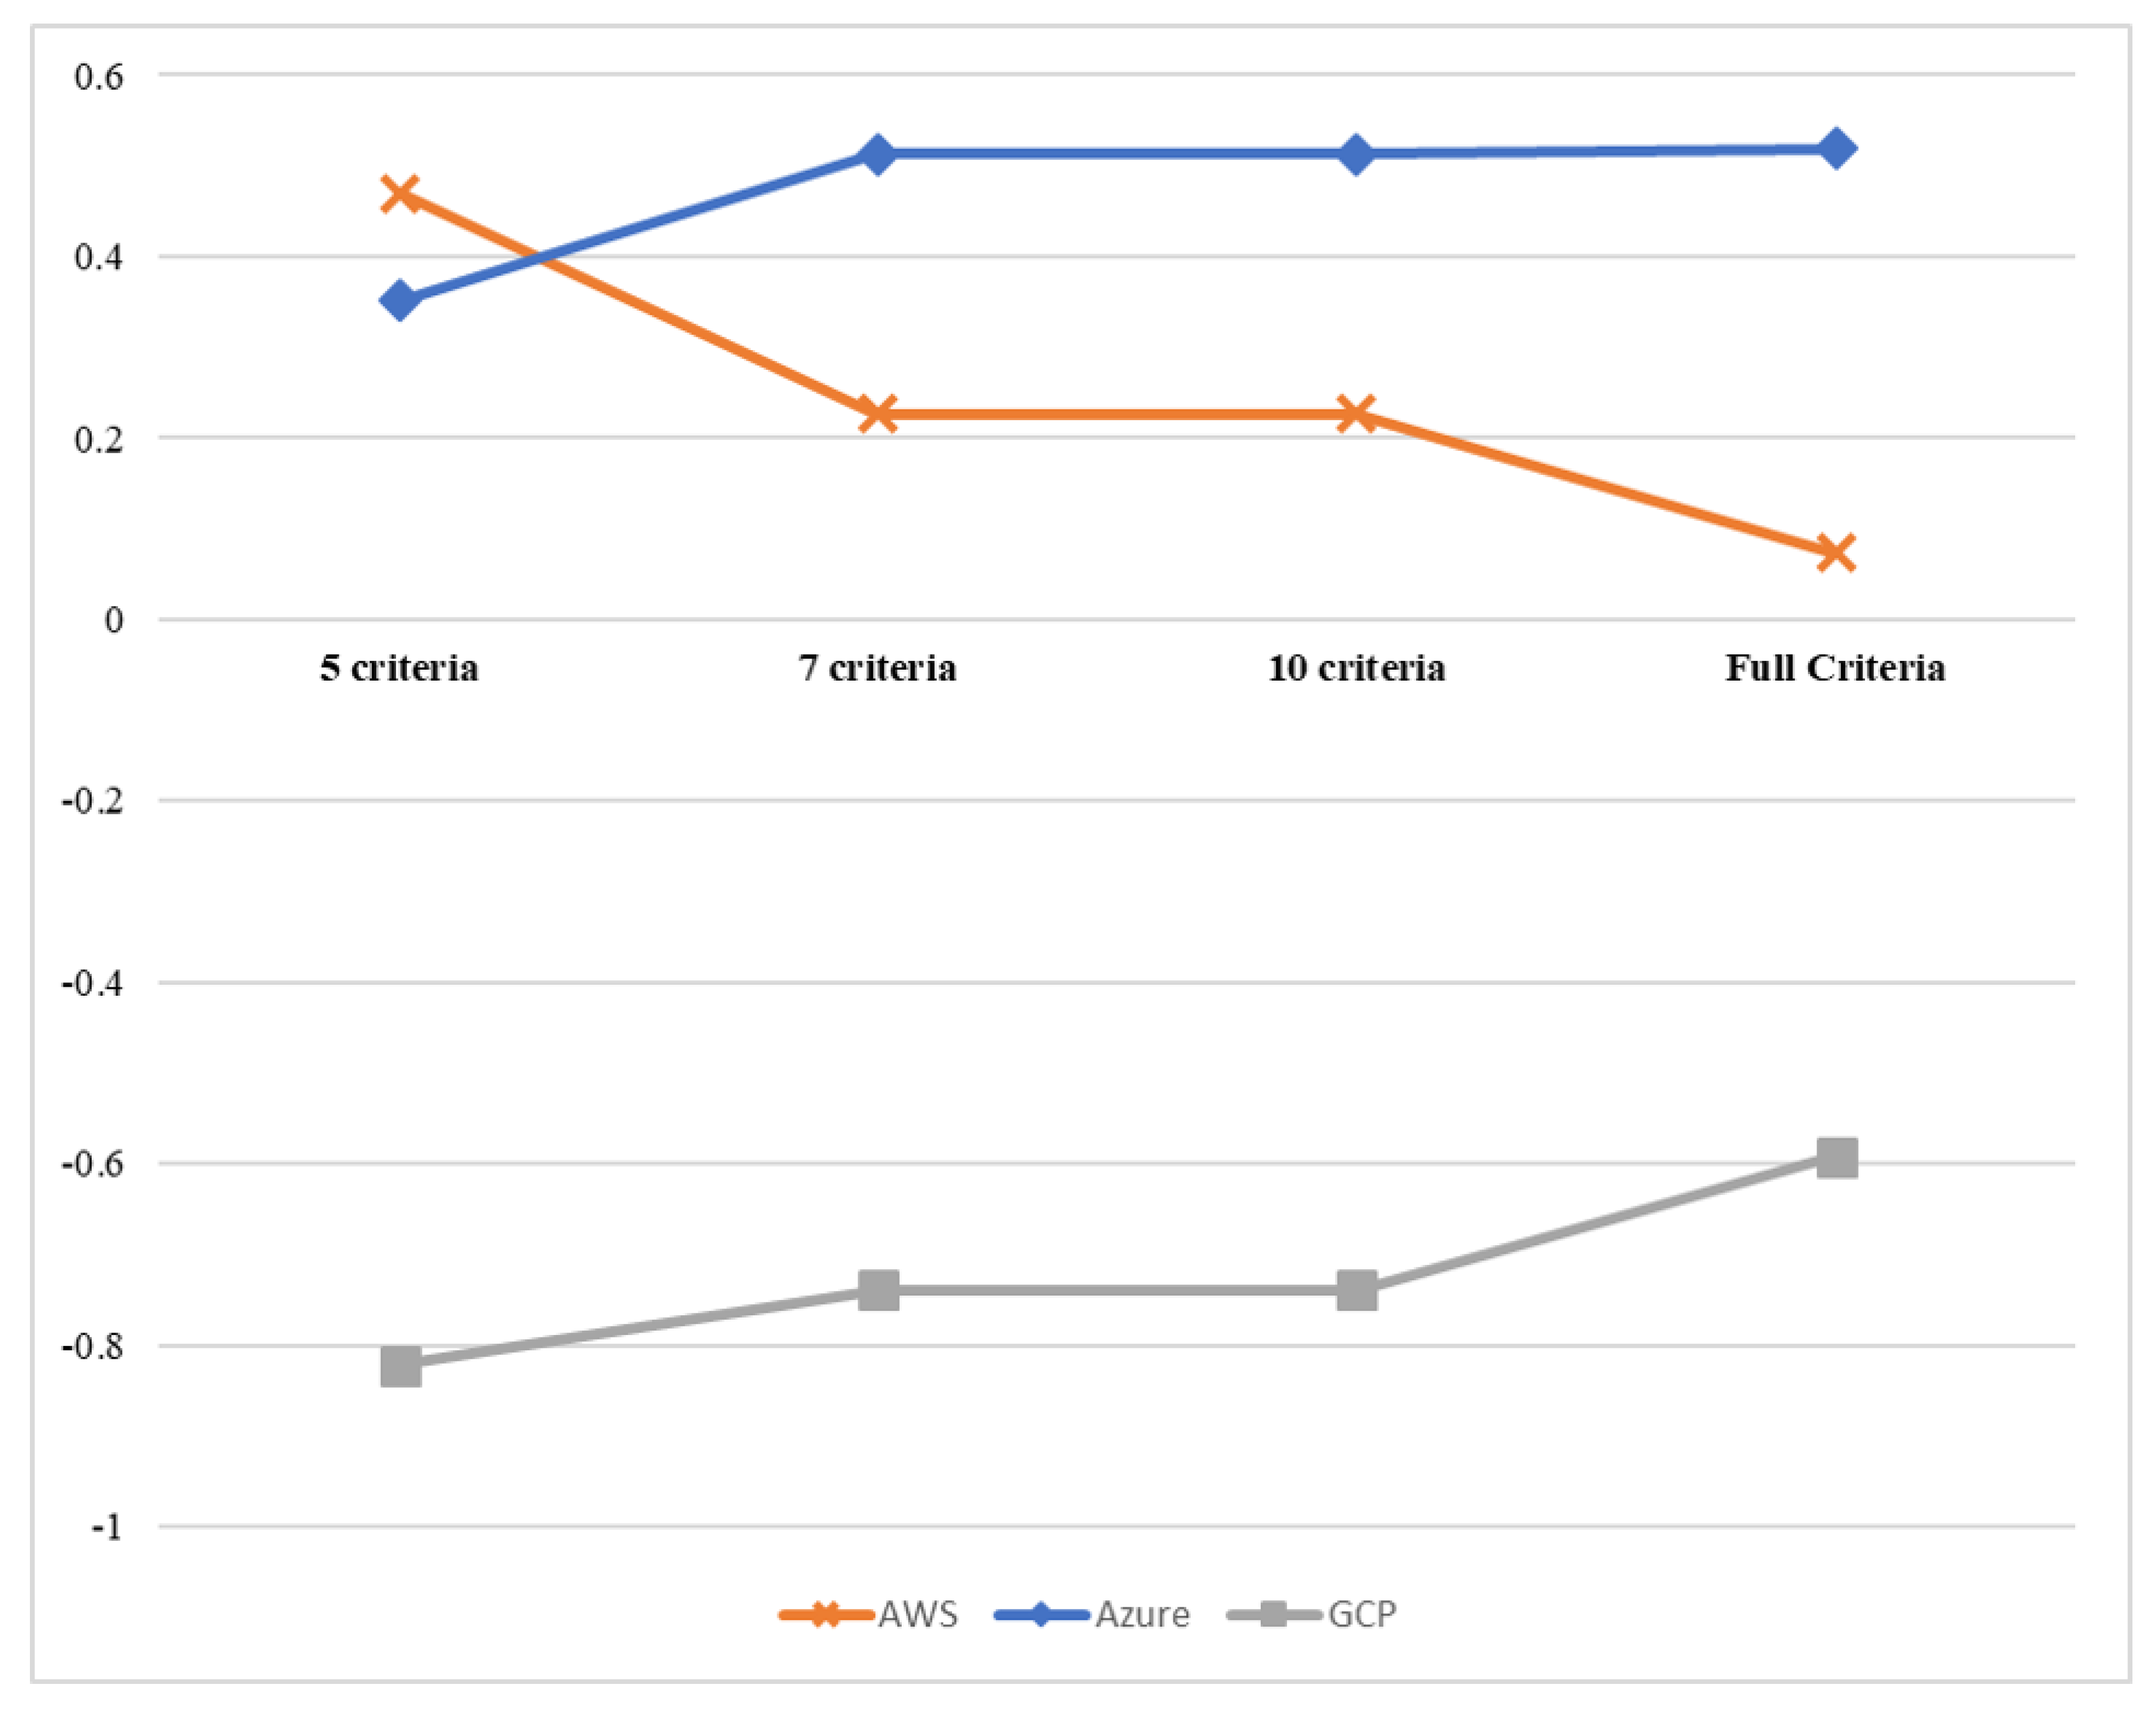
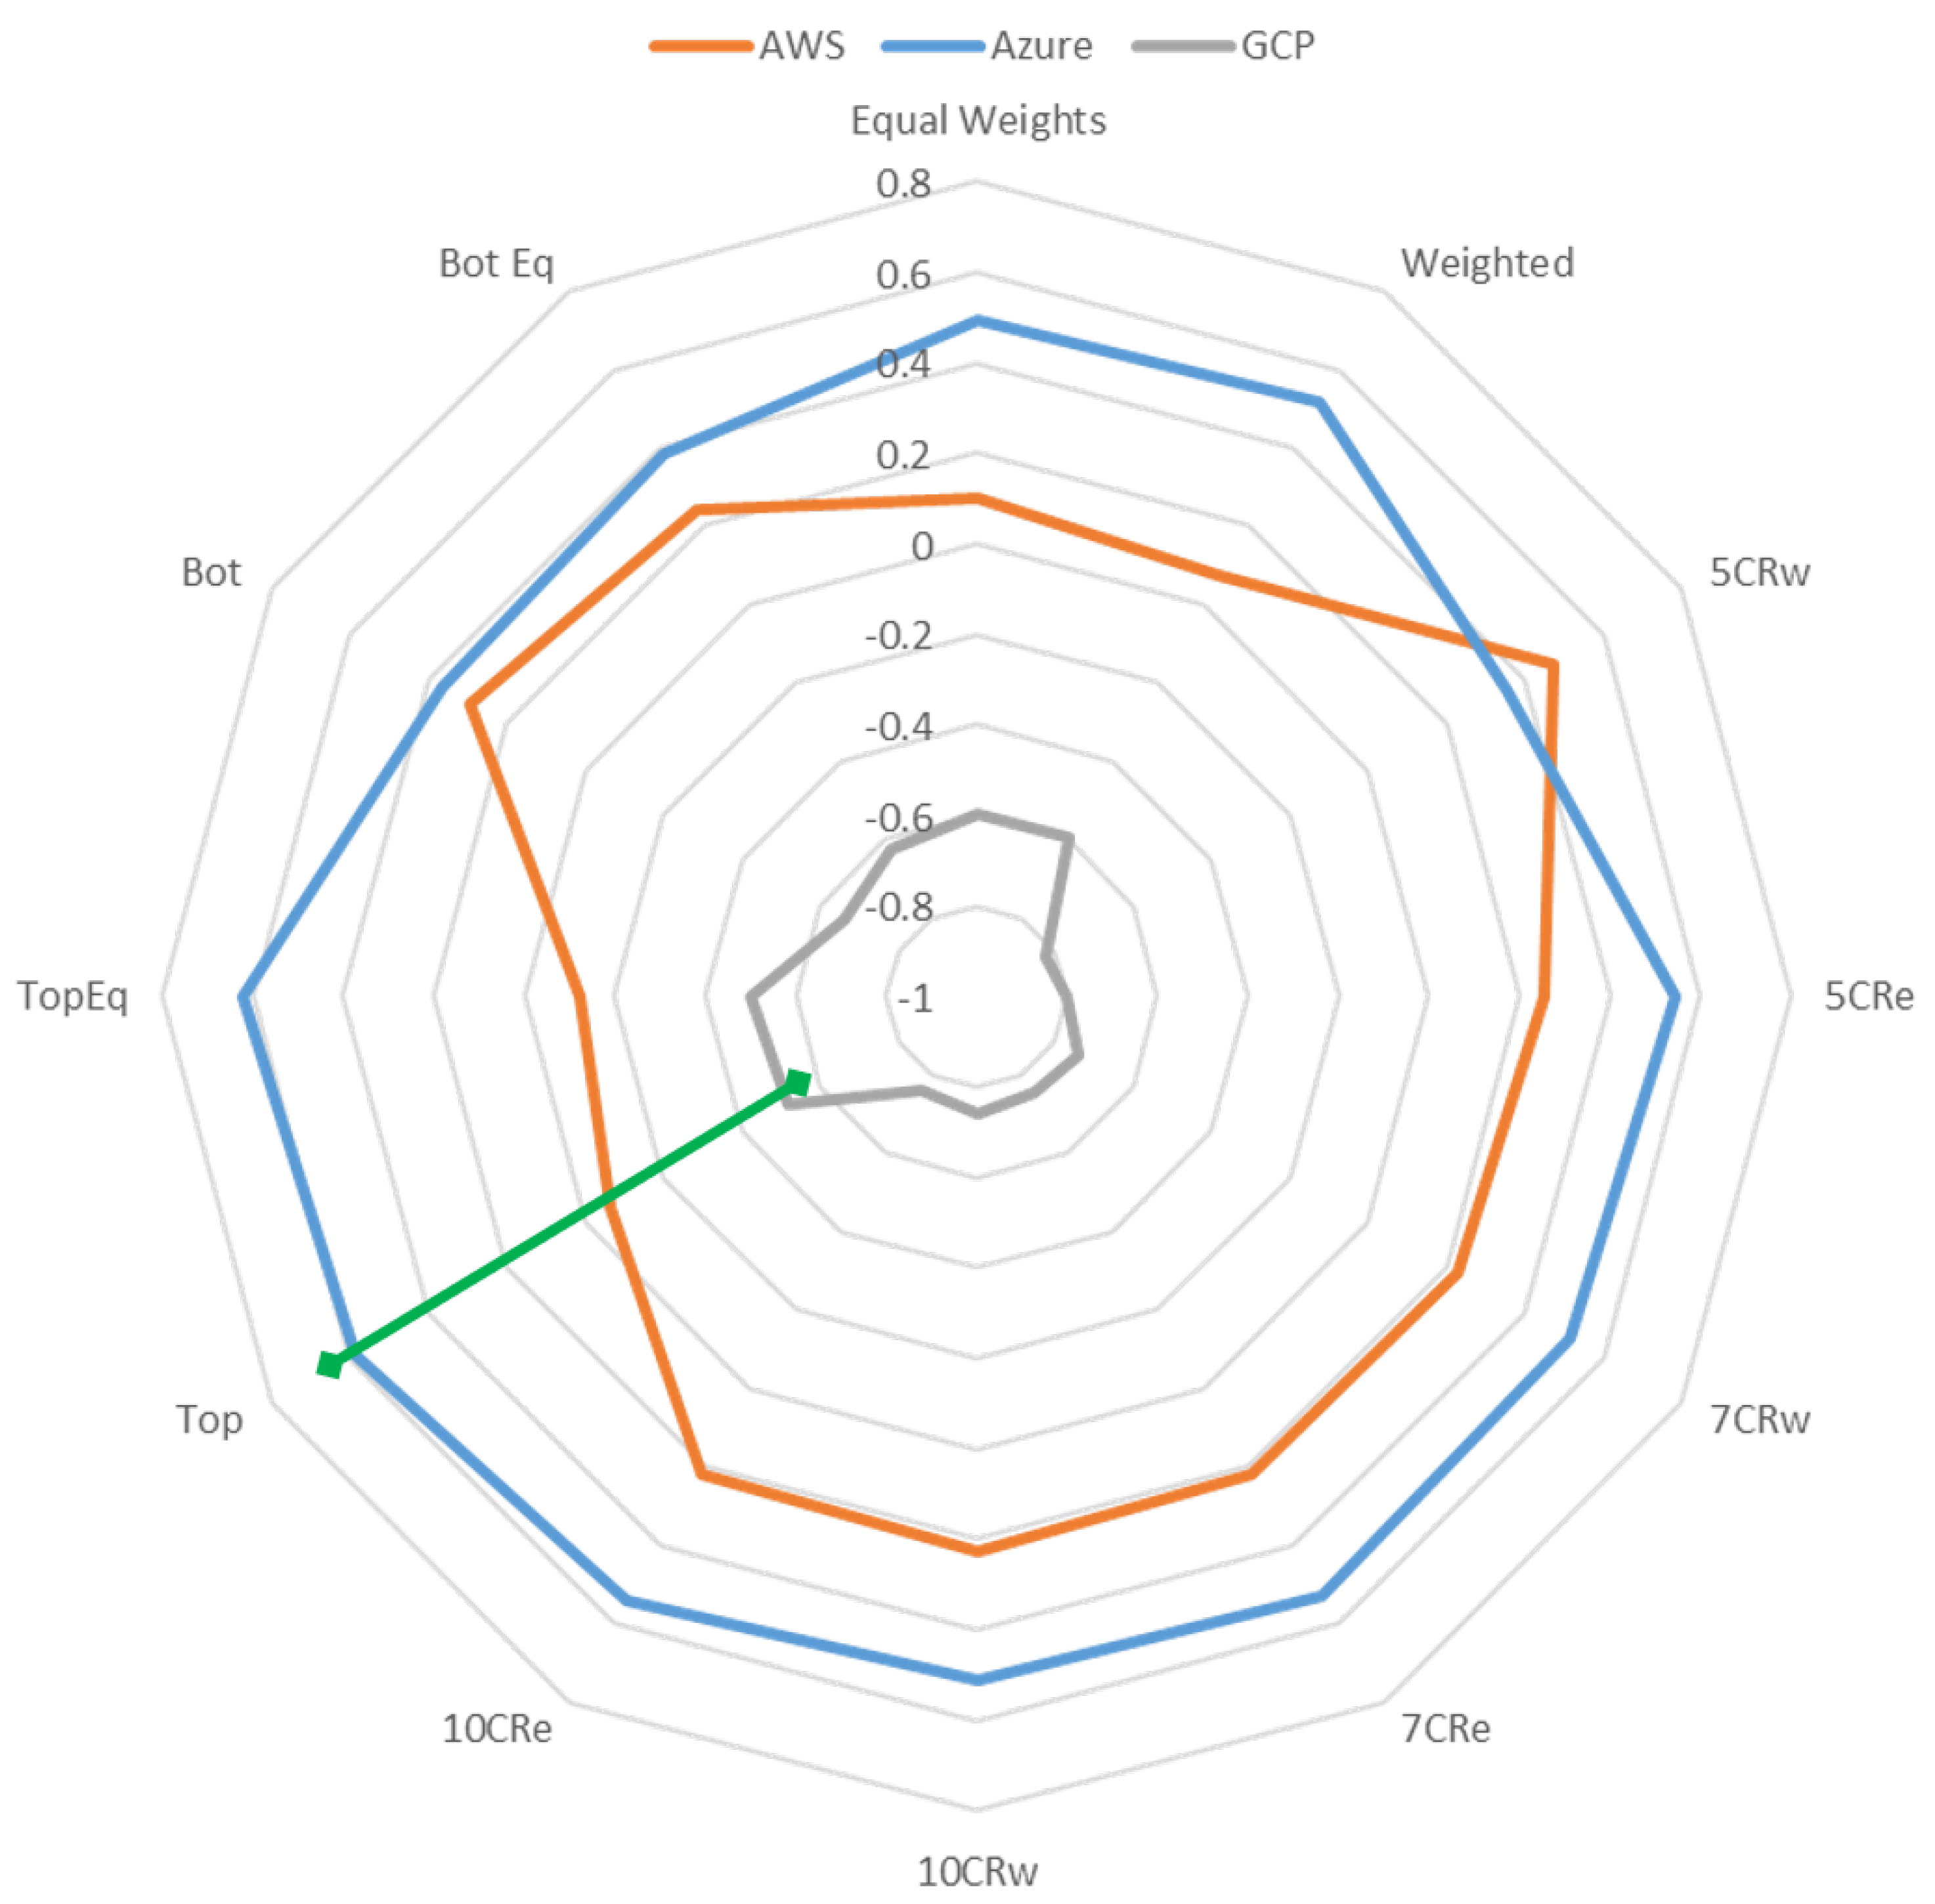
| 5 Criteria | 7 Criteria | 10 Criteria | Full Criteria (14) | |
|---|---|---|---|---|
| AWS | 1 | 2 | 2 | 2 |
| Azure | 2 | 1 | 1 | 1 |
| GCP | 3 | 3 | 3 | 3 |
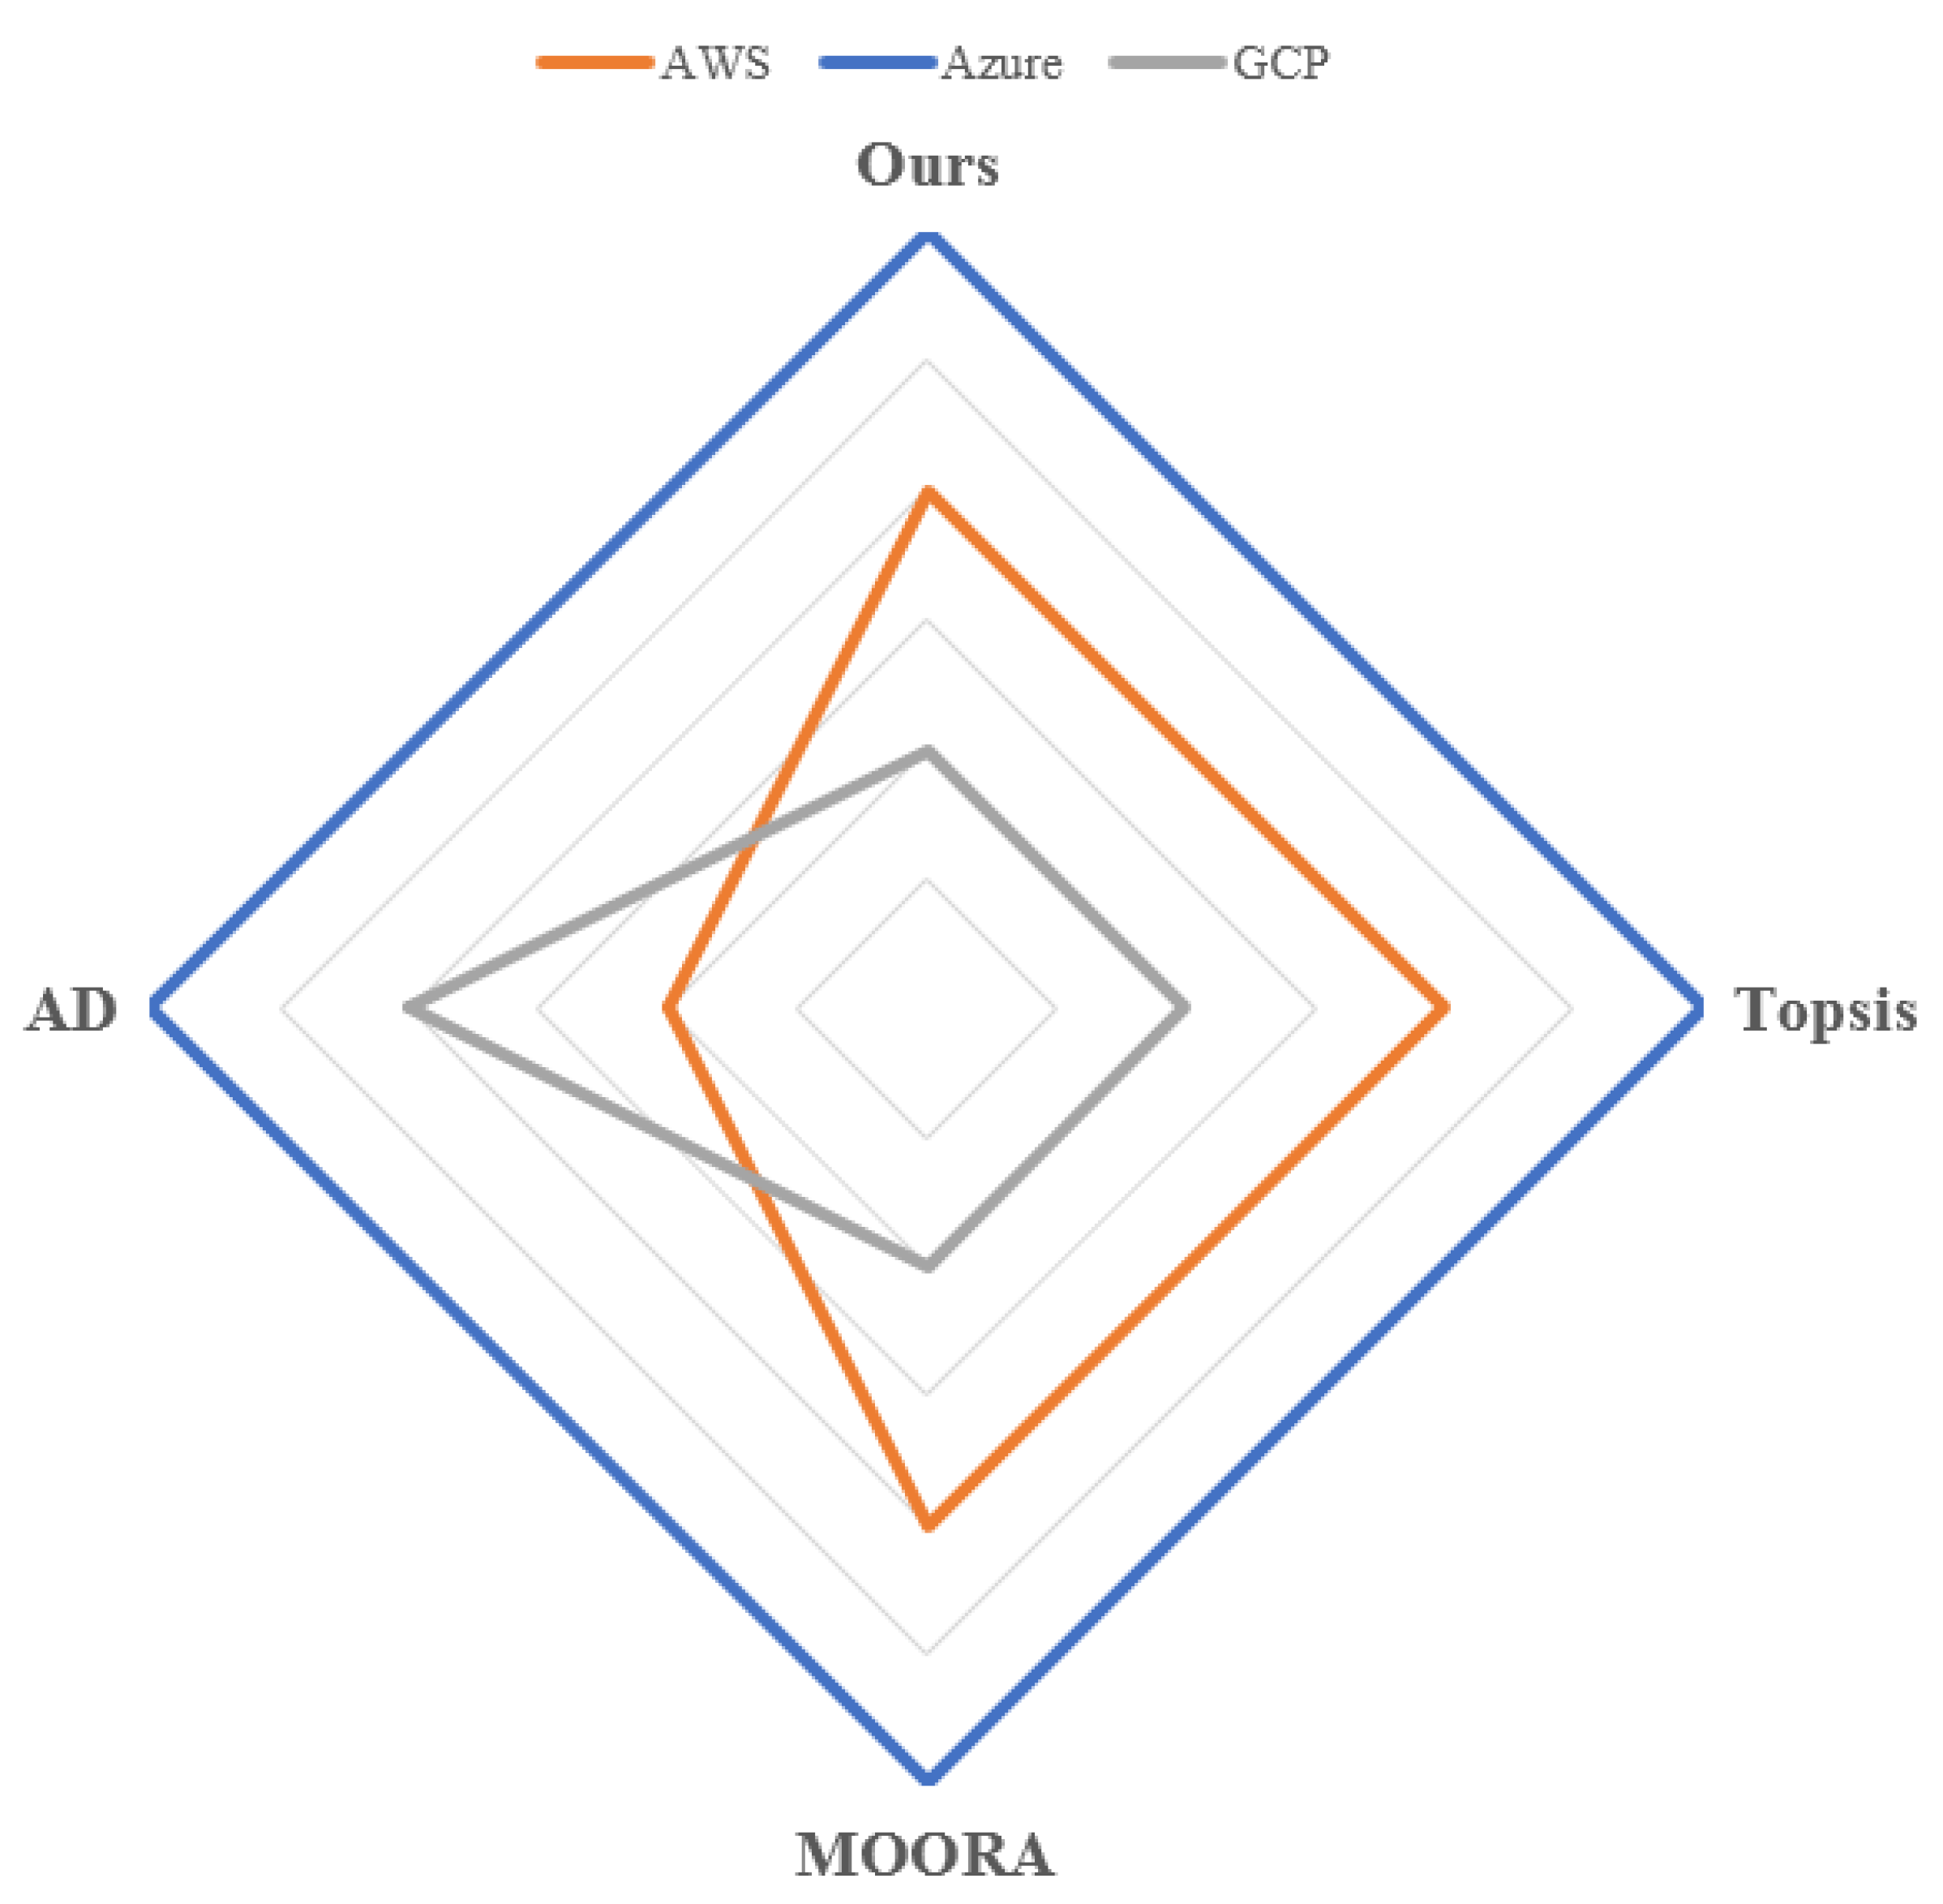
| Ours | TOPSIS | MOORA | AD | |
|---|---|---|---|---|
| AWS | 2 | 2 | 2 | 3 |
| Azure | 1 | 1 | 1 | 1 |
| GCP | 3 | 3 | 3 | 2 |
| 5 Criteria | 7 Criteria | 10 Criteria | Full Criteria (14) | |
|---|---|---|---|---|
| AWS | 1 | 2 | 2 | 2 |
| Azure | 2 | 1 | 1 | 1 |
| GCP | 3 | 3 | 3 | 3 |
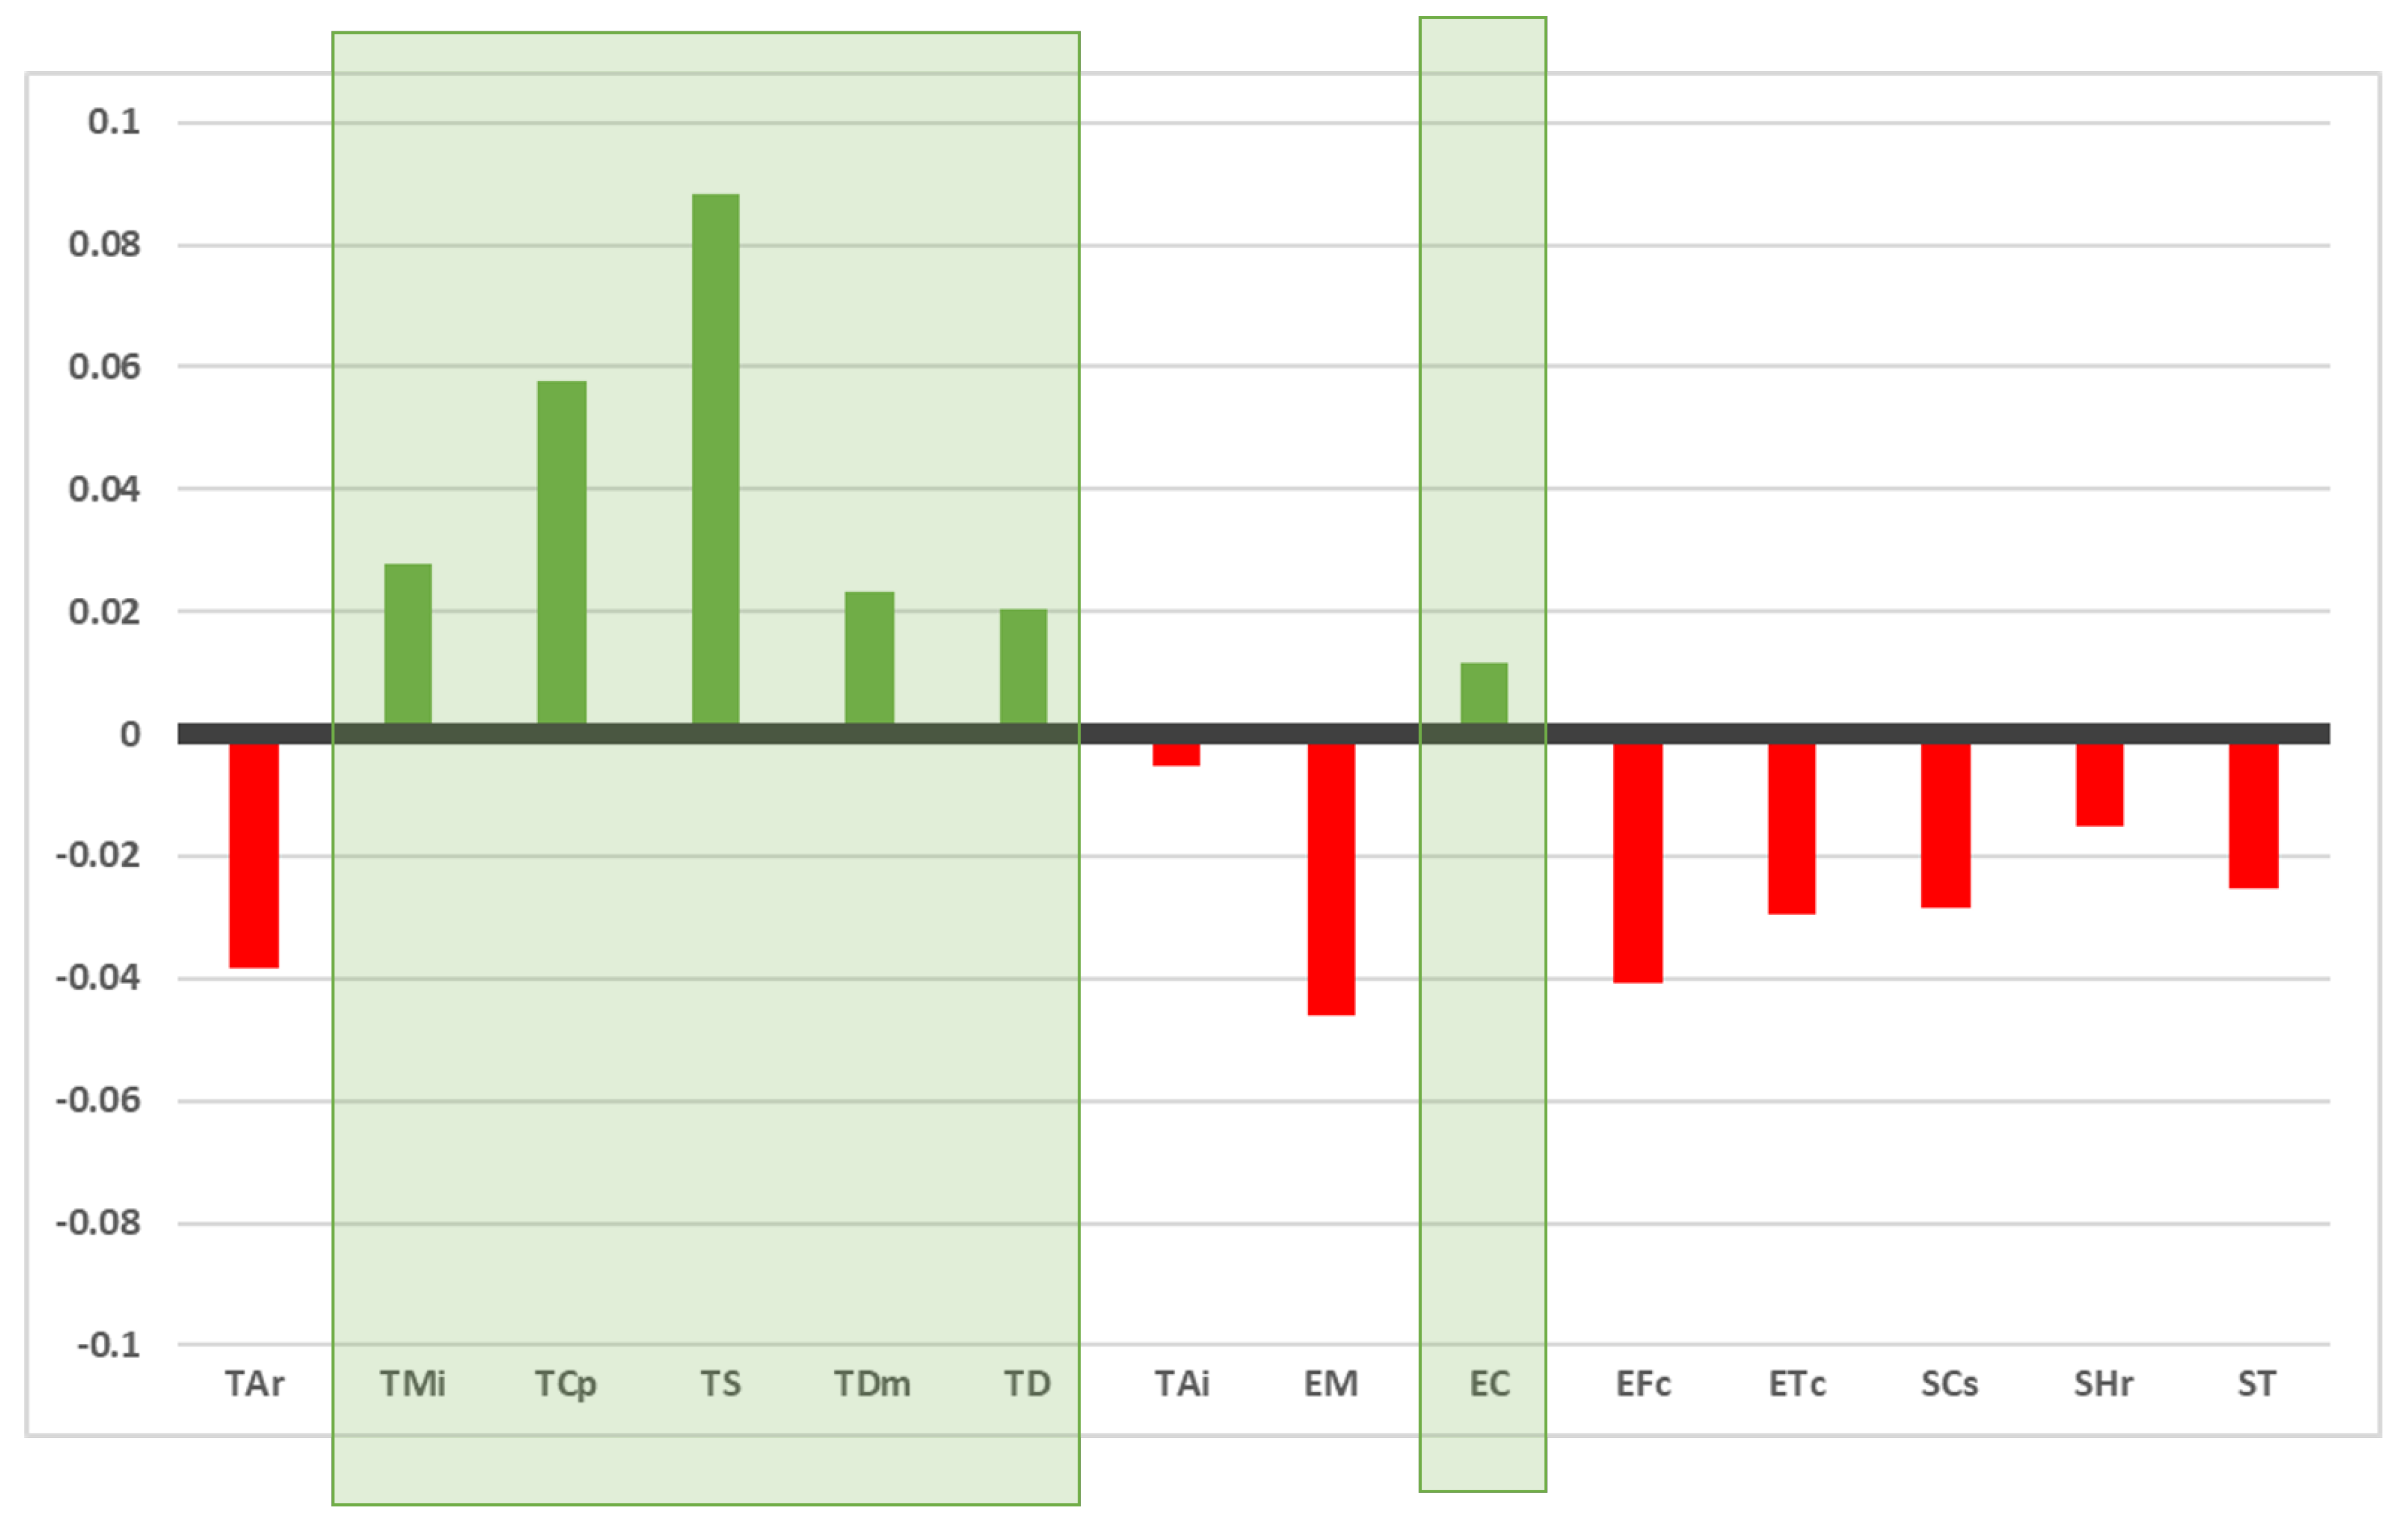
| TS | TCp | TMi | TDm | TD | EC | TAi |
|---|---|---|---|---|---|---|
| 0.1598 | 0.1290 | 0.0991 | 0.0947 | 0.0918 | 0.0829 | 0.0661 |
| SHr | ST | SCs | ETc | TAr | EFc | EM |
| 0.0563 | 0.0460 | 0.0431 | 0.0420 | 0.0331 | 0.0306 | 0.0253 |
© 2020 by the authors. Licensee MDPI, Basel, Switzerland. This article is an open access article distributed under the terms and conditions of the Creative Commons Attribution (CC BY) license (http://creativecommons.org/licenses/by/4.0/).
Share and Cite
Contreras-Masse, R.; Ochoa-Zezzatti, A.; García, V.; Pérez-Dominguez, L.; Elizondo-Cortés, M. Implementing a Novel Use of Multicriteria Decision Analysis to Select IIoT Platforms for Smart Manufacturing. Symmetry 2020, 12, 368. https://doi.org/10.3390/sym12030368
Contreras-Masse R, Ochoa-Zezzatti A, García V, Pérez-Dominguez L, Elizondo-Cortés M. Implementing a Novel Use of Multicriteria Decision Analysis to Select IIoT Platforms for Smart Manufacturing. Symmetry. 2020; 12(3):368. https://doi.org/10.3390/sym12030368
Chicago/Turabian StyleContreras-Masse, Roberto, Alberto Ochoa-Zezzatti, Vicente García, Luis Pérez-Dominguez, and Mayra Elizondo-Cortés. 2020. "Implementing a Novel Use of Multicriteria Decision Analysis to Select IIoT Platforms for Smart Manufacturing" Symmetry 12, no. 3: 368. https://doi.org/10.3390/sym12030368
APA StyleContreras-Masse, R., Ochoa-Zezzatti, A., García, V., Pérez-Dominguez, L., & Elizondo-Cortés, M. (2020). Implementing a Novel Use of Multicriteria Decision Analysis to Select IIoT Platforms for Smart Manufacturing. Symmetry, 12(3), 368. https://doi.org/10.3390/sym12030368