1. Introduction
A driver’s driving style is an important factor that needs to be considered in energy management systems and advanced driver assistance systems of electric vehicles [
1,
2]. It can be understood as a driving tendency, which influences the driver to complete driving tasks [
3,
4]. The recognition of driving style is helpful to understand driving behaviors. And it is an essential condition to enhance traffic safety, promote energy efficiency, and improve driving comfort. Therefore, the accurate recognition of driving style is attracting extensive research interests [
5,
6].
The existing driving style recognition methods are mainly divided into three types: the rule-based method, the model-based method and the data-driven method [
1]. The rule-based method classifies the driving style according to the predefined thresholds [
7]. The model-based approach describes the driving style by establishing an appropriate mathematical model [
8]. However, rule-based methods mainly rely on technical knowledge and expertise, which may be inflexible and incomplete. On the other hand, mathematical models are complicated and difficult to establish due to the complexity and uncertainty of driving behaviors. In contrast, the data-driven method derives the style recognition model directly from the historical driving data using statistical and machine learning methods. This type of method has the advantages of high accuracy, low complexity, and strong generalization ability [
9,
10,
11]. Therefore, a large number of data-driven methods have been applied to the recognition of driving style.
As one of the most important data-driven methods, the supervised learning method has achieved good results in the field of driving style recognition. Wang et al. developed an efficient driving style recognition method based on the support vector machine, which classifies drivers as aggressive and moderate [
12]. Brombacher et al. used an artificial neural network to calculate aggressive scores for driving styles. According to the detected driving events, the overall driving style is divided into five types [
13]. Xie et al. utilized a random forest as the style classification model for maneuver-based driving behaviors [
14]. Sun et al. established a model based on the multi-dimension gaussian hidden Markov process to achieve accurate and reliable driving style recognition [
15]. Although the supervised learning method has a satisfactory classification performance, a mass of labeled data is indispensable. If the labeled data are limited, the trained classifier cannot have strong classification ability. Moreover, it is difficult to provide high-quality labels for a large amount of data, which requires a lot of time and effort [
16]. Therefore, for supervised learning methods, the reliance on the labeled data severely limits their practical application in the identification of driving style.
To avoid the problem of data labeling, some researchers have attempted to carry out unsupervised algorithms on unlabeled data for driving style recognition. Guo et al. proposed an unsupervised deep learning method. The method uses an autoencoder for feature learning and then performs driving style clustering recognition through a self-organizing network [
17]. Ozgul et al. evaluated the performance of various unsupervised clustering methods on driving style recognition, such as k-means, spectral clustering, balanced iterative reducing and clustering using hierarchies [
18]. Feng et al. used the support vector clustering to implement a driving style classification method based on driving events [
19]. The essence of these methods is to discover the underlying structure of different driving styles from collected data directly, without manual intervention. The main advantage of unsupervised learning is that the classification does not require labeling data. Moreover, unsupervised learning is easy to deploy, and does not rely on a priori experience. However, the classification performance of unsupervised learning methods is not accurate enough. For boundary data between two styles, the classification difficulty is particularly significant. Therefore, the recognition ability of unsupervised learning methods makes it difficult to meet the requirements of practical driving style recognition.
Based on the above analysis, it is of great significance to develop a driving style recognition method that not only reduces the dependence on labels but also has a good performance. Compared with other semi-supervised strategies, Tri-Training can use the disagreement between three base classifiers to mine information contained in unlabeled data more effectively. Thus, Tri-Training [
20] is very suitable for driving style recognition under limited labels. For Tri-Training, the selection of base classifier is of great importance. Categorical Boosting (CatBoost) [
21] has an excellent classification accuracy and generalization ability, and it is the primary choice of base classifier comparing with other data-driven methods.
To solve the above challenges, this paper proposes an effective semi-supervised driving style recognition method. First, a large number of features are extracted from velocity data using statistical methods to characterize driving styles. Then, the kernel principal component analysis is used for nonlinear dimensionality reduction to eliminate the feature redundancy. Finally, Tri-CatBoost is proposed to identify driving styles, combining the advantages of the semi-supervised learning strategy Tri-Training and the ensemble learning classification algorithm CatBoost. In this method, the unlabeled data are used to extend labeled data to optimize three CatBoost base classifiers through the Tri-Training strategy. Moreover, each base classifier plays an equivalent role and is further fused into a strong classifier. By learning the potential information contained in unlabeled data, the proposed method can reduce the demand for labeled data and effectively identify driving styles. The contributions of this paper are as follows:
The semi-supervised learning strategy, Tri-Training, is applied to driving style recognition for the first time. It can fully mine the information of unlabeled data to reduce the label dependency and help to train a better recognition model. The introduction of the concept of semi-supervised learning provides a new research idea for driving style recognition.
The CatBoost algorithm is performed as the base classifier for driving style recognition. As an improved ensemble learning algorithm, it has powerful classification and generalization capabilities. It can ensure accurate estimation of driving styles and is of great significance for accelerating practical applications of autonomous driving in intelligent transportation.
A large number of comparisons with different supervised learning methods, semi-supervised strategies, and base classifiers are performed. The experimental results verify that the proposed method can improve the classification precision and recall compared to the existing methods when labeling data is limited. The comparison provides an effective evaluation on using semi-supervised for classic classification issues.
The rest of this paper is organized as follows.
Section 2 demonstrates the main mechanism of the proposed method.
Section 3 introduces the experimental data and feature processing.
Section 4 validates the proposed method through lots of experiments and analyzes the results.
Section 5 discusses the main findings of the study.
Section 6 draws a conclusion.
2. The Proposed Method
2.1. Framework
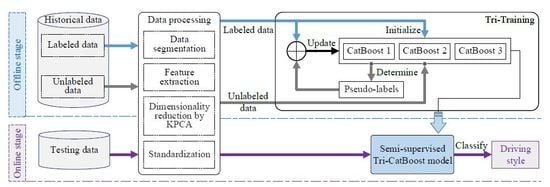
The framework of the proposed semi-supervised driving style recognition method is shown in
Figure 1. The proposed method uses a large number of unlabeled data to assist labeled data to improve learning performance. The method includes two stages: the offline stage and the online stage. In the offline stage, after data segmentation, feature extraction is used to form multiple indicators to represent the driving style. Kernel Principal Component Analysis (KPCA) is used to realize nonlinear dimensionality reduction, and standardization is used to accelerate convergence. Then, the driving style recognition model is built through the Tri-Training strategy. Specifically, three CatBoost classifiers are initialized with labeled data and are used to determine the pseudo-labels of unlabeled data. The pseudo-labeled data and the raw labeled data are put together to retrain classifiers. The three classifiers are iteratively updated and are finally ensemble into the semi-supervised recognition model Tri-CatBoost. In the online stage, the online data are processed in the same way as in the training stage, and are then provided for the trained Tri-CatBoost model to obtain the result of driving style recognition.
2.2. Feature Extraction
The velocity signal
is the basic data for driving style recognition. In addition, the acceleration
and the jerk
can also be taken to characterize driving styles [
22]. The acceleration value reflects how quickly the speed changes and shows how the driver accelerates and decelerates. The jerk is defined as the second derivative of the velocity, which reflects the pressure intensity applied by the driver on the acceleration or brake pedal [
23]. The formula is shown in Equation (
1). Therefore, these signals are combined to form the raw driving signal vector
, which reflects the characteristics of driving styles from different aspects.
To better quantify the driving style, various derived features are extracted from each driving signal, including the mean, maximum, minimum, lower quartile (25%), upper quartile (75%), median, kurtosis, skewness, mean absolute deviation, mean standard error, and standard deviation.
In addition, the maximum product of velocity and acceleration, and the zero-crossing rate of acceleration are also calculated as new features. The above features have been proven to be able to indicate differences in different driving styles [
14]. The zero-crossing rate is defined as the change rate of the acceleration signal trend. When the signs of adjacent samples are different, zero-crossing will occur. The formula is as follows:
where
denotes the sign of acceleratioon signal
, and
L is the length of
.
In summary, a total of 11 × 3 + 2 = 35 features are constructed to characterize the driving style.
2.3. KPCA for Dimensionality Reduction
To reduce the coupling and redundancy between the extracted features, KPCA is employed to perform feature dimensionality reduction in this paper. KPCA is a typical method for non-linear dimensionality reduction. Using the kernel technique, it maps the linear inseparable input space to the linearly separable high-dimensional feature space. Then, the feature space is projected onto the low-dimensional subspace by the standard PCA. In this way, KPCA overcomes the shortcoming that the standard PCA can only realize linear dimensionality reduction. And it is well suited for dimension reduction of driving style features [
24].
Assume that the data is
, and
is a
d-dimensional vector. The data is supposed to have been centralized. To deal with the linear inseparable data, KPCA needs to find a nolinear mapping function
. The mapping function maps the original input space to the high-dimensional feature space, making the mapped data linearly separable. The covariance matrix of the mapped samples is calculated by
The eigenvalue
and the eigenvector
are given by
From Equations (
4) and (
5), we have
where
.
Then, by substituting Equation (
6) into Equation (
5), we can get
In order to avoid direct calculation of the inner product on the feature space, the kernel function is introduced:
Thus, Equation (
7) can be simplified to
where
denotes the kernel matrix, and
. Besides,
.
Similarly to the standard PCA, KPCA performs eigenvalue decomposition on the kernel matrix . Then, the eigenvalues are sorted. The eigenvector corresponding to the first eigenvalues form the projection matrix , which is the solution of KPCA.
For a sample
x, after KPCA dimensionality reduction, its projection in the low-dimensional space is
z. The coordinate of its
k-th dimension is as follows:
2.4. CatBoost Classifier
In recent years, the variants of gradient boosting algorithms have developed rapidly. Under the framework of gradient-boosting decision tree (GBDT), three major implements have emerged: eXtreme Gradient Boosting (XGBoost), Light Gradient Boosting Machine (LightGBM), and CatBoost. XGBoost achieves massive parallelism and has wide industrial applications [
25]. LightGBM effectively improves the calculation efficiency [
26]. However, both XGBoost and LightGBM have an inherent problem of prediction shift. By solving this problem, CatBoost has become a more promising algorithm than XGBoost and LightGBM in terms of accuracy and generalization ability. Specifically, CatBoost is an ensemble of symmetric decision trees, whose symmetry structure endows it fewer parameters, faster training and testing, and higher accuracy. In addition, CatBoost replaces the gradient estimation method of the traditional gradient boosting algorithm with ordered boosting, thereby reducing the bias of the gradient estimation and improving the generalization capability [
21]. These advantages motivate us to choose CatBoost as the base classifier of the proposed driving style recognition method.
Given a dataset
, where
is a
-dimensional feature vector and
is the corresponding label. The symmetric decision trees are constructed by recursively partitioning the entire feature space. Assume that the feature space
of CatBoost is divided into
J disjoint regions (tree nodes). Each region (leaf of the tree) has a corresponding value
, which is the estimated value of the predicted class label. A decision tree
h can be written as a superposition of estimated values of all regions:
where, function
is a indicator function:
In the gradient boosting process, a series of approximate functions
are established to minimize the expected loss
in a greedy manner:
where
is the step size and
is a tree which is selected from a series of
H functions to minimize
in the
t-th iteration:
The least-squares function is used as a loss function for the most part. And the negative gradient step is used to solve the minimization problem. Consequently, Equation (
14) is transformed as follows:
where
. After
N iterations, we get a series of approximate functions
and sum them to get the final model:
It should be mentioned that the goal of the first tree is y, while the latter trees regard the residuals of the targets y and the estimated results of the previous model as their goals.
In the standard gradient boosting procedure, the expectations in Equation (
15) are unknown and are usually approximate as below using the same dataset
D:
Therefore, the classification model at each boosting step relies on the target values of all training samples which are also used to build the previous model . It indicates the target leakage, resulting in the prediction shift of the learned model. To put it in another way, the target has been used in the previous steps of boosting. Thus, the conditional distribution on the training sample is shifted from the conditional distribution on the testing sample x. The prediction shift will affect the generalization ability of the model and the performance of driving style classification. It is worth noting that all existing gradient boosting methods are confronted with such issues.
Based on the principle of the ordered boosting, CatBoost improves the standard gradient boosting process and implements no bias boosting. The principle of the ordered boosting is as follows: suppose is ordered according to a random permutation . The model is trained using the first i samples of , and a total of m models are obtained. At each step, the residual of the current sample is obtained through subtracting the target value of the i-th sample and . In this way, no target is revealed in the previous steps of boosting, and CatBoost can achieve a high generalization performance.
2.5. Tri-CatBoost for Semi-Supervised Driving Style Recognition
In this paper, Tri-CatBoost is proposed to classify driving styles as aggressive, normal and drowsy. On the one hand, Tri-Training is a semi-supervised learning method based on disagreement. It can use the information contained in a large amount of unlabeled data to improve the classification performance of driving style with little labeled data [
20]. On the other hand, CatBoost is a classifier with excellent classification performance and generalization ability. Combining their advantages, Tri-CatBoost is able to reduce the requirements for labels and improve the ability to classify driving styles. The proposed Tri-CatBoost is trained according to the semi-supervised learning strategy Tri-Training. The mechanism is as follows: Three CatBoost base classifiers are initialized with labeled data firstly; then, the pseudo-labels of unlabeled data are generated by these base classifiers; the pseudo-labeled data and the raw labeled data are used to iteratively update the base classifier until they no longer change. Finally, three base classifiers are fused into a strong classifier according to a simple voting method.
Let L denote the original labeled sample set and U denotes the unlabeled sample set. First, three labeled training sets are obtained by conducting Bootstrap Sampling on L. Three CatBoost classifiers, say , and , are initially generated from these three training sets. After that, the “minority obeying majority” strategy is used to generate the pseudo-labels of the samples. Specifically, assuming that the prediction results of classifiers and on an unlabeled sample x are consistent, the sample can be labeled. Then, the pseudo-labeled sample is added to the training set of another classifier so that it can be updated. After continuous iterations, all three classifiers no longer change. It should be noted that in each round, the pseudo-labeled samples in the previous round will be retreated as unlabeled. Finally, an integrated classifier is obtained through the simple voting method implemented on three classifiers.
However, if the classification of
on
x is wrong, a noisy mislabeled sample will be obtained. If mislabeled samples are added to the training set, the performance of
will be affected. Therefore, the newly labeled samples should satisfy the following condition:
where
and
are the sets of newly labeled samples of
in the
t-th round and the
-th round, respectively.
and
are the training sets of
in the
t-th round and the
-th round, respectively.
denotes the upper limit of the classification error of
in the
t-th round, which is estimated using the original labeled sample set
U. Equation (
18) is equivalent to
Only if Equation (
19) is satisfied, can
be taken as the newly-added training set of
. Otherwise, the random sampling is performed on
, and its size after sampling is
If
meets the condition in Equation (
21), then
will satisfy Equation (
19) after sampling. At this time, the samples in
can be added to the training set to update
.
The pseudo-code of Tri-CatBoost algorithm for driving style recognition is shown in Algorithm 1.
| Algorithm 1 The procedure of the Tri-CatBoost method for driving style recognition |
Input: L: Labeled sample set U: Unlabeled sample set - 1:
Train three CatBoost classifiers by a set generated through Bootstrap Sampling. And initialize , , - 2:
repeat - 3:
for each do - 4:
Let , - 5:
Calculate the classification error rate of - 6:
for every do - 7:
if then - 8:
- 9:
end if - 10:
end for - 11:
if then - 12:
- 13:
else - 14:
if then - 15:
Perform random sampling on with the subsampling size - 16:
- 17:
end if - 18:
end if - 19:
if then - 20:
retrain using - 21:
end if - 22:
end for - 23:
- 24:
until none of changes
Output: An integrated classifier through the voting method on |
4. Driving Style Recognition with Semi-Supervised Tri-CatBoost
In this section, the evaluation metrics of driving style recognition are first introduced. Then, a large number of experiments are carried out on UAH-DriveSet to verify the superiority of the proposed Tri-CatBoost method.
The experimental hardware environment is a PC equipped with Intel Core i5 CPU and 8 GB RAM. The software environment is Anaconda3 software and the Python version is 3.7. This paper uses the machine learning library “Scikit-learn” and the CatBoost open-source algorithm library. The data obtained by previous processing is divided at a ratio of 7:3 to obtain the training set and the test set. In order to reduce the influence of random factors, the reported results are the average of ten independent repeated trials.
4.1. Evaluation Metrics
To evaluate the performance of the proposed model, macro precision, macro recall, and AUC are used as evaluation metrics [
29,
30]. Let
denote the number of samples for which the real style is the
i-th style but the estimated style is the
j-th style. The macro precision
and the macro recall
reflect the overall classification accuracy and the coverage, respectively:
The receiver operating characteristic (ROC) curves are also used to study the generalization performance of the model. Its quantitative indicator is the area under the ROC curve (AUC). The larger the AUC, the better the model performs.
4.2. Analysis of the Proposed Semi-Supervised Tri-CatBoost Method
In order to verify the superiority of the proposed driving style recognition method, the recognition results of the proposed semi-supervised learning method Tri-CatBoost, supervised learning method gradient boosting decision tree (GBDT), and unsupervised clustering method K-Means are compared. The cluster number of K-Means is three.
The ROC curves of supervised GBDT and the proposed semi-supervised Tri-CatBoost in different rates of labeled data are shown in
Figure 4. The diagonal indicates the ROC curve of the stochastic guess model, and the (0,1) point corresponds to the ideal model. Due to the limited number of test samples, the ROC curves are not smooth. The ROC curves of both methods are above the diagonal and are getting closer to the (0,1) point as the rate of labeled data increases. In most cases, the ROC curve of Tri-CatBoost can wrap that of GBDT. In addition, the AUC of Tri-CatBoost is greater than that of GBDT. This shows that the driving style classification performance of Tri-CatBoost is better than that of GBDT.
The classification results of semi-supervised Tri-CatBoost, supervised GBDT, and unsupervised K-Means in different rates of labeled data are shown in
Figure 5. The percentage of labeled data was increased from 10 to 90 for testing. It is obvious that the rate of labeled data has no effect on K-Means, and the macro precision and the macro recall of K-Means are at a low level and remain unchanged. It is worth mentioning that when the percentage of labeled data is less than 20%, the macro precision and the macro recall of K-means are the highest. At this time, the labels are extremely limited. Thus, it is difficult for the supervised learning and semi-supervised learning methods to build an accurate classification model. For Tri-CatBoost and GBDT, both the macro accuracy and the macro recall show an obvious upward trend with the increase of the ratio of labeled data. Moreover, the semi-supervised Tri-CatBoost has the highest macro precision and macro recall scores overall.
In general, compared with the supervised learning and unsupervised learning, the proposed semi-supervised learning method Tri-CatBoost exhibits the best driving style recognition performance. The conclusion is quantified from AUC, macro precision and macro recall. It is mainly because that Tri-CatBoost combines the Tri-Training strategy that is able to make full use of the information in the unlabeled data and the CatBoost classifier that has a superior classification performance.
4.3. Analysis of the Semi-Supervised Tri-Training Strategy
To verify the ability to utilize unlabeled data to improve the classification effect and reduce label dependency, the semi-supervised strategy Tri-Training employed is compared with other two classical strategies. These two strategies are Self-Training and Co-Training. Self-Training uses a classifier to generate pseudo-labels for unlabeled samples, and then iteratively updates the classifier [
31]. Co-Training uses two feature subsets to train two base classifiers respectively, which are then updated in the manner of Self-Training [
32]. In order to control the variables, all the above three methods use CatBoost as the base classifier.
Figure 6 shows the ROC curves of Self-CatBoost, Co-CatBoost, and the proposed Tri-CatBoost. Comparing the ROC curves under 20% and 80% labeled data, it is found that the AUC values of all three strategies are significantly improved. The reason is that with the increase of the labeled data, all three strategies can get more definite labels, which reduces the difficulty of the base classifier to give correct pseudo-labels. When the label ratio is 20%, the ROC curve of the proposed Tri-CatBoost can almost completely wrap the ROC curves of Self-CatBoost and Co-CatBoost. In the case of other label ratios (40%, 60%, 80%), the ROC curves of the three strategies intersect. By comparing the AUC values, it is concluded that the overall classification ability of the proposed Tri-CatBoost exceeds those of Self-CatBoost and Co-CatBoost. The result fully illustrates the effectiveness of Tri-Training.
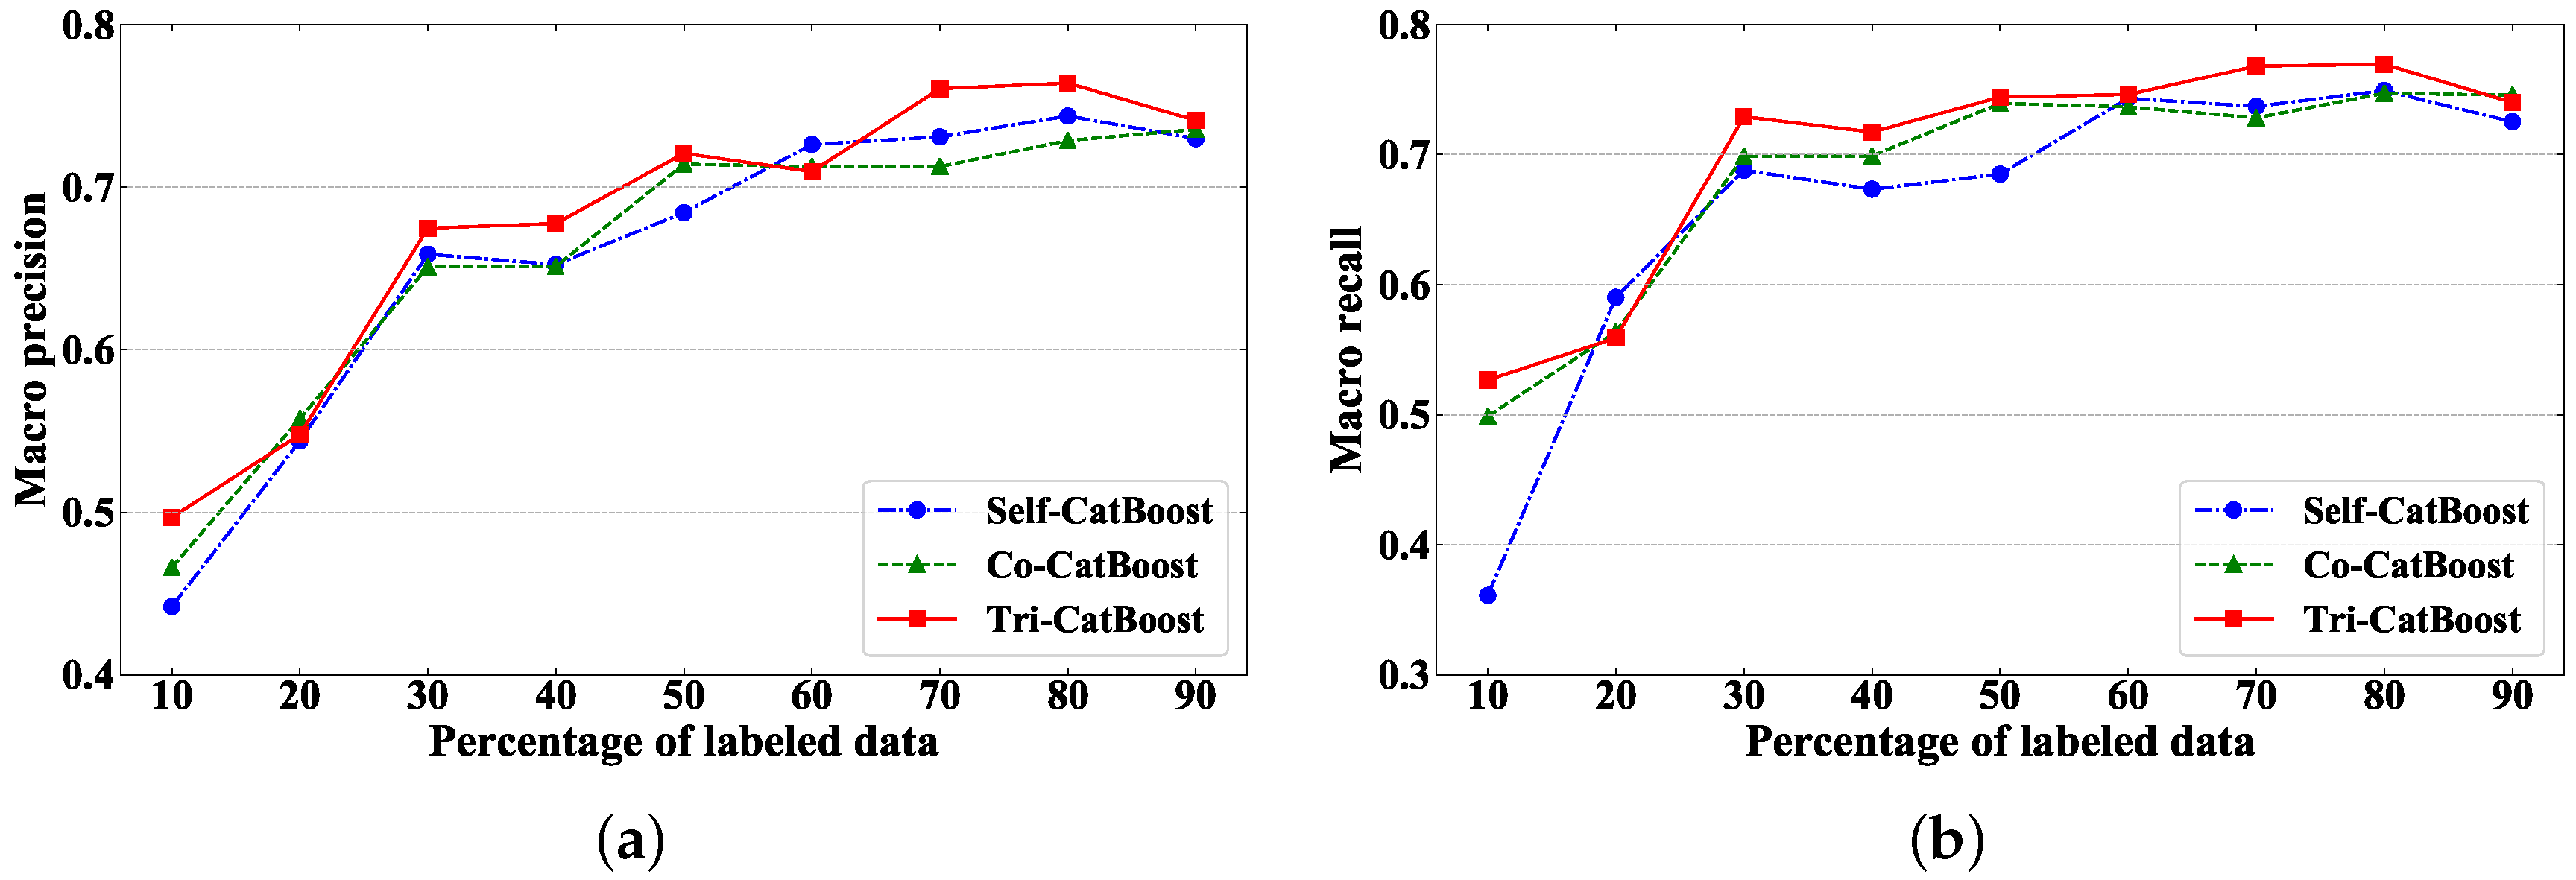
Figure 7 compares the macro precision and macro recall of these strategies at different ratios of labeled data. It can be seen from the figure that the changing trends of the macro precision and the macro recall are not completely consistent. The macro precision improves with the increase of the labeling ratio and tends to be stable when the labeling ratio is greater than 70%, while the macro recall is stable when the labeling ratio is greater than 30%. Overall, the Tri-CatBoost model trained using the Tri-Training strategy performs best in both macro precision and macro recall.
In summary, compared with other semi-supervised learning strategies Self-Training and Co-Training, Tri-Training shows the best classification performance. It is attributed to the fact that the Tri-Training strategy can make full use of the differences between three classifiers to mine unlabeled data information more effectively.
4.4. Analysis of Base Classifier CatBoost
In order to verify the classification ability for driving style, the base learner CatBoost is compared with other classifiers, including random forest (RF), decision tree (DT), multilayer perceptron (MLP), and GBDT. All of the above classifiers are trained using the Tri-Training strategy, and the classification results are shown in
Figure 8. It can be seen that CatBoost can achieve higher macro precision and macro recall than other base classifiers, especially when the rate of labeled data is higher than 30%. This is mainly due to its excellent learning ability and generalization ability.
4.5. Analysis of Classification Results for Different Driving Styles
Taking the case where the rate of labeled data is 50% as an example, the classification results of the proposed semi-supervised Tri-CatBoost method for different styles are analyzed.
Figure 9a shows the ROC curves of the Tri-CatBoost classification result for each driving style. The ROC curve of the aggressive style is very close to the point of (0,1). The ROC curve of the normal style is closest to the diagonal. In other words, the classification performance for the normal style is the worst. The ROC curve of the drowsy style is between the ROC curves of the aggressive style and the normal style. The AUC of the aggressive style is the highest, the drowsy style is the second, and the normal style is the lowest.
Figure 9b shows the confusion matrix of classification results of the proposed Tri-CatBoost method. The total number of testing trips is 82, and the overall false positive rate is 25.6%. 76.2% of false positives are caused by misclassifying the normal styles, most of which are classified to the drowsy style. This is mainly because some segments in the normal style are similar to that of the drowsy style, which brings great difficulties to classification. It is of great significance to reduce the false positive rate of these segments. The misclassification related to the aggressive style is the lowest, which is mainly because that the extracted features can effectively reflect the distinctive characteristics of the aggressive style.
5. Discussion
In order to verify the superiority of the proposed Tri-CatBoost method, various experiments were designed and the results were analyzed in detail. In
Section 4.2, the classification results of unsupervised K-means, supervised GBDT and semi-supervised Tri-CatBoost are compared. Taking the case where the labeling ratio is 50% as an example, the macro precision of these methods is 0.564, 0.705, 0.721, respectively. The macro recall is 0.650, 0.726, 0.744, respectively. It is concluded that the proposed method Tri-CatBoost has better classification performance under limited labels than unsupervised learning and supervised learning. In
Section 4.3, the classification results of Tri-Training and other semi-supervised learning strategies, Self-Training and Co-Training, are compared. The macro precision of these methods is 0.684, 0.714, 0.721, respectively when labeling ratio is 50%. The macro recall is 0.685, 0.739, 0.744, respectively. It is concluded that the Tri-Training strategy can mine unlabeled data information more effectively than other semi-supervised strategies. In
Section 4.4, CatBoost and other base classifiers are compared, e.g., RF, DT, MLP, GBDT. The macro precision of CatBoost is 1.5% higher than that of RF, 6.7% higher than that of DT, 4.0% higher than that of MLP, and 3.4% higher than that of GBDT trained by Tri-Training. The macro recall of CatBoost is also higher than other methods. It is concluded that CatBoost has excellent classification and generalization ability, which is very suitable as a basic classifier for driving style recognition. In
Section 4.5, the classification results of different driving styles are compared. The overall false positive rate is 25.6%. The classification result of the aggressive style is the best and that of the normal style is the worst.

 ,
, 


