1. Introduction
According to the Hungarian Central Statistical Office data, there were 625 road fatalities in 2017, a 2.9% increase when compared to 2016 [
1]. The investigations of the Road Safety Action Program declare that human-related factors caused most of the accidents. Therefore, handling them befits the highly dynamic objective of road safety action. The Road Safety Action Program (2014–2016) was incorporated into the Hungarian Transport Strategy, which also set objectives to reduce the number of road fatalities by 50% between 2010 and 2020 [
2].
The previous research done to estimate drivers’ perceptions of accident risk revealed that the main factors related to the driver which directly affect road safety included driving behavior, driving experience, and the driver’s perception of traffic risks [
3]. Drivers are generally involved in actions that cause safety problems for both themselves and other road users. Many driver behavior factors were observed as being dynamic, intentional rule violations, and errors due to less driving experience, while others were the result of inattention, momentary mistakes, or failure to conduct a function, the latter often related to age [
4,
5].
Driving behavior identification has been observed as a central condition for traffic research and investigations, which generally give practical information in three principal subjects: road safety analysis, microscopic traffic simulation, and intelligent transportation systems (ITS) [
6]. Identifying the driver’s characteristics is essential to ease the driver’s workload and enhance the essential services of active vehicle safety systems. However, these systems, based on the average of the driver’s performance and the individual driver’s attitudes, were seldom taken into consideration [
7].
There have been ample efforts made to detect and remediate behaviors that reduce driving safety. Among the many tools developed to identify problematic driver behaviors, the driver behavior questionnaire (DBQ) stands out for its longevity and dominant employment [
8]. In order to analyze risky driving behavior for road safety, the DBQ was first used as an operational tool in related studies in the 1990s [
9,
10].
Multi-criteria decision-making (MCDM) models have provided decision-makers with the best solutions for the complex problems of dealing with several criteria [
11]. MCDM models have been successfully used in a wide range of problems in varied fields, including complex transportation systems [
12,
13]. The analytic hierarchy process (AHP) is considered to be one of the most common MCDM models that supports decision-makers to identify and solve real-world problems. However, the conventional AHP glosses over assorted impediments, such as the menial pairwise comparisons (PCs) and the lack of consistency in some cases. Furthermore, it requires more efforts from the evaluators [
14]. There are also some gaps, such as the eigenvector optimality problem and the fact that it ignores the interrelations among the different factors at different levels [
15,
16,
17,
18,
19].
However, it is inconceivable to neglect the inconsistency in the pairwise comparison matrix (PCM), since inconsistency usually occurs in practice [
20,
21]. The inconsistency issue of the PCM is the notable drawback of the AHP, and this may lead to fallacious results. This would occur mainly if the PCM is 5 × 5 or bigger in the decision structure, where the tolerably consistent filling of this sized matrix requires significant cognitive effort from non-expert evaluators [
16].
To overcome the lack of consistency in the conventional AHP and minimize the PCs in the questionnaire survey, Rezaei created Best Worst Method (BWM) [
22], which aims to unburden decision-makers by requiring less pairwise comparisons than the conventional AHP procedure. As it is a new technique, it only has a few applications, and some questions remain open in terms of the conditions and limitations related to the usage of parsimonious AHP. For the BWM itself, the satisfactory consistency ratio value and the inconsistency amelioration methods can be addressed. When it comes to the BWM within other contexts, uncertainty could be investigated. The multi-optimality solution of the model in the BWM could be solved from other perspectives [
23].
This paper proposes an integrated model of AHP-BWM to overcome the disadvantages of the traditional AHP method in the case of 5 × 5 or larger PCMs in the decision structure. Additionally, this model gives a few PCs and allows for the high consistency of the PCM. Moreover, we attempt to apply BWM to equal or larger than 5 × 5 PCMs, which might be demanding for layman evaluators. Even though Saaty clarified that the consistency would be very poor when the factor numbers exceed 7 ± 2 [
14], it is originally a theoretical verification of Miller’s psychological investigation [
24]. However, the proposed model leads to more consistent and reliable results, with a smaller number of PCs for designated matrices.
2. Materials and Methods
2.1. Driver Behavior Questionnaire (DBQ) Survey
The questionnaire survey technique is a predefined series of questions used to collect data from individuals [
9,
10]. Some recent studies applied the driver behavior questionnaire to assess the real-world situation, by considering the significant traffic safety factors and interrelations between the observed factors [
17,
25]. This study utilized the driver behavior questionnaire (DBQ) as a tool to collect driver behavior data based on perceived road safety issues. The case study has been conducted using experienced drivers in the Hungarian capital city, Budapest. To do so, car drivers with at least fifteen years of driving experience were asked to fill in the DBQ face-to-face, which enhanced its reliability. The questionnaire survey was designed in two parts: The first part intended to accumulate demographic data about the participants, and these results are tabulated in
Table 1. The results state the mean and standard deviation (SD) values of observed characteristics such as age, gender and driving experience based on drivers’ responses to the DBQ.
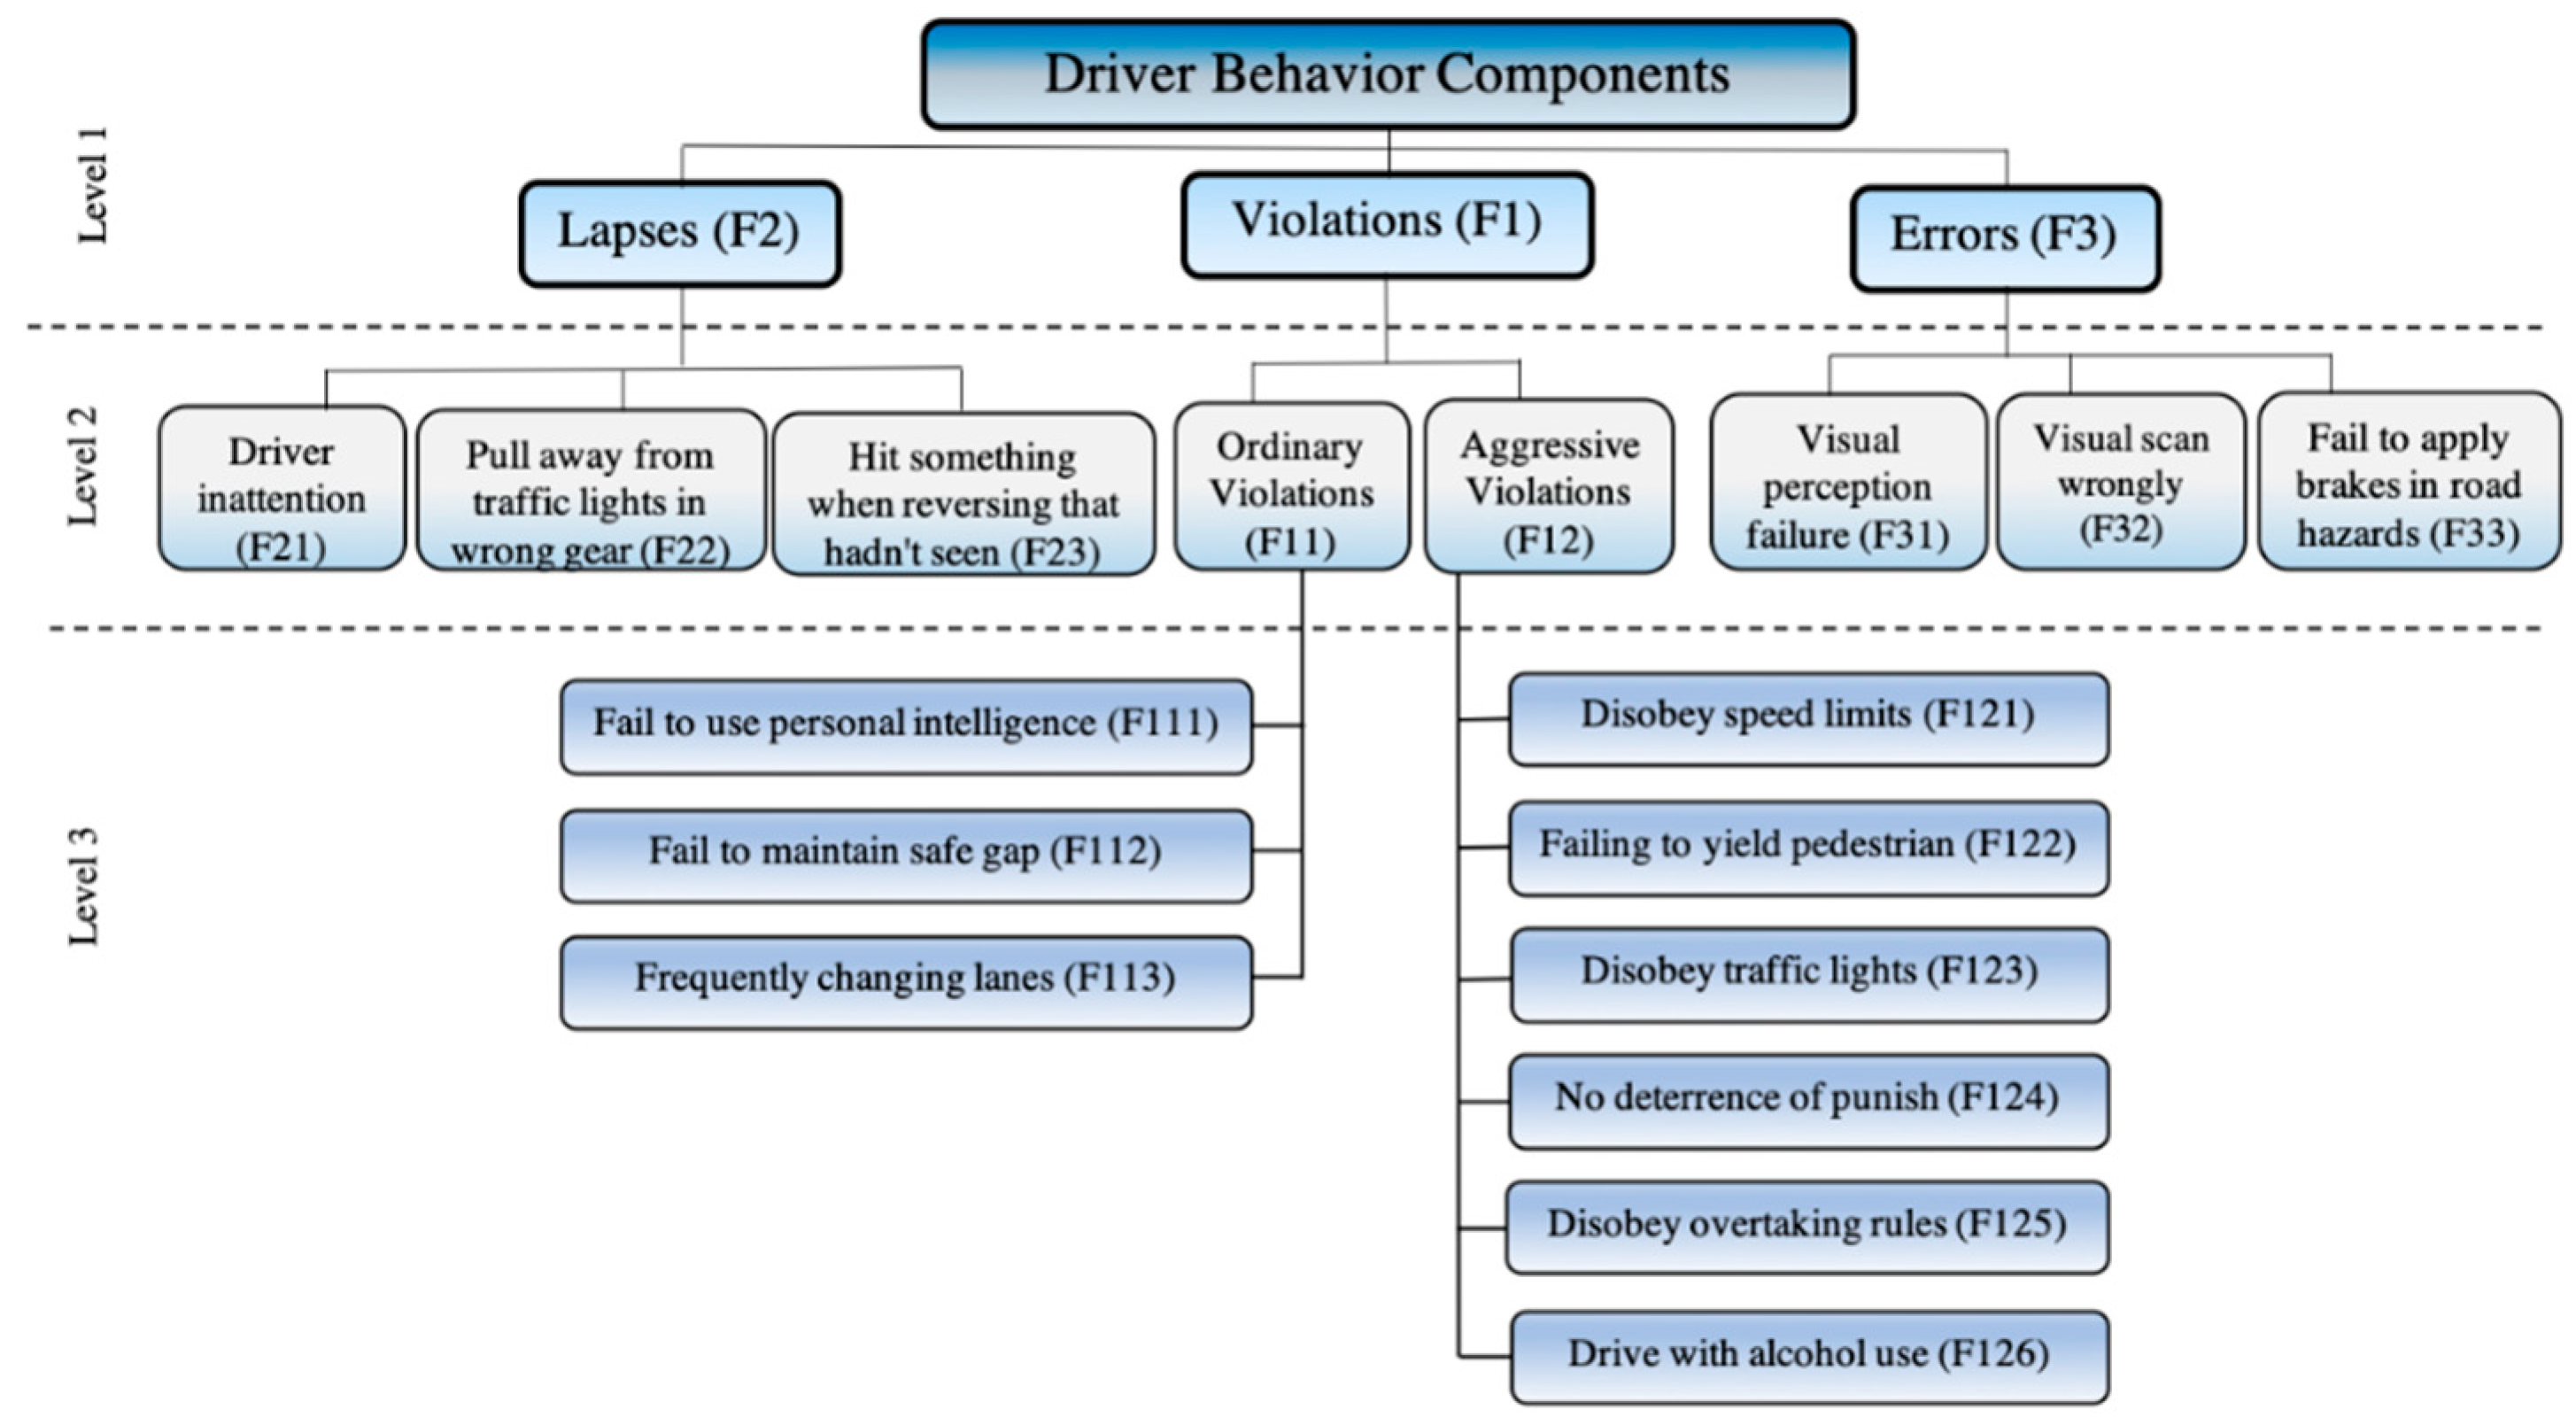
The second part of the DBQ, which has a design based on the Saaty scale, is used to analyze the significant driver behavior factors related to road safety. The previous study identified three types of deviant driving behavior, i.e., errors, lapses and violations, and investigated the relationship between driving behavior and accident involvement [
9]. Some previous studies utilized the extended version of the DBQ to measure aberrant driver behaviors such as aggressive and ordinary violations, lapses and errors. Accordingly, these driver behaviors were defined as “errors” in unintended acts or decisions, while “slips and lapses” are tasks which we do without much conscious consideration. Furthermore, “violations” are intentional failures—intentionally doing incorrect action [
26,
27,
28]. An “aggressive violation” was defined as inconsistent behavior towards other road users [
27]. For evaluation purposes, the driver behavior factors are designed in a three-level hierarchical structure and each factor is symbolized with an ‘F’, as shown in
Figure 1. These driver behavior factors have a significant influence on road safety, as discussed in the foregoing study [
17].
2.2. Overview of the Conventional Analytic Hierarchy Process (AHP)
The conventional AHP method is based on the hierarchical decision structure, which is constructed from decision elements of the complex decision issue, and it was applied extensively in many areas [
29,
30,
31]. The hierarchical structure generally consists of multi-levels where the principal elements and sub-elements are located, and the importance of the linkages among the elements in the different levels determine the global scores for the elements in the last level. The main steps of the conventional AHP are:
Setting up the hierarchical structure of the decision problem
Constructing PCMs based on the hierarchy
Preparing the questionnaire survey
Checking the consistency
Aggregation by the geometric mean
Deriving weight vectors
Calculating the global scores
Sensitivity analysis
The PCM is a positive square matrix
, where
is the subjective ratio between
and
, and
is the weight score from the
. The following equation can calculate Saaty’s eigenvector method, which is defined for the PCMs:
where the maximum eigenvalue of the
A matrix is
.
The structure of a (6 × 6) consistent with theoretical PCMs is defined as (2).
For every PCM, the reciprocity is primarily performed
where
is ensured. However, consistency is probably not performed for empirical matrices. The consistency criterion:
The questionnaire surveys were filled out by the evaluators, taking into consideration the evaluated driver behavior factors related to road safety established on the Saaty scale. This scale ranges from 1 for the case that two elements have the same importance to 9 when one element is favored by at least an order of magnitude [
14]. The empirical matrices are generally not consistent in the eigenvector method despite being filled by the evaluators.
Saaty created the consistency check in order to examine the PCM consistency, which in turn provides robust outcomes.
where CI is the consistency index, and the maximum eigenvalue of the PCM is
, and
m is the number of rows in the matrix. While the following equation can compute the consistency ratio (CR):
where the average of the consistency index is (RI) and its values are presented in (
Table 2). The agreeable value of CR in the AHP approach is CR < 0.1.
Sensitivity analysis enables the perception of the effects of alternates in the main element on the sub-element ranking, and helps the decision-maker to check the stability of results throughout the process.
2.3. Overview of the Best Worst Method (BWM)
The general BWM method for criteria and alternatives has been used to derive the weights of the criteria, with a smaller number of comparisons and a more consistent comparison role. The best criterion is the one which has the most vital role in making the decision, while the worst criterion has the opposite role [
22]. Furthermore, not only does BWM derive the weights independently, but it can also be combined with other multi-criteria decision-making methods [
32,
33,
34].
The main steps can be summarized as the following:
Setting up decision problem elements
Defining the most important and the least important element
Defining the preference of the most important element over all the other elements
Defining the preference of the least important element over all the other elements
Checking the consistency
Measuring the weight scores
We consider a set of elements () and then select the most important element and compare it to others using the Saaty scale (1–9). Accordingly, this indicates that the most important element to other vectors would be: , and obviously . However, the least important element to other vectors would be by using the same scale.
After deriving the optimal weight scores, the consistency was checked through computing the consistency ratio from the following formula:
where
Table 3 provides us with the consistency index values:
To obtain an optimal weight for all elements, the maximum definite differences are
and
, and for all
j is minimised. If we assumed a positive sum for the weights, the following problem would be solved:
The problem could be transferred to the following problem:
By solving this problem, we obtain the optimal weights and .
2.4. The Proposed AHP-BWM Model
Let us have n criteria structured in a decision problem into m levels. Thus, we have levels in the decision. Let us denote criteria on a certain level of the decision, in order to denote a criterion on a certain level in which we might have criteria.
and J are the set of all criteria of a decision such as . Consequently, means respectively, the first criterion on the first level, and so forth.
The first step of the suggested method is to select a level or levels to decide how the parsimonious AHP will be conducted. It is proposed that we select level(s) which have ‘h’ in their title, so that the level(s) can be considered to be worth enough in number, relieving the evaluators from numerous pairwise comparisons. Moreover, it is recommended (following Saaty’s 7
2 rule for a PCM) to select level(s) for which PCMs larger or equal to 5 × 5 should be evaluated [
14]. Based on own experience, the pairwise comparisons for a 5 × 5 matrix might be demanding for layman evaluators.
In the simple AHP approach, in order to obtain a completed matrix for n factor, we need to evaluate PCs. For the BWM method, we need pairwise comparisons. This matter shows that BWM is an efficient approach to save time and effort for both evaluators and analyzers. For example, if we have just ten criteria, this means that we have to make 45 comparisons with simple AHP for them, however, if we select BWM for this PCM then this is just 17 comparisons.
At the first level of the hierarchical model, the evaluators filled the matrix by factors with symbols in order to compare F1, F2 and F3.
In the pure AHP, the evaluator has to evaluate twenty-eight comparisons (12 comparisons for four (3 × 3) matrices + 1 comparison for one (2 × 2) matrix + 15 comparisons for (6 × 6) matrix).
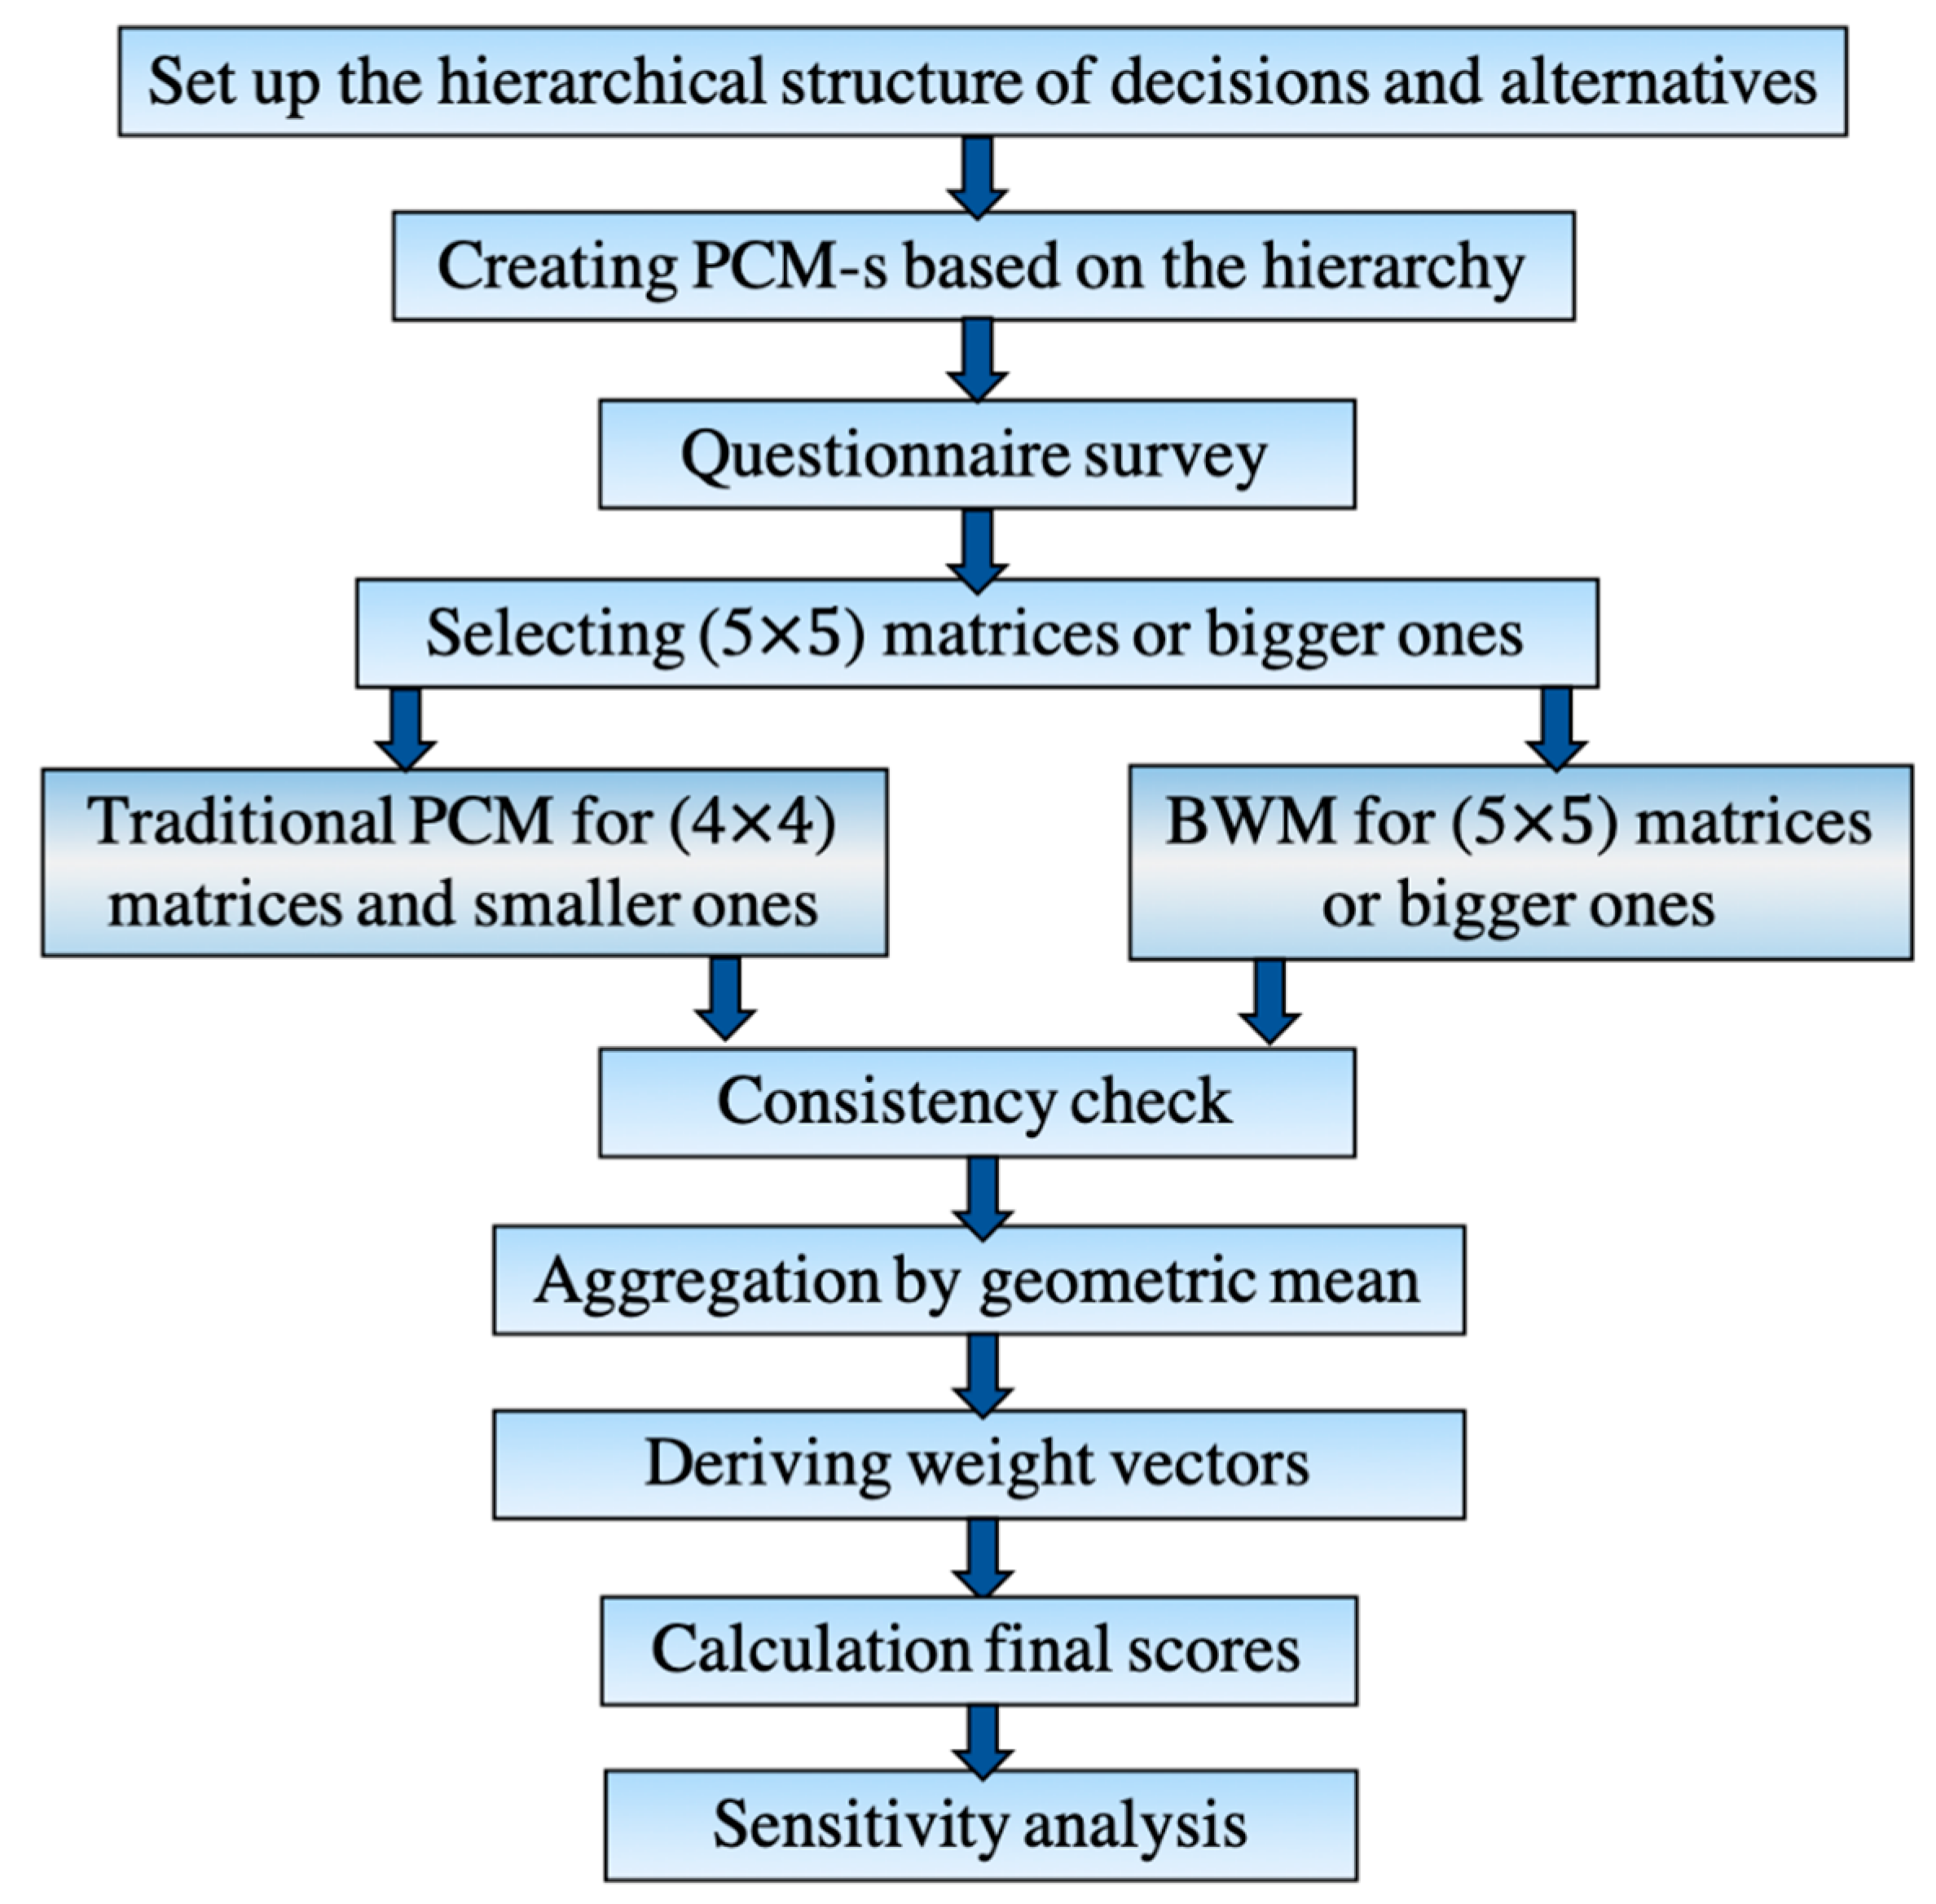
However, in the proposed AHP-BWM model, the evaluator has to evaluate only twenty comparisons. The main steps of the proposed AHP-BWM model are discussed in
Figure 2.
3. Results and Discussion
The AHP-BWM model was applied based on the size of matrices to more effectively evaluate the driver behavior factors related to road safety. Firstly, the analytic hierarchy process which was used for the hierarchical structure contains four (3 × 3) matrices and one (2 × 2) matrix. The best worst method was applied at the third level for the (6 × 6) matrix to compute the weight scores; this method helps us to perform nine comparisons for the (6 × 6) matrix instead of 15 comparisons if the AHP was applied. Furthermore, the reliability of the PCs’ consistency in AHP and BWM was checked, and it was acceptable for all of them. The aggregated scores for F121, F122, F123, F124, F125 and F126 are depicted in
Table 4.
For the first level, the AHP results showed that “violations” (F1) is the highest ranked driver behavior factor related to road safety based on evaluator answers on the DBQ. The previous study observed that “road traffic violations (RTVs)” is the most critical behavior that causes certain risk to other road users [
35]. Another study noticed that “violations” along with “errors” positively correlated with self-reported accident involvement [
36]. After that, the results observed “errors” (F3) as a second rank factor, followed by “lapses” (F2), as shown in
Table 5.
For the second level, the AHP results indicated that “aggressive violation” (F12) is the most important driver behavior factor related to road safety. The previous study found an important relationship between aggressive violations and the number of accidents for Finland and Iran [
37]. In addition, a recent study observed a positive correlation between the more aggressive violations and accident involvement [
38]. Furthermore, the results evaluated “fail to apply brakes in road hazards” (F33) as the second most significant factor compared to other related factors.
The previous study noted that more fatalities and a high number of impact speed crashes could occur if the driver does not apply the brakes [
39,
40]. Meanwhile, “visual scan wrongly” (F32) is observed to be the lowest ranked driver behavior factor related to road safety, as shown in
Table 6.
For the third level, the combined AHP-BWM model was applied to one (3 × 3) matrix (AHP) and one (6 × 6) matrix (BWM). The model results showed “drive with alcohol use” (F126) as the most significant driver behaviour factor related to road safety. This result can be justified by looking at Hungarian driving laws; there is a zero-tolerance policy towards drinking and driving [
41]. Subsequently, the model results observed “disobey traffic lights” (F123) as the second ranked factor, followed by “failing to yield pedestrian” (F122). The previous study observed “beating traffic lights” as one of the frequent causes for the high number of crashes and injuries [
42]. The results showed “fail to use personal intelligence” (F111) as the lowest ranked driver behavior factor compared to other related factors as shown in
Table 7.
The recent DBQ study also evaluated “failing to use personal intelligent assistant” as the least respected driver behavior by Budapest and Islamabad drivers [
43]. The application of the AHP-BWM model resulted in more consistent weights, facilitating the completion of prepared questionnaires for the decision-makers.
4. Conclusions
The use of driver behavior identification has been considered an important and complex way to solve road issues because of the large amount of driver behavior data and its variation. In this paper, we described some tricky AHP problems, and then designed an advanced AHP-BWM model for evaluating the driver behavior factors related to road safety. The study utilized the driver behavior questionnaire designed using the Saaty scale to collect driver behavior data from experienced drivers with at least fifteen years of driving experience. The proposed AHP-BWM model helps to evaluate the driver behavior factors in a three-level hierarchical structure, with less evaluation time and better understandability for evaluators due to fewer comparisons compared to the conventional AHP. The obtained model results are more reliable compared to those of conventional models due to more consistent PCs, which increase the efficiency of the proposed model.
The study evaluation outcomes show that “violations” is the most significant factor that influences road safety, followed by “errors” for the first level of the hierarchical structure. For the second level, the AHP results found that “aggressive violations” is the most important driver behavior factor related to road safety, followed by “fail to apply brakes in road hazards”, based on the drivers’ responses. The results showed “visual scan wrongly” as the least significant driver behavior factor related to road safety. For the third level, the AHP-BWM model results evaluated that “drive with alcohol use” is the most important factor followed by “disobey traffic lights”, compared to other related factors. However, the model results found “failing to use personal intelligence” to be the least significant driver behavior factor related to road safety.
By considering further research, it is clear that many other AHP-BWM model applications are necessary to become familiar with analyzing different real-world characteristics. The measurable benefits are clear, it provides a faster and cheaper survey process, and undoubtedly the survey pattern can be extended more easily using this technique than applying the conventional AHP with the complex PC questionnaire. However, this paper merely provides one example, but many other applications can ultimately verify the technique. The combined AHP-BWM model will help researchers to improve their future research by improving the consistency with fewer PCs and saving time for analyzing collected data.


