Incorporating Particle Swarm Optimization into Improved Bacterial Foraging Optimization Algorithm Applied to Classify Imbalanced Data


Abstract
1. Introduction
2. A Brief Description of Bacterial Foraging Optimization and Particle Swarm Optimization
2.1. Bacterial Foraging Optimization
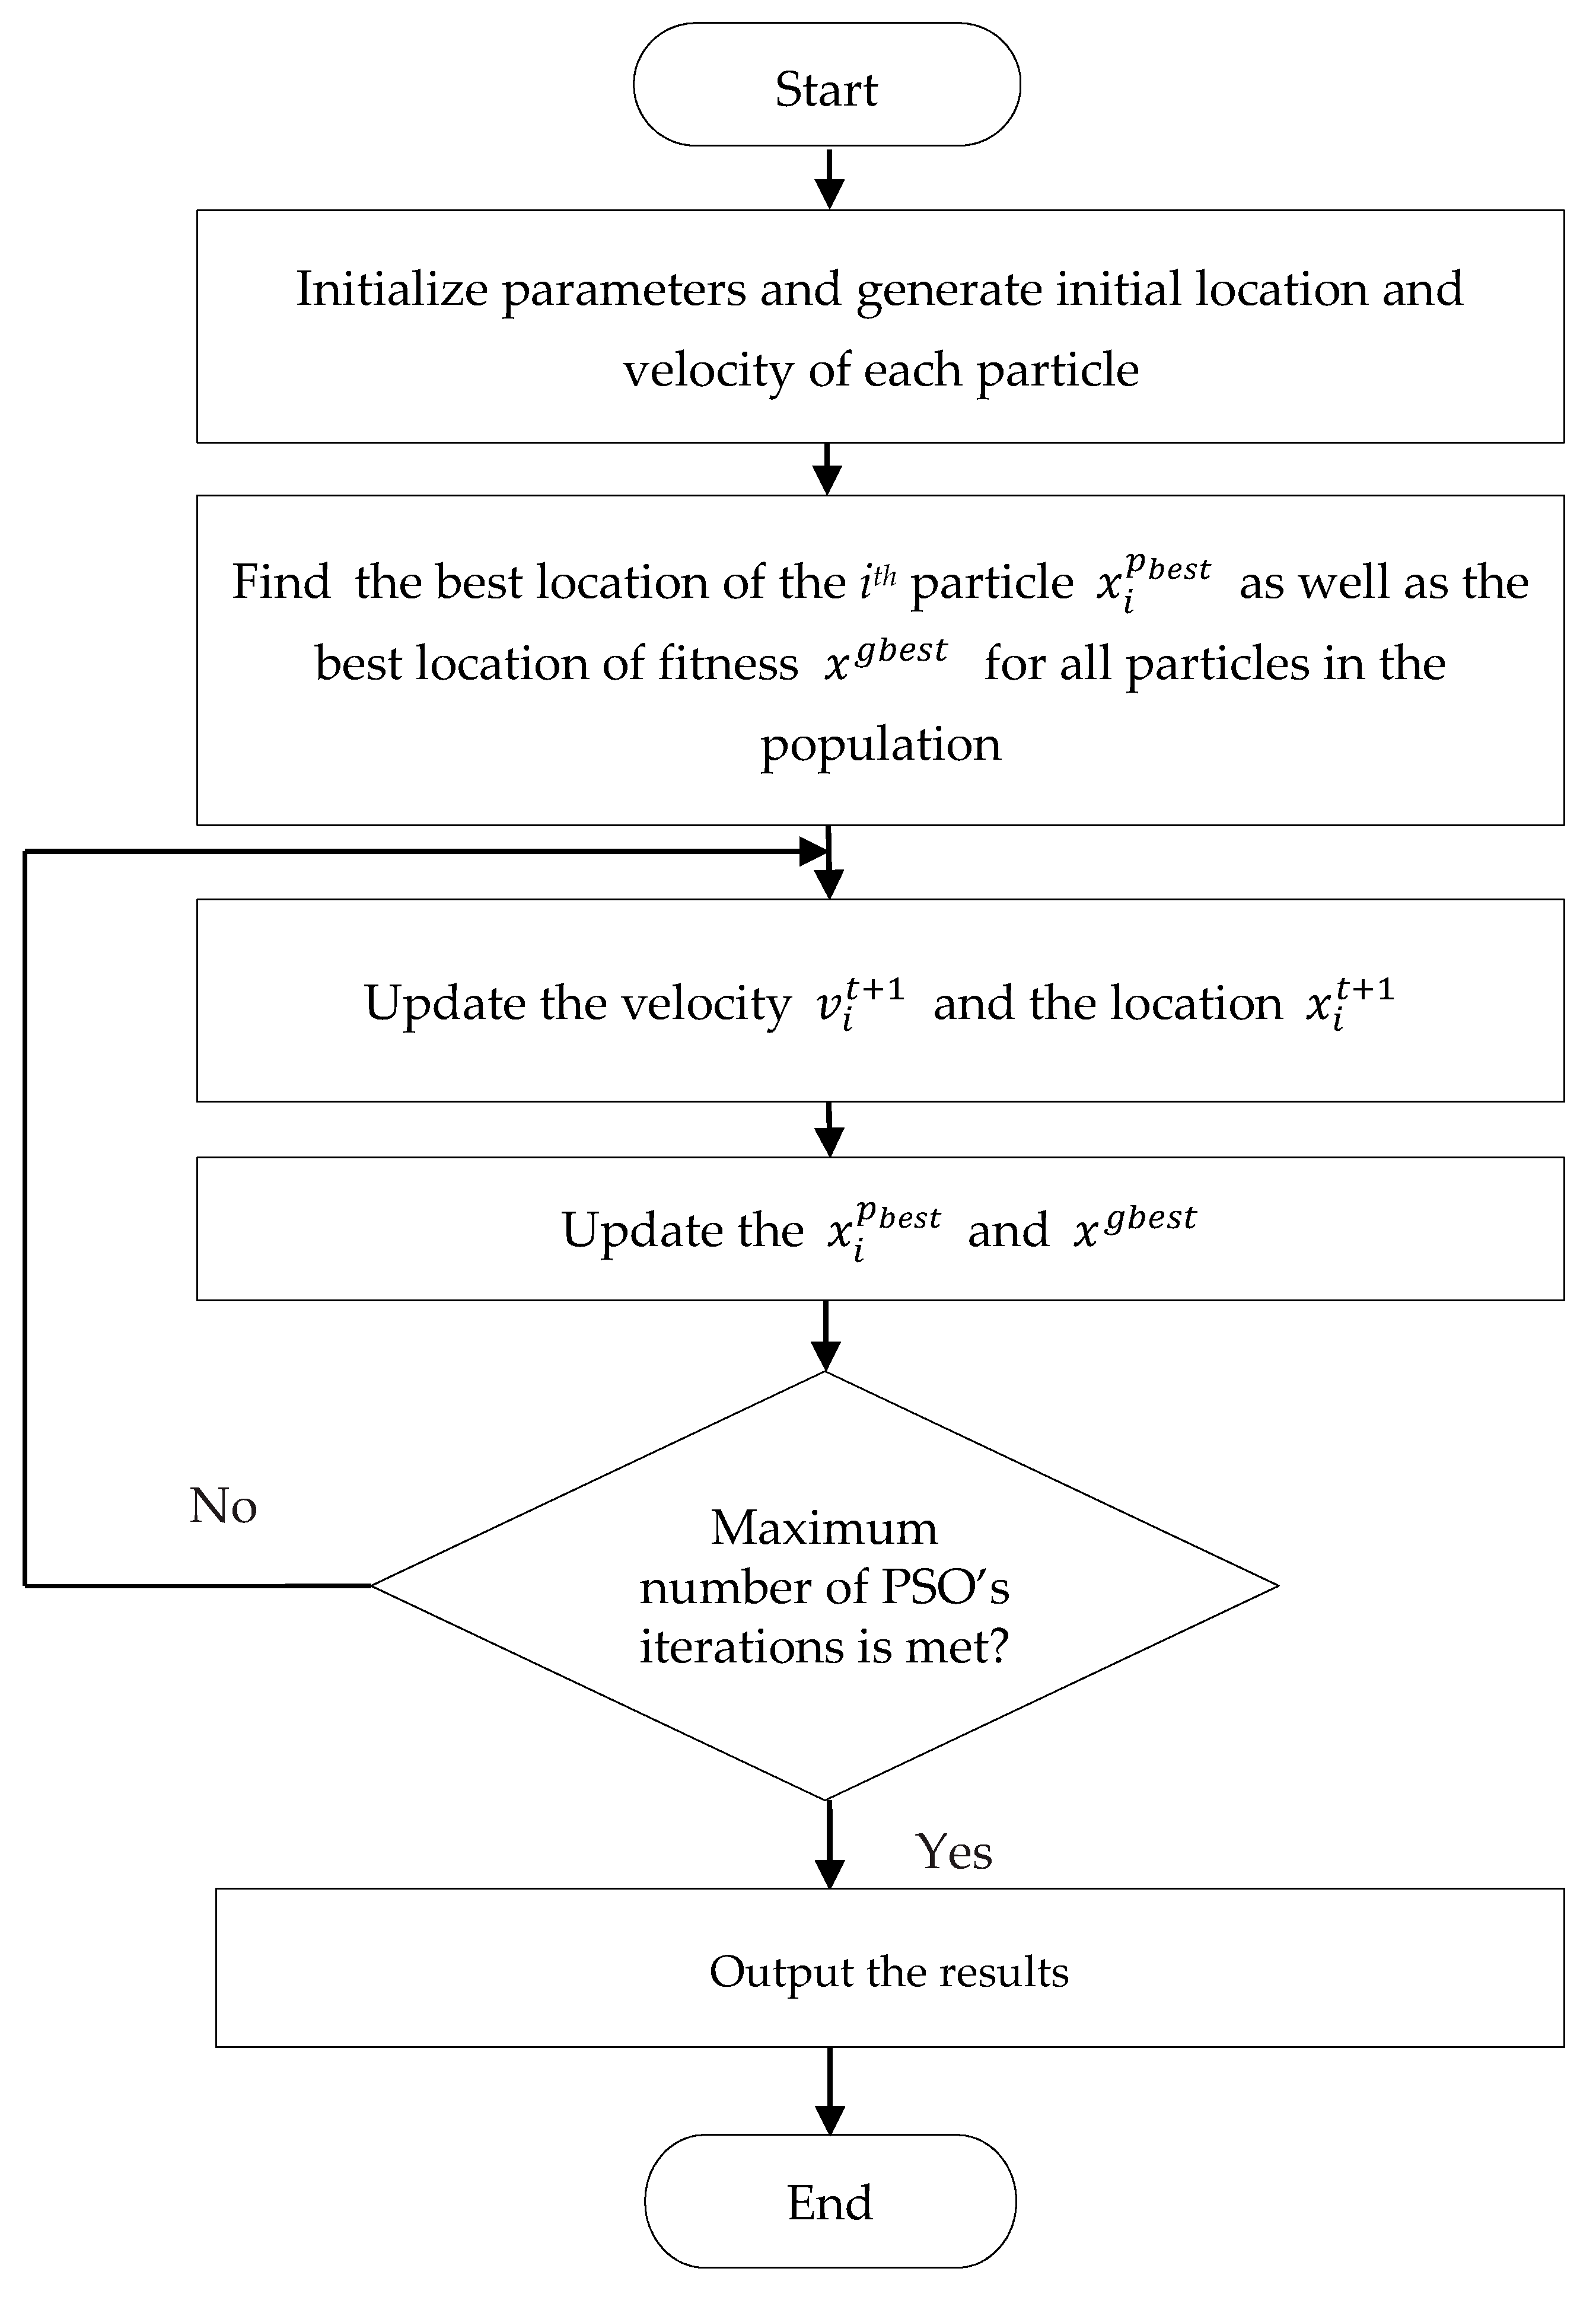
2.2. Particle Swarm Optimization
3. The Proposed Algorithm
3.1. Improvement of Chemotaxis Process
3.2. Improvement of Reproduction Process
3.3. Improvement of Elimination and Dispersal Process
- (1)
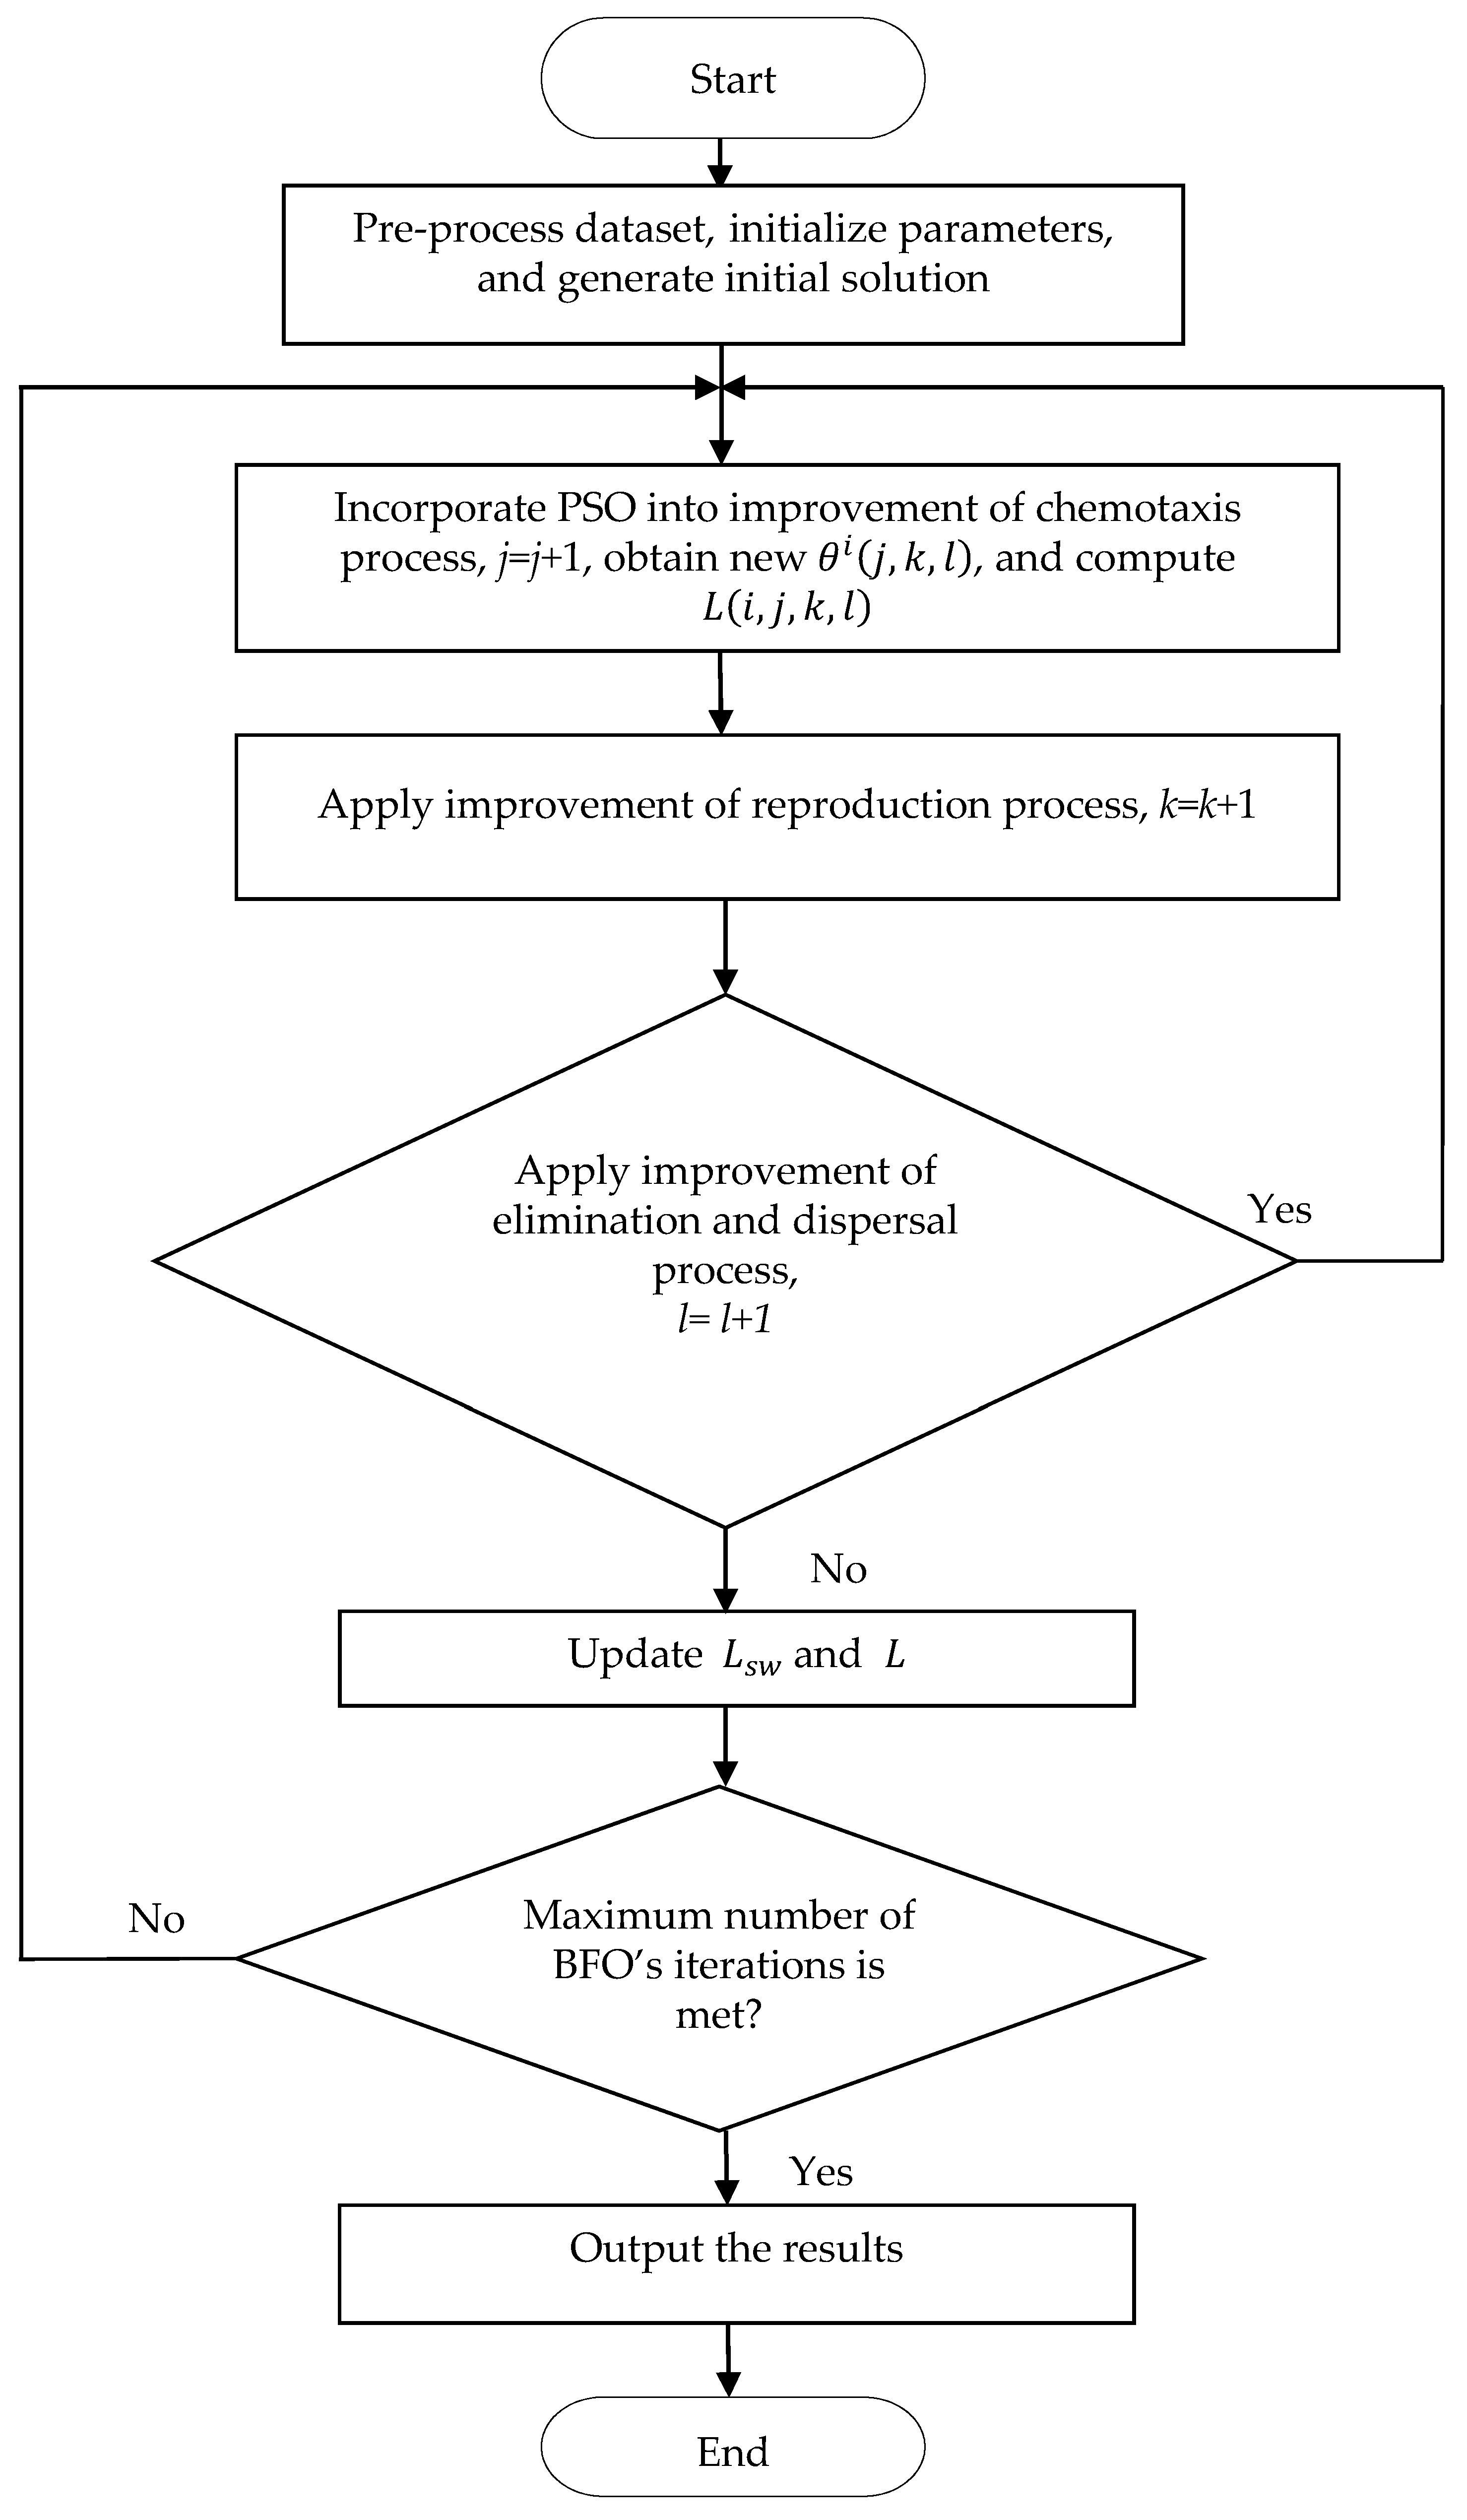
- The particle swarm population of size is initialized. Here, PSO is added to the chemotaxis process of each individual bacterium, and the swarm population size of PSO is the same as that of the BFO algorithm. The initial velocity and position of each particle is randomly generated. The maximum number of PSO iterations is . The BFO algorithm parameters ,, , and are set. The number of BFO iterations is .
- (2)
- The cost , defined as the classification accuracy of each particle, is calculated. The best location of the particle and the best location of the cost for all particles in the population are found. is updated and if and are improved.
- (3)
- Equation (4) is applied to update the velocity and Equation (5) is applied to update the location . In Equation (4), the velocity of each particle must be limited to the range of the set maximum velocity . If the velocity of each particle exceeds the limit, the velocity is expressed as .
- (4)
- If the set termination condition is met, it will stop; otherwise, the process goes back to step 2. The termination condition is usually to reach the best location of the cost for all particles in the population, or to exceed the set PSO’s maximum number of iterations . Through Equation (4) and Equation (5) particles treated as bacteria, PSO is completed to obtain the updated position . In other words, the PSO is performed to obtain the updated location of in the improved chemotaxis process.
- (5)
- In the swarming process, the cost of is evaluated by Equation (3).
- (6)
- In the improved reproduction process, Equation (8) is performed to increase the diversity of the population and avoid losing the best individual; in other words, the parent individual (excluding the best parent individual) crosses the best individual.
- (7)
- In the improved elimination–dispersal process, the population evolution factor is used in Equation (9). The new by PSO is generated according to (1 − ). In the improved BFO algorithm, is replaced with (1 − .
- (8)
- If the maximum number of BFO iterations is met, the algorithm is over. Finally, we output the classification accuracy results in this implementation.
4. Simulation Results and Discussion
4.1. Comparing and Analyzing the Classification Accuracy of the Proposed Algorithm and Other Methods
- (1)
- In addition to the proposed algorithm, we also employ other existing approaches for comparison. The approaches used include the support vector machine (SVM), DT, random forest (RF), KNN, and BFO. The SVM is a learning system that uses a hypothesis space of linear function in a high-dimensional feature space. DT uses partition information entropy minimization to recursively partition the dataset into smaller subdivisions and then generate a tree structure. RF is an ensemble learning method for classification that constructs multiple decision trees during training time and outputs the class that depends on the majority of the classes. KNN is a method used to classify objects based on the closest training examples in an n-dimensional pattern space. The BFO algorithm is described in Section 2.1.
- (2)
- Table 4, Table 5 and Table 6 list the classification performances of the ovarian cancer microarray data, spam email dataset, and zoo dataset, respectively. From Table 4, the average classification accuracy in the proposed algorithm for the ovarian cancer microarray data can be seen to be 93.47%. From Table 5, the average classification accuracy of the proposed algorithm for the spam email dataset can be seen to be 96.42%. As shown in Table 6, the average classification accuracy for the zoo dataset of the proposed algorithm is 99.54%. From Table 4, Table 5 and Table 6, it is clearly evident that the proposed approach has the best classification results given a fair comparison for all compared approaches. This is because the performance of the classification for the three tested datasets can be found based on intelligent information. In fact, the proposed approach has similar performance, meaning it performs well in classification accuracy.
- (3)
- In the comparison results it can be found that the classification accuracy of the original BFO method in Table 4 was 89.93%, which is not better than the proposed algorithm classification accuracy of 93.47%. In Table 5, the classification accuracy of the original BFO method can be seen to be 94.27%, which is not better than the proposed algorithm classification accuracy of 96.42%. In Table 6, the classification accuracy of the original BFO method can be seen to be 94.38%, which is not better than the proposed algorithm classification accuracy of 99.54%. Because the original BFO algorithm can change direction in the chemotaxis operation, its local search ability is better; the global search, however, can only rely on elimination and dispersal operation, and the global search ability is not very good. Hence, the classification accuracy is not better than the proposed algorithm.
- (4)
- The proposed algorithm provides a better classification effect because PSO is incorporated into the improved chemotaxis process. PSO has memory and global search abilities, so we first used particles for global search and then treat these particles as bacteria, and the chemotaxis operation improved the global search ability. The PSO algorithm introduced in this paper only uses its global operation and uses the memory of PSO to improve the bacterial search ability. In the improved reproduction operation, the crossover operator is introduced to the replica parent to increase the diversity of the population while the best individual is retained. In the improved elimination and dispersal operation, the (1 − ) replaces in the original BFO, and is introduced to prevent the population from dying and falling into a local optimum.
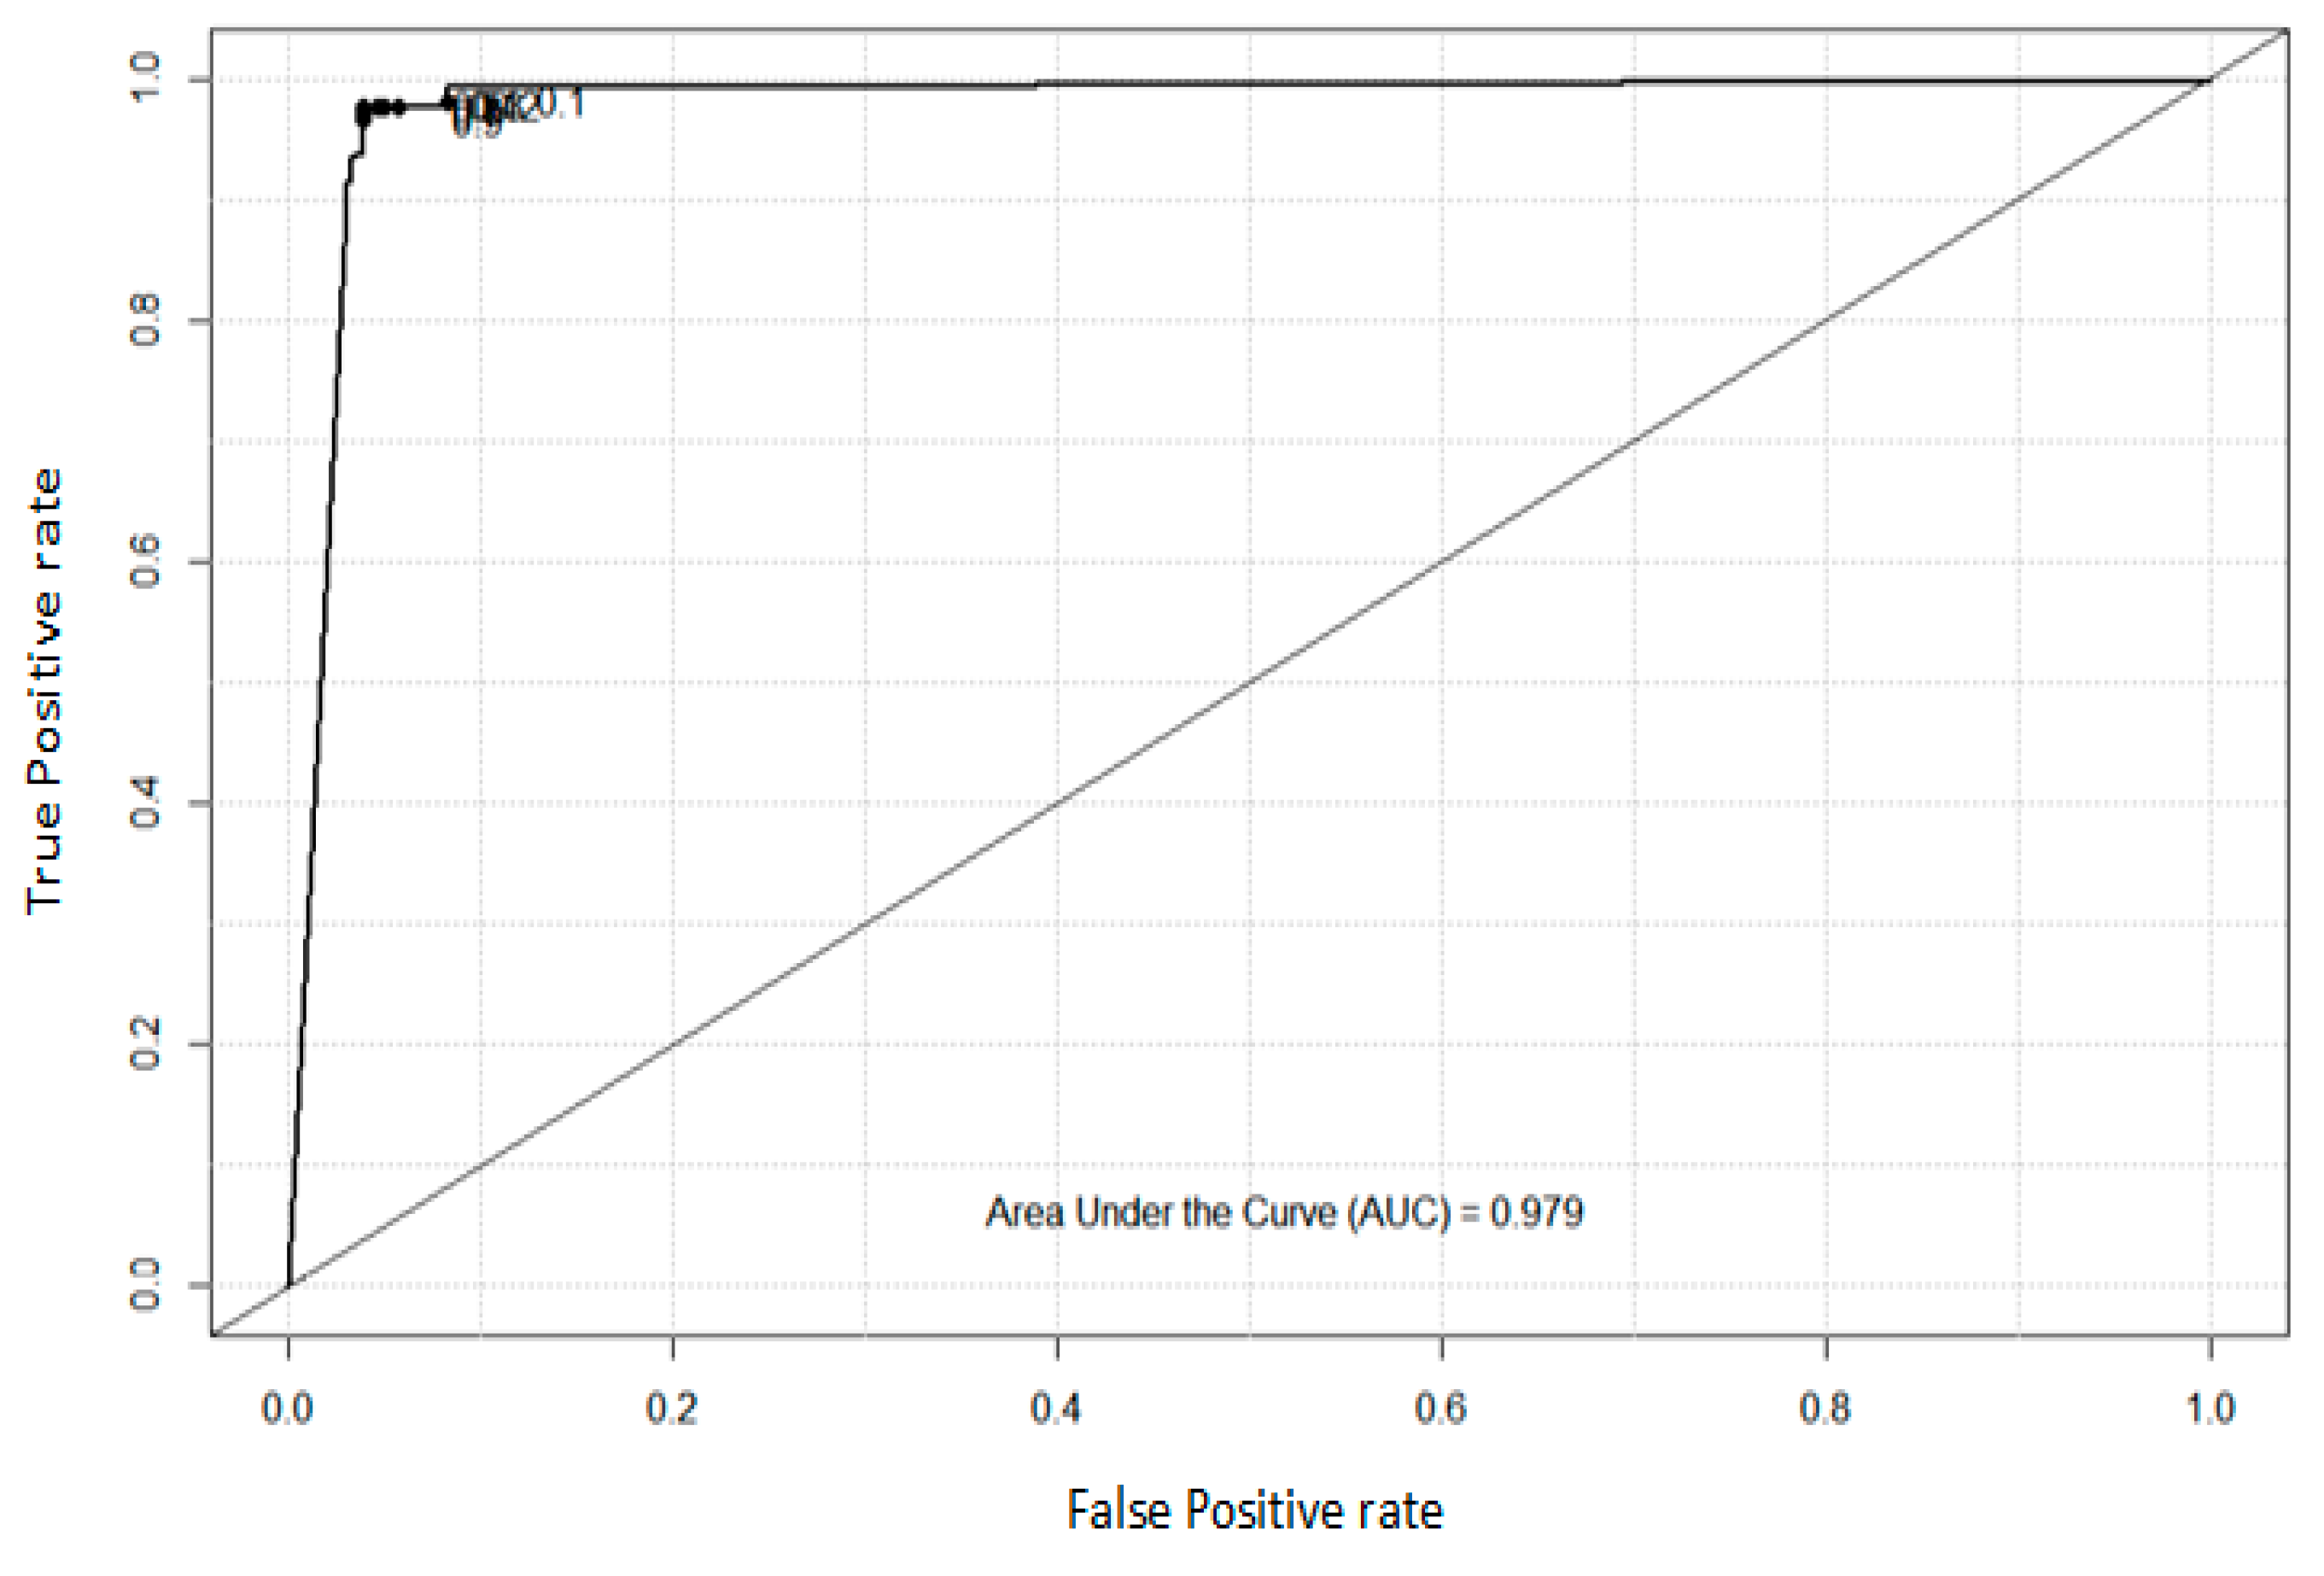
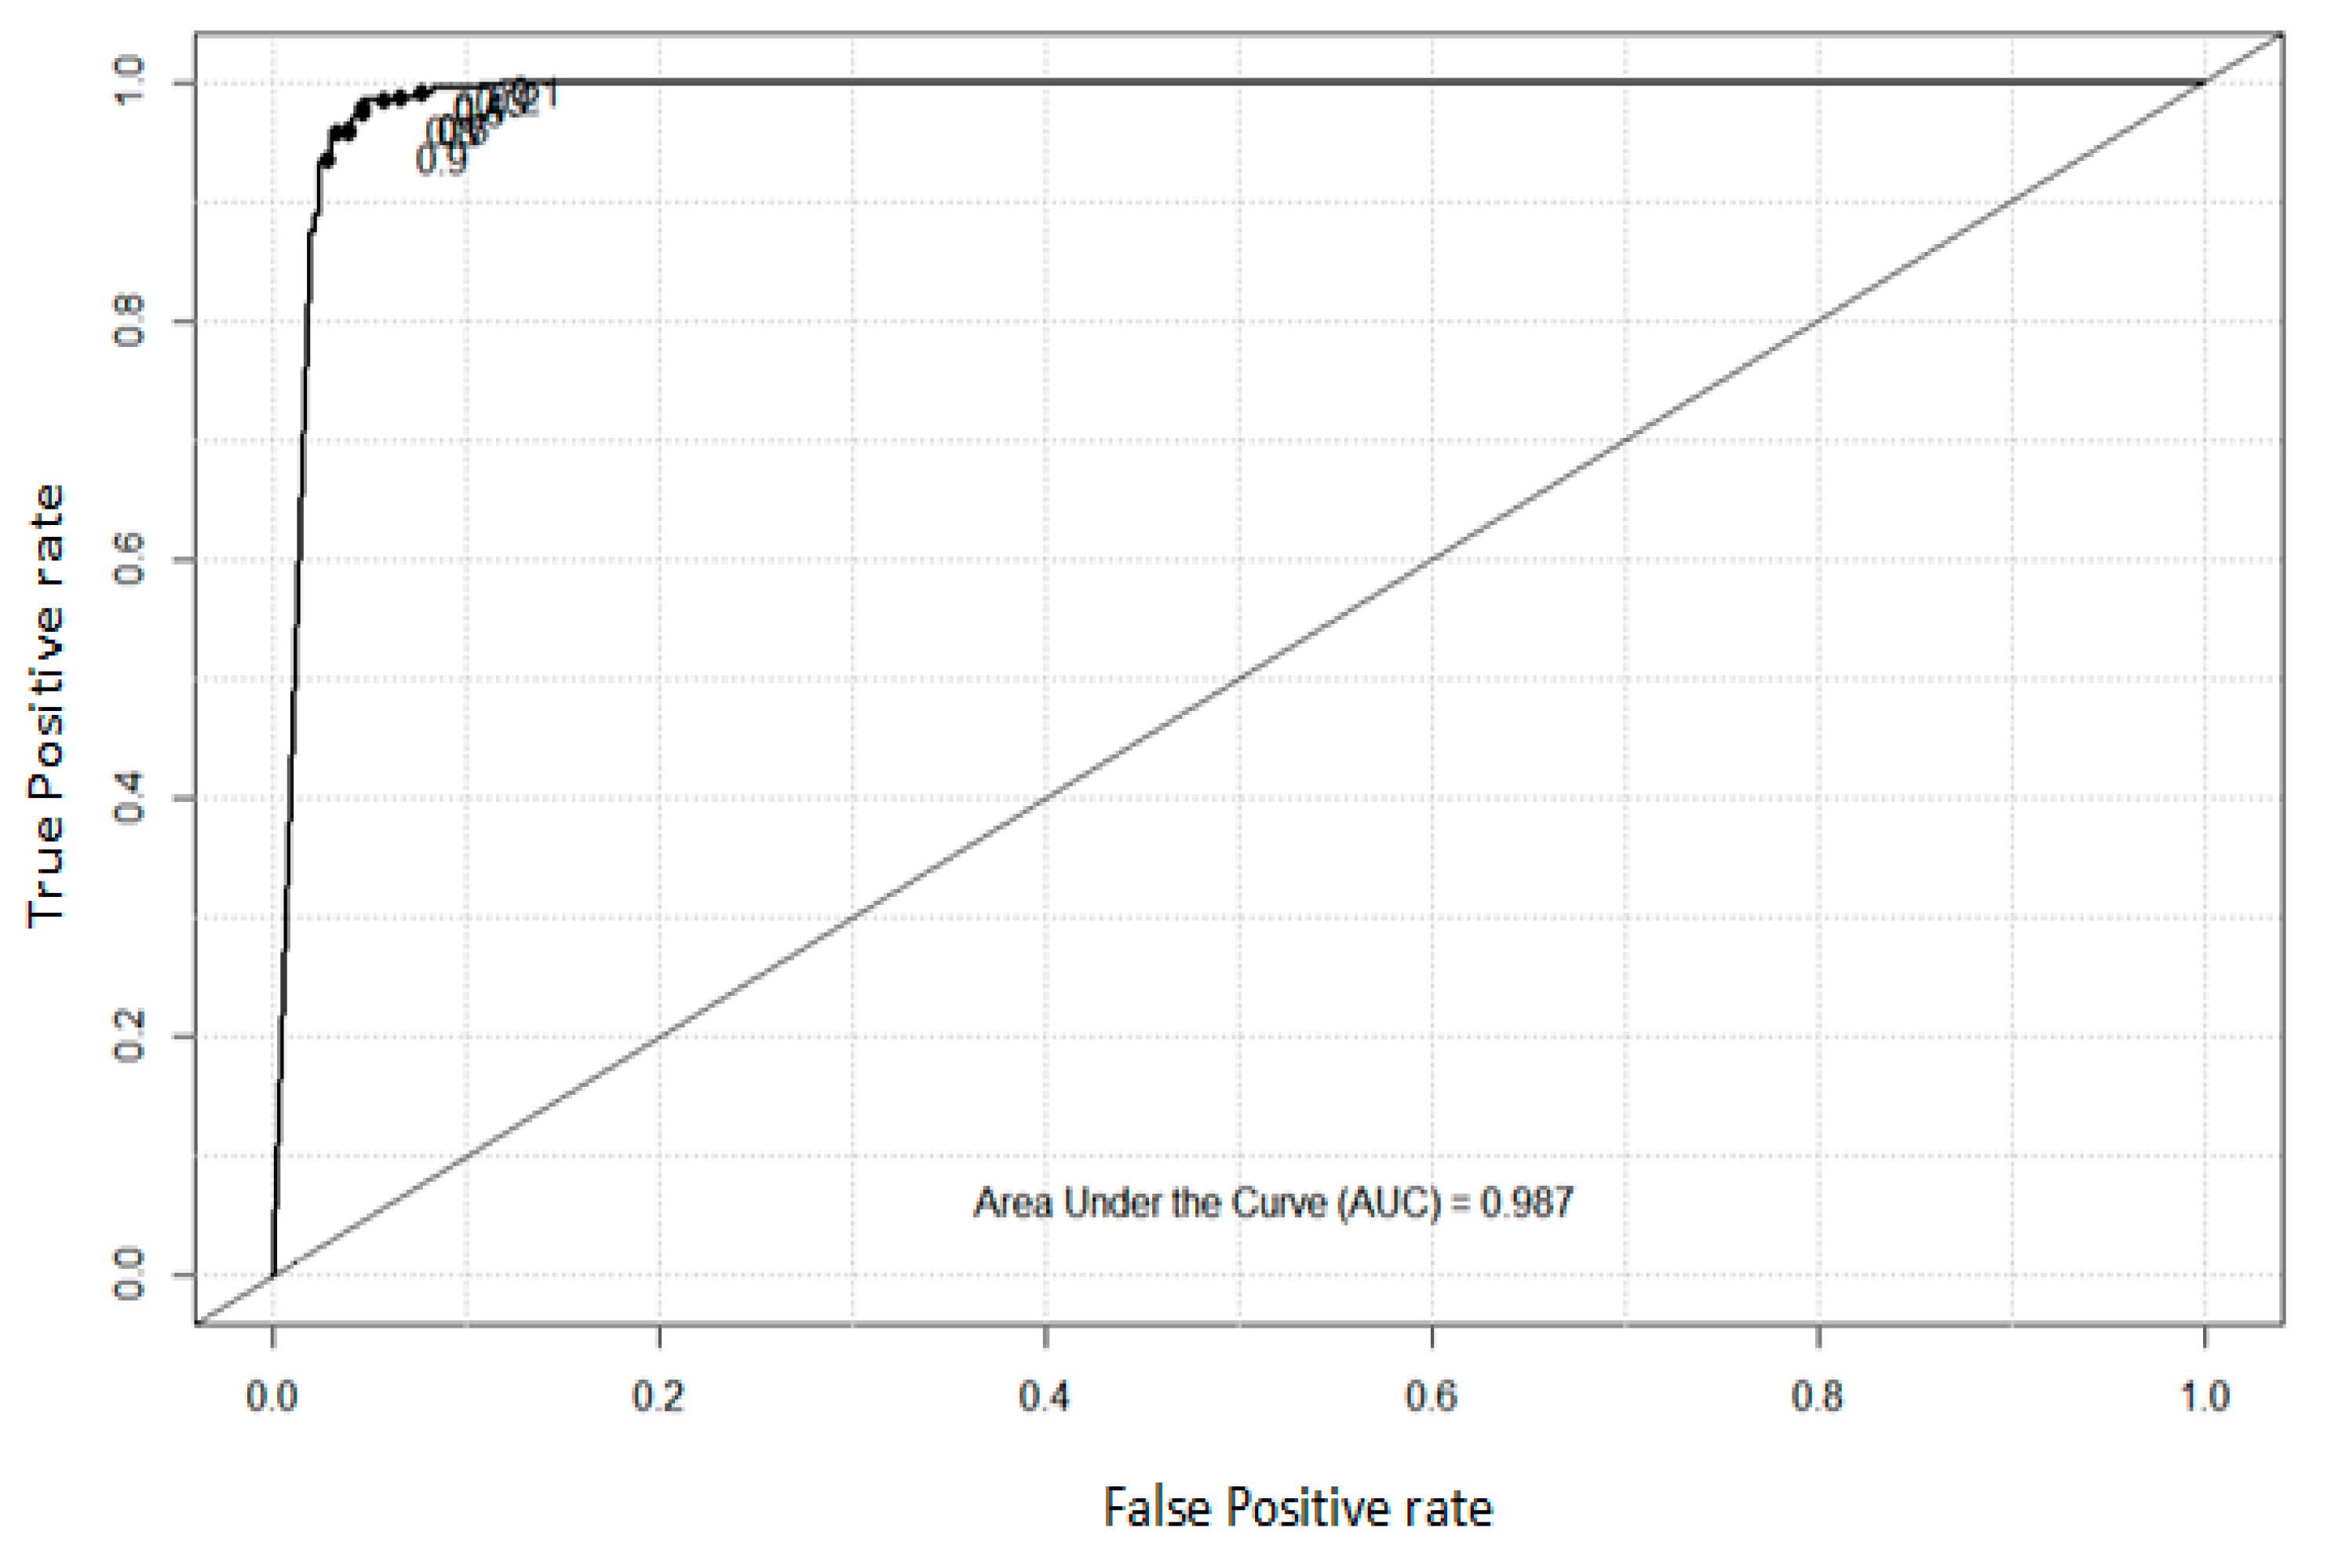
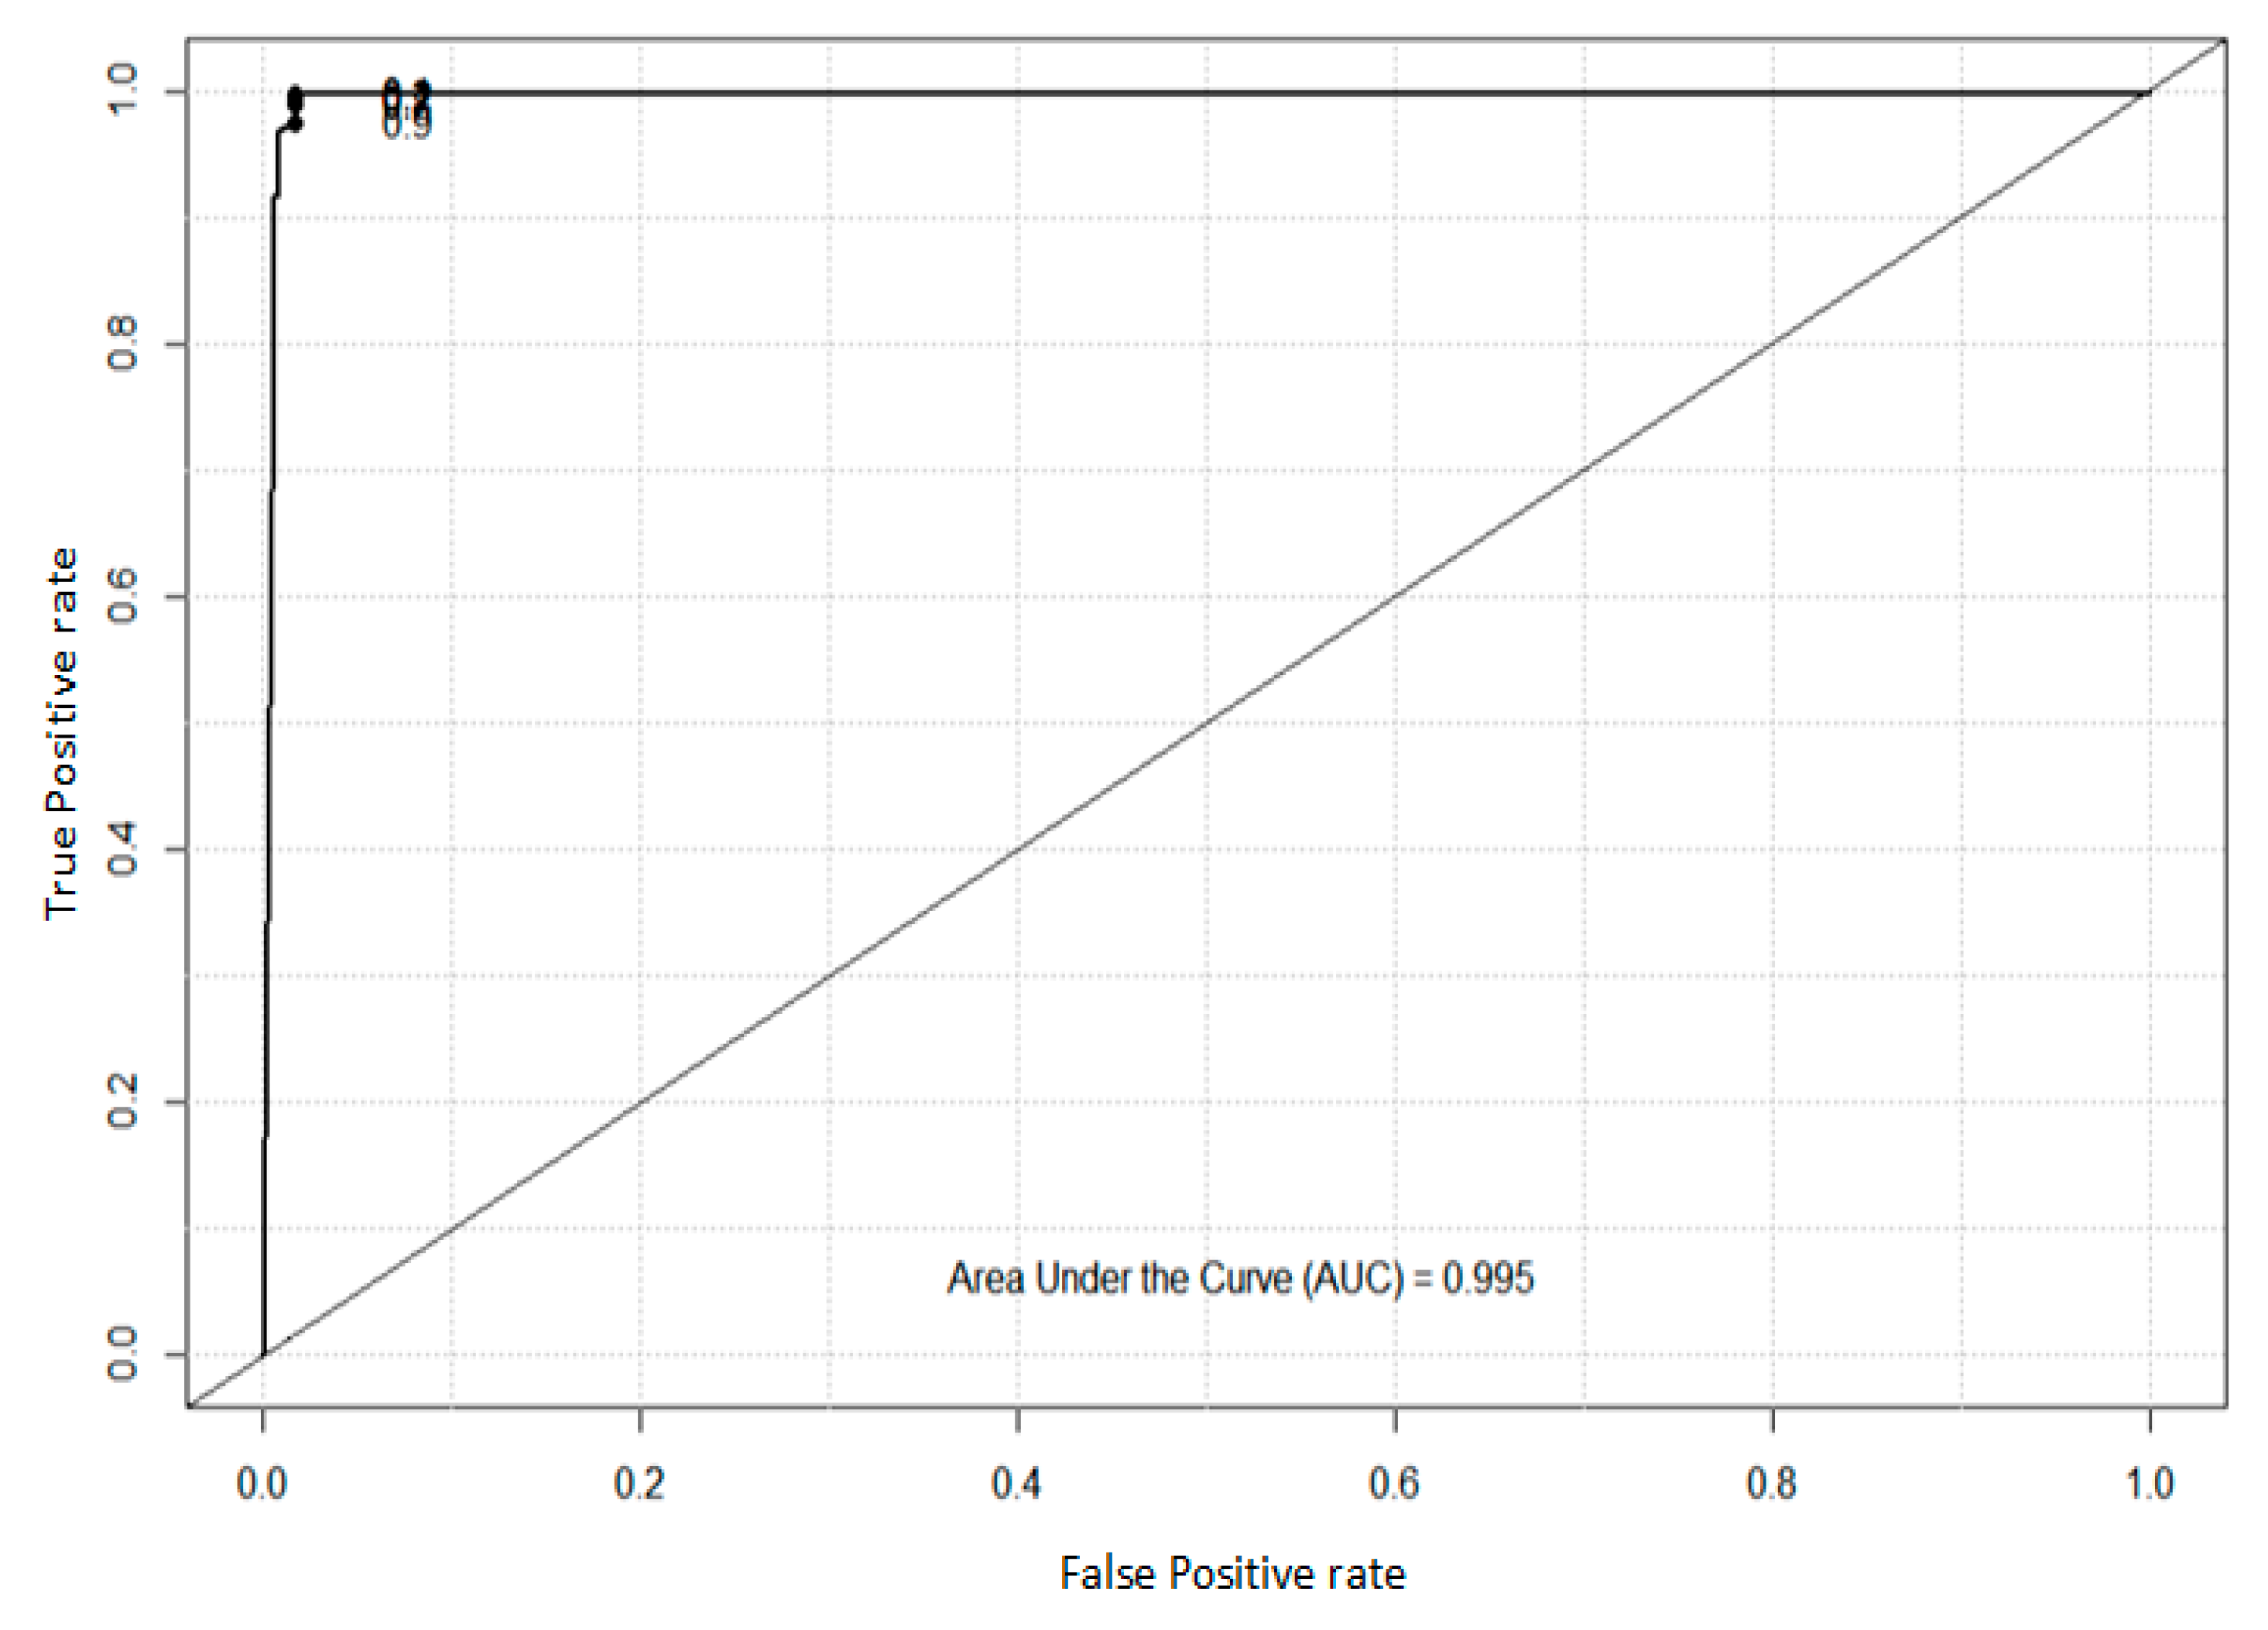
4.2. Analysis of ROC and AUC
5. Conclusions
- (1)
- Improvement of the algorithm’s operation: The key to implementing the optimization is the operation of the algorithm. Designing an excellent operation plays an important role in improving the performance and efficiency of the algorithm. In BFO, this will become a key area of research into BFO to improve chemotaxis and reproduction and the elimination and dispersal operation process, and to coordinate the local mining ability and global exploring ability of the processing algorithm.
- (2)
- Selection of algorithm parameters: The parameter value of the algorithm is key to the performance and efficiency of the algorithm. In evolutionary algorithms, there is no general method to determine the optimal parameters of the algorithm. At present, there are many BFO parameters. Determining the optimal parameters of BFO to optimize the performance of the algorithm itself is a complex optimization problem.
- (3)
- Combining with other algorithms: Combining the advantages of BFO and other algorithms to propose more efficient algorithms is a valuable topic in BFO research.
Author Contributions
Funding
Acknowledgments
Conflicts of Interest
References
- Hu, J.J.; Yang, H.Q.; Lyu, M.R.; King, I.R.; So, A.M.C. Online Nonlinear AUC Maximization for Imbalanced Data Sets. IEEE Trans. Neural Netw. Learn. Syst. 2018, 29, 882–895. [Google Scholar] [CrossRef]
- Huang, X.L.; Zou, Y.X.; Wang, Y. Cost-sensitive sparse linear regression for crowd counting with imbalanced training data. In Proceedings of the 2016 IEEE International Conference on Multimedia and Expo (ICME), Seattle, WA, USA, 11–15 July 2016. [Google Scholar]
- Padmaja, T.M.; Dhulipalla, N.; Bapi, R.S.; Krishna, P.R. Imbalanced data classification using extreme outlier elimination and sampling techniques for fraud detection. In Proceedings of the International Conference on Advanced Computing and Communications, Guwahati, India, 18–21 December 2007; pp. 511–516. [Google Scholar]
- Lin, S.W.; Ying, K.C.; Lee, C.Y.; Lee, Z.J. An intelligent algorithm with feature selection and decision rules applied to anomaly intrusion detection. Appl. Soft Comput. 2012, 12, 3285–3290. [Google Scholar] [CrossRef]
- Lee, C.Y.; Lee, Z.J. A Novel Algorithm Applied to Classify Unbalanced Data. Appl. Soft Comput. 2012, 12, 2481–2485. [Google Scholar] [CrossRef]
- Zhang, Y.; Wu, L. Stock market prediction of S&P 500 via combination of improved BCO approach and BP neural network. Expert Syst. Appl. 2009, 36, 8849–8854. [Google Scholar]
- Xia, C.Q.; Han, K.; Qi, Y.; Zhang, Y.; Yu, D.J. A Self-Training Subspace Clustering Algorithm under Low-Rank Representation for Cancer Classification on Gene Expression Data. IEEE/ACM Trans. Comput. Biol. Bioinform. 2018, 15, 1315–1324. [Google Scholar] [CrossRef] [PubMed]
- Esfahani, M.S.; Dougherty, E.R. Incorporation of Biological Pathway Knowledge in the Construction of Priors for Optimal Bayesian Classification. IEEE/ACM Trans. Comput. Biol. Bioinform. 2014, 11, 202–218. [Google Scholar] [CrossRef] [PubMed]
- Sadreazami, H.; Mohammadi, A.; Asif, A.; Plataniotis, K.N. Distributed-Graph-Based Statistical Approach for Intrusion Detection in Cyber-Physical Systems. IEEE Trans. Signal Inform. Process. Netw. 2018, 4, 137–147. [Google Scholar] [CrossRef]
- Mathew, J.; Pang, C.K.; Luo, M.; Leong, W.H. Classification of imbalanced data by oversampling in kernel space of support vector machines. IEEE Trans. Neural Netw. Learn. Syst. 2018, 29, 4065–4076. [Google Scholar] [CrossRef]
- Zhang, J.; Bloedorn, E.; Rosen, L.; Venese, D. Learning rules from highly imbalanced data sets. In Proceedings of the Fourth IEEE International Conference on Data Mining, ICDM’04, Brighton, UK, 1–4 November 2004; Volume 1, pp. 571–574. [Google Scholar]
- Jiang, Y.; Zhou, Z.H. Editing training data for kNN classifiers with neural network ensemble. In Proceedings of the International Symposium on Neural Networks, Dalian, China, 19–21 August 2004; Volume 1, pp. 356–361. [Google Scholar]
- Tao, Q.; Wu, G.W.; Wang, F.Y.; Wang, J. Posterior probability support vector Machines for imbalanced data. IEEE Trans. Neural Netw. 2005, 16, 1561–1573. [Google Scholar] [CrossRef]
- Zhang, J.; Mani, I. kNN approach to imbalanced data distributions: A case study involving information extraction. In Proceedings of the ICML’2003 Workshop on Learning from Imbalanced Datasets, Washington, DC, USA, 21 August 2003. [Google Scholar]
- Elaidi, H.; Elhaddar, Y.; Benabbou, Z.; Abbar, H. An idea of a clustering algorithm using support vector machines based on binary decision tree. In Proceedings of the 2018 International Conference on Intelligent Systems and Computer Vision (ISCV), Fez, Morocco, 2–4 April 2018; pp. 1–5. [Google Scholar]
- Ye, D.; Chen, Z. A rough set based minority class oriented learning algorithm for highly imbalanced data sets. In Proceedings of the IEEE International Conference on Granular Computing, Hangzhou, China, 26–28 August 2008; pp. 736–739. [Google Scholar]
- Yang, X.; Song, Q.; Cao, A. Clustering nonlinearly separable and imbalanced data set. In Proceedings of the 2004 2nd International IEEE Conference on Intelligent Systems, Varna, Bulgaria, 22–24 June 2004; Volume 2, pp. 491–496. [Google Scholar]
- Lu, Y.; Guo, H.; Feldkamp, L. Robust neural learning from imbalanced data samples. In Proceedings of the 1998 IEEE International Joint Conference on Neural Networks, Anchorage, AK, USA, 4–9 May 1998; Volume 3, pp. 1816–1821. [Google Scholar]
- Wang, J.; Jean, J. Resolve multifont character confusion with neural network. Pattern Recognit. 1993, 26, 173–187. [Google Scholar] [CrossRef]
- Searle, S.R. Linear Models for Unbalanced Data; Wiley: New York, NY, USA, 1987. [Google Scholar]
- Wang, J.; Miyazaki, M.; Kameda, H.; Li, J. Improving performance of parallel transaction processing systems by balancing data load on line. In Proceedings of the Seventh International Conference on Parallel and Distributed Systems, Taipei, Taiwan, 4–7 December 2000; pp. 331–338. [Google Scholar]
- Crepinsek, M.; Liu, S.H.; Mernik, M. Replication and comparison of computational experiments in applied evolutionary computing: Common pitfalls and guidelines to avoid them. Appl. Soft Comput. 2014, 19, 161–170. [Google Scholar] [CrossRef]
- De Corte, A.; Sörensen, K. Optimisation of gravity-fed water distribution network design: A critical review. Eur. J. Oper. Res. 2013, 228, 1–10. [Google Scholar] [CrossRef]
- Kennedy, J.; Eberhart, R.C. A discrete binary version of the particle swarm algorithm. In Proceedings of the 1997 IEEE International Conference on Systems, Man, and Cybernetics. Computational Cybernetics and Simulation, Orlando, FL, USA, 12–15 October 1997; Volume 5. [Google Scholar]
- Eberhart, R.; Kennedy, J. A new optimizer using particle swarm theory. In Proceedings of the Sixth International Symposium on Micro Machine and Human Science (MHS’ 95), Nagoya, Japan, 4–6 October 1995. [Google Scholar]
- Jia, J.Y.; Zhao, A.W.; Guan, S.A. Forecasting Based on High-Order Fuzzy-Fluctuation Trends and Particle Swarm Optimization Machine Learning. Symmetry 2017, 9, 124. [Google Scholar] [CrossRef]
- Xue, H.X.; Bai, Y.P.; Hu, H.P.; Xu, T.; Liang, H.J. A Novel Hybrid Model Based on TVIW-PSO-GSA Algorithm and Support Vector Machine for Classification Problems. IEEE Access 2019, 7, 27789–27801. [Google Scholar] [CrossRef]
- Kim, J.J.; Lee, J.J. Trajectory Optimization with Particle Swarm Optimization for Manipulator Motion Planning. IEEE Trans. Ind. Inform. 2015, 11, 620–631. [Google Scholar] [CrossRef]
- Liu, H.M.; Yan, X.S.; Wu, Q.H. An Improved Pigeon-Inspired Optimisation Algorithm and Its Application in Parameter Inversion. Symmetry 2019, 11, 1291. [Google Scholar] [CrossRef]
- Salleh, I.; Belkourchia, Y.; Azrar, L. Optimization of the shape parameter of RBF based on the PSO algorithm to solve nonlinear stochastic differential equation. In Proceedings of the 2019 5th International Conference on Optimization and Applications (ICOA), Kenitra, Morocco, 25–26 April 2019. [Google Scholar]
- Medoued, A.; Lebaroud, A.; Laifa, A.; Sayad, D. Feature form extraction and optimization of induction machine faults using PSO technique. In Proceedings of the 2013 3rd International Conference on Electric Power and Energy Conversion Systems, Istanbul, Turkey, 2–4 October 2013. [Google Scholar]
- Yeom, C.U.; Kwak, K.C. Incremental Granular Model Improvement Using Particle Swarm Optimization. Symmetry 2019, 11, 390. [Google Scholar] [CrossRef]
- Lee, J.H.; Kim, J.W.; Song, J.Y. Distance-Based Intelligent Particle Swarm Optimization for Optimal Design of Permanent Magnet Synchronous Machine. IEEE Trans. Magn. 2017, 53, 1–4. [Google Scholar] [CrossRef]
- Yu, X.; Chen, W.N.; Gu, T.L. Set-Based Discrete Particle Swarm Optimization Based on Decomposition for Permutation-Based Multiobjective Combinatorial Optimization Problems. IEEE Trans. Cybern. 2018, 48, 2139–2153. [Google Scholar] [CrossRef]
- Shi, Y.; Eberhart, R. A modified particle swarm optimizer. Proceeding of the 1998 IEEE International Conference on Evolutionary Computation, World Congress on Computational Intelligence, Anchorage, AK, USA, 4–9 May 1998. [Google Scholar]
- Passino, K.M. Biomimicry of bacterial foraging for distributed optimization and control. IEEE Control Syst. Mag. 2002, 22, 52–67. [Google Scholar]
- Abraham, A.; Biswas, A.; Dasgupta, S. Analysis of reproduction operator in bacterial foraging optimization algorithm. In Proceedings of the IEEE World Congress on Computational Intelligence, Hong Kong, China, 1–6 June 2008; pp. 1476–1483. [Google Scholar]
- Bidyadhar, S.I.; Raseswari, P. Bacterial Foraging Optimization Approach to Parameter Extraction of a Photovoltaic Module. IEEE Trans. Sustain. Energy 2018, 9, 381–389. [Google Scholar]
- Noguchi, T.; Togashi, S.; Nakamoto, R. Based maximum power point tracking method for multiple photovoltaic and converter module system. IEEE Trans. Ind. Electron. 2002, 49, 217–222. [Google Scholar] [CrossRef]
- Raza, A.; Yousaf, Z.; Jamil, M. Multi-Objective Optimization of VSC Stations in Multi-Terminal VSC-HVdc Grids, Based on PSO. IEEE Access 2018, 6, 62995–63004. [Google Scholar] [CrossRef]
- Lu, S.J. Gene Expression Analysis and Regulator Pathway Exploration with the Use of Microarray Data for Ovarian Cancer. Master’s Thesis, National Taiwan University of Science and Technology, Taipei, Taiwan, 2006. [Google Scholar]
- Lee, Z.J. An integrated algorithm for gene selection and classification applied to microarray data of ovarian cancer. Int. J. Artif. Intell. Med. 2008, 42, 81–93. [Google Scholar] [CrossRef] [PubMed]
- Blake, C.; Keogh, E.; Merz, C.J. UCI Repository of Machine learning Databases; Department of Information and Computer Science, University of California: Irvine, CA, USA, 1998; Available online: https://archive.ics.uci.edu/ml/datasets.php (accessed on 24 December 2019).
- Gosain, A.; Sardana, S. Farthest SMOTE: A modified SMOTE approach. In Computational Intelligence in Data Mining; Springer: Singapore, 2019; pp. 309–320. [Google Scholar]
- Devi, D.; Purkayastha, B. Redundancy-driven modified Tomek link based undersampling: A solution to class imbalance. Pattern Recogn. Lett. 2017, 93, 3–12. [Google Scholar] [CrossRef]
- Liu, L.; Shan, L.; Yan, J.H. An Improved BFO Algorithm for Optimising the PID Parameters of Servo System. In Proceedings of the IEEE the 30th Chinese Control and Decision Conference (2018 CCDC), Shenyang, China, 9–11 June 2018; pp. 3831–3836. [Google Scholar]
- Abd-Elazim, S.M.; Ali, E.S. A hybrid particle swarm optimization and bacterial foraging for power system stability enhancement. Complexity 2015, 21, 245–255. [Google Scholar] [CrossRef]


| Number | Meaning | Range | Maximum Value |
|---|---|---|---|
| 1–48 | Frequency of occurrence of a particular word | [0, 100] | <100 |
| 49–54 | Frequency of occurrence of a particular character | [0, 100] | <100 |
| 55 | Travel length of capital letters | [1, …] | 1102.5 |
| 56 | Longest capital travel | [1, …] | 9989 |
| 57 | Total travel length of capital letters | [1, …] | 15,841 |
| 58 | Spam ID (1 for spam) | [0, 1] | 1 |
| Number | Feature Name | Data Type |
|---|---|---|
| 1 | Animal name | Continuous |
| 2 | Hair | Nominal |
| 3 | Feathers | Continuous |
| 4 | Eggs | Nominal |
| 5 | Milk | Nominal |
| 6 | Airborne | Nominal |
| 7 | Aquatic | Nominal |
| 8 | Predator | Nominal |
| 9 | Toothed | Nominal |
| 10 | Backbone | Nominal |
| 11 | Breathes | Nominal |
| 12 | Venomous | Nominal |
| 13 | Fins | Nominal |
| 14 | Legs | Nominal |
| 15 | Tail | Nominal |
| 16 | Domestic | Nominal |
| 17 | Catsize | Nominal |
| Predicted | Actual Positive | Active Negative | |
|---|---|---|---|
| Actual | |||
| Predicted positive | TP (true positive) | FP (false positive) | |
| Predicted negative | FN(false negative) | TN (true negative) | |
| Approaches | Classification Accuracy |
|---|---|
| SVM | 88.45% |
| DT | 85.71% |
| RF | 83.66% |
| KNN | 80.88% |
| BFO | 89.93% |
| The proposed algorithm | 93.47% |
| Approaches | Classification Accuracy |
|---|---|
| SVM | 93.51% |
| DT | 90.83% |
| RF | 91.68% |
| KNN | 90.64% |
| BFO | 94.27% |
| The proposed algorithm | 96.42% |
| Approaches | Classification Accuracy |
|---|---|
| SVM | 93.55% |
| DT | 92.71% |
| RF | 90.32% |
| KNN | 91.46% |
| BFO | 94.38% |
| The proposed algorithm | 99.54% |
© 2020 by the authors. Licensee MDPI, Basel, Switzerland. This article is an open access article distributed under the terms and conditions of the Creative Commons Attribution (CC BY) license (http://creativecommons.org/licenses/by/4.0/).
Share and Cite
Ye, F.-L.; Lee, C.-Y.; Lee, Z.-J.; Huang, J.-Q.; Tu, J.-F. Incorporating Particle Swarm Optimization into Improved Bacterial Foraging Optimization Algorithm Applied to Classify Imbalanced Data. Symmetry 2020, 12, 229. https://doi.org/10.3390/sym12020229
Ye F-L, Lee C-Y, Lee Z-J, Huang J-Q, Tu J-F. Incorporating Particle Swarm Optimization into Improved Bacterial Foraging Optimization Algorithm Applied to Classify Imbalanced Data. Symmetry. 2020; 12(2):229. https://doi.org/10.3390/sym12020229
Chicago/Turabian StyleYe, Fu-Lan, Chou-Yuan Lee, Zne-Jung Lee, Jian-Qiong Huang, and Jih-Fu Tu. 2020. "Incorporating Particle Swarm Optimization into Improved Bacterial Foraging Optimization Algorithm Applied to Classify Imbalanced Data" Symmetry 12, no. 2: 229. https://doi.org/10.3390/sym12020229
APA StyleYe, F.-L., Lee, C.-Y., Lee, Z.-J., Huang, J.-Q., & Tu, J.-F. (2020). Incorporating Particle Swarm Optimization into Improved Bacterial Foraging Optimization Algorithm Applied to Classify Imbalanced Data. Symmetry, 12(2), 229. https://doi.org/10.3390/sym12020229