Article

Applying Educational Data Mining to Explore Students’ Learning Patterns in the Flipped Learning Approach for Coding Education

1
Graduate Institute of Network Learning Technology, National Central University, Taoyuan City 320, Taiwan
2
Center for General Education, Taipei Medical University, Taipei City 110, Taiwan
3
Graduate Institute of Data Science, Taipei Medical University, Taipei City 110, Taiwan
4
Department of Computer Science and Engineering, National Taiwan Ocean University, Keelung City 202, Taiwan
*
Author to whom correspondence should be addressed.
Symmetry 2020, 12(2), 213; https://doi.org/10.3390/sym12020213
Submission received: 31 December 2019 / Revised: 21 January 2020 / Accepted: 28 January 2020 / Published: 2 February 2020
(This article belongs to the Special Issue Selected Papers from IIKII 2019 conferences in Symmetry)

Abstract

:
From traditional face-to-face courses, asynchronous distance learning, synchronous live learning, to even blended learning approaches, the learning approach can be more learner-centralized, enabling students to learn anytime and anywhere. In this study, we applied educational data mining to explore the learning behaviors in data generated by students in a blended learning course. The experimental data were collected from two classes of Python programming related courses for first-year students in a university in northern Taiwan. During the semester, high-risk learners could be predicted accurately by data generated from the blended educational environment. The f1-score of the random forest model was 0.83, which was higher than the f1-score of logistic regression and decision tree. The model built in this study could be extrapolated to other courses to predict students’ learning performance, where the F1-score was 0.77. Furthermore, we used machine learning and symmetry-based learning algorithms to explore learning behaviors. By using the hierarchical clustering heat map, this study could define the students’ learning patterns including the positive interactive group, stable learning group, positive teaching material group, and negative learning group. These groups also corresponded with the student conscious questionnaire. With the results of this research, teachers can use the mid-term forecasting system to find high-risk groups during the semester and remedy their learning behaviors in the future.

1. Introduction

With the development of the Internet, emerging forms of distance education can eliminate the geographical and temporal separation between two learners, and the knowledge can be transmitted to all corners of the world through the teaching environment of the online platform. Furthermore, another significant advantage of the Internet is that the teaching will be transformed from teacher-centered to learner-centered [1]. Distance learning enables learners to more flexibly manage their time and progress, and choose the time and place to learn. Therefore, it also improves the shortcomings of the traditional educational environment such as a lack of flexibility, limited delivery distance, and inability to repeat learning [2].
However, traditional asynchronized distance teaching has its disadvantages. For example, the learner’s problem can be answered by message or by mail, however, it takes a longer time when compared to the face-to-face environment where learners can ask questions and obtain answers immediately, as the teacher cannot grasp it instantly. With the advancement of technology, the synchronous distance learning (live) environment has become another choice for the teaching environment. The advantages of the live broadcast environment include providing innovative learning models, motivating learners, providing formal multi-learning materials, and making the learner reflect [3]. In the live broadcast environment, learners can ask questions to the instructor promptly under the live broadcast, and the instructor can respond promptly. Compared with asynchronous learning, students can ask questions more freely. Discussing the teaching content of the teacher with other students does not affect the learning quality of other students, and the students can respond to the teaching content of the teacher so that the instructor can immediately see whether the teaching content is correctly transmitted. Immediate response is unattainable in traditional face-to-face and non-synchronous distance learning [4].
Additionally, a chat box in the learning management system can become a conduit for communication between learners. The live environment breaks this gap, and learners can instantly exchange ideas and explain questions with others in the chat box. This is followed by the possibility of learners chatting with each other [5]. The advantages and disadvantages of synchronous and asynchronous learning are different, so the blended learning environment has become one of the choices of today’s learning approaches. The blended learning environment proposed by this study integrates traditional face-to-face courses, asynchronous, and synchronized online learning. Therefore, it can provide students with the most flexible learning environment. In the literature review of blended learning, there have been few studies on the learning approach integrated with Facebook live. Therefore, this study hopes to explore the learner’s learning experience and learning achievement with the use of educational data mining through traditional distance education, face-to-face teaching, and learning via Facebook live.
This study aims to use machine learning and symmetry-based learning algorithms to explore the relationship between the data generated by the learning process in a blended learning environment and learning achievement. The research questions in this study are as follows:
  • In the blended learning environment, can we use the data generated in the learning process to forecast learners’ performances?
  • Can we apply the generated model to predict the data of the other class?
  • Can we find a specific learning model from the learner’s learning behavior? How can the learning group be defined and which variables should they be based on?
To solve these research questions, this paper explored which variables were related to the learner’s learning performance in a mixed-education environment of mixed face-to-face courses. This study collected the learning records generated by students in a blended learning environment such as the degree of synchronous and asynchronous participation, the submission of assignments, and the discussion in the online forum. Through educational data exploration, predictions can be made in the interim period so that the instructors are in the second half of the semester. Personalized guidance could then be given to high-risk students. Therefore, this study is able to predict learners’ learning performance and provide personalized guidance or reminders for high-risk learners to enhance the efficiency and effectiveness of future teaching.

2. Literature Review

2.1. Blending Learning Environment

In the last few decades, information and communication technology has revolutionized the processes of learning. The blending learning environment can be defined as the combination of traditional face-to-face courses and online learning environments that can complement each other’s shortcomings [2]. The implementation is complicated and challenging as the proportion of face-to-face and online learning will lead to an unlimited number of combinations [6]. The definition and classification of the blended learning environment mainly include two aspects: one is the transmission method (offline and online), and the other is the learning method (educator-oriented and learner center) [7]. Therefore, from these two aspects, there are four possible blended learning environments: (1) Mostly face-to-face courses and significant online interactions; (2) mostly online courses and offline group discussions; (3) mostly face-to-face courses and online resources provided; and (4) mostly online courses and optional face-to-face discussions. The blended learning environment of this study was similar to the fourth type. Most of the online courses and online assignments, discussions, quizzes, and live online courses were synchronized, while the remaining few face-to-face courses were mainly for the start of course introduction, environment building, follow-up question discussions, and examinations. Furthermore, Francis, and Raftery [8] also proposed three digital learning models using hybrid education: (1) Basic course management and helping learners; (2) Hybrid learning brings significant improvements in the teaching and learning process; and (3) The first two modes achieve personalized guidance through multiple online courses and modules. Based on the above three stages, it is recommended that the academic management staff of the university should have sufficient awareness of the strategies, structure, and support of each stage in order to improve the higher education and learning environment [6]. The course in this study was the blended learning environment of online courses, live online interactions, and face-to-face courses. To bring about significant improvement in learning to learners, this research established a mid-term prediction model, so that teachers could find high-risk groups of learners in the mid-term, and provide personalized guidance and reminders to them, in order to achieve the process of improving the learning effectiveness.
Moreover, thematic research on the blended learning environment has pointed out that 41% of the research in the past decade has raised questions about education design including education models, strategies, best practices, learning environments, and curriculum [9,10]. Sikder, Herold, Meinel, and Lorenzen-Zabel [10] combined theoretical knowledge and practice-oriented education to present e-Learning platforms, which included lectures, tests, and practical exercises aside from short teasers and technical tutorials as the major learning modules components. Keržič, Tomaževič, Aristovnik, and Umek [11] explored the critical factors of blended learning for higher education students and indicated that e-learning was positively perceived when the teacher was engaged in an e-course and students’ attitude to the subject had a direct impact.

2.2. Educational Data Mining

In the field of educational data mining, predicting the performance of learners is one of the most practical applications. According to the definition of the Educational Data Mining Community website [12], educational data mining is “a rapidly emerging discipline that focuses on developing methods that can explore specific information in the educational environment and uses its methods to gain a deeper understanding for students’ learning performance and set the goals for them.” In addition, many leading experts in educational data exploration divide educational data exploration into the following sections: statistics and visualization, prediction (classification, regression, and density estimation), clustering, correlation analysis, outlier detection, and semantic analysis [5,12,13,14]. The goal is to understand learners’ learning behaviors and predict their knowledge absorption [14]. However, predicting learner performance is not easy, and a large number of factors or personal characteristics may affect learner performance. Factor characteristics include the learner’s background, past learning performance, and interactions between learners and educators [15]. When predicting learner performance, the method used will vary depending on the predictive variables [16]. The application of educational data mining in student learning performance is improving the learning process and guiding learners to learn, providing feedback suggestions based on learner learning behavior, evaluating learning materials and course equipment, early detection of abnormal learning behaviors and problems, and overall a deeper understanding of the learning environment [14,17].
In recent years, the application of predicting the performance of learners is mostly in higher education [18,19]. The main reasons are the popularity of learning management systems (LMS) such as Moodle, Claroline, and Blackboard. The reason why such a learning management system can be quickly popularized is mainly because it can effectively, flexibly, and merely manage the experience of online courses. In addition, the learning management system can accumulate a large amount of information including the number of times the learner visits the webpage, the time, the time and number of viewing the resources, the status and performance of the assignment, and even the interaction record with others in the chat room and discussion area. Therefore, this kind of information is crucial for analyzing the learner’s behavior and predicting the learner’s performance. This allows the teacher to find any inappropriate parts in the course, or the deficiency to improve, so that future teaching will be better suited [17,20].
In supervised learning, random forest (RF) is one of the statistical learning theories, and the approach is applied to make predictions with multiple decision trees and uses voting to obtain the final prediction results. To effectively train the random forest model, the number of trees in the random forest needs to be reduced [21]. Scholars currently compare various decision trees and random forest algorithms for performance predictions. Random forests have been proven to demonstrate the best possible performances when all of the features are included in the model [22].
In unsupervised learning, the clustering approach is a basic exploratory tool in data mining. The clustering approach attempts to classify data when the actual group membership classification is not known. There are also cases in which the clustering approach is applied to educational data mining such as while using the clustering and sequential approach to simulate learner behavior patterns in games [23].
With the learning management system, the data collection of learners becomes more and more convenient, but the information is more complicated. Therefore, it is difficult to analyze the current learning behaviors using traditional research methods. This study applies classification, grouping, data visualization, and other educational data exploration methods to analyze the learning behavior of complex learners, and hopes to explore the variables that affect the learners’ learning performance and thus help the overall learning efficiency.

2.3. Visual Analysis

Data visualization is an emerging field that aims to address a growing database of scale and complexity. The visualization of data developed from the fields of statistics, probability, and data presentation is to understand the large datasets that exist in the database. Moreover, data visualization techniques are mathematical tools that aggregate large datasets into a single representation or numerical value. Such models include time-series graphs, heat maps, etc. [24]. In the era when computers were still not widespread, there was already data visualization [25], like the weather map of Francis-Galton in the 1980s. There are many complicated technologies used in data nowadays. Data visualization is mainly used in business and science. Unlike data mining, data visualization usually deals with raw materials such as numbers or letters [26], which makes the process of visualizing data consume a lot of computing energy and time. Large database management systems often encounter such problems.
The use of data visualization is part of the critical trend of educational data mining [27]. Researchers have pointed out the representative power of data visualization. Data visualization is not a neutral presentation, but magnifies the meaning or persuasiveness of data so that it can be used to generate discourse and opinions. Additionally, it can persuade others to make the same belief in others’ opinions [27]. Therefore, Beer [28] indicates that researchers need to examine the process of data visualization in detail so that everyone can take these visual effects seriously.

3. Method

3.1. Participants

In this study, we present an exploratory study to conduct practical teaching experimental research in universities. This study plans to conduct empirical evidence-based research on a compulsory course. The study was conducted in the Python programming course at a university in northern Taiwan (from now on referred to as Class A). This course is a general education course with a total of 38 students that come from many various departments. To protect the personal information of students, the data was coded. This course utilizes a the blended learning education approach that includes a weekly online lecture available on the learning management system. Students are required to watch instructional videos. In addition, there are face-to-face courses, which allow students to interact with their peers in person, the online quiz, test, and the Facebook live class twice in the semester. To extrapolate our research model, this study also collected the data from another Python course in the same university (hereinafter referred to as Class B). The total number of students in this course was 34. Its weekly learning approach was the same as Class A.

3.2. Data Collection

The collection of course materials analyzed in this study included (1) the students’ asynchronous online learning behavior; (2) the students’ synchronous online learning behavior; and (3) the students’ self-evaluation.
(1)
The source of the students’ asynchronous online learning behavior was obtained from the learning management system log file.
The information included the student’s necessary information (student number, department, name), the results of 11 regular homework assignments, the order of payment, the time of payment, whether to submit late, the results of the final report, three times the average test scores, and the usual class interaction scores. In this study, the data were collected from the learning management system including the total score of the semester, the grades of the students, the 11 assignment scores, the number of unsubmitted assignments, and the number of delayed submitted assignments. There were 38 rows of data, each with 80 fields. The teaching log file showed what teaching content each student clicked at any time, so the variables were courseID, userID, click content ID, logTime, exitTime, and account. There were a total of 4575 items (clicks).
(2)
The source of the students’ synchronous learning behavior was from the Facebook live platform.
Using the Facebook Graph API (Application Programming Interface) to obtain the platform information as Creat_time (message generation time), live_broadcast_timestamp (message generated at the time of the broadcast), message (message content), and NAME (message publisher). There were two live sessions with 275 responses for the first session and 125 responses for the second session. Therefore, there were a total of 400 articles and four fields each after the merger.
(3)
The source of the students’ course evaluation was from the learner questionnaire.
This questionnaire was submitted to the students after the semester finished. There were four major themes, namely, personal background, teaching platform and curriculum design planning, actual platform usage, and open questions.

3.3. Research Tools

The tools used in this research environment included the learning management system (My2TMU), Facebook live platform, Facebook Graph API, as follows:
(1)
Learning Management System
The Learning Management System collects the learner’s course of study in this course for one semester including basic materials, weekly work assignments, quiz results, and click on the content on the platform.
(2)
Facebook Live Platform, Facebook Graph API
Using the Facebook live platform provides an environment for learners to do distance learning, as learners can enjoy the advantages of distance learning and the advantages of instant interaction, so that learners can use the communication device to learn and interact with the teacher at any place, and also interact with their peers.
The Facebook Graph API is the primary method for applications to read and write Facebook social relationships by using Python to connect to the Facebook Graph API to obtain the information generated by learners on Facebook live and organize them appropriately. The version used in this study was v2.12. This study used Facebook graph API to obtain live platform information including creat_time (message generated time), live_broadcast_timestamp (message generated time), message (message content), and NAME (message publisher).
(3)
Final learner questionnaire
At the end of the semester, the student was asked to fill out a questionnaire, which was an online test with a total of 23 questions.

3.4. Data Analysis

After the environment was built, Python was used to analyze the data in this study. The main version of Python used in this study was 3.6, with the following kits: Pandas, the Numpy suite for data collation, Matplotlib, Seaborn, the SciPy kit for data visualization, and the Scikit-learn kit for data analysis. This study used Python to obtain the learner’s answer data during Facebook live teaching and to analyze the data including machine learning methods such as classification and clustering. The original data were preprocessed and standardized as Z-scores , which had a mean of zero and a standard deviation of 1.
In supervised learning, we explored the learner’s learning outcomes at the end of the term, and the target variable was whether the final grade was passed or not. Three algorithms were used, namely logistic regression, decision trees, and random forests. This study first applied these three models to make mid-term predictions and find the best one. After that, to evaluate the model, this study applied the best model of the three models to another class.
In unsupervised learning, we used the clustering approach to find learners with different learning behaviors. This study applied Euclidean distance (European distance) and the hierarchical grouping method to generate the tree diagram. Euclidean distance is the most common distance measure and is suitable to measure the distance of individuals in space. The hierarchical grouping method is a hierarchical structure, which repeatedly splits the data or aggregation, and finally becomes a tree structure.

4. Results

In this study, the curriculum with flipped learning for the programming course was proposed. Moreover, an 18-week Python programming online course was designed in the general education curriculum.

4.1. Mid-Term Forecast

This study applied the following machine learning classification methods: (1) logistic regression, (2) decision tree, and (3) random forest to make mid-term predictions and applied the best model to another class. Among the three models that evaluate the y variable scores, the f1-score of the random forest model was 0.83, which was higher than the f1-score of the logistic-regression and decision trees, as shown in Table 1. Therefore, the best model in this study was the random forest model.
To evaluate the predicting model trained by Class A, we further applied the model to Class B. The time of the B class data was also processed the same as Class A. This study further used this model to predict Class B. The results indicate that the F1-score was 0.77, as shown in Table 2. Therefore, this model also had a successful interim prediction for Class B.

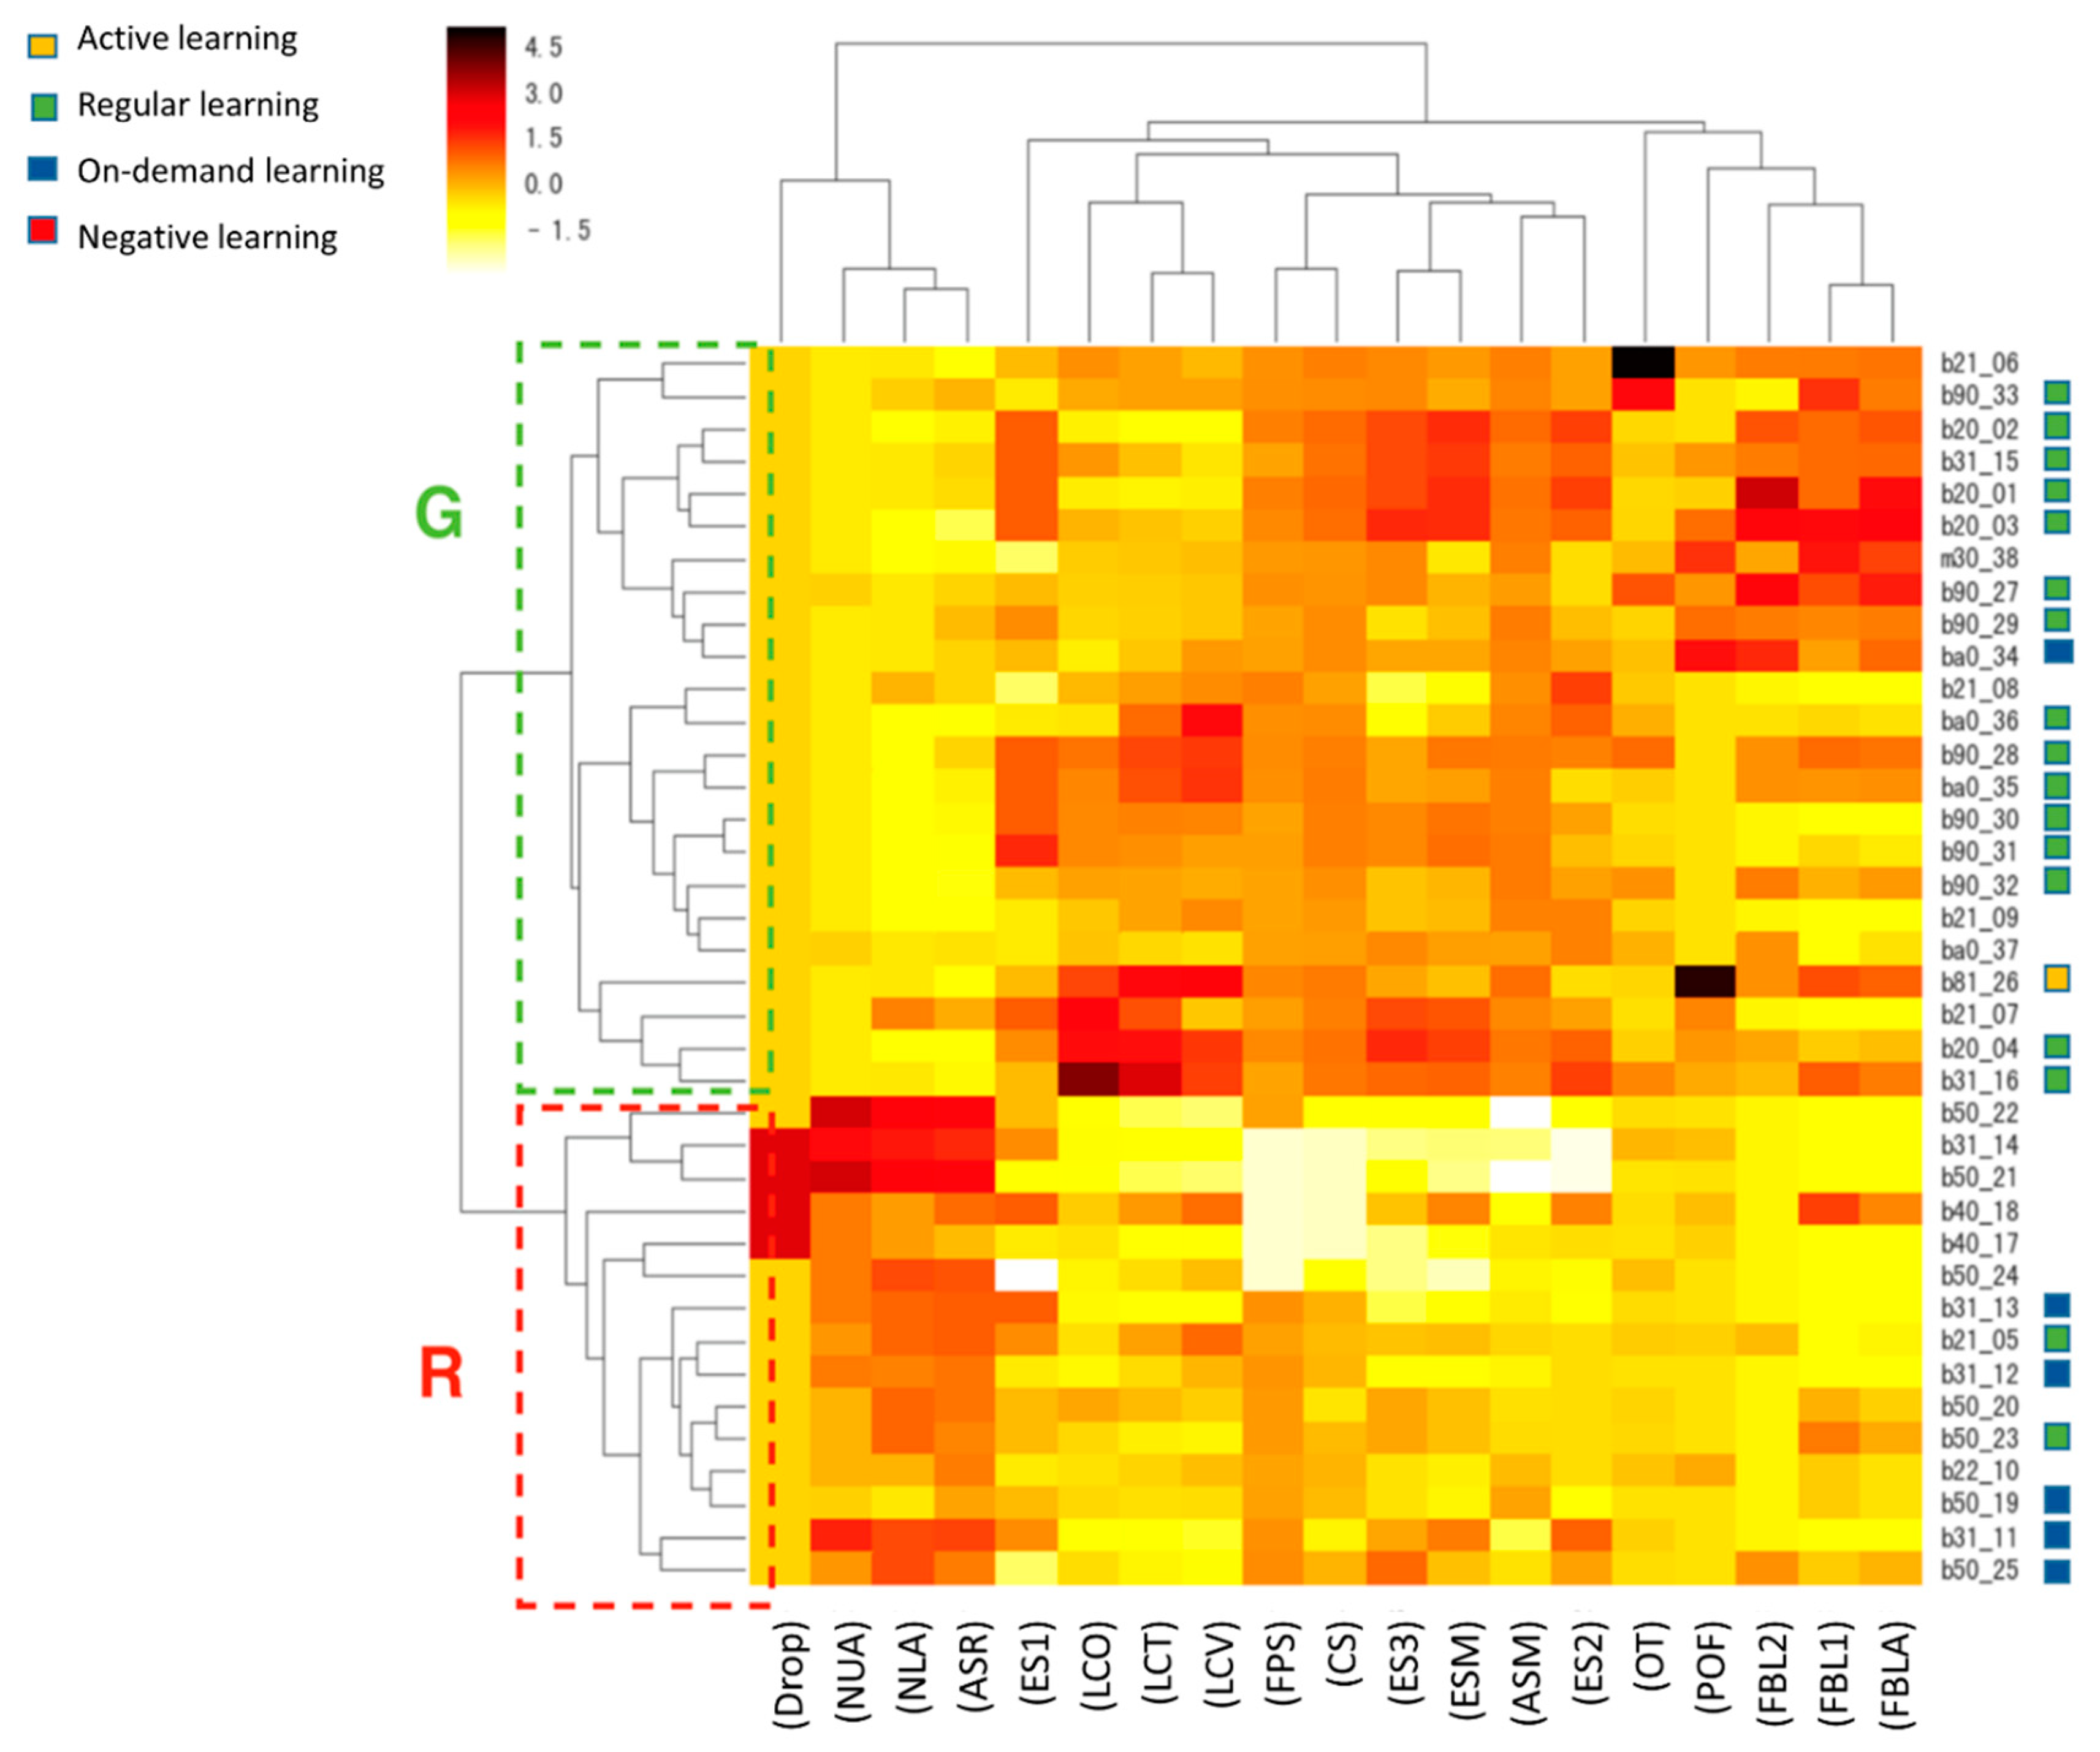
4.2. Learning Behavior Grouping

To further explore the different learning behaviors, this study applied hierarchical clustering to measure the distance of individuals in space. Moreover, to have a closer understanding of the tree structure, the tree diagram was added to the group heat map to generate a hierarchical clustering heat map, as shown in Figure 1. The closer the distance, the smaller the difference between the individuals.
The color depth of the heat map represents the original value. Since the data were standardized, the maximum value was about 4.5, and the minimum value was about −1.5. From the hierarchical structure on the left, we can see the learner’s grouping and understand which learners’ learning behaviors were similar. Moreover, the relationship between the variables can be seen from the hierarchical structure above; so we can understand the degree of association between the variables. The correlation between the variables is one of the links that the instructor wants to explore. Therefore, the variable hierarchy above the hierarchical group heat map is represented separately from the disguised name below, as shown in Figure 2.
In Figure 2, there are four variables on the left: Dropout (Drop), the number of unsubmitted assignments (NUA), the number of late submissions (NLA), and the assignment submission rank (ASR). In this part, the higher these features are, the more negative the students are. The features in the middle section of Figure 2 are the behaviors on the learning management server including the first exam score (ES1), the log clicks on others (LCO), the total log click (LCT), the log clicks on video (LCV), final project score (FPS), course scores (CS), the third exam score (ES3), the exam score average (ESM), the assignment score average (ASM), and the second exam score (ES2). Most of the features in the right section of Figure 2 are the interaction of learners including online time (OT), post on forum (PoF), second FB live comments (FBL2), first FB live comment (FBL1), and FB live interaction (FBLA). From Figure 3, the hierarchical group heat map can further explore the similarity of learning behavior among learners. From the left part, the first order is divided into green and red groups.
The learning behavior of these two groups of students is very different. The color of CS and ASM in group R is lighter than that in group G. The learning participation of group G such as log clicks, reading time, and live response was much better than group R. Then, the red group and the green group were divided into the next level, as shown in Figure 3. It can be seen that the green group could be further divided into three groups: upper (G1), middle (G2), and lower (G3), while the red group could be divided into the upper group (R1) and the lower group (R2).
The upper group (R1) and the lower group (R2) of the red groups showed that the learning performance of the two groups was quite shallow in the part of the log click and the part of the live response. The difference is that the three students of R1 were divided into a group. The number of non-delivery assignments, late submissions, and total payment priorities was particularly deep, as shown in Figure 3, and the learning performance was the lowest. From the CoI theory proposed by Garrison, Anderson, and Archer [29], it can be seen that the R1 and R2 students had a low degree of social presence, teaching presence, and cognitive presence. For learners in these groups, their interactive performance, teaching content clicks, small test scores, and assignments were quite weak. Therefore, we can define red groups as learning negative groups based on their learning behavior.
The green group can be divided into three groups: upper (G1), middle (G2), and lower (G3). G1 was relatively light in the part of the log clicks, but the color of the live answer was quite dark. From the CoI theory proposed by Garrison, Anderson, and Archer [29], it can be seen that the G1 group of learners had a higher degree of social and emotional connection with others. Therefore, we can define this group as synchronized interactive active groups, according to their learning behavior.

4.3. Discussion on Conscious Learning Attitude

In the questionnaire, the question “I think my learning model for this semester” had four options, as shown in Table 3, namely “Active learning”, “Regular learning”, “On-demand learning”, and “Negative learning”. Active learners are not only able to learn the learning content uploaded by the teacher, but also actively learn additional knowledge and can actively ask questions or actively help students to answer questions. Regular learners learn the learning materials weekly and submit their assignments on time; on-demand learners are unable to complete the learning content on time every week, and negative learning refers to students who are too busy to undertaken this course. We then cross-analyzed the four types of student self-identified learning patterns and hierarchical group heat maps, as shown in Figure 4.
As shown in Figure 4, the four conscious learning modes are represented by yellow, green, blue, and red, respectively. The invalid questionnaires are indicated by blanks. We received 17 questionnaires for the 23 students in the green group (G) where one was an active learner, up to 15 students were regular quantitative learners, and one was a demand-based learner. In the red group (R), there were 15 students from whom we obtained seven valid questionnaires, among which two students were regular quantitative learners, and five students were demand-based learners. It can be seen from the learner’s conscious learning model that there were roughly the same conclusions as this study. The green group (G) had better scores among the 17 valid questionnaires, up to 16 were regular quantitative or active learners. Therefore, this study believes that learners who have a stable learning pace can have a better learning performance in a mixed education environment. In contrast, the red group (R) with poor grades consisted of only two of the seven valid questionnaires. The other five were demand-based learners, that is, learners who do not have a stable learning pace, and cannot complete the learning content provided by the teacher on time every week.

5. Conclusions and Discussion

In this paper, we explored which variables were related to the learner’s learning performance in a mixed-education environment of mixed face-to-face courses and live-action real-time teaching in a traditional online learning environment through educational data exploration, and which could make predictions in the interim period so instructors could be present in the second half of the semester for personalized guidance to be given to high-risk students. The pace of learning, synchronization, and non-synchronization activity had a significant impact on learning performance, and then methods of logistic regression, decision tree, and other methods were used to train the mid-term prediction model. The class also had a high accuracy rate. Finally, the content of the self-conscious questionnaire was discussed. The learner’s thoughts also had complementary effects on the overall research. The conclusions can be divided into the following three major points:

5.1. Explore the Impact of Overall Learning Behavior on Learning Performance in a Mixed Learning Environment

(1)
Synchronous/non-synchronized participants have better learning performance.
The study found that active students in an online education environment will have a better learning performance. Since this mixed education environment included traditional online courses and live teaching, the activity level included the clicks of online teaching content and the live broadcast environment. Under the interaction with others, high-score learners had at least one of these two variables relatively prominent, and even some high-score learners were prominent at the same time.
(2)
Learners with stable pace have better learning performance.
The learning pace also plays a very important relationship for end-of-term learning performance. In the online teaching environment, the learning step changes discussed in this study included the frequency of clicks on the teaching content, and whether the click-through teaching content was stable from the beginning of the semester to the end of the semester. Moreover, from the submission of the assignment including the time of late submission, it could be found that the high-score learners were relatively unsuccessful in their clicks of teaching content, were stable learners, and often handed in their assignments on time.

5.2. Use Machine Learning to Establish an Interim Warning System to Predict High-risk Group Learners

(1)
Using a mixed education environment to generate data can accurately predict high-risk group learners during the period
After understanding the impact of learning behavior on learning performance, this study hopes to develop a mid-term warning model so that teachers can know which learners are high-risk groups during the study period. Compared to logistic regression and decision trees, the random forest model had a 0.83 f1-score and 0.83 accuracy in predicting learner pass or fail variables, which shows that the model in the study was more accurate than the other two models. This study contributes empirical evidence to support the study results of Osmanbegović, Suljic, and Agić [22], who used classification algorithms to determine dominant factors for the students’ performance prediction and found that random forest had better accuracy.
(2)
The model trained in this study can be extrapolated and applied to other courses to predict learner performance.
In order to understand whether it is possible to extrapolate the model, this study built the model for other courses, so that the same pedagogic could also be applied in the other class (B class). When we extrapolated the model to the data collected from Class B to make predictions, there was a 0.90 f1-score and 0.91 model accuracy. In the mid-term, students can explore their learning behaviors for the predicted high-risk groups, improve their learning pace and lack of activity, and thus improve their learning performance.

5.3. Model Analysis Definitions for Learner Learning Behavior

(1)
Using the clustering method can explore the fixed learning mode for the learner’s learning behavior.
Through the hierarchical group heat map, it is possible to understand the learner’s learning behavior at a glance and see that different groups of learners have different learning modes, some being relatively prominent in the teaching content click, and some active in the live teaching environment. This result supports the research findings of Hou [23], which addressed the analysis of learners’ potential clusters and the behavioral patterns of each cluster. Moreover, this study addressed a more in-depth analysis integrating clustering and the heat map.
(2)
Using hierarchical clustering and heat map can further define learning mode grouping from multi-dimensional user data variables.
According to the hierarchical group heat map, according to the synchronous teaching participation degree, the teaching content click degree and the homework paying situation, it can be seen that the learner is roughly divided into a green group with better scores that could be further subdivided, and a red group with poor scores. The three subdivisions in the green group were the “Interactive Active Group”, “Stable Learning Group”, and “Teaching Content Active Group”, while the red group was the “Learning Negative Group”. In the future, the instructor may be advised to provide different reminders and guidance for different groups of learners such as being able to set additional reminders for groups that have been promising their assignments, or for those who have been less engaged in face-to-face classes. The additional interaction is believed to have a significant improvement in learning performance and learning.

5.4. Limitations of This Study

While this study adds new insights into the application of educational data mining to explore students’ learning patterns in the flipped learning approach, some limitations may be the subject of future research. The questionnaires relied on self-reporting, which may not have been answered accurately, so the sample could be biased [30]. Another limitation is that the use of a digital solution for collecting data might have led to a selection bias for students. Finally, this study was carried out in specific higher education environments that use a particular LMS. The behavior data of students’ learning activities were acquired and limited from the LMS student log files and Facebook Graph API. Thus, further generalizations to other blended learning environments must be made with care. Therefore, based on the results we obtained in this study, in the future, educators will be able to use the mid-term forecasting system to find high-risk groups during the semester.
With the advancement of technology and the development of social media, the possibility of learning environments has become more diverse, which also brings different benefits to learners and educators as learners can access the content at their own pace. Future research can refer to the course design of this study and make more use of the interactive advantages of synchronous/asynchronous online teaching. In addition, qualitative data can be collected and analyzed. For example, future work will explore whether the interactive data of the learner is related to learning. Moreover, a larger sample data and the addition of new data exploration clusters and classification algorithms might be conducted to provide additional evidence.

Author Contributions

Conceptualization, methodology and writing-original manuscript, H.-C.H., C.-T.L. and Y.-S.S. Review and editing, I-F.L. Furthermore, Y.-S.S. acted as a corresponding author. All authors have read and agreed to the published version of the manuscript.

Funding

This work was supported by the Ministry of Science and Technology of Taiwan under contract numbers MOST 106-2511-S-038-009-, MOST 108-2511-H-019-002, MOST 108-2511-H-019-003, and MOST 108-2511-H-008-017-. The authors would like to thank all the people who took part in this study.

Conflicts of Interest

The authors no conflicts of interest.

References

  1. Ni, A.Y. Comparing the effectiveness of classroom and online learning: Teaching research methods. J. Public Aff. Educ. 2013, 19, 199–215. [Google Scholar] [CrossRef]
  2. Graham, C.R.; Woodfield, W.; Harrison, J.B. A framework for institutional adoption and implementation of blended learning in higher education. Internet High. Educ. 2013, 18, 4–14. [Google Scholar] [CrossRef]
  3. Wang, Q.Y. A generic model for guiding the integration of ICT into teaching and learning. Innov. Educ. Teach. Int. 2008, 45, 411–419. [Google Scholar] [CrossRef]
  4. He, W. Examining students’ online interaction in a live video streaming environment using data mining and text mining. Comput. Hum. Behav. 2013, 29, 90–102. [Google Scholar] [CrossRef]
  5. Romero, C.; López, M.-I.; Luna, J.-M.; Ventura, S. Predicting students’ final performance from participation in on-line discussion forums. Comput. Educ. 2013, 68, 458–472. [Google Scholar] [CrossRef]
  6. Garrison, D.R.; Kanuka, H. Blended learning: Uncovering its transformative potential in higher education. Internet High. Educ. 2004, 7, 95–105. [Google Scholar] [CrossRef]
  7. Park, Y.; Yu, J.H.; Jo, I.H. Clustering blended learning courses by online behavior data case study in a Korean higher education institute. Internet High. Educ 2016, 29, 1–11. [Google Scholar] [CrossRef]
  8. Francis, R.; Raftery, J. Blended learning landscapes. Brookes Ejournal Learn. Teach. 2005, 1, 1–5. [Google Scholar]
  9. Halverson, L.R.; Graham, C.R.; Spring, K.J.; Drysdale, J.S.; Henrie, C.R. A thematic analysis of the most highly cited scholarship in the first decade of blended learning research. Internet High. Educ. 2014, 20, 20–34. [Google Scholar] [CrossRef]
  10. Sikder, S.; Herold, H.; Meinel, G.; Lorenzen-Zabel, A. Blessings of open data and technology: E-learning examples on land use monitoring and e-mobility. In Proceeding of the STS Conference, Graz, Austria, 6–7 May 2019. [Google Scholar]
  11. Keržič, D.; Tomaževič, N.; Aristovnik, A.; Umek, L. Exploring critical factors of the perceived usefulness of blended learning for higher education students. PLoS ONE 2019, 14, e0223767. [Google Scholar] [CrossRef] [PubMed]
  12. Baker, R.; Yacef, K. The State of educational data mining in 2009: A review and future visions. J. Educ. Data Min. 2009, 1, 3–17. [Google Scholar] [CrossRef]
  13. Baker, R. Data Mining for Education. In International Encyclopedia of Education, 3rd ed.; Peterson, P., Baker, E., Mcgaw, B., Eds.; Elsevier: Oxford, UK, 2012; pp. 112–118. [Google Scholar] [CrossRef]
  14. Romero, C.; Ventura, S. Educational data mining: A review of the state of the art. IEEE Trans. Syst. ManCybern. Part C Appl. Rev. 2010, 40, 601–618. [Google Scholar] [CrossRef]
  15. Araque, F.; Roldan, C.; Salguero, A. Factors influencing university drop out rates. Comput. Educ. 2019, 53, 563–574. [Google Scholar] [CrossRef]
  16. Hämäläinen, W.; Vinni, M. Classifiers for Educational Data Mining; Chapman & Hall/CRC: London, UK, 2011. [Google Scholar] [CrossRef]
  17. Romero, C.; Ventura, S.; Garcia, E. Data mining in course management systems: Moodle case study and tutorial. Comput. Educ. 2008, 51, 368–384. [Google Scholar] [CrossRef]
  18. Romero, C.; Ventura, S. Data mining in education. Wiley Interdiscip. Rev. Data Min. Knowl. Discov. 2013, 3, 12–27. [Google Scholar] [CrossRef]
  19. Romero, C.; Espejo, P.; Romero, R.; Ventura, S. Web usage mining for predicting final marks of students that use Moodle courses. Comput. Appl. Eng. 2013, 21, 135–146. [Google Scholar] [CrossRef]
  20. Romero, C.; Ventura, S.; Espejo, P.; Hervás, C. Data mining algorithms to classify students. In Proceedings of the Educational Data Mining, Montréal, QC, Canada, 20–21 June 2008; pp. 20–21. [Google Scholar]
  21. Kulkarni, V.Y.; Sinha, P.K. Pruning of random forest classifiers: A survey and future directions. In Proceedings of the 2012 International Conference on Data Science & Engineering (ICDSE 2012), Cochin, Kerala, India, 18–20 July 2012; pp. 64–68. [Google Scholar]
  22. Osmanbegović, E.; Suljic, M.; Agić, H. Determing dominant factors for students performance prediction by using data mining classification algorithms. Tranzicija 2015, 16, 147–158. [Google Scholar]
  23. Hou, H.-T. Computers in human behavior integrating cluster and sequential analysis to explore learners’ flow and behavioral patterns in a simulation game with situated-learning context for science courses: A video-based process exploration. Comput. Hum. Behav. 2015, 48, 424–435. [Google Scholar] [CrossRef]
  24. Friendly, M. A Brief History of Data Visualization. In Handbook of Data Visualization; Springer Handbooks Comp. Statistics; Springer: Berlin/Heidelberg, Germany, 2008. [Google Scholar] [CrossRef]
  25. Tufte, E.R. The visual display of quantitative information. Am. J. Phys. 1986, 53, 1117. [Google Scholar] [CrossRef]
  26. Kochevar, P. Database Management for Data Visualization. In Database Issues for Data Visualization; Lee, J.P., Grinstein, G.G., Eds.; Springer Lecture Notes in Computer Science: Berlin/Heidelberg, Germany, 1994; Volume 871. [Google Scholar] [CrossRef]
  27. Gitelman, L.; Jackson, V. Introduction. In Raw data. Is an Oxymoron; Gitelman, L., Ed.; MIT Press: Cambridge, MA, USA, 2013. [Google Scholar]
  28. Beer, D. Popular Culture and New Media: The Politics of Circulation; Palgrave: London, UK, 2013. [Google Scholar]
  29. Garrison, D.; Anderson, R.T.; Archer, W. Critical inquiry in a text-based environment: Computer conferencing in higher education. Internet High. Educ. 2000, 2, 87–105. [Google Scholar] [CrossRef] [Green Version]
  30. Shaw, R.S. A study of the relationships among learning styles, participation types, and performance in programming language learning supported by online forums. Comput. Educ. 2012, 58, 111–120. [Google Scholar] [CrossRef]
Figure 1. Hierarchical group heat map.
Symmetry 12 00213 g001
Figure 2. Hierarchical group heat map variable group.
Symmetry 12 00213 g002
Figure 3. Fine grouping of the hierarchical group heat map.
Symmetry 12 00213 g003
Figure 4. Self-conscious learning mode and hierarchy cross-analysis of the group heat map.
Symmetry 12 00213 g004
Table 1. Model evaluation and comparison between the three models.
Data LabelLogistic RegressionDecision TreeRandom Forest
PrecisionRecallF1-ScorePrecisionRecallF1-ScorePrecisionRecallF1-Score
0/Fail0.330.500.400.330.500.400.530.500.50
1/Pass0.890.800.840.890.800.840.900.900.90
Avg/Total0.800.750.770.800.750.770.830.830.83
Table 2. Model evaluation for Class B.
Data LabelPrecisionRecallF1-Score
0/Fail0.330.500.40
1/Pass0.890.800.84
Avg/Total0.800.750.77
Table 3. Learning mode questionnaire.
QuestionActive LearningRegular LearningOn-Demand LearningNegative Learning
I think my learning mode for this course1 (4%)19 (73%)6 (23%)0 (0%)

