1. Introduction
A geodetic survey of buildings and other construction is one of the common activities in the field of surveying. Satellite methods, photogrammetry, or currently popular laser scanning are also used in addition to classical terrestrial measurements. Very often, three-dimensional (3D) models of buildings and structures are created from the measured data for the purpose of reconstruction, evaluation of the current state or just visualization.
A number of technologies have been developed for this activity. [
1,
2] using the latest knowledge of related fields. There are still problems that have not yet been satisfactorily resolved, despite the facts in the flow chart (
Figure 1). The article tries to identify, analyze, present, and try to propose an acceptable solution. These problems can be divided into two basic categories:
display geometry (position and height accuracy) of the geographic object (GO) in the terrain into appropriate software, and
visualization of the created 3D model in suitable software.
Problem ad (1) is related to obtaining the data by measurement. Today’s geodesy data collection technologies enable the user to focus the selected object with the required accuracy. These technologies integrate many features and provide high user comfort. The next step in the processing chain (
Figure 1) poses a problem. It is a creation of a 3D model from a list of coordinates of detailed points, which is based on connecting points with general lines being selected from the element libraries in the software. In many cases, it is necessary to generalize the model to make interconnection possible. In fact, this means degrading the geodesist’s work in the field while locating the object.
The problem ad (2) mainly depends on the supply of surface materials in selected software that represent the surface of a focused GO in the field. Basically, it is about surface textures or the implementation of photographs on the partial surfaces of an object. The essence of the problem, in this case, is that the real surfaces of the object are in general not planar, which, in current applications, is solved by decomposing the general surface into a system of planar surfaces. As a result, the resulting image is rendered when the object is visualized.
This paper presents the problems encountered in the creation of 3D models that the authors have encountered in solving projects in [
3,
4,
5,
6]. These are mainly historical church buildings, in the case of [
3] wooden buildings. The text also contains a solution proposal in the context of current possibilities of available applications.
The paper is organized, as follows. In
Section 2, we mention some related work for 3D models. In
Section 3, we describe problems regarding 3D model creation and propose the method of a possible solution.
Section 4 demonstrates the experiments.
Section 5 contains discussion of the given topic.
Section 6 addresses the conclusions.
2. Related Works
A number of papers have been published on this topic, of which only those are directly related to our article are described, as follows. Previous publications can be divided into the following categories:
Building information modelling (BIM).
Reverse engineering.
New technologies for data processing from TLS (Terrestrial Laser Scanning).
New methods for 3D models creation.
Visualization of 3D objects.
2.1. BIM
The topic of the paper [
1] is the integration of BIM with the issue of reverse engineering. It is about improving the sub-phases of the information flow throughout the entire project cycle. The aim is to reduce the errors and increase efficiency by supporting technologies, such as prefabrication, virtual reality, 3D printing, etc. The proposed methodology also includes tools for managing and organizing the entire workflow. The results can be used in projects for the renewal of towns and municipalities. The article [
7] deals with Historic Building Information Modeling (HBIM). It is special library of historical architectural elements, from which it is possible to reconstruct entire historical buildings and complexes. The library was created in ArchiCAD GDL (Geometric Description Language). These are parametric elements whose specific geometry is defined by the user. The resulting model is composed of laser scanning surveying or photogrammetric data and is completed with elements from library. The resulting model serves for conservation purposes. The publication [
8] is a continuation of the research that was presented in the previous paper [
7]. The method for HBIM creation was supplemented by algorithms of data segmentation from point clouds that were obtained by ground laser scanning of buildings. This is a difficult task to be solved by algorithm, therefore a heuristic method was used.
2.2. Reverse Engineering
Article [
2] deals with reverse engineering technology. The topic is terrestrial 3D laser scanning. There are latest technologies of point cloud processing by powerful technical and software tools described. The work [
9] proposes a special procedure for laser scanning of buildings. The method consists in optimizing the arrangement of devices in the space by means of a telecommunication device located on the roofs of buildings. It is a virtual simulation of antenna sites, which generates a 3D scenario of the process. The method was verified at a project at the Technical University of Madrid. [
10] is another work that belongs to the field of reverse engineering. It proposes an algorithm for comparing the actual state of the pipe design with the state in the Computer-Aided Design (CAD) system. 3D model is obtained from laser scanning. The method is used for reconstruction of buildings or verification of quality in construction. In the work [
11] is described a new method of reverse engineering combined with knowledge engineering of construction. It deals with a definition of inverse CAD process while using topology and tree structure of design process. A specific geometry of the model is then created from this general concept.
2.3. Terrestrial Laser Scanning
The study [
12] presents a new methodology for creating a 3D model of wooden structures. This is a quick procedure based on generative algorithms. Terrain data are obtained while using Terrestrial Laser Scanning. The method was verified in the framework of a research project of wooden roof structures in Bologna. A new algorithm for transforming point clouds into a 3D model while using parametric tools was developed. The model is created, in general, and other building elements can be modeled by changing of input parameters. The work [
13] deals with the creation of a 3D model of the church that was obtained by Terrestrial Laser Scanning. There are described methods of point cloud analysis and digitization in CAD system.
2.4. New Methods for 3D Models Creation
In the paper [
14] is proposed a method for reconstruction of geometry of 3D object and its components. The object is surveyed by geodetic terrestrial methods and obtained list of points is processed by object methods. The paper describes strategies for recognizing elements in objects and develops new algorithms that improve existing methods. The article [
15] describes the method of reconstruction of reinforced concrete arch bridge. The technology is based on the smallest element method. The aim is to identify the structure of the building and create a 3D model of its actual execution. The work also presents an analysis of the accuracy of the geometric method that was used in object surveying. The content of the article [
16] is a new technology for the surveying of historical buildings in hard to reach places. It is a photogrammetric method that uses fish-eye lenses. The advantage of the method is the speed of data acquisition and optimization of the data volume. It is an alternative method to Unmanned Aerial Vehicles (UAV). The paper [
17] describes the monitoring of buildings by using of the methods of engineering geodesy. Buildings are geodetically surveyed and 2D or 3D models can be obtained from the data. The models are also used for the stage of structure protection and safety of buildings. The method of laser scanning of buildings is described in detail. It is also possible to create drawings, which include views and sections, from the data. Close-range photogrammetry can also be used to create orthoimage and linear drawing. This method is particularly suitable for surveying historical buildings that do not have building documentation.
Ref. [
18] describes a special approach to 3D modeling. It is a new method of hybrid 3D reconstruction of objects, which is a combination of building elements, and computer graphics methods. This integrated method takes advantage of the geometry, topology, and visualization of building objects in the process of 3D model creation.
2.5. Visualization of 3D Objects
The paper [
19] deals with the analysis of 3D objects visualization. A new method that is based on the analysis of topology and time series of the object is proposed. The method does not need its own 3D model; the information is directly obtained from the data. Visualization is used to obtain new functional relationships within an object. The method is verified on a case study. Article [
20] deals with the reconstruction of architectural elements of historical buildings from a cloud of points that were obtained by laser scanning. It is a high resolution 3D model in Triangular Irregular Network (TIN) format. The benefit is the high speed of algorithm and realistic visualization of the object. The method is used in architecture for the reconstruction of historical buildings. The paper [
21] describes a method for approximating the surface of 3D models in CAD software. The method allows for creating a surface from suitably randomly selected points that were obtained from reverse engineering or from the design process. Geodesy algorithms motivated the technology, e.g., the creation of a digital terrain model. The paper [
22] presents a design of an algorithm based on Gaussian map. It is a procedure that is suitable for visualization of ancient architecture. Technology has been proven during archaeological research of ancient cities. Experiments show that the method is accurate enough, with minimum noise, and no need for user intervention.
3. Materials and Methods
3.1. Problems Description
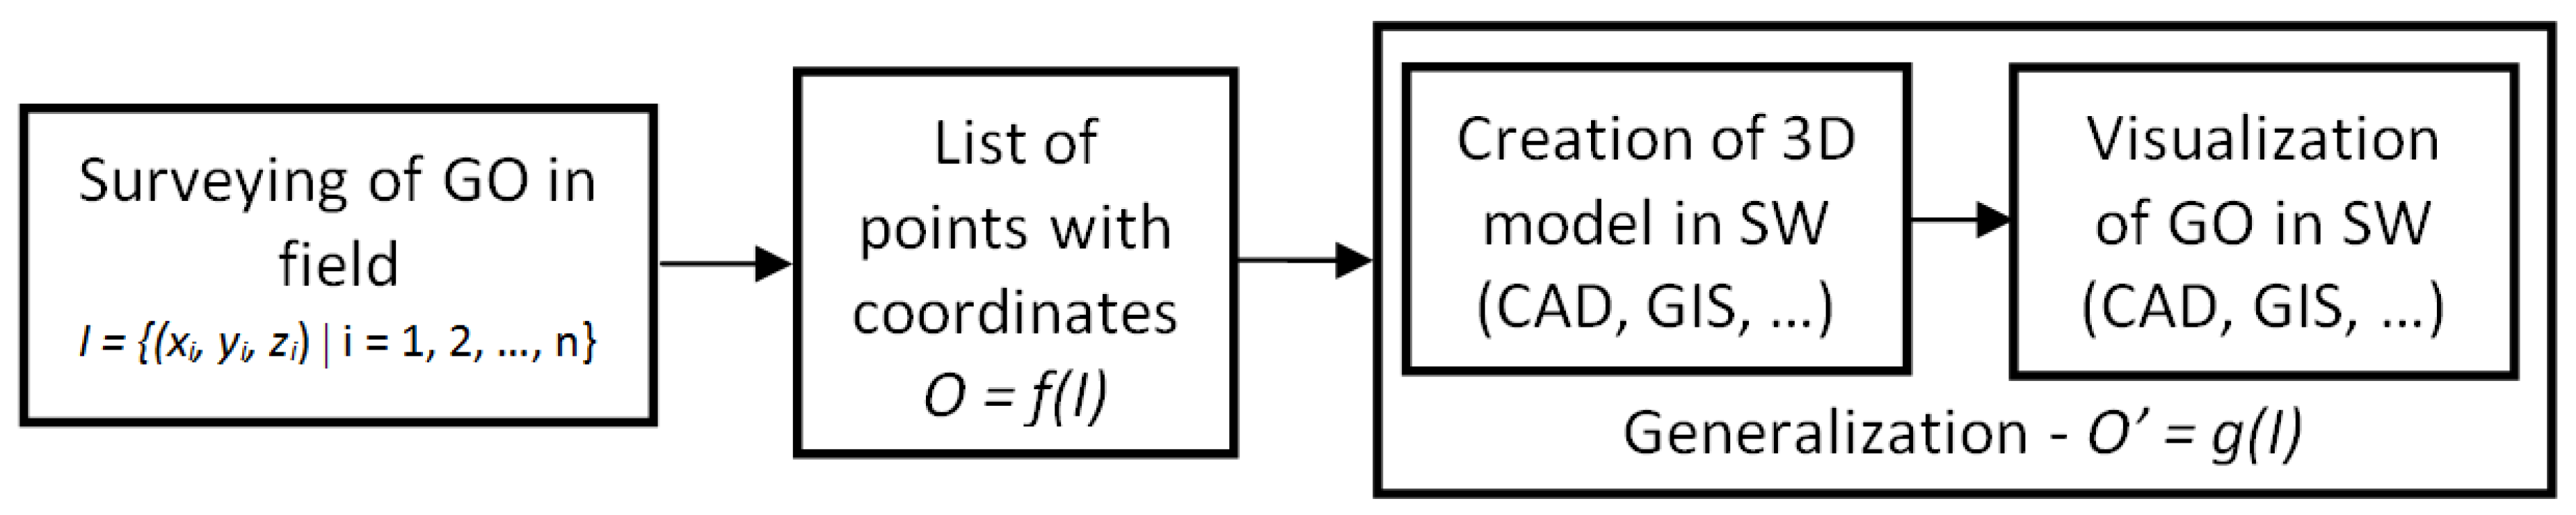
The process of creating a 3D model of a geographic object (GO) is simplified according to the diagram presented in
Figure 1. The GO can represent any real object of interest (e.g., building or other construction). A general and not yet fully solved problem is to create a 3D model in suitable software (SW) with given accuracy.
Let
I = {(xi, yi, zi)|
i = 1, 2, …,
n} is a set of vectors (input) that represent the points of the GO in the real world,
O = {(xo, yo, zo)|
o = 1, 2, …,
n} is a set of vectors (output), describing the points in a digital database of a 3D model in suitable software. Subsequently, mapping function
f from real space to the digital database of 3D model
must fulfill the following conditions:
After generalization in software (
Figure 1) the mapping function can be described with following equation:
where
O’ = U(O) and
U represents neighborhood of vectors that display the input vectors of GO from the real space to the digital database. The neighborhood size of
U then represents the true accuracy of the 3D model in used SW. This accuracy is less, and then the a priori accuracy of the geodetic survey of GO in field. The mapping function g then describes the functional repository of the used SW (CAD, GIS), while
g ⊂ f is valid.
A closed set of functions g though to describe the topology of GO, but it is necessary to generalize the 3D model in many cases. That means O’ ⊂ O ⊆ I. In fact, we lose not only the accuracy of the position of points, but also some details of GO, which is a big disadvantage for further use of 3D models in engineering practice.
Another problem when creating a 3D model is the visualization of the results. This mainly involves rendering surfaces that represent the surface of an object. The problem can be divided into two categories:
3.2. Posibility of Solutions
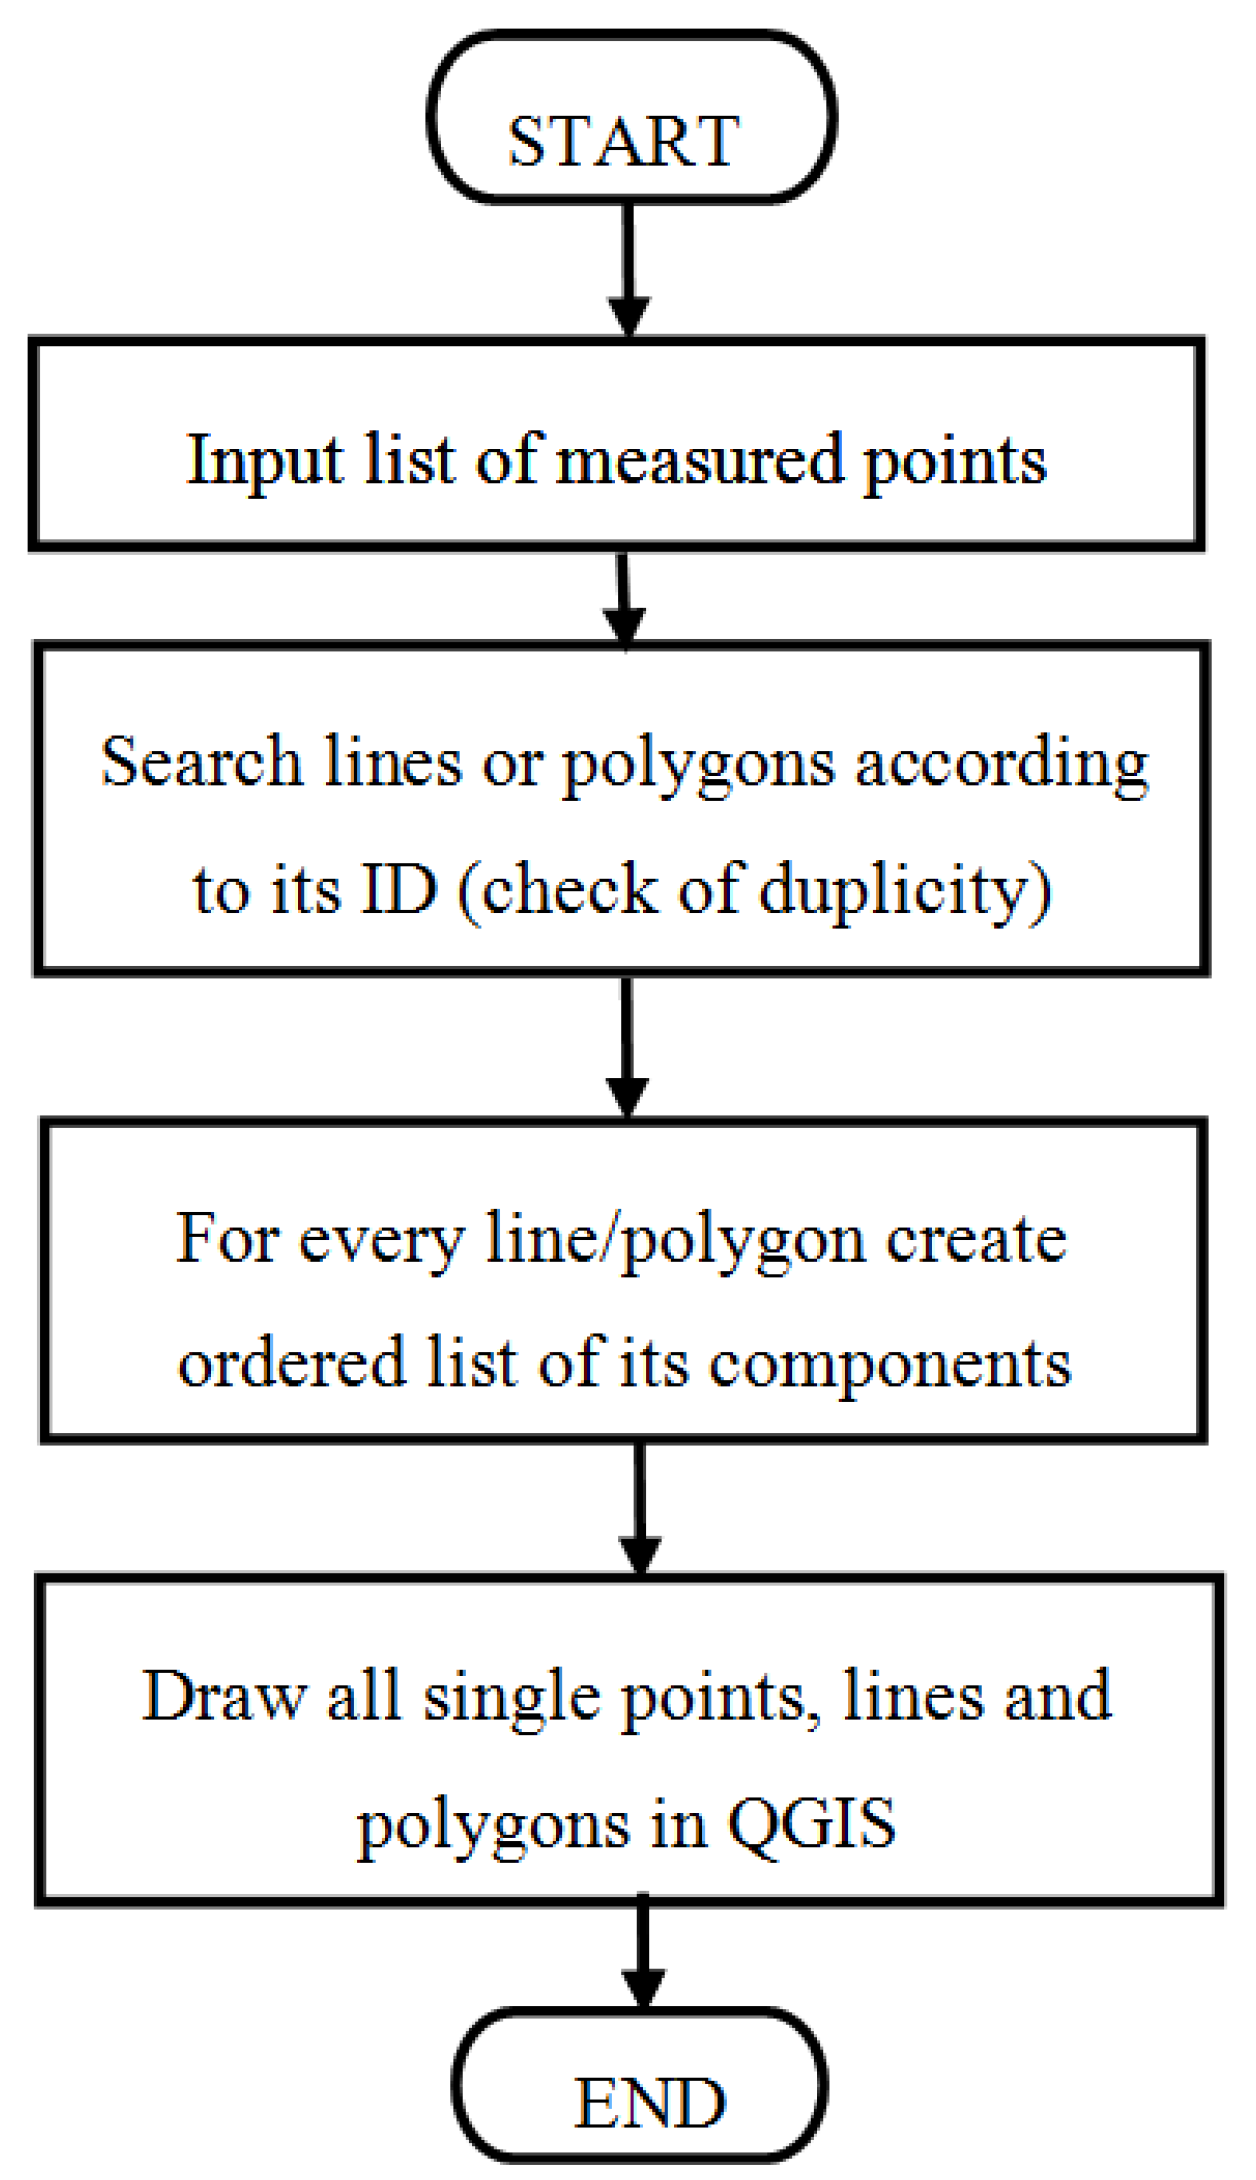
Replacing complex elements with simple entities where there is no further need for generalization can solve the problem of the geometric accuracy of a 3D model in suitable software. E.g. composite arcs or larger degree curves can be replaced with polyline elements. For the model [
6], the authors used the method of topological coding [
23]. The main principle consists in adding special codes into list of coordinates of points, according to field sketch:
topological code: L/x,y or S/x
where,
L refers to line
S refers to surface (polygon),
x is unique identifier of the line (integer), and
y is order number of the point in the line segment.
Format of the list of coordinates is following:
Point ID, Y, X, Z [, code1, code2, …, coden]
Every attribute is separated by comma, while topological codes in square brackets are optional. The application in the form of the script in Python language was created for points input into graphic editors. This script offers automatic creation of topologically correct drawing in CAD or GIS-based software. The script also checks duplicities of entities and provides full topology of the drawing.
Figure 2 presents the chart diagram.
The problem of visualization of the produced 3D model can be solved in two ways:
Using available visualization tools in commonly available CAD products (e.g., AUTOCAD, MicroStation, etc.). In this case, there are two options:
- (a)
used build-in modules with customary texture models in given software, and
- (b)
create your own set of textures and import them into the software (if the program product has the appropriate features for this purpose).
Placing the textures on 3D surfaces of given GO while using the special applications—see [
24,
25].
In models [
3,
4,
5], variant 1 (a) was used to represent the surface, in model [
6] variant 1 (b).
3.3. Transformation of Point Cloud into 3D Model
Creating a 3D model by terrestrial laser scanning technology has several phases:
Data acquisition. Scanning an object in the field results in a raw point cloud, which, in many cases, is made up of several partial clouds.
Transformation of individual measured point clouds from the coordinate system of the scanner into a project system to create a homogeneous spatial model. Subsequently, transformation from the project system to a global coordinate system—national grids and an altimetry system. In the Czech Republic, it is S-JTSK (Datum of Uniform Trigonometric Cadastral Network) and Bpv (Baltic Vertical Datum After Adjustment).
Subsequent levelling of measured data using the ICP (iterative closest point) technology correlation of mutual position of individual clouds.
Create a 3D/BIM (Building Information Modelling) model. The core of this phase is to detect objects (edges, faces) in the point cloud and link these elements to the resulting model. Generally, it is necessary that modelling complied with agreed standards. The phase of focusing and plotting of the 3D/BIM model of the current state should be part of the so-called BIM Execution Plan if the whole project will be processed by the BIM methodology. LOD (Level of Detail), i.e., the level of detail and detail that the 3D/BIM model will carry from the phase of surveying the current state.
4. Results
The problems that are described in the previous chapter, the authors encountered in the practical implementation of 3D models of existing GO. These are four sacral buildings in the Czech Republic (CR): the church of saints Johns of Brno-Bystrc (
Figure 3 and
Figure 4), the Church of St. Paraskiva in Blansko (
Figure 4 and
Figure 5), further the Strejc’s Church in Židlochovice and Church of St. Peter in Alcantara in Karviná city. All of the buildings were geodetically surveyed by the terrestrial method while using total station. The 3D model was created in both cases in the program AUTOCAD v. 18 and MicroStation.
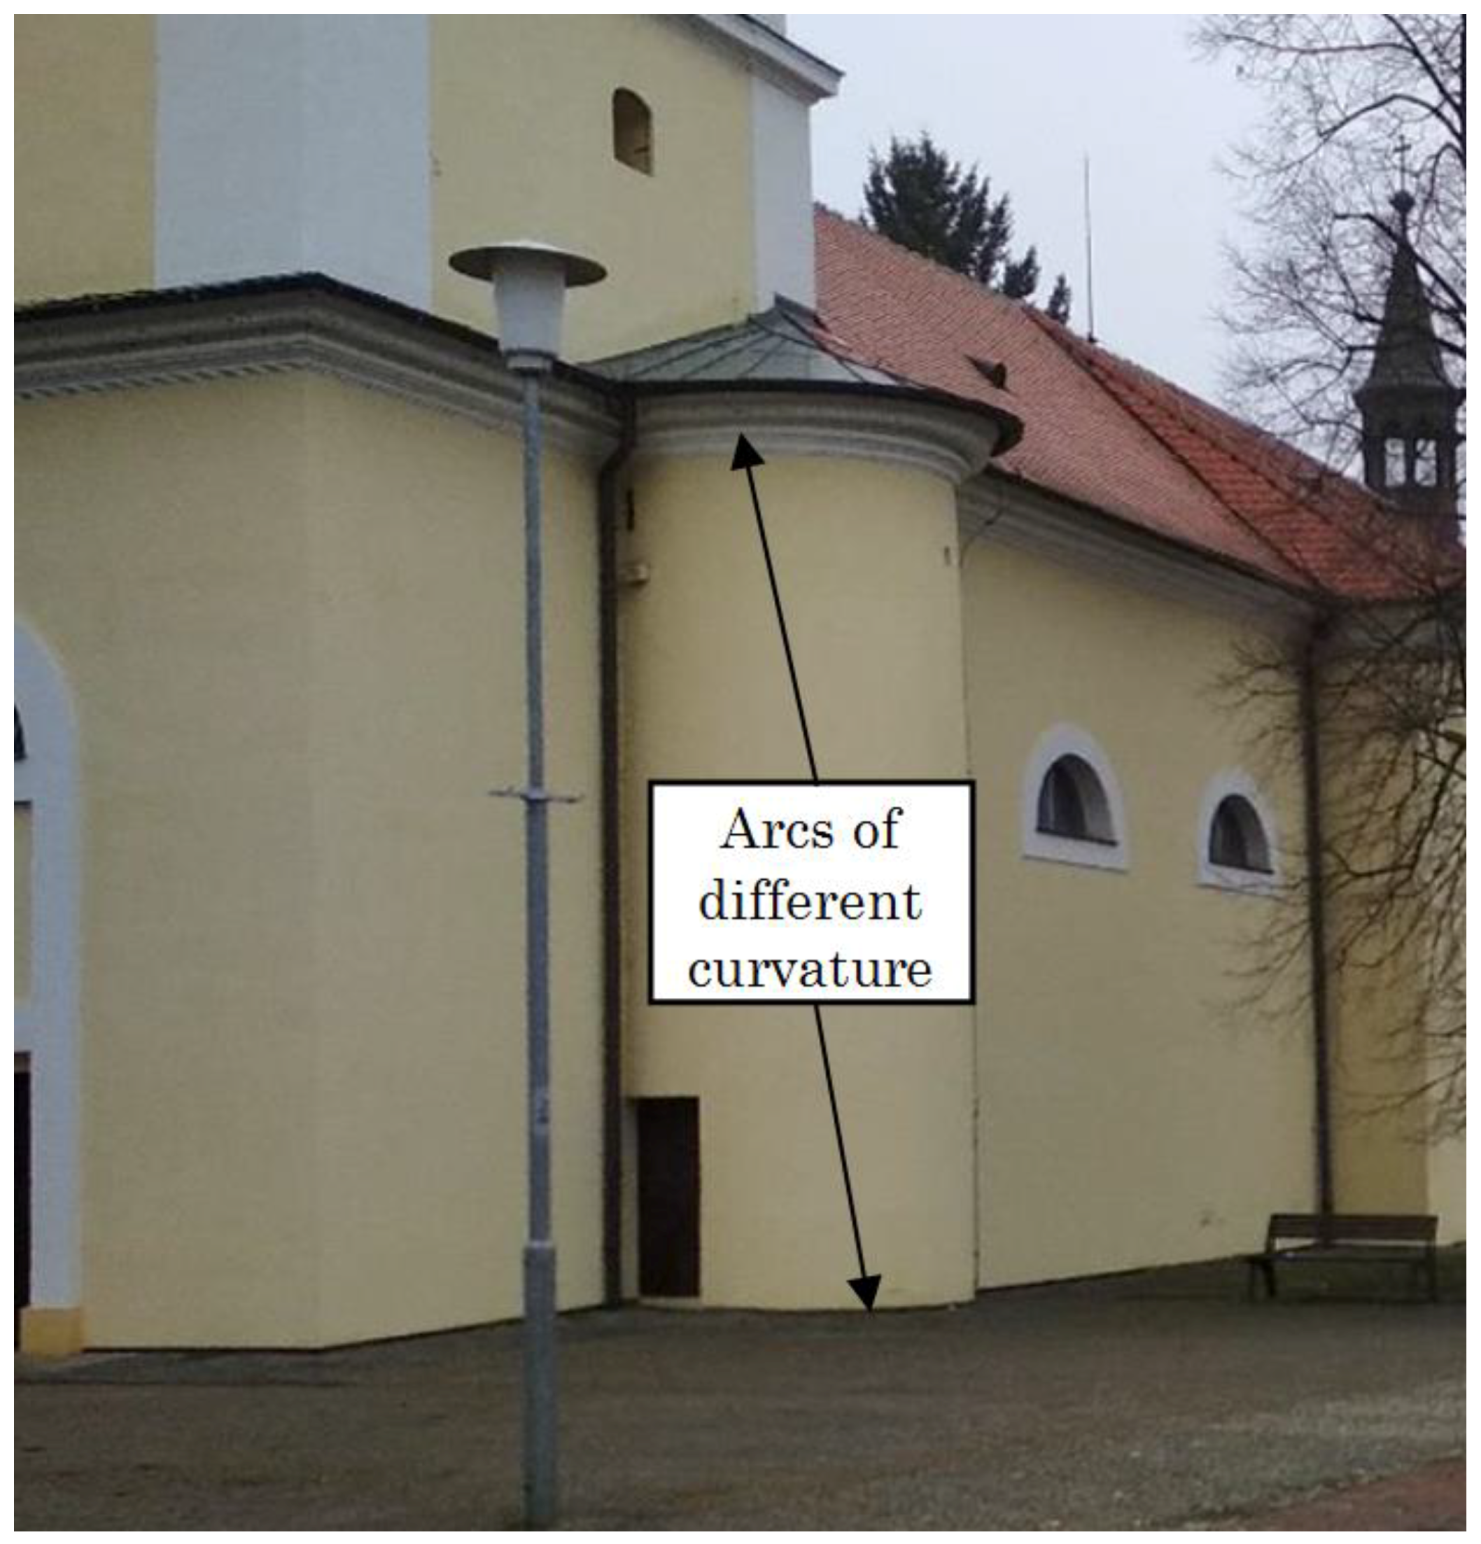
Geometric inaccuracy became evident when transforming the measured points from the terrain into suitable software (AUTOCAD) in several details. Of all cases, we will show as a demonstration example in
Figure 3 and
Figure 4 during the 3D model creation of church of St. Jonh the Baptist and John the Apostle in Brno-Bystrc district (CR).
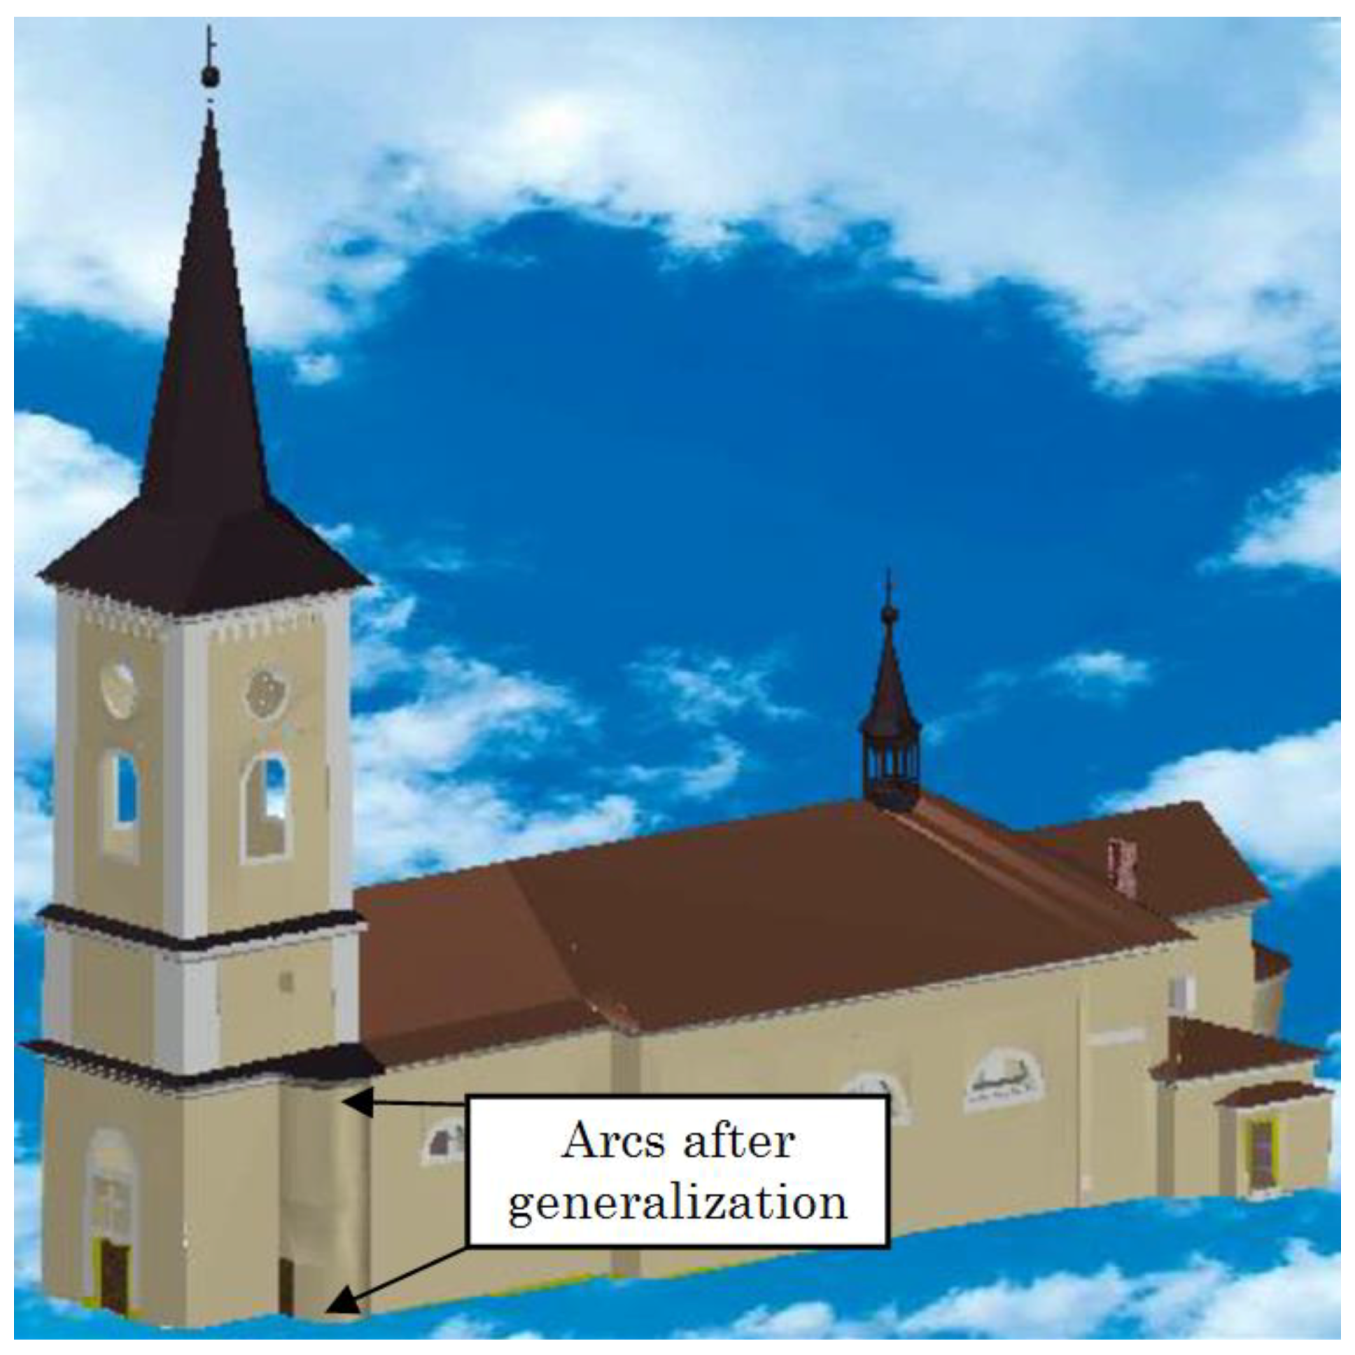
Figure 3 shows a detail of the rotunda with the upper and lower arches indicated. Both arcs actually have different radii of curvature. When creating a wireframe, it was not possible to connect these arcs with vertical edges in AUTOCAD. The connection of the same edge to the lower arc was disconnected and vice versa when joining an edge to the upper arc. It was necessary to generalize the model in order to connect both arcs with vertical edges. The result after generalization is evident in
Figure 4. The disadvantage is that similar inaccuracies limit the further practical use of the 3D model, e.g., making sections for the purpose of object reconstruction etc.
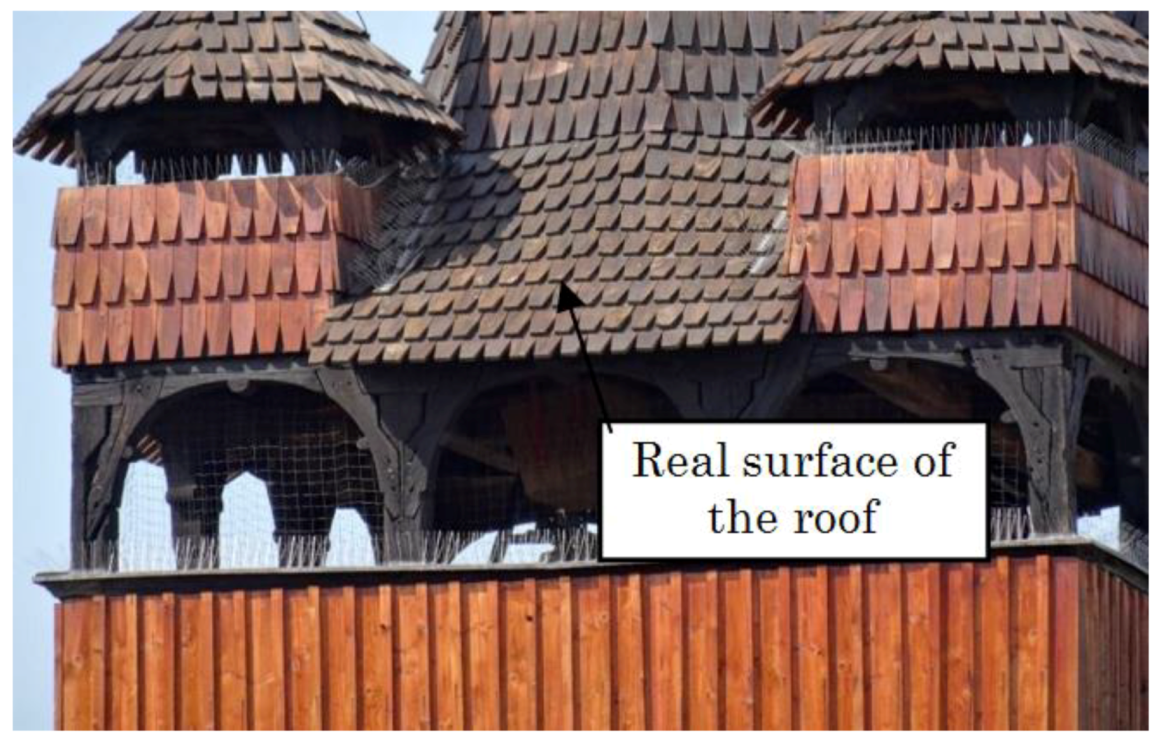
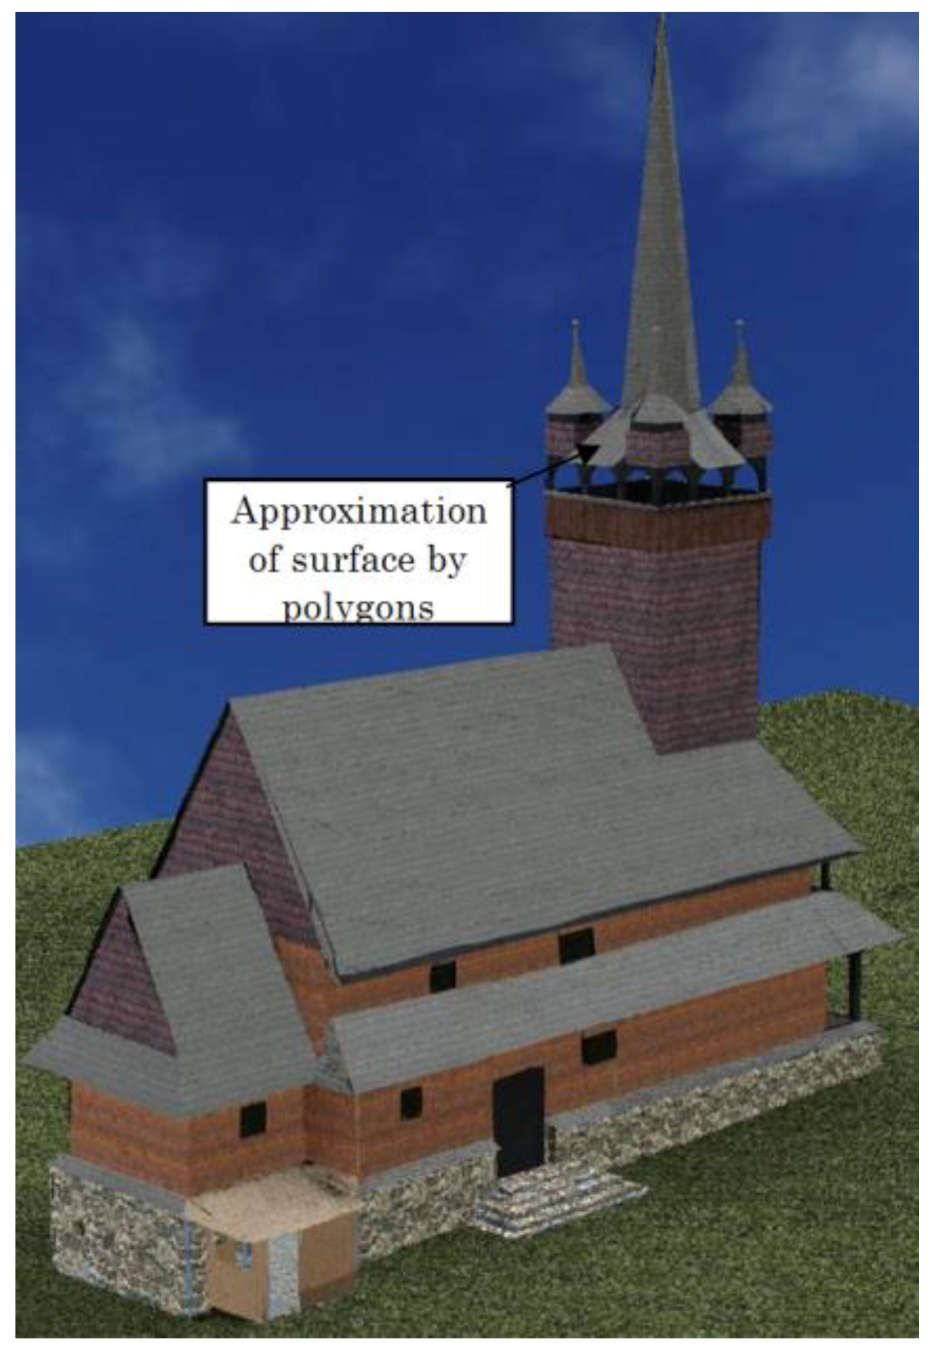
Problems with visualization are demonstrated on the 3D model of the Church of St. Paraskiva in Blansko (CR). In general, it involves laying textures or patterns with the real appearance of the building material used (e.g., roof tiles or shingles) on 3D model surfaces. In existing programs, this is only possible when the surfaces are planar. However, for real objects, the surfaces of buildings rarely meet that requirement. Most of these are general areas in space—see
Figure 5. In this case, it is very difficult to apply realistic textures to these surfaces. Usually, it is necessary to decompose the surface into a numerous of planar patterns and then cover them with textures or photographs. Usually, triangles or planar quadrilaterals are used. However, this process is very time-consuming and laborious and in many cases the result does not correspond to the exerted effort.
Figure 5 and
Figure 6 show the difference.
A similar situation can be seen in the models Strejc Church in Židlochovice—
Figure 7 and
Figure 8—and the Church of St. Peter of Alcantara in Karviná (CZE)—
Figure 9 and
Figure 10. The visualization of the Strejc Church (
Figure 8) was done while using standard tools in the AUTOCAD program. The difference between the actual situation (
Figure 7) and the display in AutoCAD (
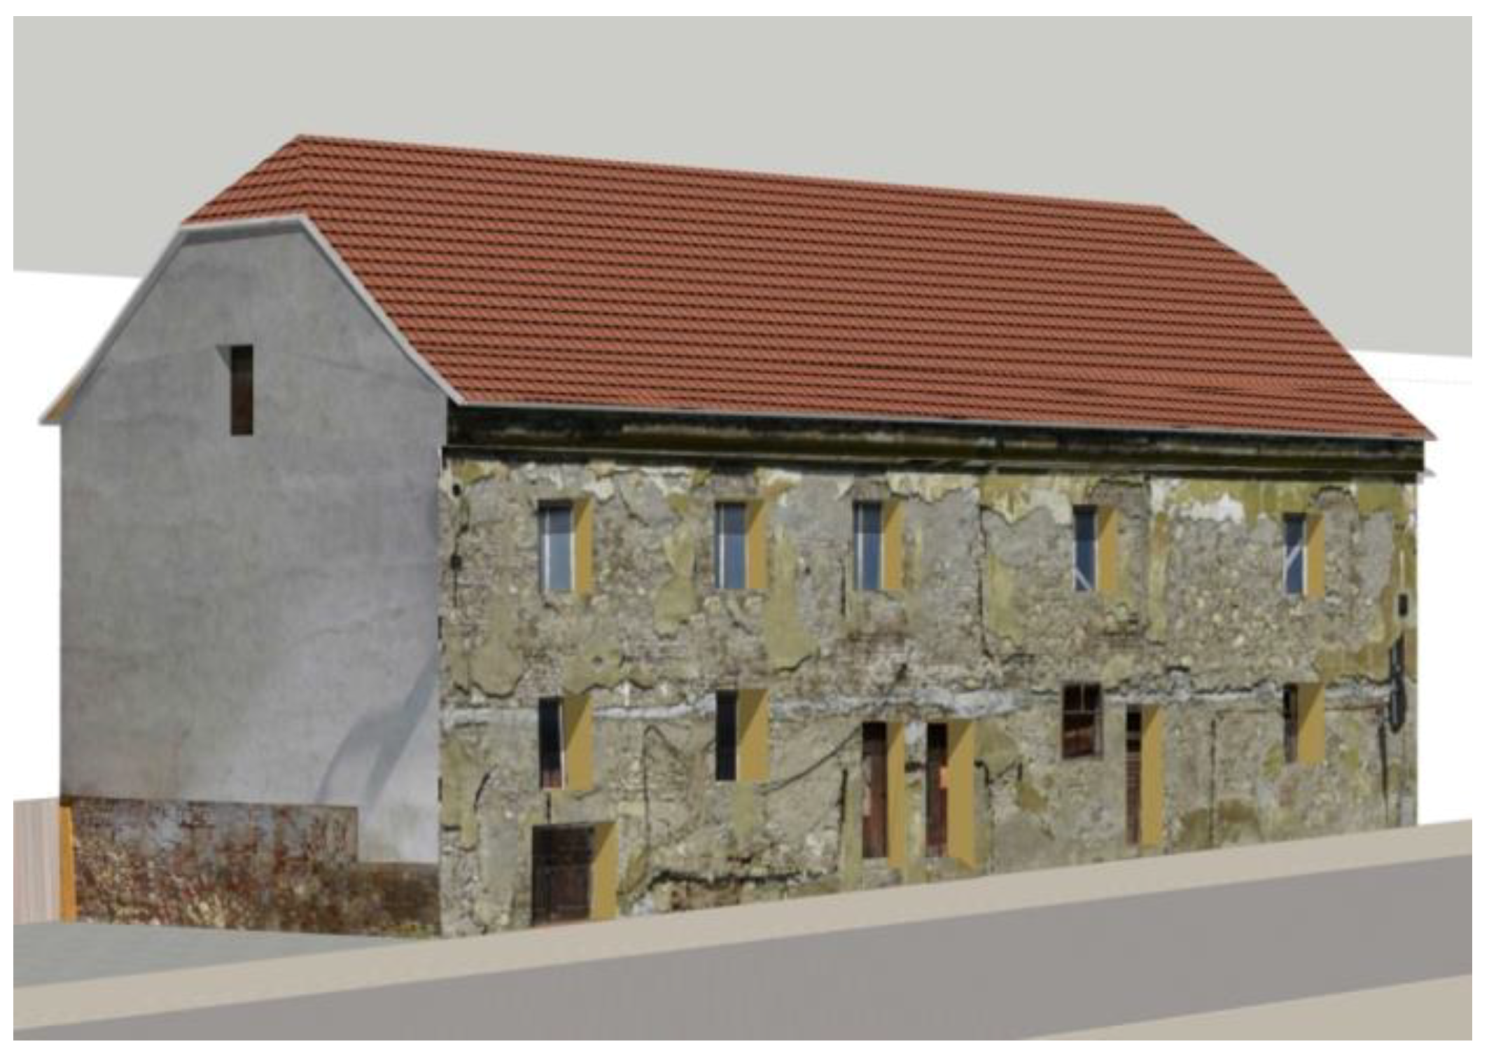
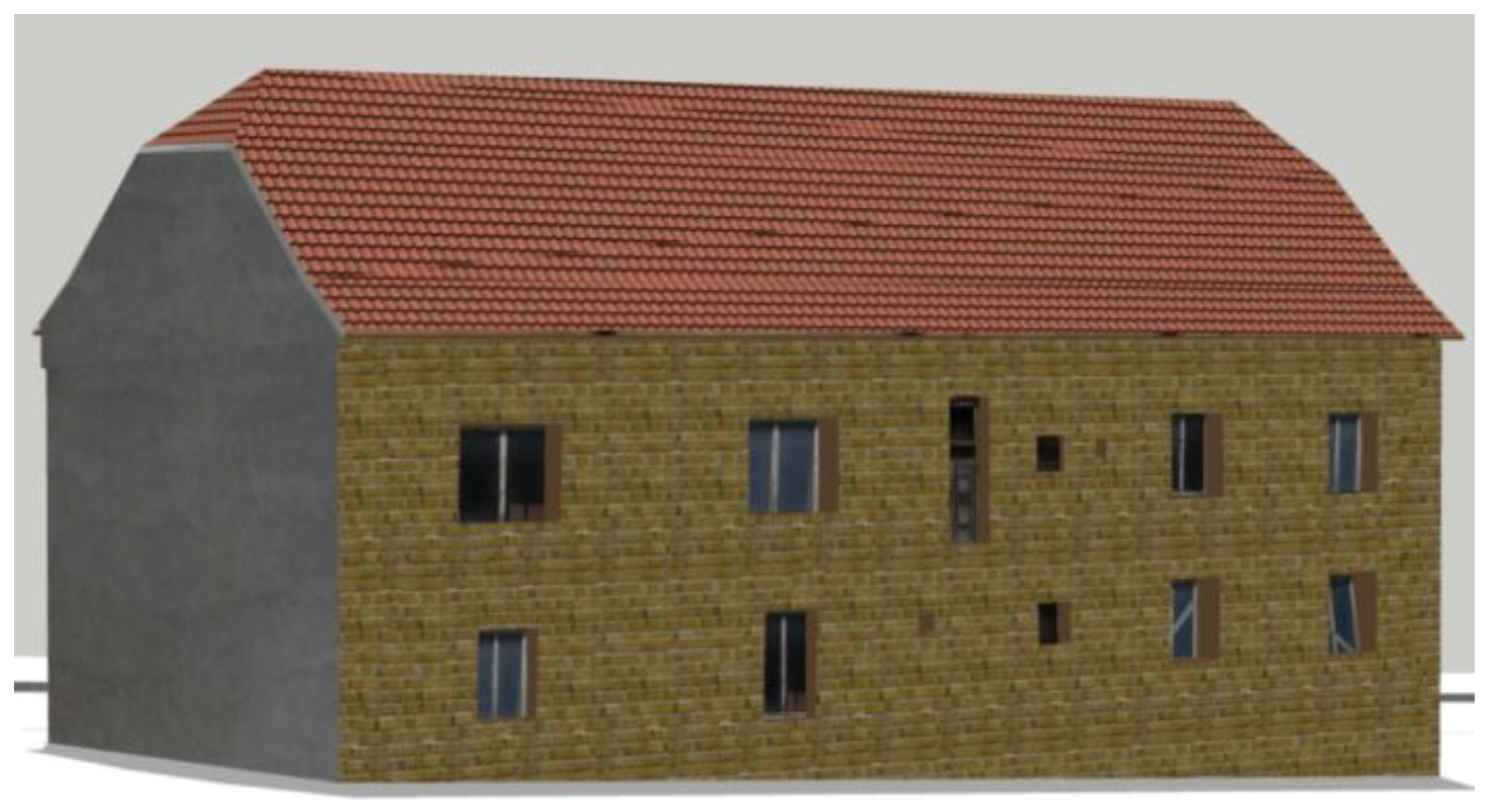
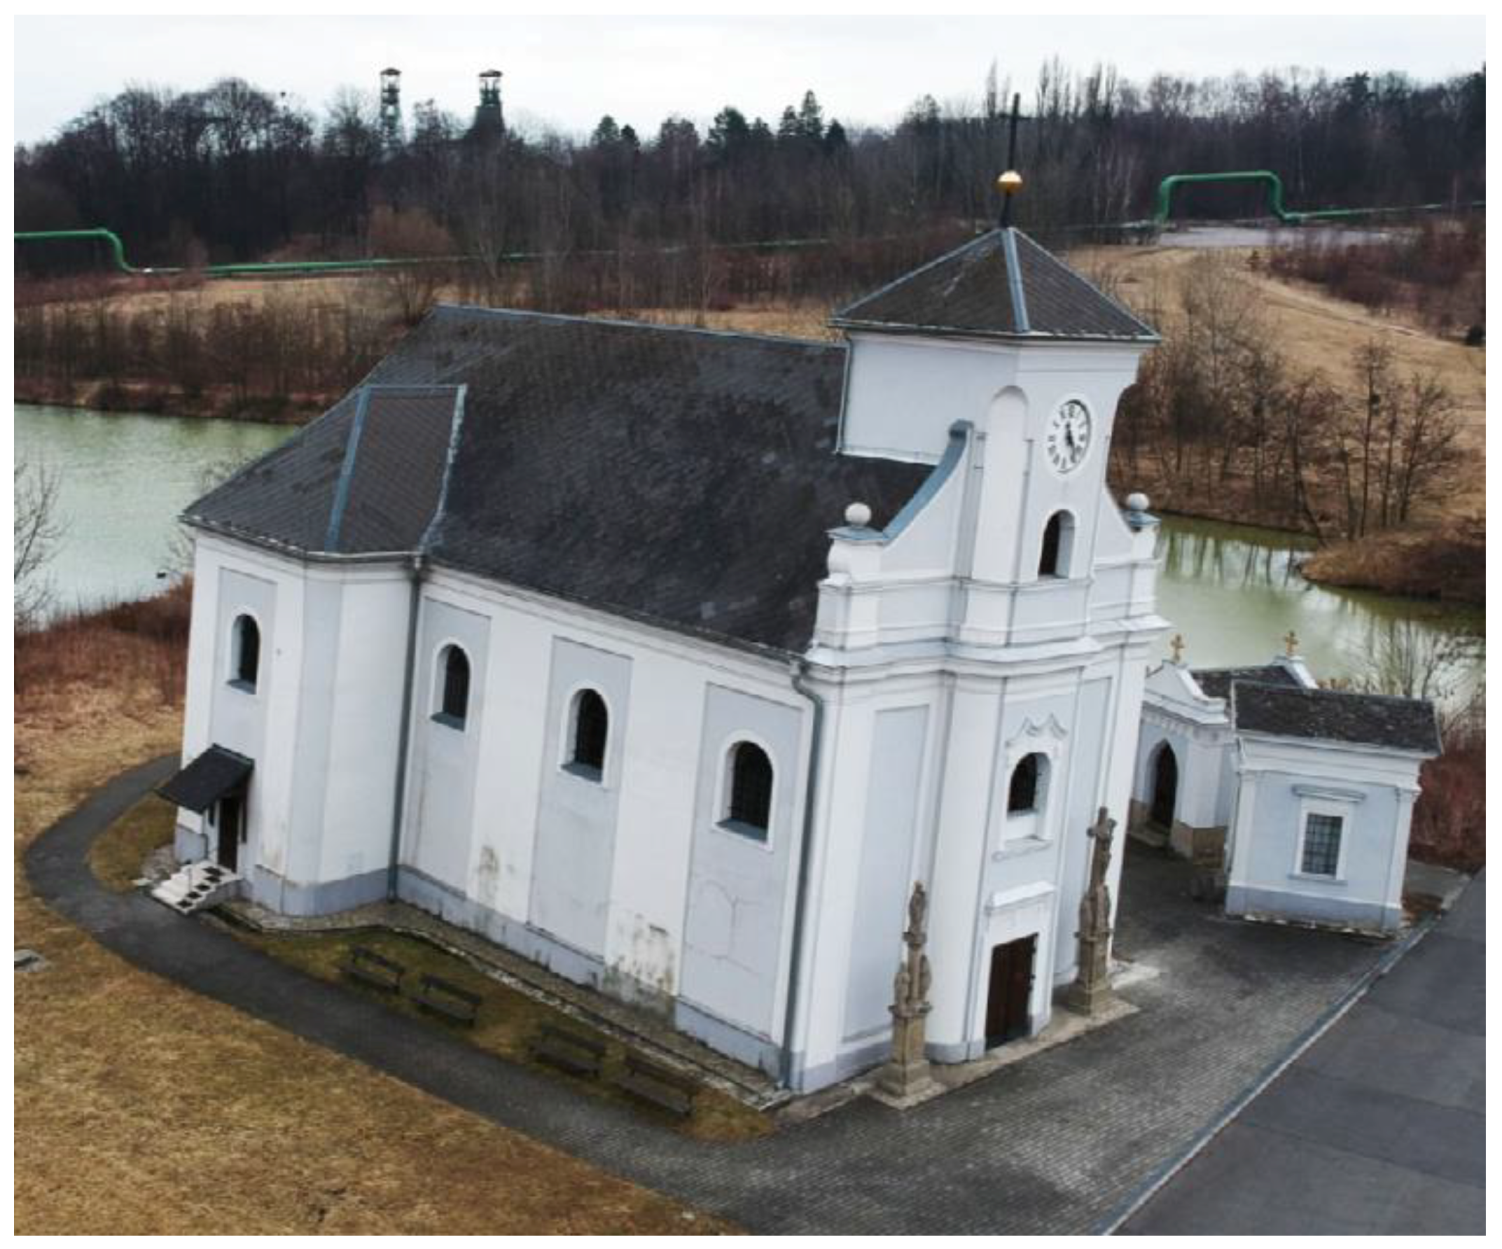
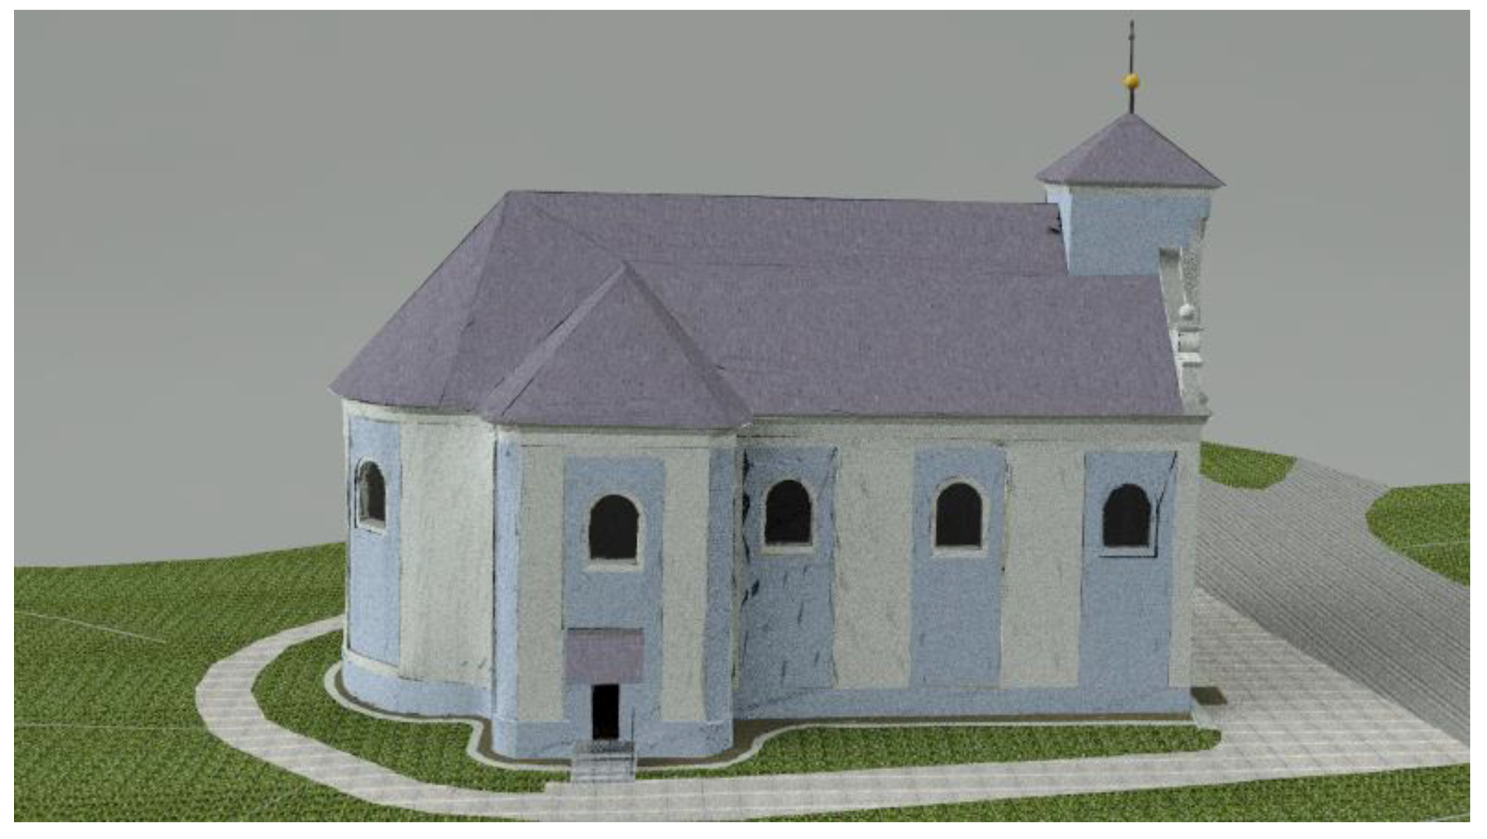
Figure 8) of the two images is obvious. For another 3D model of the Church of St. Peter of Alcantara in Karviná—
Figure 9 and
Figure 10—visualization was performed while using own set of textures. The result is evident from the comparison of
Figure 9 and
Figure 10. The visualization quality of the 3D model is many times higher than that of the Strejc’s Church (
Figure 7 and
Figure 8). However, the bases of both visualizations are the same—the textures in both models were placed on generalized (planar) surfaces. If we left the model without generalization, one of the methods described in [
24] or [
25] would have to be used for visualization.
The described problems occur in all of the 3D models of real objects that the authors have encountered. These examples are only selected typical demonstration examples.
5. Discussion
Practically, the above-mentioned problems manifested in two aspects:
The solution of the above problems is dealt with in several works, of which the most important ones are mentioned.
The Geometric accuracy of the model is further explained in publications [
11,
18,
23]. In paper [
11] the geometry of the 3D model is complemented by a knowledge database that was obtained from a real object. It includes, for example, a tree that captures the GO topology. The article [
18] is dealing with the problem of the precision issue with hybrid modeling. The elements of the building are extracted and then formally saved to the library as an object for further use. Another solution is presented in [
23]. It is a complement of the list of coordinates with topological codes directly when surveying the object in the field. From the list of point coordinates, the exact drawing in the CAD program is then automatically displayed while using a Python script.
Visualization quality is discussed in [
16,
21,
24,
25]. The article [
16] presents a visualization of historical objects that were captured by photogrammetrically special fish-eye camera. The object is measured by laser scanning. An interesting approach to surface modeling is described in [
21]. The object’s surface is approximated by curves that are defined by randomly selected points from the point cloud from laser scanning. Curves are created by special VB.NET applications in the AUTOCAD program. The work [
24] proposes a method of classification of the surface of a 3D object that is based on the skeleton metric of this object. The result of the classification is a set of classes of segments that can be used for the whole surface. The most appropriate display method is then selected for each class. The publication [
25] presents a design of the CatSurf system for displaying 3D objects in CAD (Computer-Aided Design). It is the surface texture information system, which is a part of the integrated CAD surface texture platform. The disadvantage of the latter two applications is that they are highly specialized systems that are difficult for ordinary users available.
6. Conclusions and Future Work
The main problems for creating 3D models of existing GOs were identified and described. The experimental results show that the currently used CAD programs are relatively outdated in its repertoire when compared to the quality and possibilities of geodetic surveying of real objects. Current methods of data acquisition in the field use modern technologies that allow for surveying the object with high accuracy. In addition, data collection devices have a number of built-in features, which allow for people with basic training to use them.
The authors proposed a solution concerning the first part of the problem mentioned in
Section 4, namely the geometric accuracy of the 3D model. A Python application was created to produce a wireframe 3D model from a list of coordinate points with topological codes in suitable software. This procedure will significantly speed up the whole process-see
Figure 1 and make the work easier for users. The script can be added as a plug-in to CAD software.
Further research in this area will be focused on solving the problem of quality visualization of the 3D model of GO.
Author Contributions
D.B. has provided support materials, elaborated literature review and create system model, M.B. conducted an overall editorial of the whole article and a professional translation. All authors have read and agreed to the published version of the manuscript.
Funding
This research was funded by the Grant No. FAST-J-19-5994 of the Brno University of Technology, Czech Republic.
Acknowledgments
We greatly appreciate the careful reviews and thoughtful suggestions by reviewers.
Conflicts of Interest
The authors declare no conflict of interest.
References
- Ding, Z.; Liu, S.; Liao, L.; Zhang, L. A digital construction framework integrating building information modeling and reverse engineering technologies for renovation projects. Autom. Constr. 2019, 102, 45–58. [Google Scholar] [CrossRef]
- Mesaros, P.; Kozlovska, M.; Hruby, K. Potential of IT Based Reverse Engineering in Civil Engineering and architecture. In Proceedings of the 3rd International Multidisciplinary Scientific Conference on Social Sciences and Arts SGEM 2016, Vienna, Austria, 6–9 April 2016; pp. 765–772. [Google Scholar]
- Michalková, J. 3D Model Dřevěného Kostela sv. Paraskivy v Blansku (3D Model of Wooden Church of st. Paraskiva in Blansko). Master’s Thesis, Brno University of Technology, Brno, Czech Republic, 2018; p. 49. [Google Scholar]
- Vilčeková, L. 3D Model Kostela sv. Janů v Brně—Bystrci (3D Model of st John’s Church in Brno-Bystrc). Master’s Thesis, Brno University of Technology, Brno, Czech Republic, 2018; p. 46. [Google Scholar]
- Kaličiaková, J. 3D Model Objektu Strejcův sbor v Židlochovicích. (3D Model of Strejc’s Church in Židlochovice). Master’s Thesis, Brno University of Technology, Brno, Czech Republic, 2018; p. 45. [Google Scholar]
- Giemza, L. 3D model kostela sv. Petra z Alkantary v Karviné (3D model of church of st. Peter of Alkantara in Karviná). Master’s Thesis, Brno University of Technology, Brno, Czech Republic, 2019; p. 45. [Google Scholar]
- Prati, D.; Zuppella, G.; Mochi, G.; Guardigli, L.; Gulli, R. Wooden trusses reconstruction and analysis through parametric 3d modeling. In Proceedings of the 8th International Workshop on 3D Virtual Reconstruction and Visualization of Complex Architectures (3D-ARCH), Bergamo, Italy, 6–8 February 2019; Volume 42-2, pp. 623–629. [Google Scholar]
- Nieves-Chinchilla, J.; Martinez, R.; Farjas, M.; Tubio-Pardavila, R.; Cruz, D.; Gallego, M. Reverse engineering techniques to optimize facility location of satellite ground stations on building roofs. Autom. Constr. 2018, 90, 156–165. [Google Scholar] [CrossRef]
- Meidow, J.; Uslaender, T.; Schulz, K. Obtaining as-built models of manufacturing plants from point clouds. Automatisierungstechnik 2018, 66, 397–405. [Google Scholar] [CrossRef]
- Lee, M.; Lee, S.; Kwon, S.; Chin, S. A Study on Scan Data Matching for Reverse Engineering of Pipes in Plant Construction. KSCE J. Civ. Eng. 2017, 21, 2027–2036. [Google Scholar] [CrossRef]
- Perkins, M.; Daniels, K. Visualizing Dynamic Gene Interactions to Reverse Engineer Gene Regulatory Networks using Topological Data Analysis. In Proceedings of the 21st International Conference on Information Visualisation (IV), London, UK, 11–14 July 2017; pp. 384–389. [Google Scholar]
- Pawlowicz, J.A. Importance of Laser Scanning Resolution in the Process of Recreating the Architectural Details of Historical Buildings. In Proceedings of the World Multidisciplinary Civil Engineering-Architecture-Urban Planning Symposium (WMCAUS), Prague, Czech Republic, 12–16 June 2017. [Google Scholar]
- Pawlowicz, J.A.; Szafranko, E. Application of reverse engineering in modelling of rural buildings of religious worship. In Proceedings of the 15th International Scientific Conference on Engineering for Rural Development, Jelgava, Latvia, 25–27 May 2016; pp. 762–766. [Google Scholar]
- Artese, S.; Lerma, J.L.; Zagari, G.; Zinno, R. The survey, the representation and the structural modeling of a dated bridge. In Proceedings of the 8th International Congress on Archaeology, Computer Graphics, Cultural Heritage and Innovation (ARQUEOLOGICA), Valencia, Spain, 5–7 September 2016; pp. 162–168. [Google Scholar]
- Covas, J.; Ferreira, V.; Mateus, L. 3D Reconstruction with Fisheye Images Strategies to Survey Complex Heritage Buildings. In Proceedings of the Digital Heritage International Congress, Granada, Spain, 28 September–2 October 2015; pp. 123–126. [Google Scholar]
- Cazacu, R.; Grama, L. Constructing 3D Surfaces from Random Sets of Points by Means of Level Curves. In Proceedings of the 17th International Conference on Innovative Manufacturing Engineering, Iasi, Romania, 23–24 May 2013; Volume 371, pp. 483–487. [Google Scholar]
- Dore, C.; Murphy, M. Semi-automatic modelling of building facades with shape grammars using historic building information modelling. In Proceedings of the Conference on 3D Virtual Reconstruction and Visualization of Complex Architectures (3D-ARCH), Trento, Italy, 25–26 February 2013; Volume 40-5-W1, pp. 57–64. [Google Scholar]
- Musat, C.C.; Herban, I.S. Study on Reverse Engineering of Historical Architecture in Timisoara BASED on 3D Laser Point Technologies. J. Environ. Prot. Ecol. 2012, 13, 1107–1116. [Google Scholar]
- Murphy, M.; McGovern, E.; Pavia, S. Historic building information modelling—Adding intelligence to laser and image based surveys. In Proceedings of the 4th ISPRS International Workshop 3D-ARCH—3D Virtual Reconstruction and Visualization of Complex Architectures, Trento, Italy, 2–4 March 2011; Volume 38-5, pp. 1–7. [Google Scholar]
- Zhao, J.; Wu, J.; Wang, Y. Ancient Architecture Point Cloud Data Segmentation Based on Gauss Map. In Proceedings of the International Conference on Ecological Protection of Lakes-Wetlands-Watershed and Application of 3S Technology (EPLWW3S 2011), Nanchang, China, 25–26 June 2011; Volume 3, pp. 402–405. [Google Scholar]
- Durupt, A.; Remy, S.; Ducellier, G.; Guyot, E. A new reverse engineering process, the combination between the knowledge extraction and the geometrical recognition techniques. In Proceedings of the International Conference on Computers and Industrial Engineering (CIE39), Troyes, France, 6–9 July 2009; Volume 1–3, pp. 1367–1372. [Google Scholar]
- De Luca, L.; Veron, P.; Florenzano, M. Reverse engineering of architectural buildings based on a hybrid modeling approach. Comput. Graph. UK 2006, 30, 160–176. [Google Scholar] [CrossRef]
- Bartoněk, D.; Bureš, J.; Ježek, J.; Vacková, E. Automatic creation of field survey sketch by using of topological codes. In Proceedings of the 19th International Multidisciplinary Scientific GeoConference SGEM 2019, Albena, Bulgaria, 28 June–9 July 2019; Volume 19, pp. 777–784, ISBN 978-619-7408-79-9, ISSN 1314-2704. [Google Scholar] [CrossRef]
- Beynea, T.B.; Morina, G.; Leonardb, K.; Hahmann, S.; Carliera, A. A salience measure for 3D shape decomposition and sub-parts classification. Graph. Models 2018, 99, 22–30. [Google Scholar] [CrossRef]
- Qi, Q.; Scott, P.J.; Jiang, X.; Lu, W. Design and implementation of an integrated surface texture information system for design, manufacture and measurement. Comput. Aided Des. 2014, 50, 41–53. [Google Scholar] [CrossRef][Green Version]
© 2020 by the authors. Licensee MDPI, Basel, Switzerland. This article is an open access article distributed under the terms and conditions of the Creative Commons Attribution (CC BY) license (http://creativecommons.org/licenses/by/4.0/).


