Optimization by Context Refinement for Development of Incremental Granular Models


Abstract
1. Introduction
2. IGM
2.1. Linear Regression
2.2. Context-Based Fuzzy C-Means Clustering
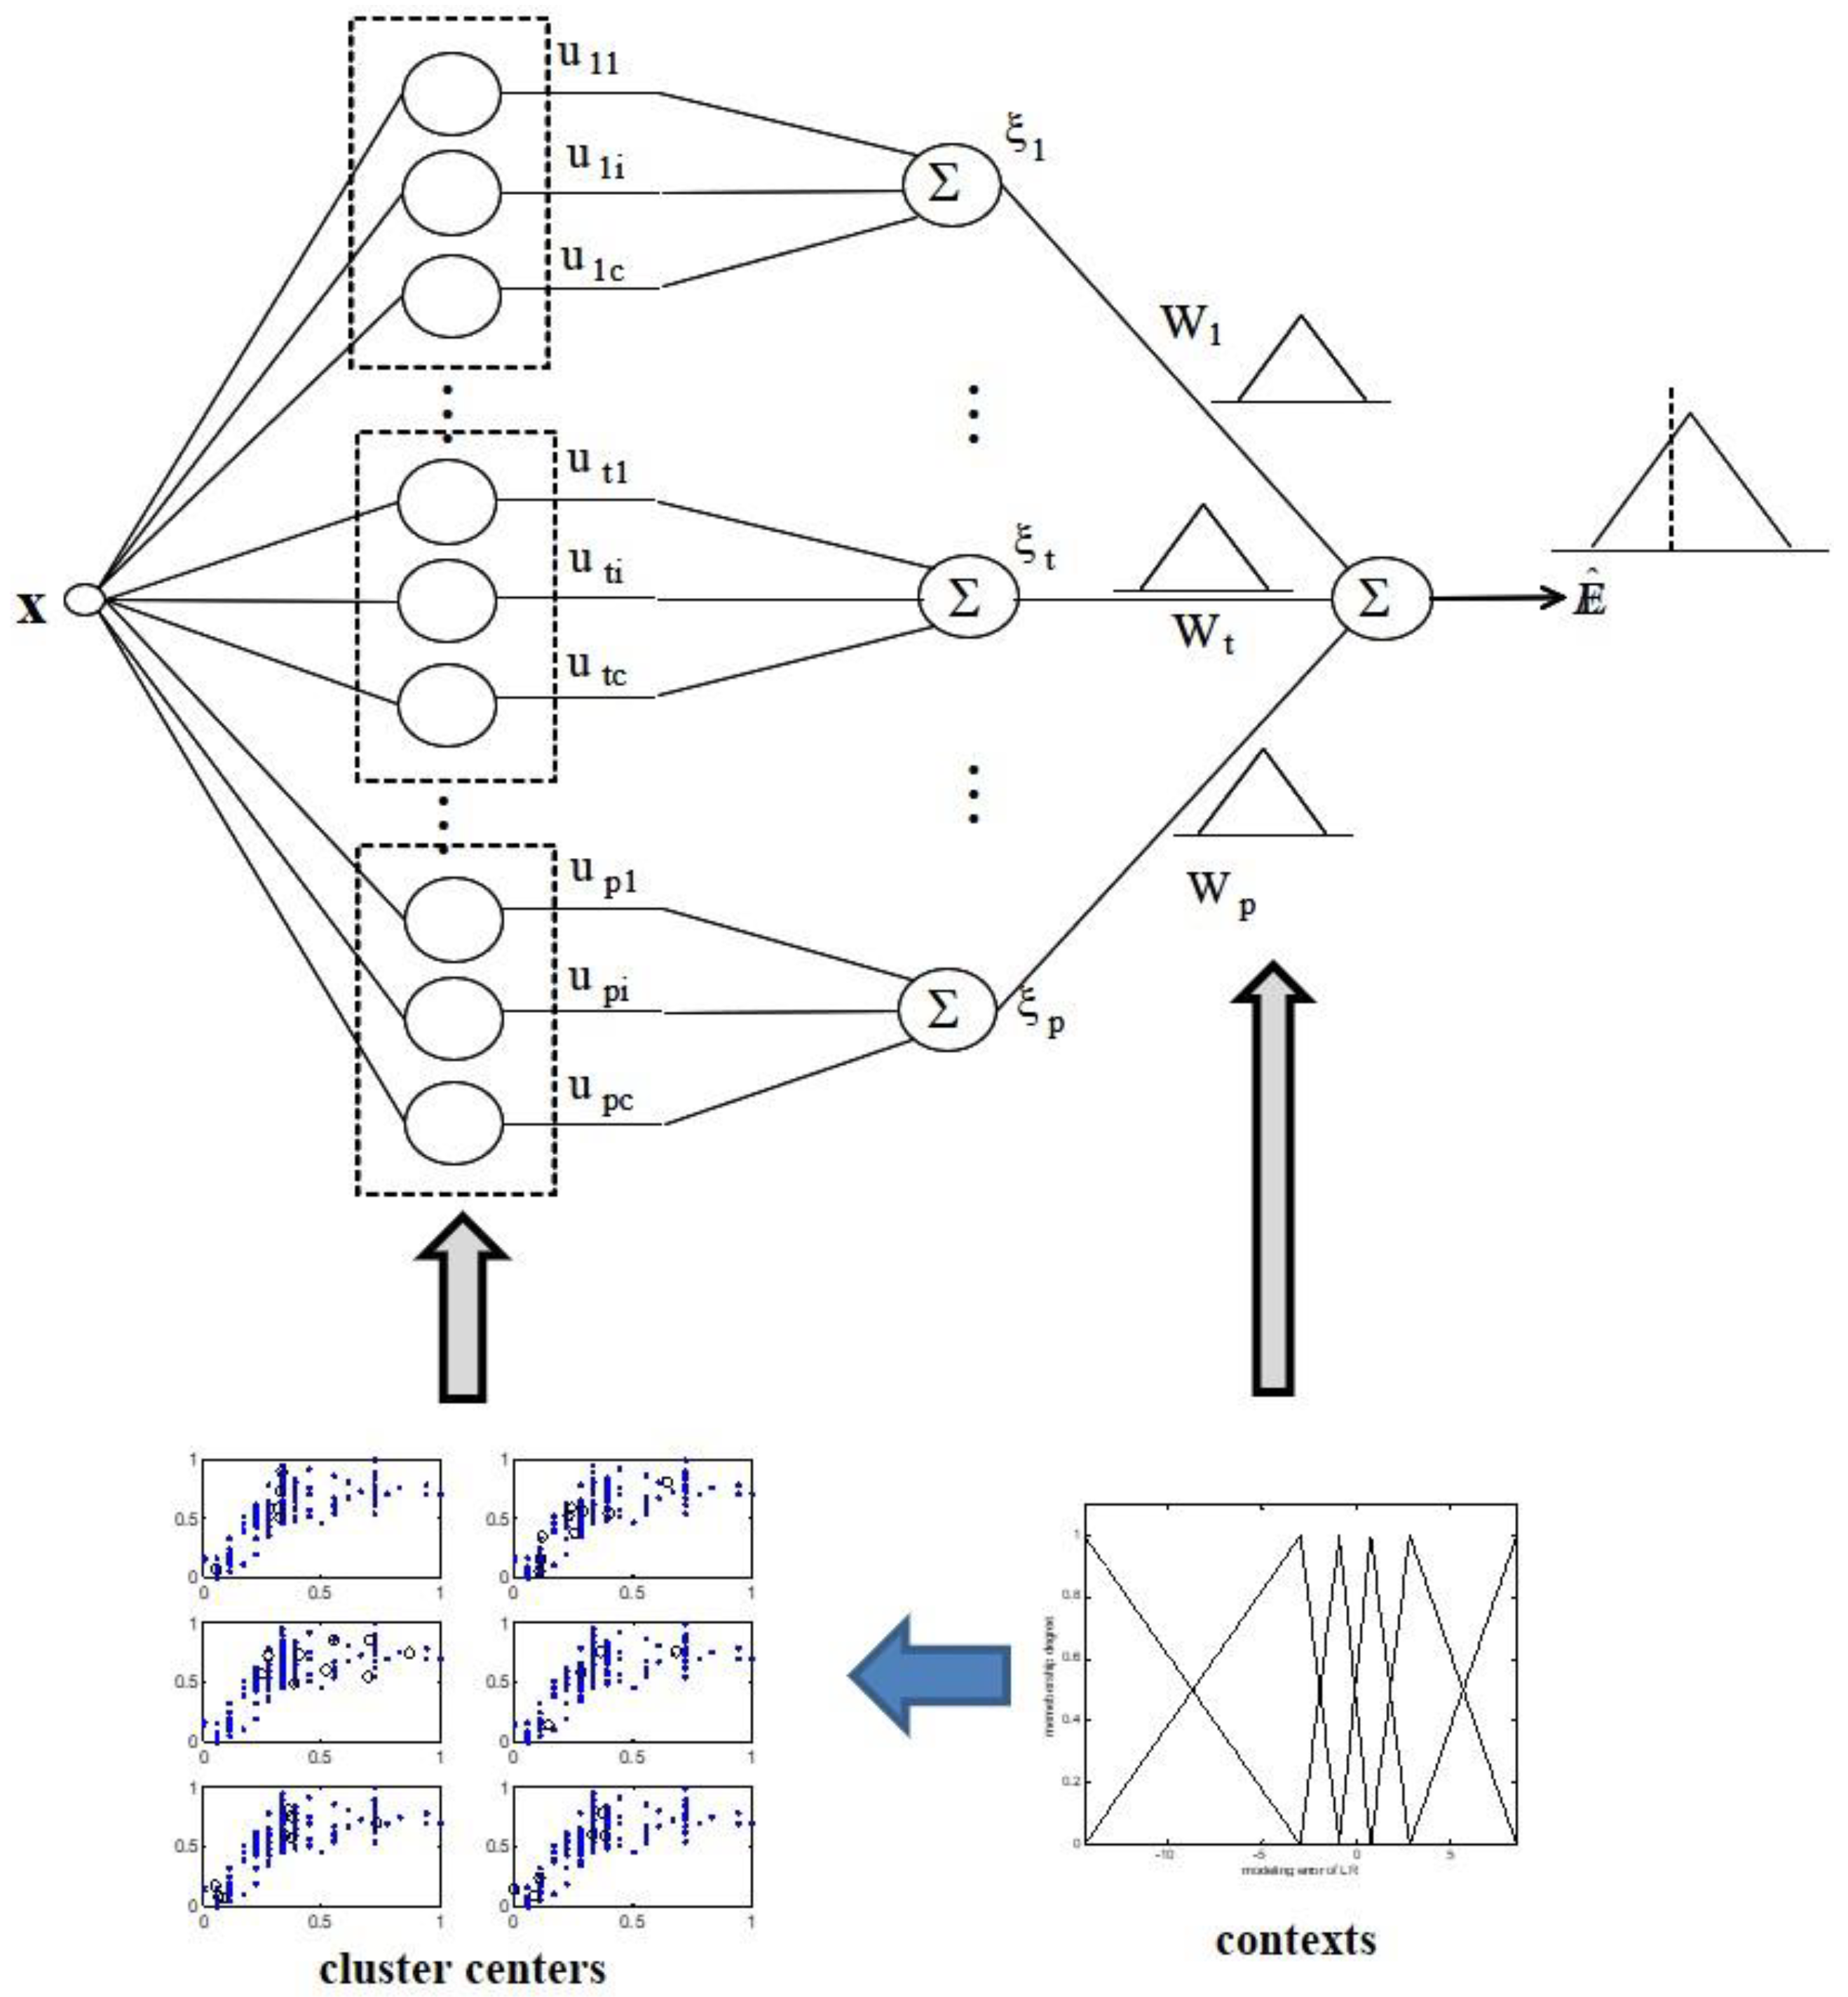
2.3. Local GFM
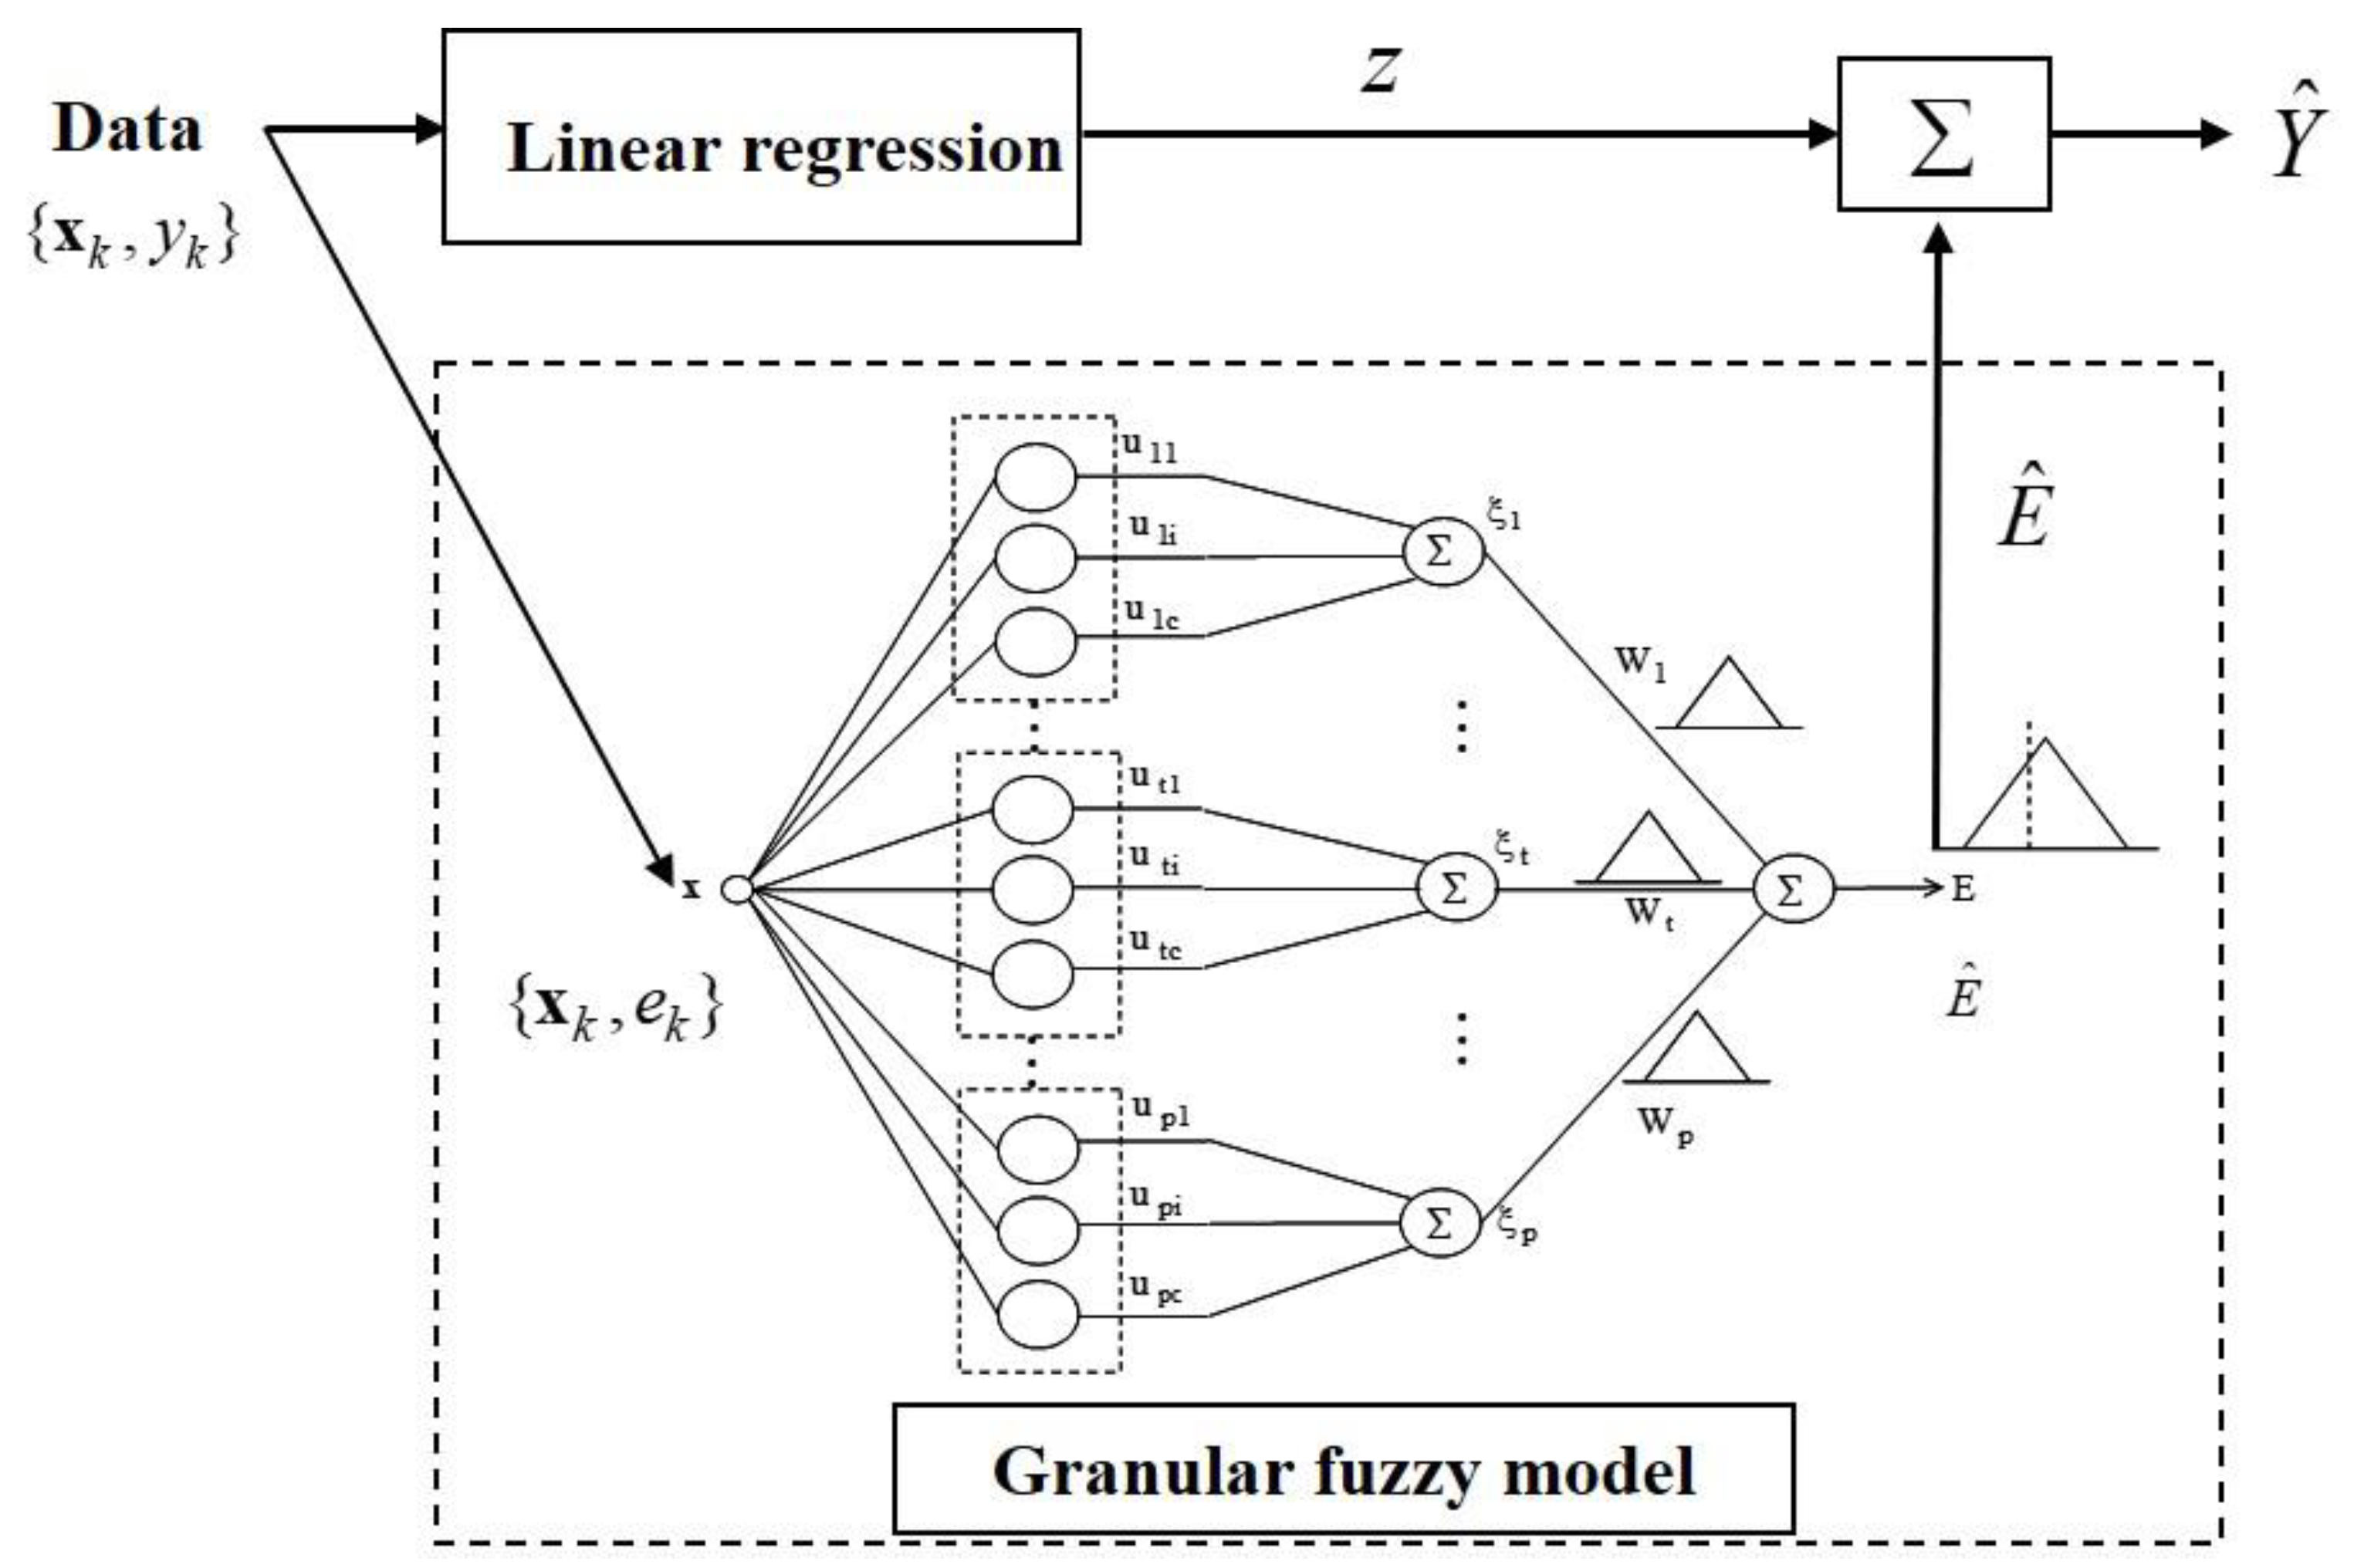
2.4. IGM
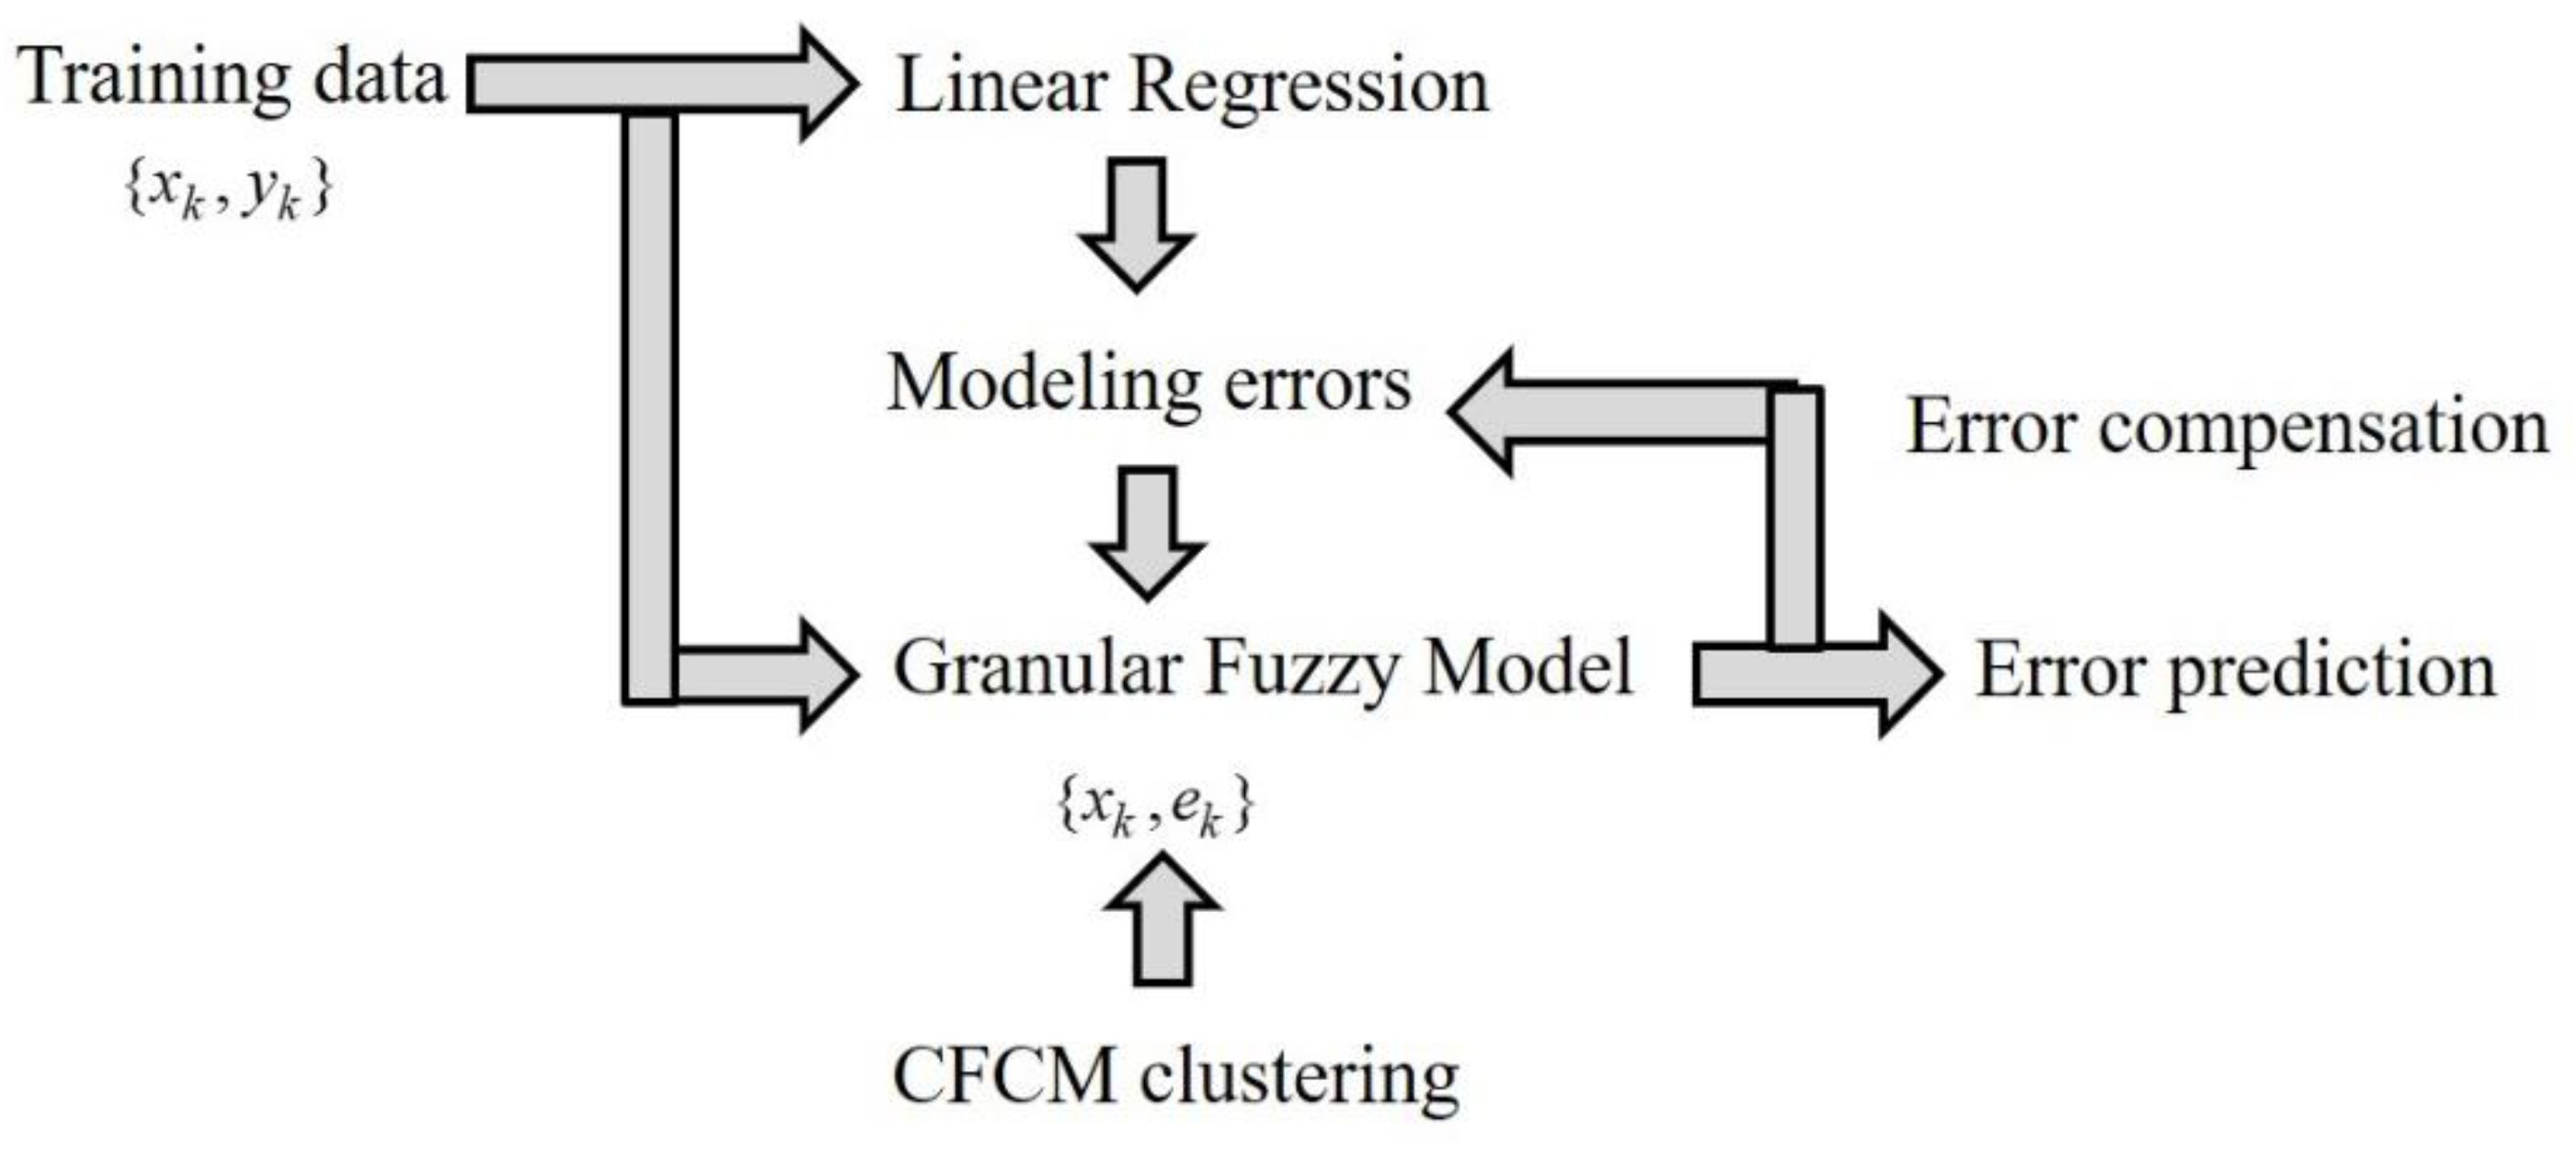
- [Step 1]
- Use linear regression on the numerical data points. Subsequently, the errors are obtained by the difference between the desired and linear regression outputs.
- [Step 2]
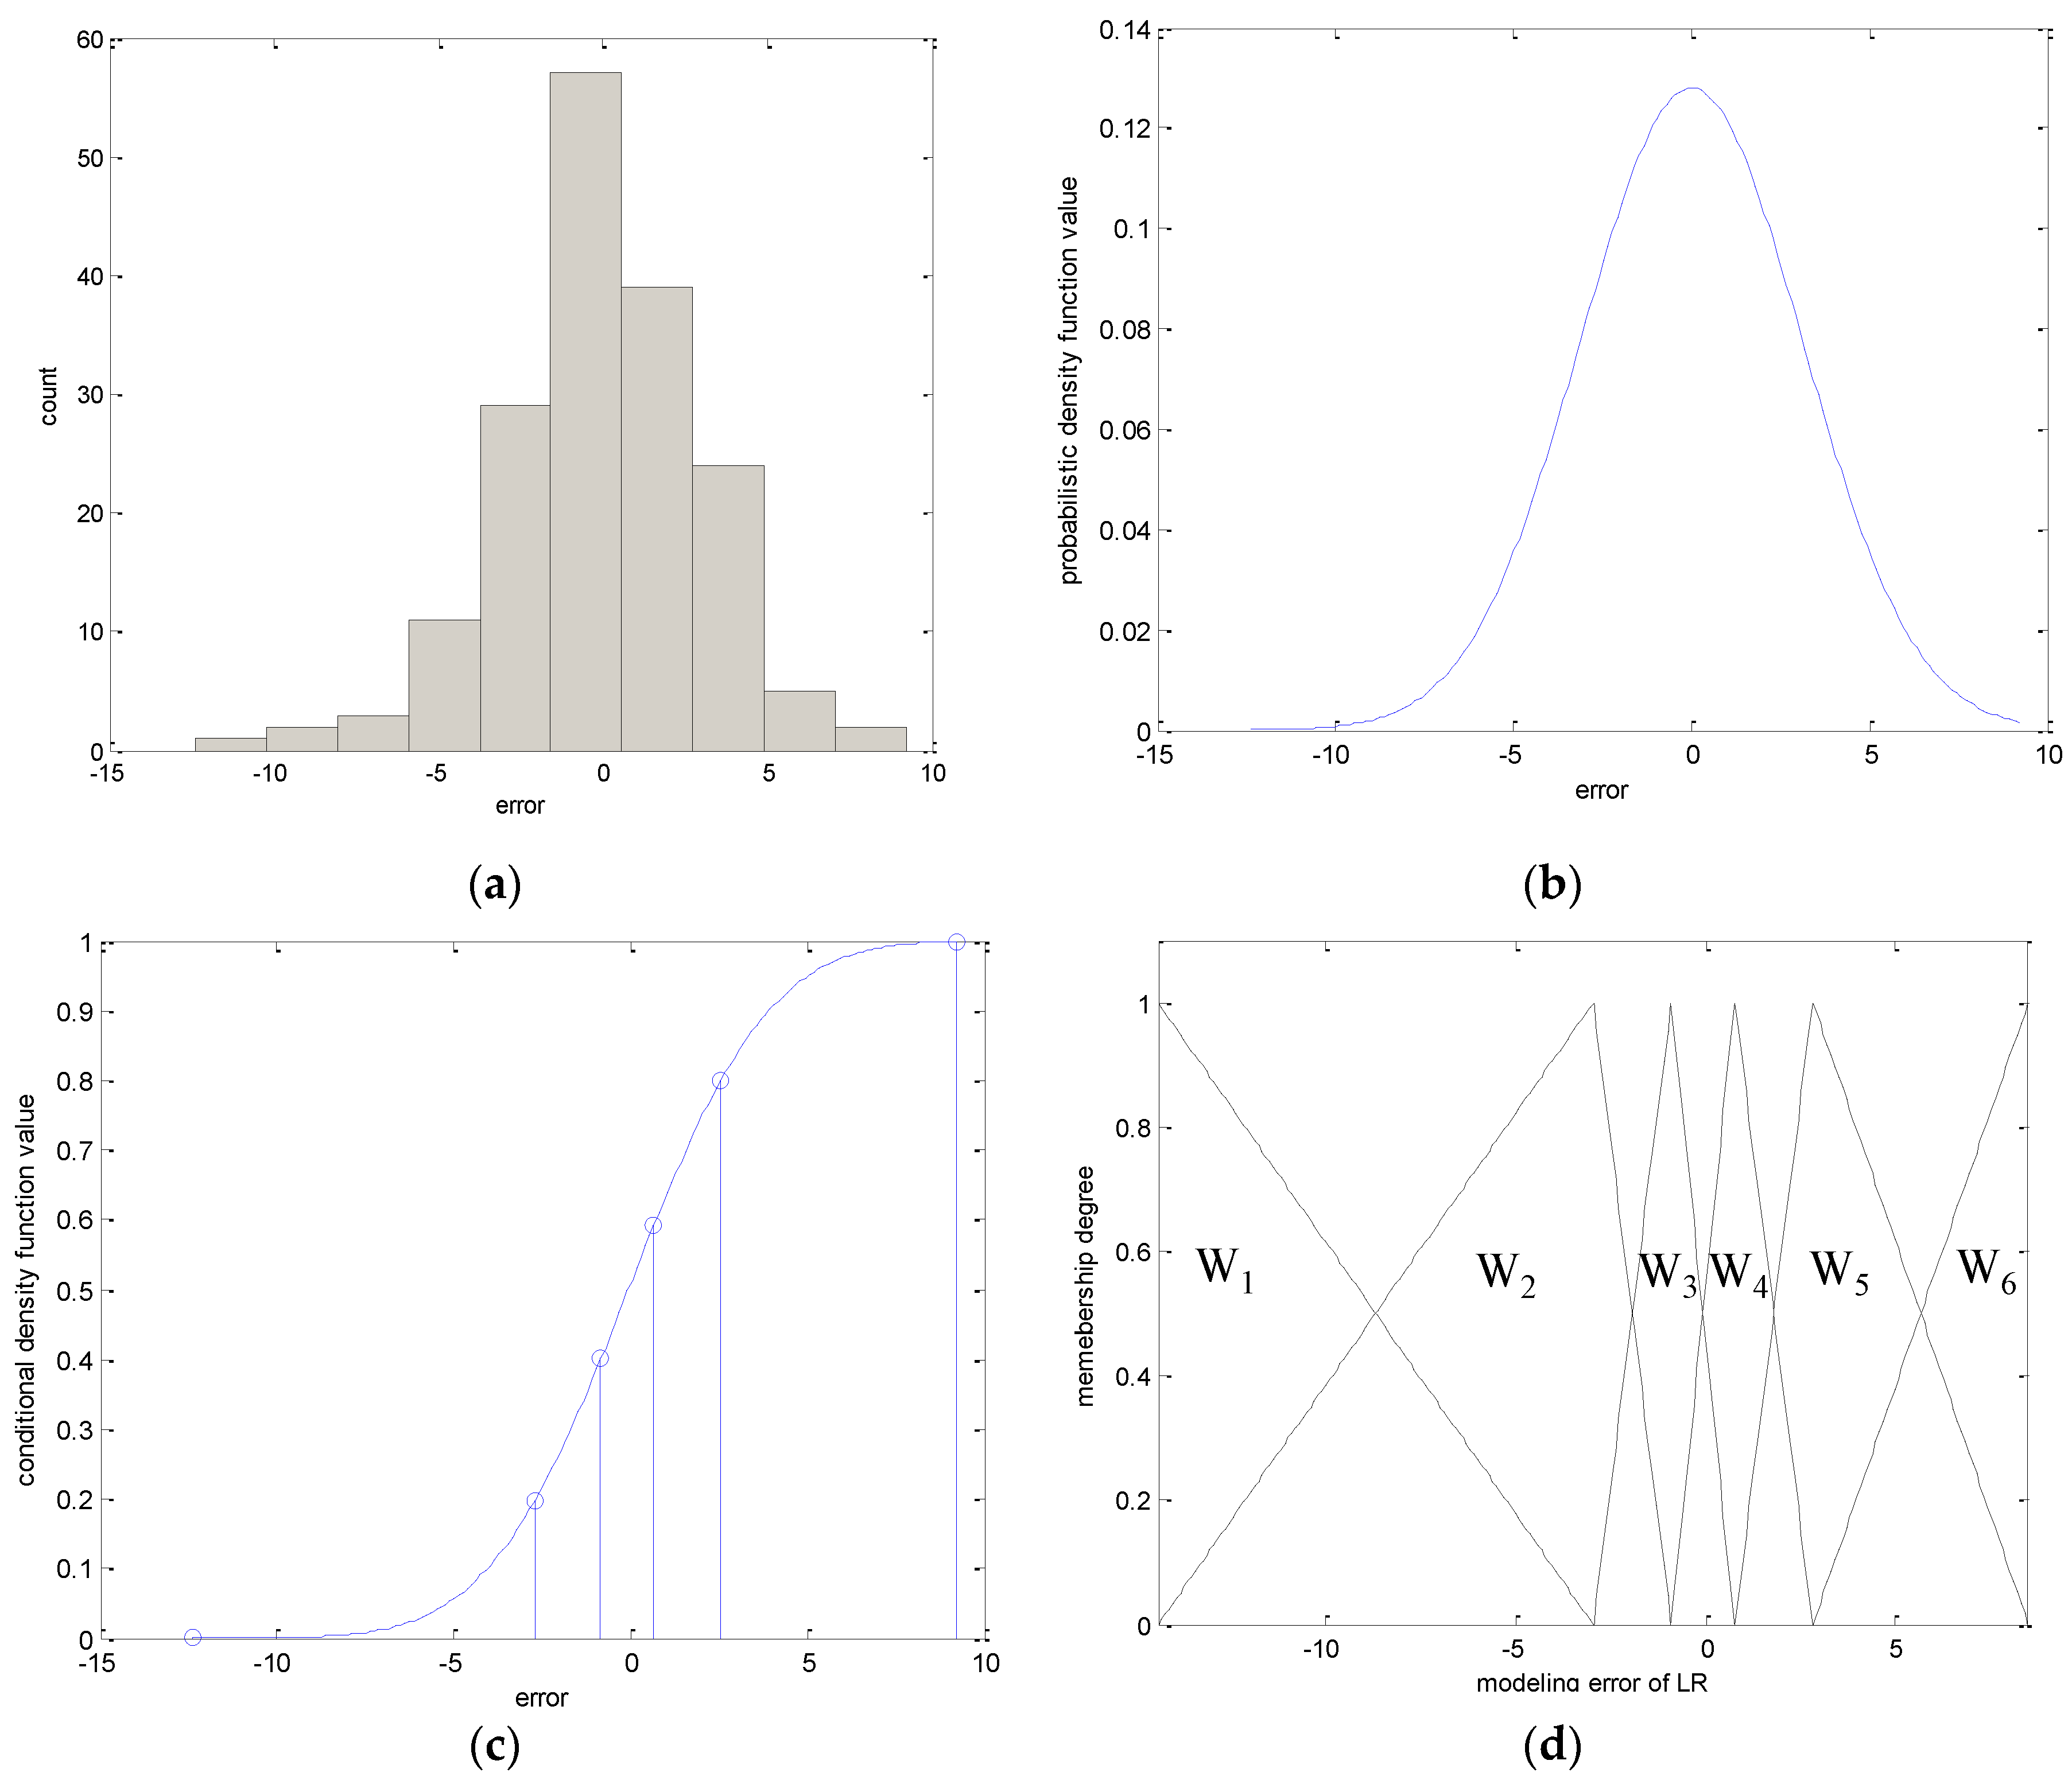
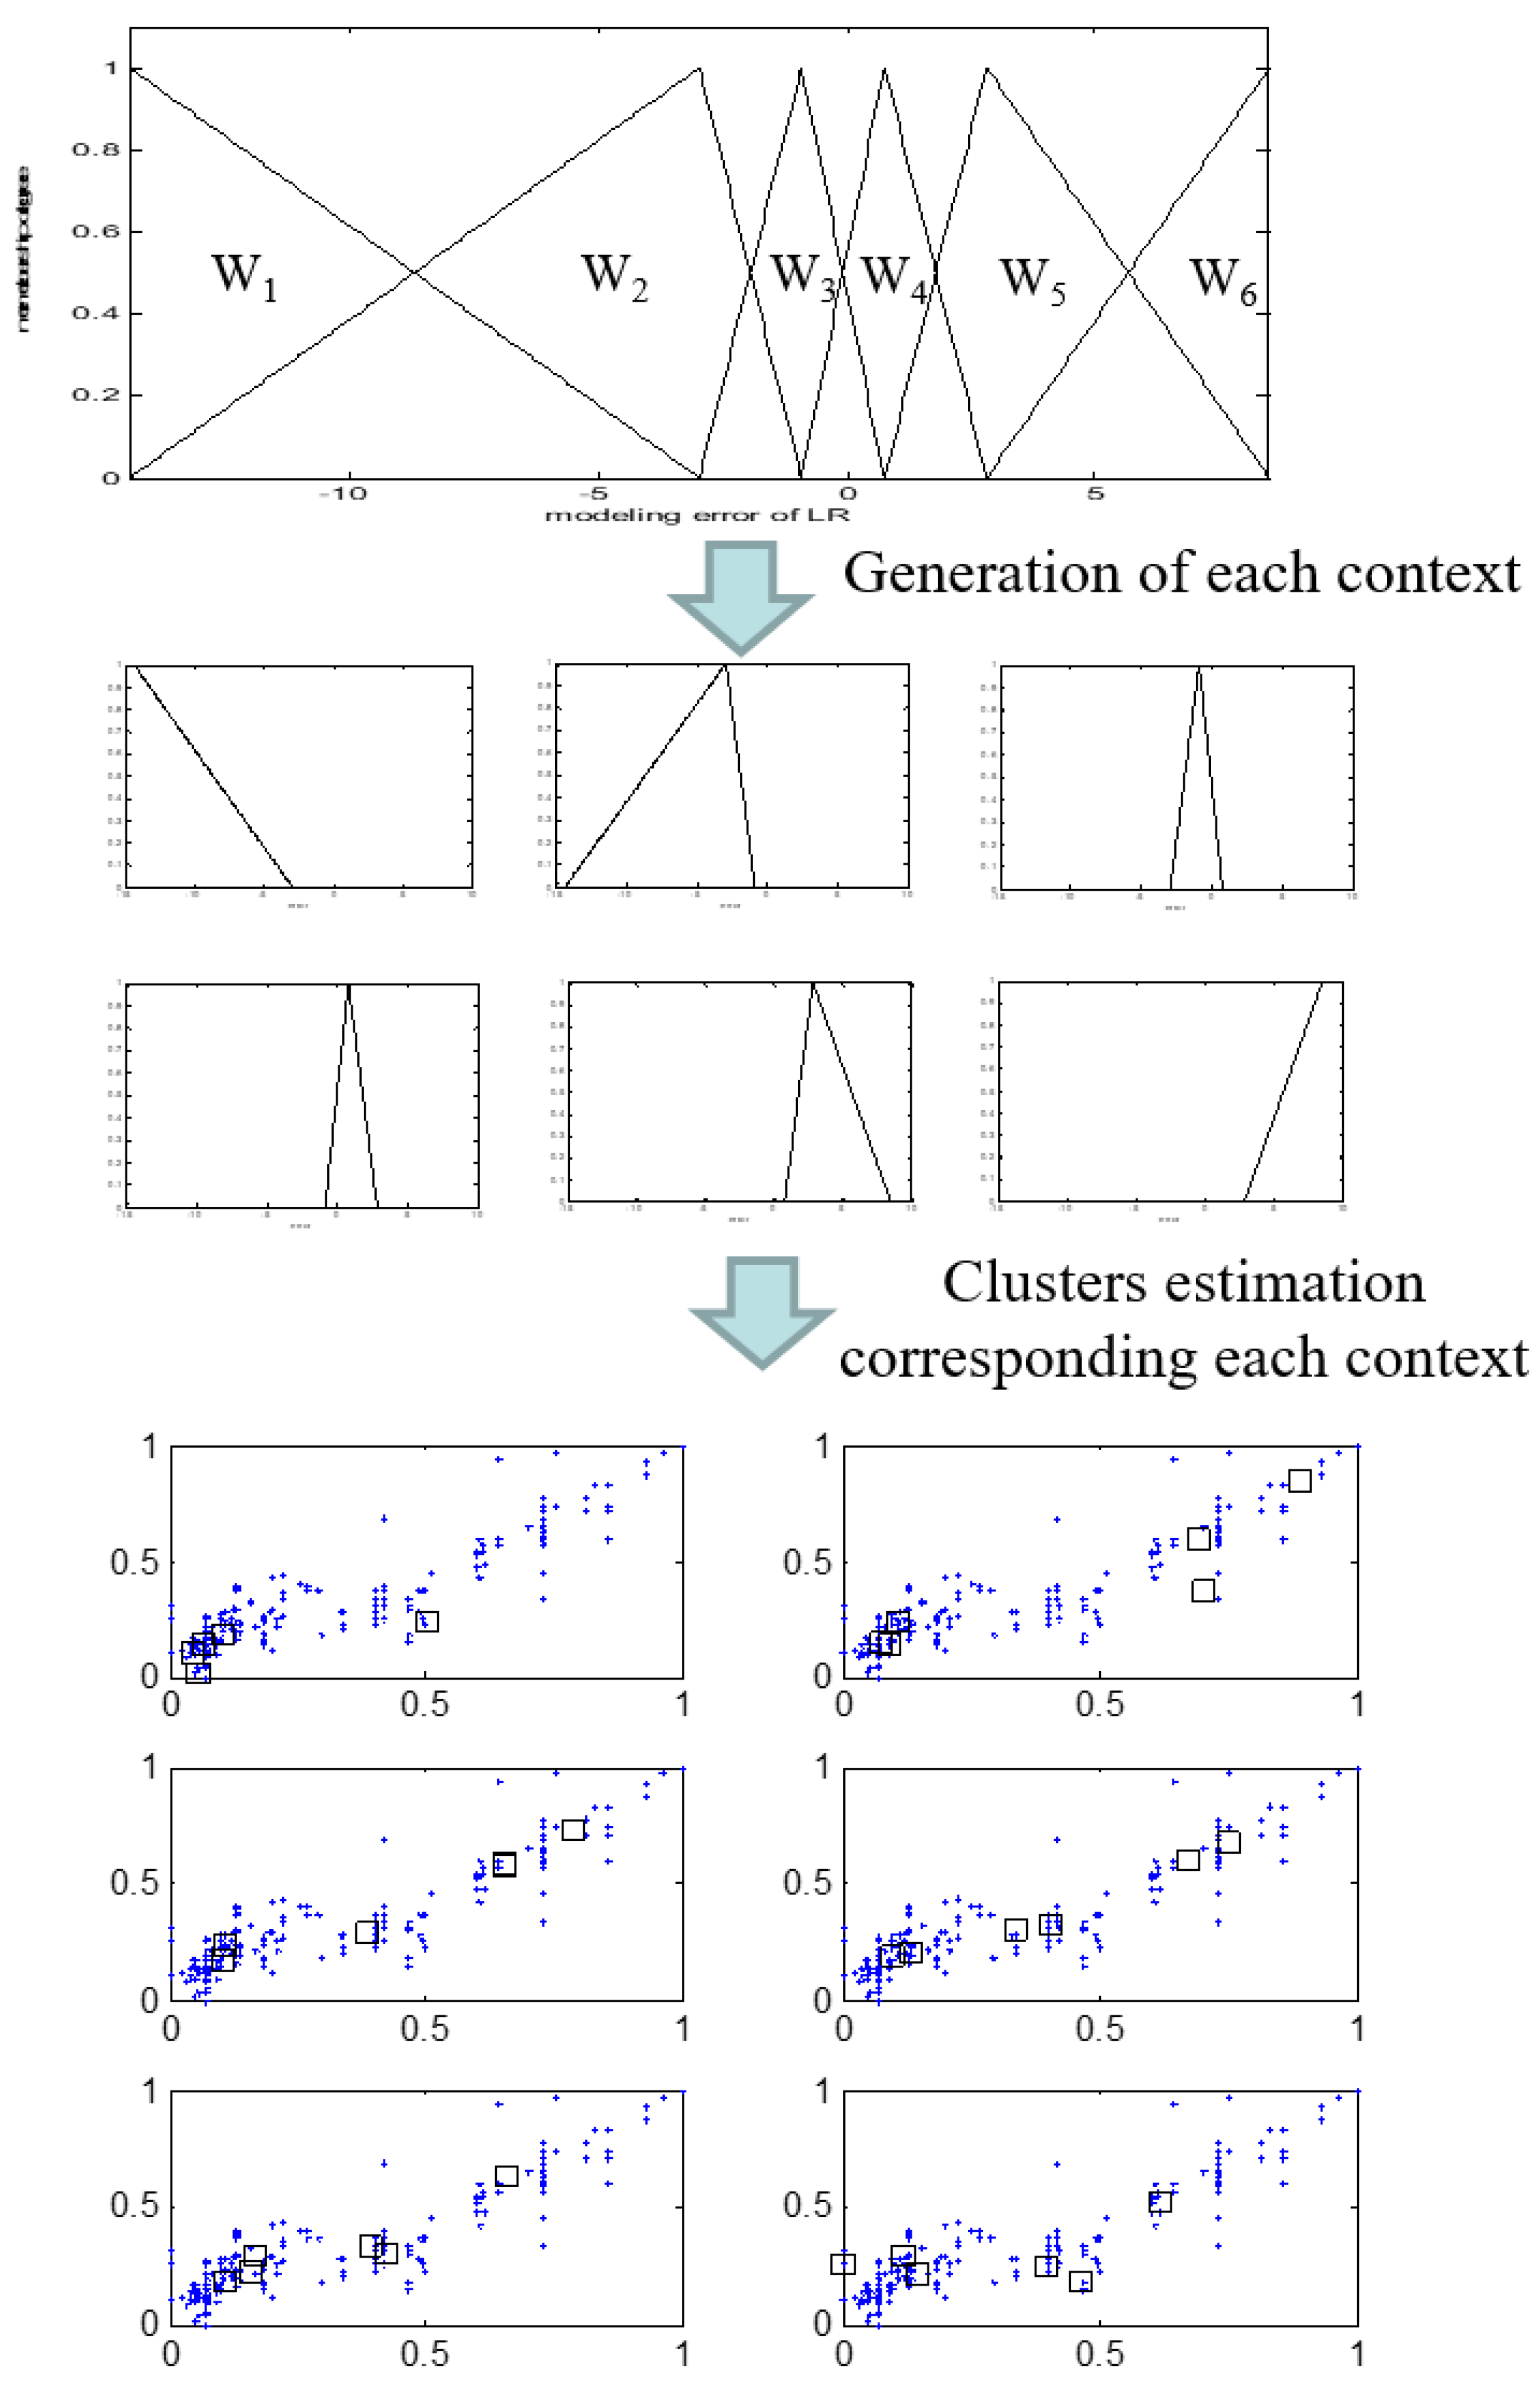
- Obtain the input and error pairs . These error values are employed as the output data in the use of the local GFM. Subsequently, the contexts in the error space are generated. The linguistic contexts are produced as shown in Figure 1.
- [Step 3]
- Estimate the clusters using context-based fuzzy clustering approach.
- [Step 4]
- Calculate the aggregation values by the linear summation of the activation levels and the context weight. Consequently, the model output results in fuzzy number with a triangular type.
- [Step 5]
- Integrate the linear regression output and granular results of the GFM. Hence, the prediction result is expressed as
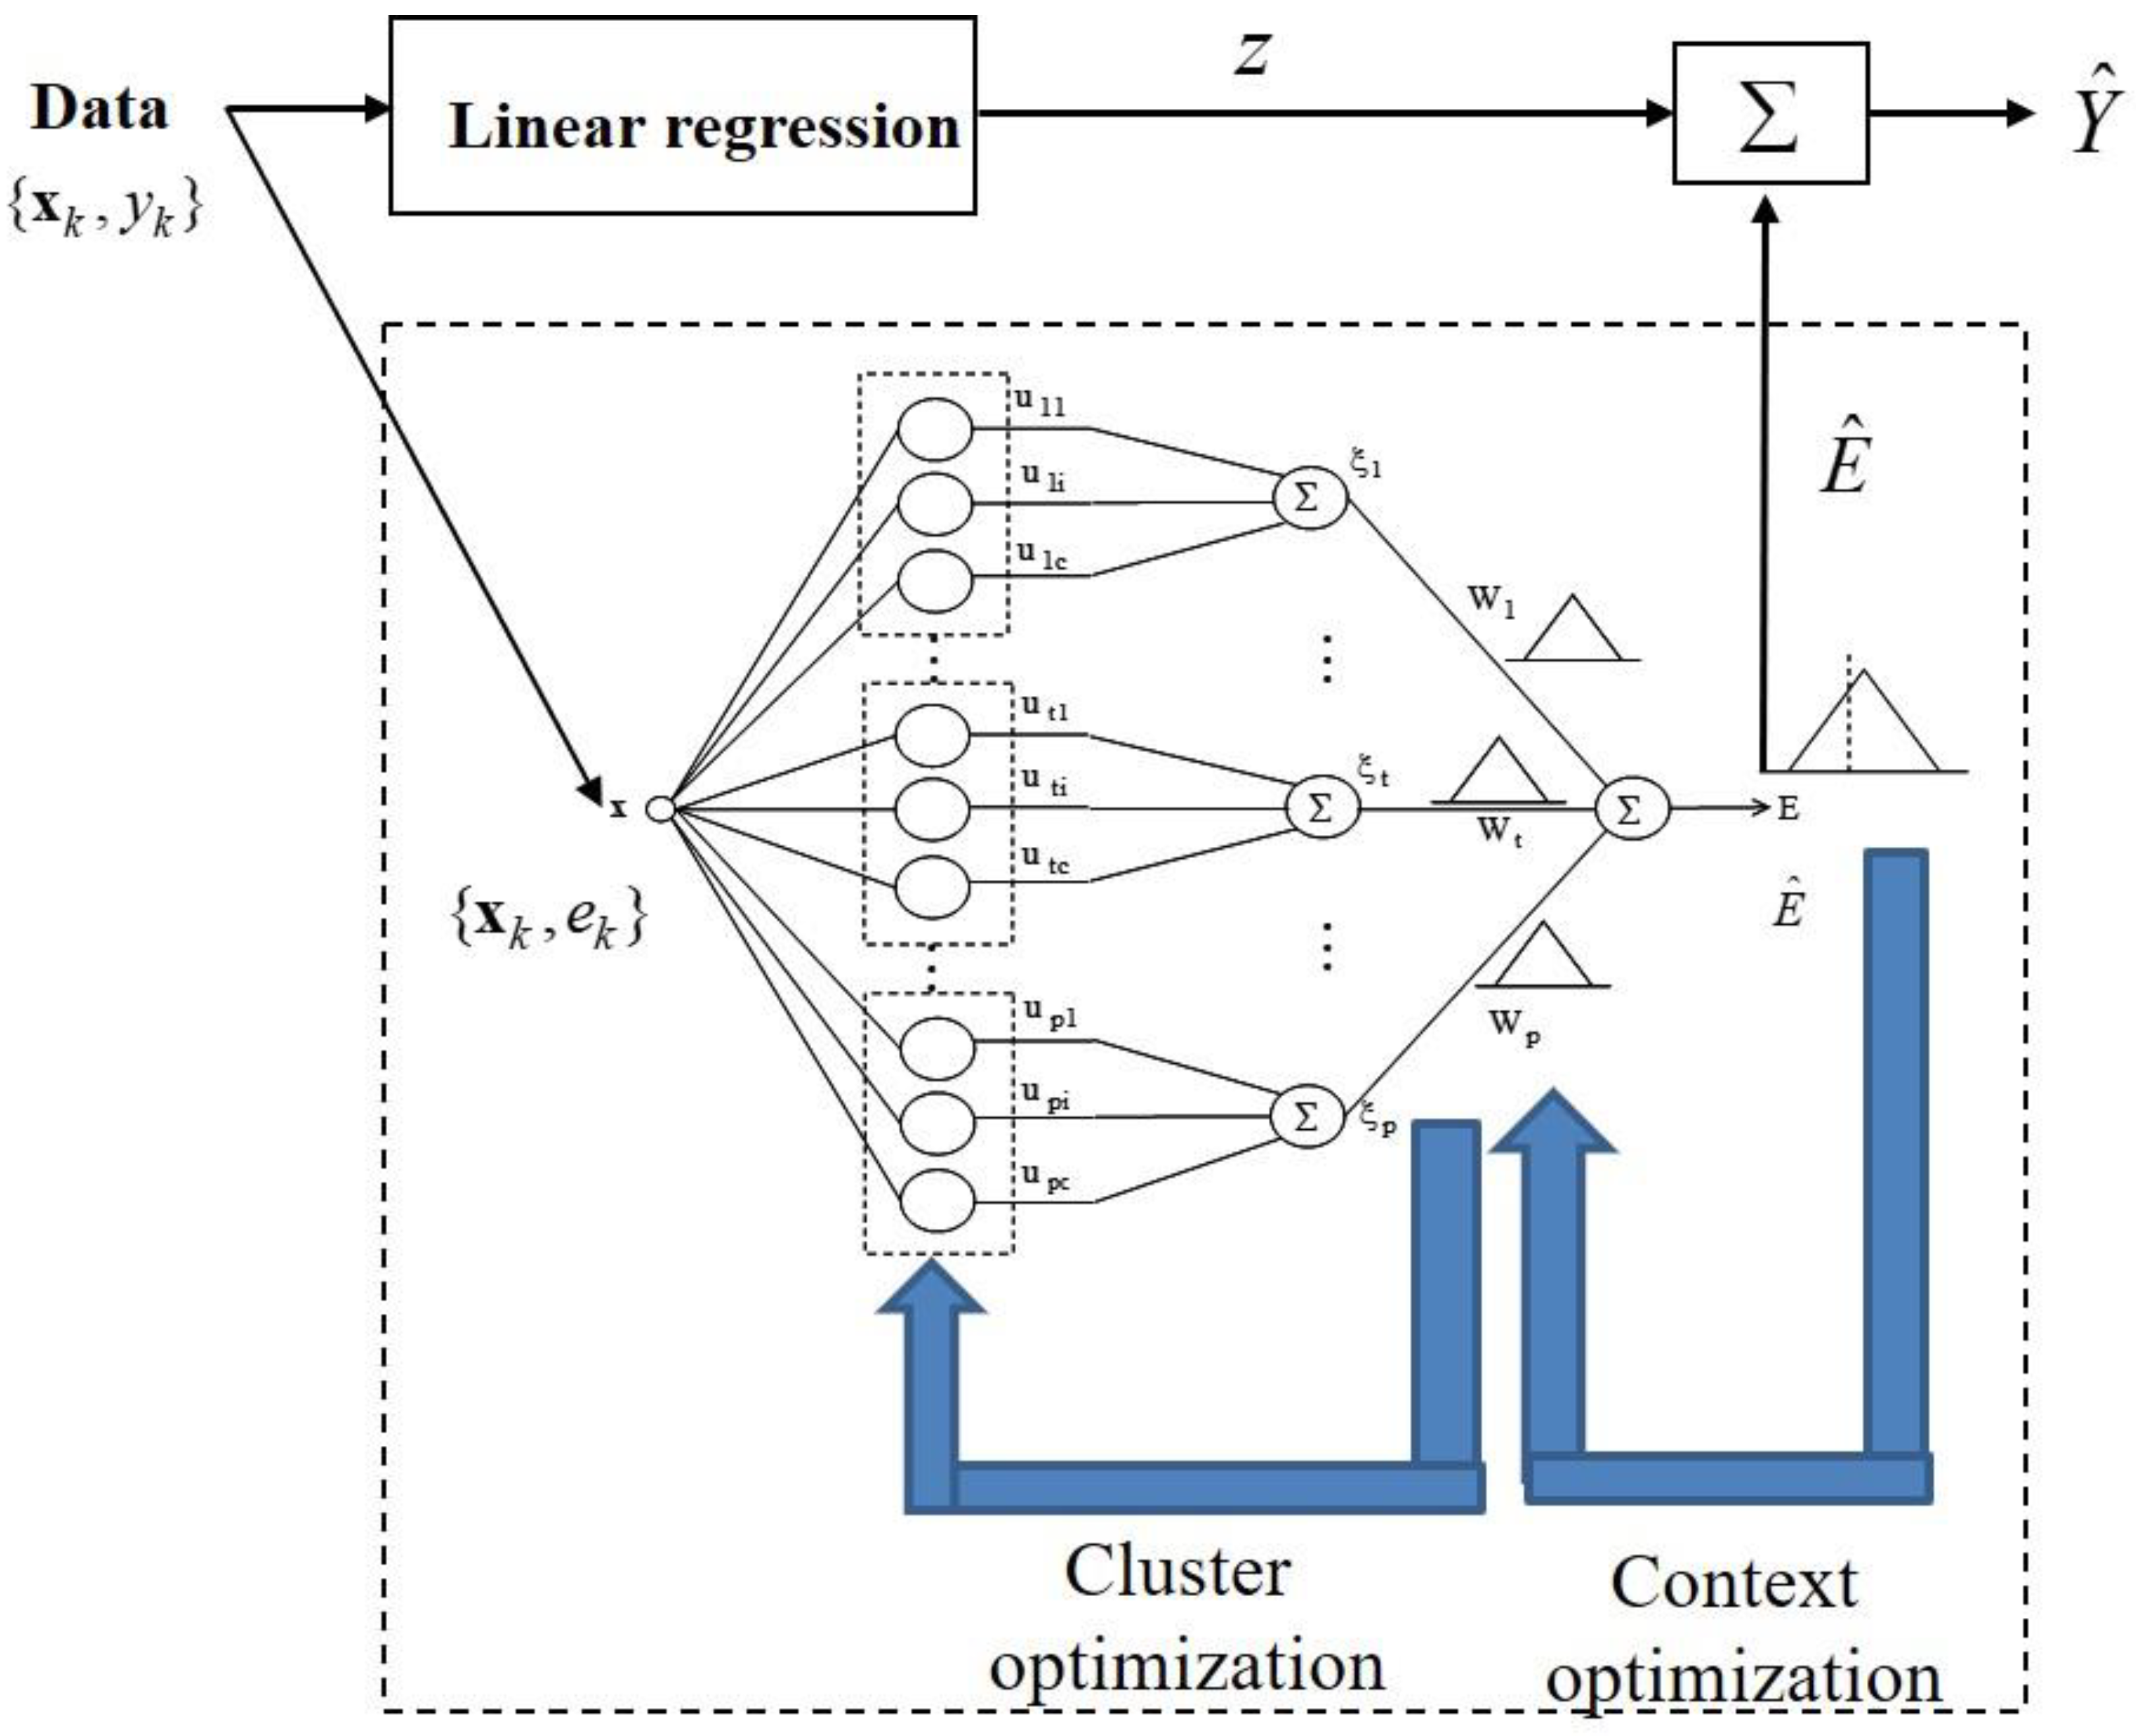
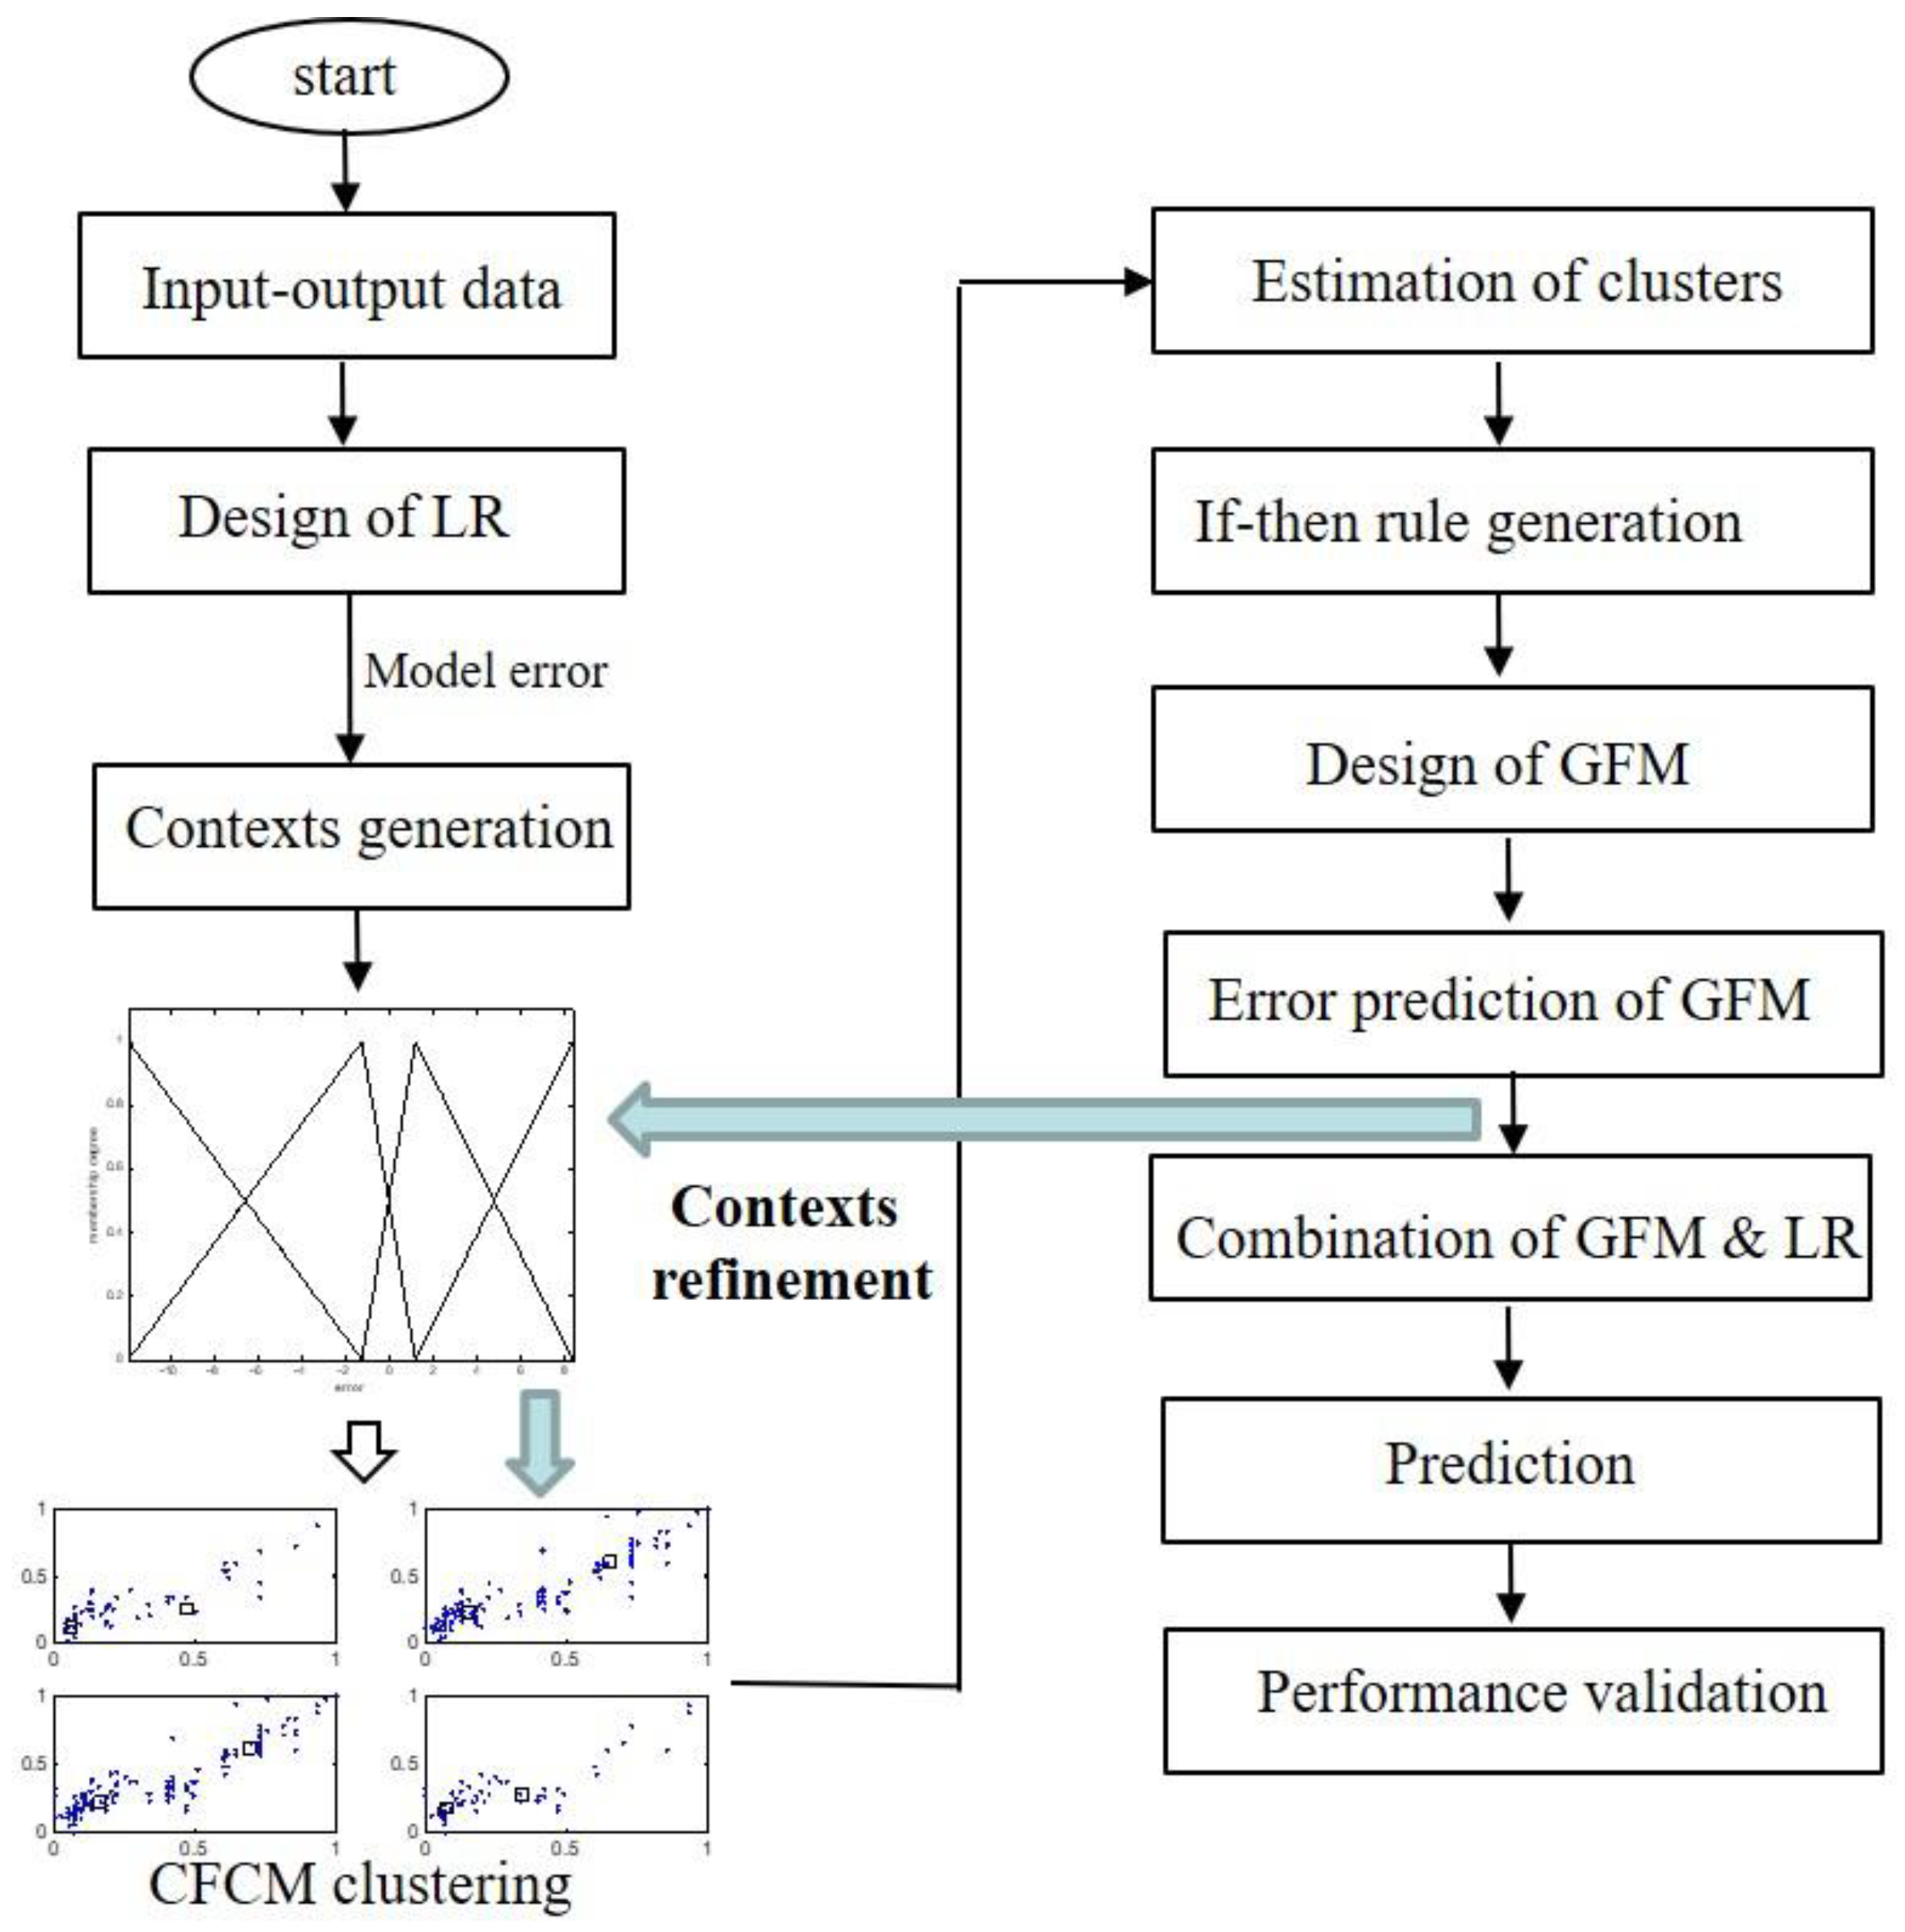
3. Refinement of Contexts in IGM Design
4. Experimental Results
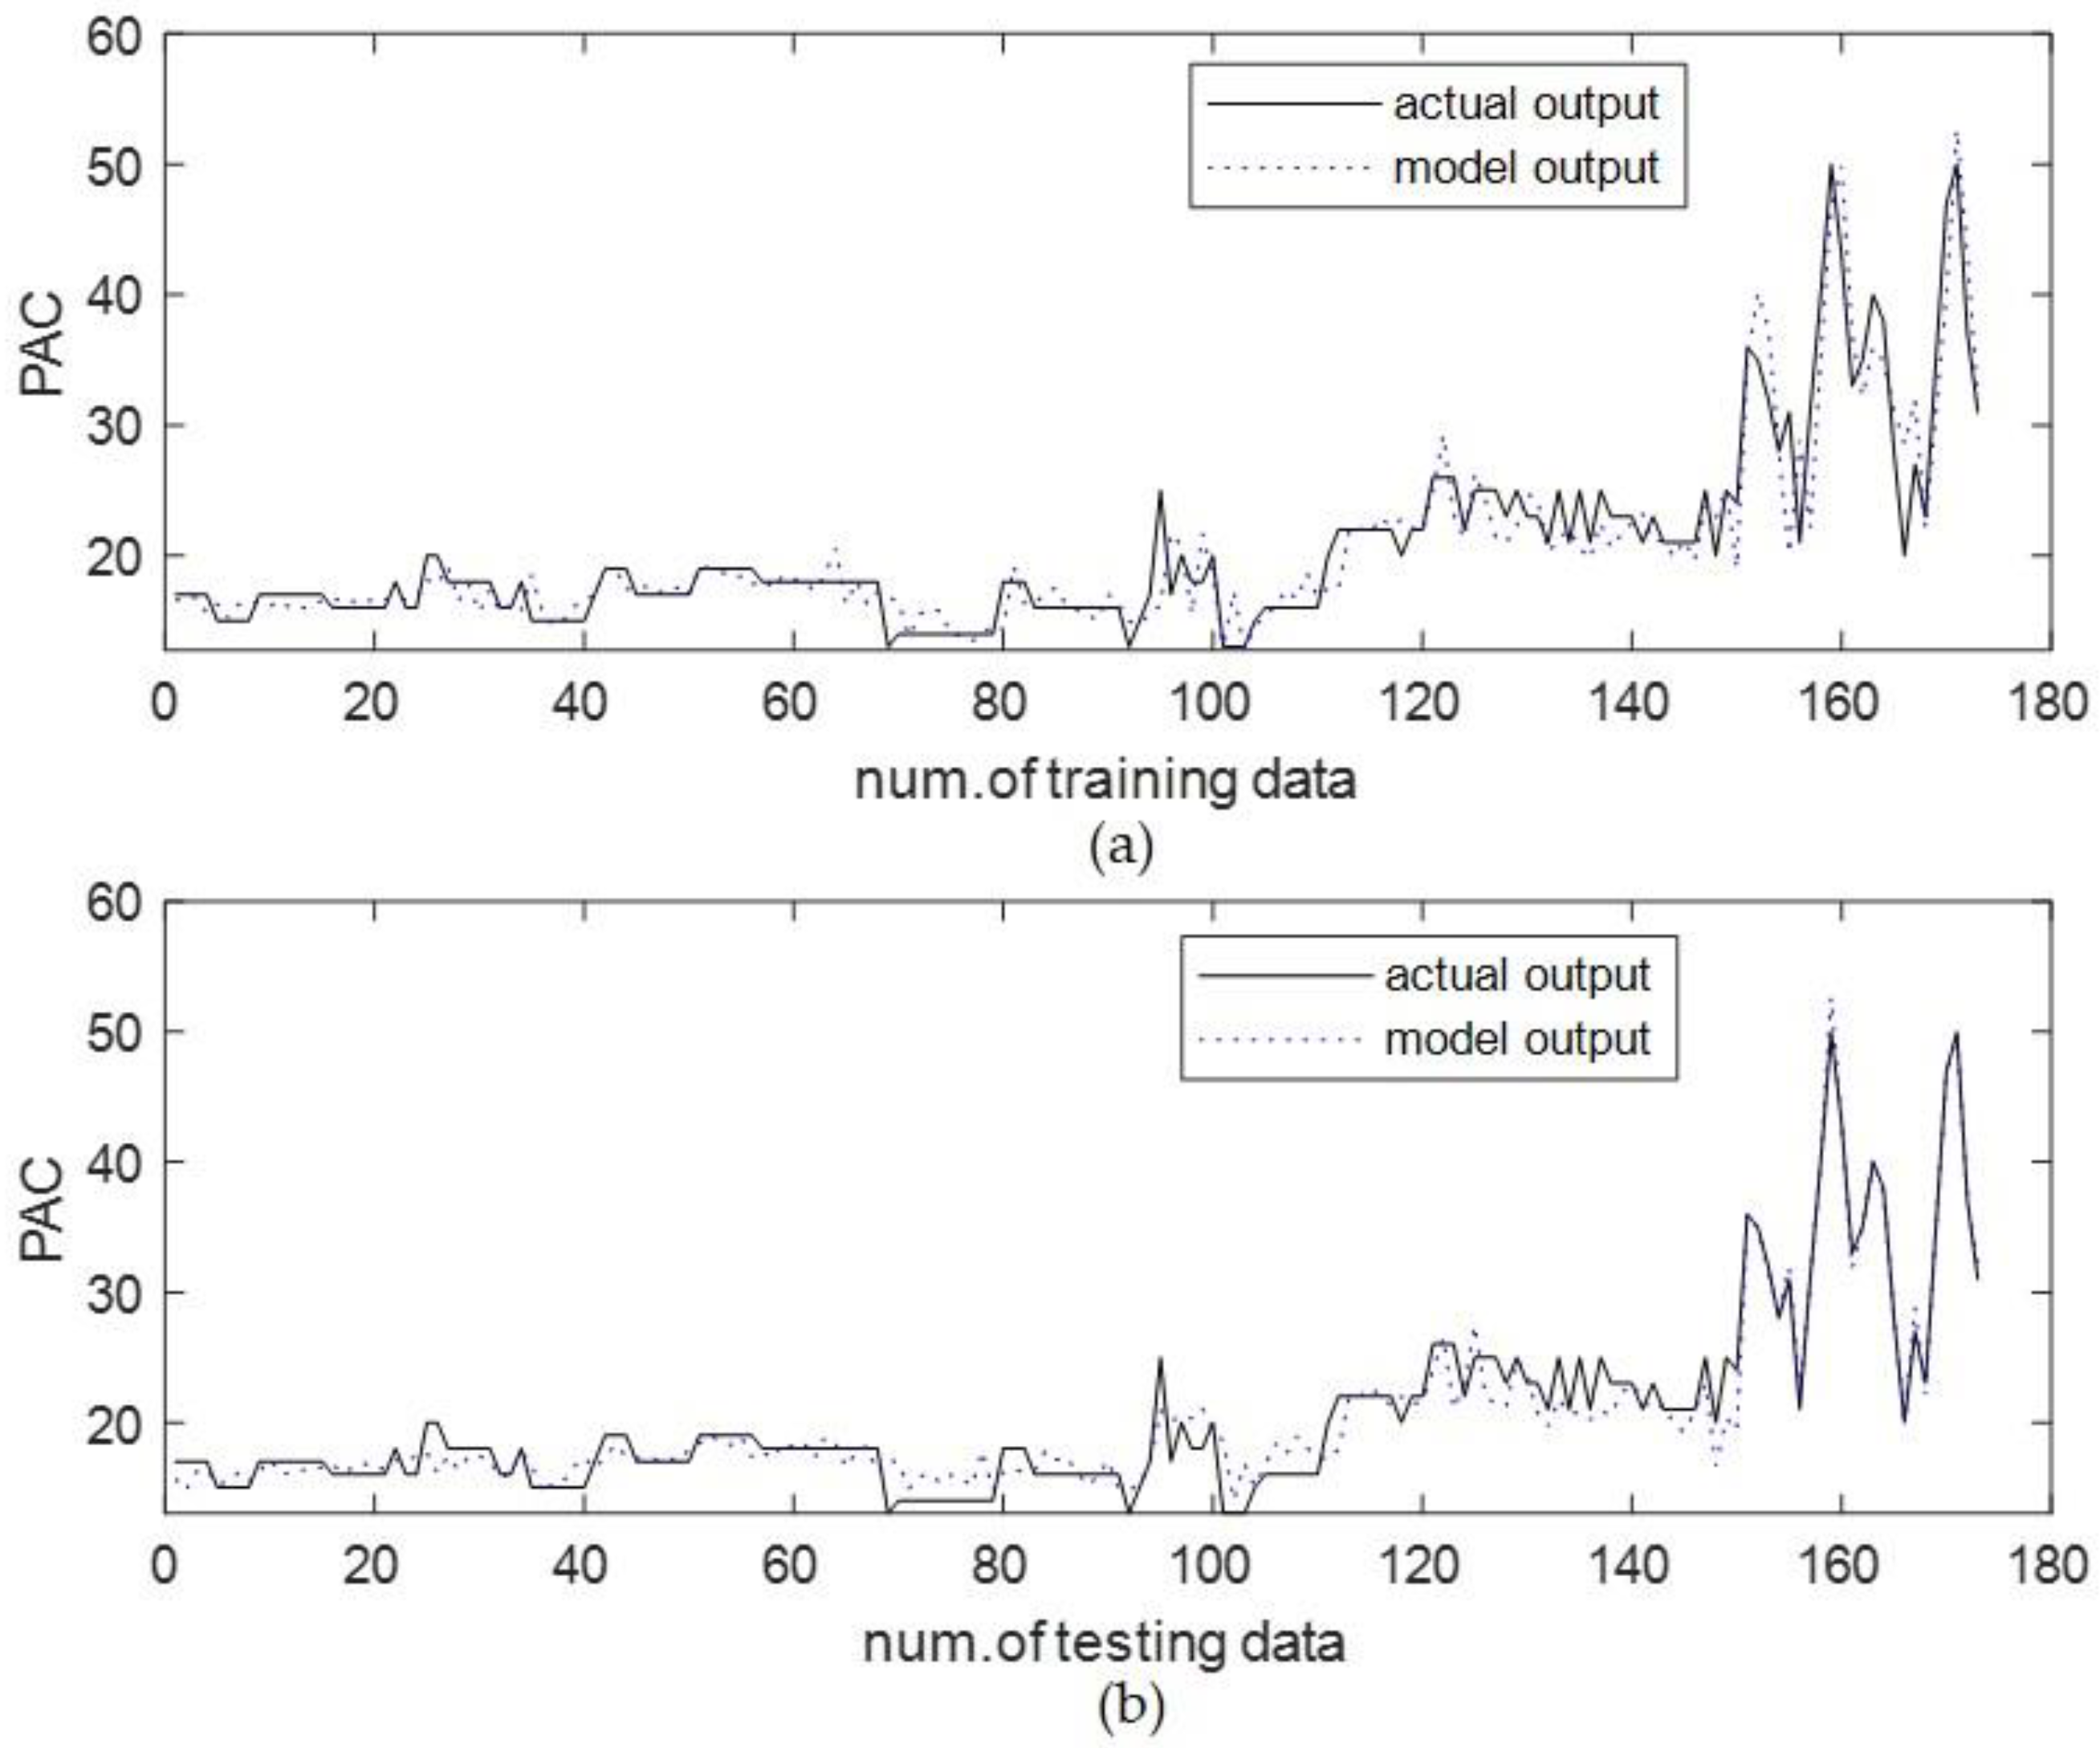
4.1. Coagulant Dosing in Water Purification Plant
4.2. Automobile MPG Prediction
4.3. Boston Housing Data
4.4. Discussion
- -
- The incremental granular model has high prediction performance by combining linear regression and local granular fuzzy model.
- -
- The local granular fuzzy model generates the automatic if-then rules using context-based fuzzy clustering method from numerical data set.
- -
- The incremental granular model can enhance the prediction performance by combining the derivative-based optimization and context-based fuzzy clustering.
- -
- In contrast to the conventional back-propagation method, after adjusting the contexts by steepest descent method, the cluster centers in the premise part are estimated by using context-based fuzzy clustering method.
- -
- The number of contexts is obtained by trial and error method.
- -
- The number of cluster center per context are obtained by trial and error method.
- -
- As the number of data points increase, the number of rules also increase
- -
- The specific context can include the small data points, when the distribution of context is uniform.
5. Conclusions
Author Contributions
Funding
Conflicts of Interest
References
- Kwak, K.C.; Kim, S.S. Development of quantum-based adaptive neuro-fuzzy networks. IEEE Trans. Syst. Man Cybern. Part B 2010, 40, 91–100. [Google Scholar]
- Yeom, C.U.; Kwak, K.C. Performance comparison of AFNIS models by input space partitioning methods. Symmetry 2018, 10, 700. [Google Scholar] [CrossRef]
- Pedrycz, W.; Gomide, F. Fuzzy Systems Engineering: Toward Human-Centric Computing; IEEE Press: Piscataway, NJ, USA, 2007. [Google Scholar]
- Pedrycz, W.; Kwak, K.C. Linguistic models as a framework of user-centric system modeling. IEEE Trans. Syst. Man Cybern. Part A Syst. Hum. 2006, 36, 727–745. [Google Scholar] [CrossRef]
- Reyes-Galaviz, O.F.; Pedrycz, W. Granular fuzzy models: Analysis, design, and evaluation. Int. J. Approx. Reason. 2015, 64, 1–19. [Google Scholar] [CrossRef]
- Byeon, Y.H.; Lee, M.W.; Lee, J.N.; Kwak, K.C. Prediction of dinghy boom direction using intelligent predictor. Int. J. Control Autom. Syst. 2018, 16, 368–376. [Google Scholar] [CrossRef]
- Yeom, C.U.; Kwak, K.C. Performance evaluation of automobile fuel consumption using a fuzzy-based granular model with coverage and specificity. Symmetry 2019, 11, 1480. [Google Scholar] [CrossRef]
- Park, J.I.; Jung, N.C.; Kwak, K.C.; Chun, M.G. Water quality prediction in a reservoir: Linguistic model approach for interval prediction. Int. J. Control Autom. Syst. 2010, 8, 866–874. [Google Scholar] [CrossRef]
- Lu, W.; Shan, D.; Pedrycz, W.; Zhang, L.; Yang, J.; Liu, X. Granular fuzzy modeling for multidimentional numeric data: A layered approach based on hyperbox. IEEE Trans. Fuzzy Syst. 2019, 27, 775–789. [Google Scholar] [CrossRef]
- Pedrycz, W. Granular computing for data analytics: A manifesto of human-centric computing. IEEE/CAA J. Autom. Sin. 2018, 5, 1025–1034. [Google Scholar] [CrossRef]
- Zhu, X.; Pedrycz, W.; Li, Z. Granular models and granular outliers. IEEE Trans. Fuzzy Syst. 2018, 26, 3835–3846. [Google Scholar] [CrossRef]
- Hu, X.; Pedrcyz, W.; Wang, X. Granular fuzzy rule-based models: A study in a comprehensive evaluation and construction of fuzzy models. IEEE Trans. Fuzzy Syst. 2017, 25, 1342–1355. [Google Scholar] [CrossRef]
- Zhu, X.; Pedrycz, W.; Li, Z. A development of hierarchically structured granular models realized through allocation of information granularity. IEEE Trans. Fuzzy Syst. 2020. [Google Scholar] [CrossRef]
- Pedrycz, W.; Homenda, W.; Jastrzebska, A.; Yu, F. Information granules and granular models: Selected design investigations. IEEE Int. Conf. Fuzzy Syst. 2020, 1–8. [Google Scholar] [CrossRef]
- Zhao, J.; Han, Z.; Pedrycz, W.; Wang, W. Granular model of long-term prediction for energy system in steel industry. IEEE Trans. Cybern. 2016, 46, 388–400. [Google Scholar] [CrossRef] [PubMed]
- Lu, W.; Pedrycz, W.; Yang, J.; Liu, X. Granular fuzzy modeling guided through the synergy of granulating output and clustering input subspaces. IEEE Trans. Cybern. 2019, 1–14. [Google Scholar] [CrossRef] [PubMed]
- Zhu, X.; Pedrycz, W.; Li, Z. A granular approach to interval output estimation for rule-based fuzzy models. IEEE Trans. Cybern. 2020, 1–10. [Google Scholar] [CrossRef] [PubMed]
- Wang, D.; Pedrycz, W.; Li, Z. A two-phase development of fuzzy rule-based model and their analysis. IEEE Access 2019, 7, 80328–80341. [Google Scholar] [CrossRef]
- Pedrycz, W.; Kwak, K.C. The development of incremental models. IEEE Trans. Fuzzy Syst. 2007, 15, 507–518. [Google Scholar] [CrossRef]
- Li, J.; Pedrycz, W.; Wang, X. A rule-based development of incremental models. Int. J. Approx. Reason. 2015, 64, 20–38. [Google Scholar] [CrossRef]
- Yeom, C.U.; Kwak, K.C. The development of improved incremental models using local granular networks with error compensation. Symmetry 2017, 9, 266. [Google Scholar] [CrossRef]
- Li, M.; Kwak, K.C.; Kim, Y.T. Estimation of energy expenditure using a patch-type sensor module with an incremental radial basis function neural network. Sensors 2016, 16, 1566. [Google Scholar] [CrossRef] [PubMed]
- Lee, M.W.; Kwak, K.C. An incremental radial basis function network based on information granules and its application. Comput. Intell. Neurosci. 2016, 2016, 3207627. [Google Scholar] [CrossRef] [PubMed]
- Kwak, K.C. A design of incremental granular model using context-based interval type-2 fuzzy c-means clustering algorithm. IEICE Trans. Inf. Syst. 2016, E99D, 309–312. [Google Scholar] [CrossRef]
- Lee, M.W.; Kwak, K.C.; Pedrycz, W. An expansion of local granular models in the design of incremental model. IEEE Int. Conf. Fuzzy Syst. 2016, 1664–1670. [Google Scholar] [CrossRef]
- Soares, E.A.; Camargo, H.A.; Camargo, S.J.; Leite, D.F. Incremental Gaussian granular fuzzy modeling applied to hurricane track forecasting. IEEE Int. Conf. Fuzzy Syst. 2018, 1–8. [Google Scholar] [CrossRef]
- Leite, D.; Santana, M.; Borges, A.; Gomide, F. Fuzzy granular neural network for incremental modeling of nonlinear chaotic systems. IEEE Int. Conf. Fuzzy Syst. 2016, 64–71. [Google Scholar] [CrossRef]
- Byeon, Y.H.; Kwak, K.C. A design of genetically oriented rules-based incremental granular models and its application. Symmetry 2017, 9, 324. [Google Scholar] [CrossRef]
- UCI Machine Learning Repository. Available online: https://archive.ics.uci.edu/ml/datasets (accessed on 18 October 2020).
- Pedrycz, W. Conditional fuzzy c-mans. Pattern Recognit. Lett. 1996, 17, 625–631. [Google Scholar] [CrossRef]
- Pedrycz, W. Conditional fuzzy clustering in the design of radial basis function neural networks. IEEE Trans. Neural Netw. 1998, 9, 601–612. [Google Scholar] [CrossRef]
- Roh, S.B.; Oh, S.K.; Pedrycz, W.; Seo, K.; Fu, Z. Design methodology for radial basis function neural networks classifier based on locally linear reconstruction and conditional fuzzy c-means clustering. Int. J. Approx. Reason. 2019, 106, 228–243. [Google Scholar] [CrossRef]


| No. of Rule (*: No. of Node) | Trn_RMSE | Tst_RMSE | ||
|---|---|---|---|---|
| Linear regression | - | 3.508 | 3.578 | |
| Multilayer perceptron | 45 * | 3.191 | 3.251 | |
| RBFN based on context-based fuzzy c-means clustering [20] | 45 * | 3.048 | 3.219 | |
| Linguistic model [4] (p = 8) | c = 8 | 64 | 2.427 | 2.800 |
| IGM [13] | p = c = 8 | 64 | 1.790 | 2.009 |
| The proposed model | p = c = 6 | 36 | 2.124 | 2.271 |
| p = c = 7 | 49 | 1.862 | 2.093 | |
| p = c = 8 | 64 | 1.640 | 1.976 | |
| p = c = 9 | 81 | 1.631 | 2.105 | |
Publisher’s Note: MDPI stays neutral with regard to jurisdictional claims in published maps and institutional affiliations. |
© 2020 by the authors. Licensee MDPI, Basel, Switzerland. This article is an open access article distributed under the terms and conditions of the Creative Commons Attribution (CC BY) license (http://creativecommons.org/licenses/by/4.0/).
Share and Cite
Lee, M.-W.; Kwak, K.-C. Optimization by Context Refinement for Development of Incremental Granular Models. Symmetry 2020, 12, 1916. https://doi.org/10.3390/sym12111916
Lee M-W, Kwak K-C. Optimization by Context Refinement for Development of Incremental Granular Models. Symmetry. 2020; 12(11):1916. https://doi.org/10.3390/sym12111916
Chicago/Turabian StyleLee, Myung-Won, and Keun-Chang Kwak. 2020. "Optimization by Context Refinement for Development of Incremental Granular Models" Symmetry 12, no. 11: 1916. https://doi.org/10.3390/sym12111916
APA StyleLee, M.-W., & Kwak, K.-C. (2020). Optimization by Context Refinement for Development of Incremental Granular Models. Symmetry, 12(11), 1916. https://doi.org/10.3390/sym12111916