Fluctuating Asymmetry as a Method of Assessing Environmental Stress in Two Predatory Carabid Species within Mediterranean Agroecosystems

 , ,
, ,  and
and 
Abstract
1. Introduction
2. Materials and Methods
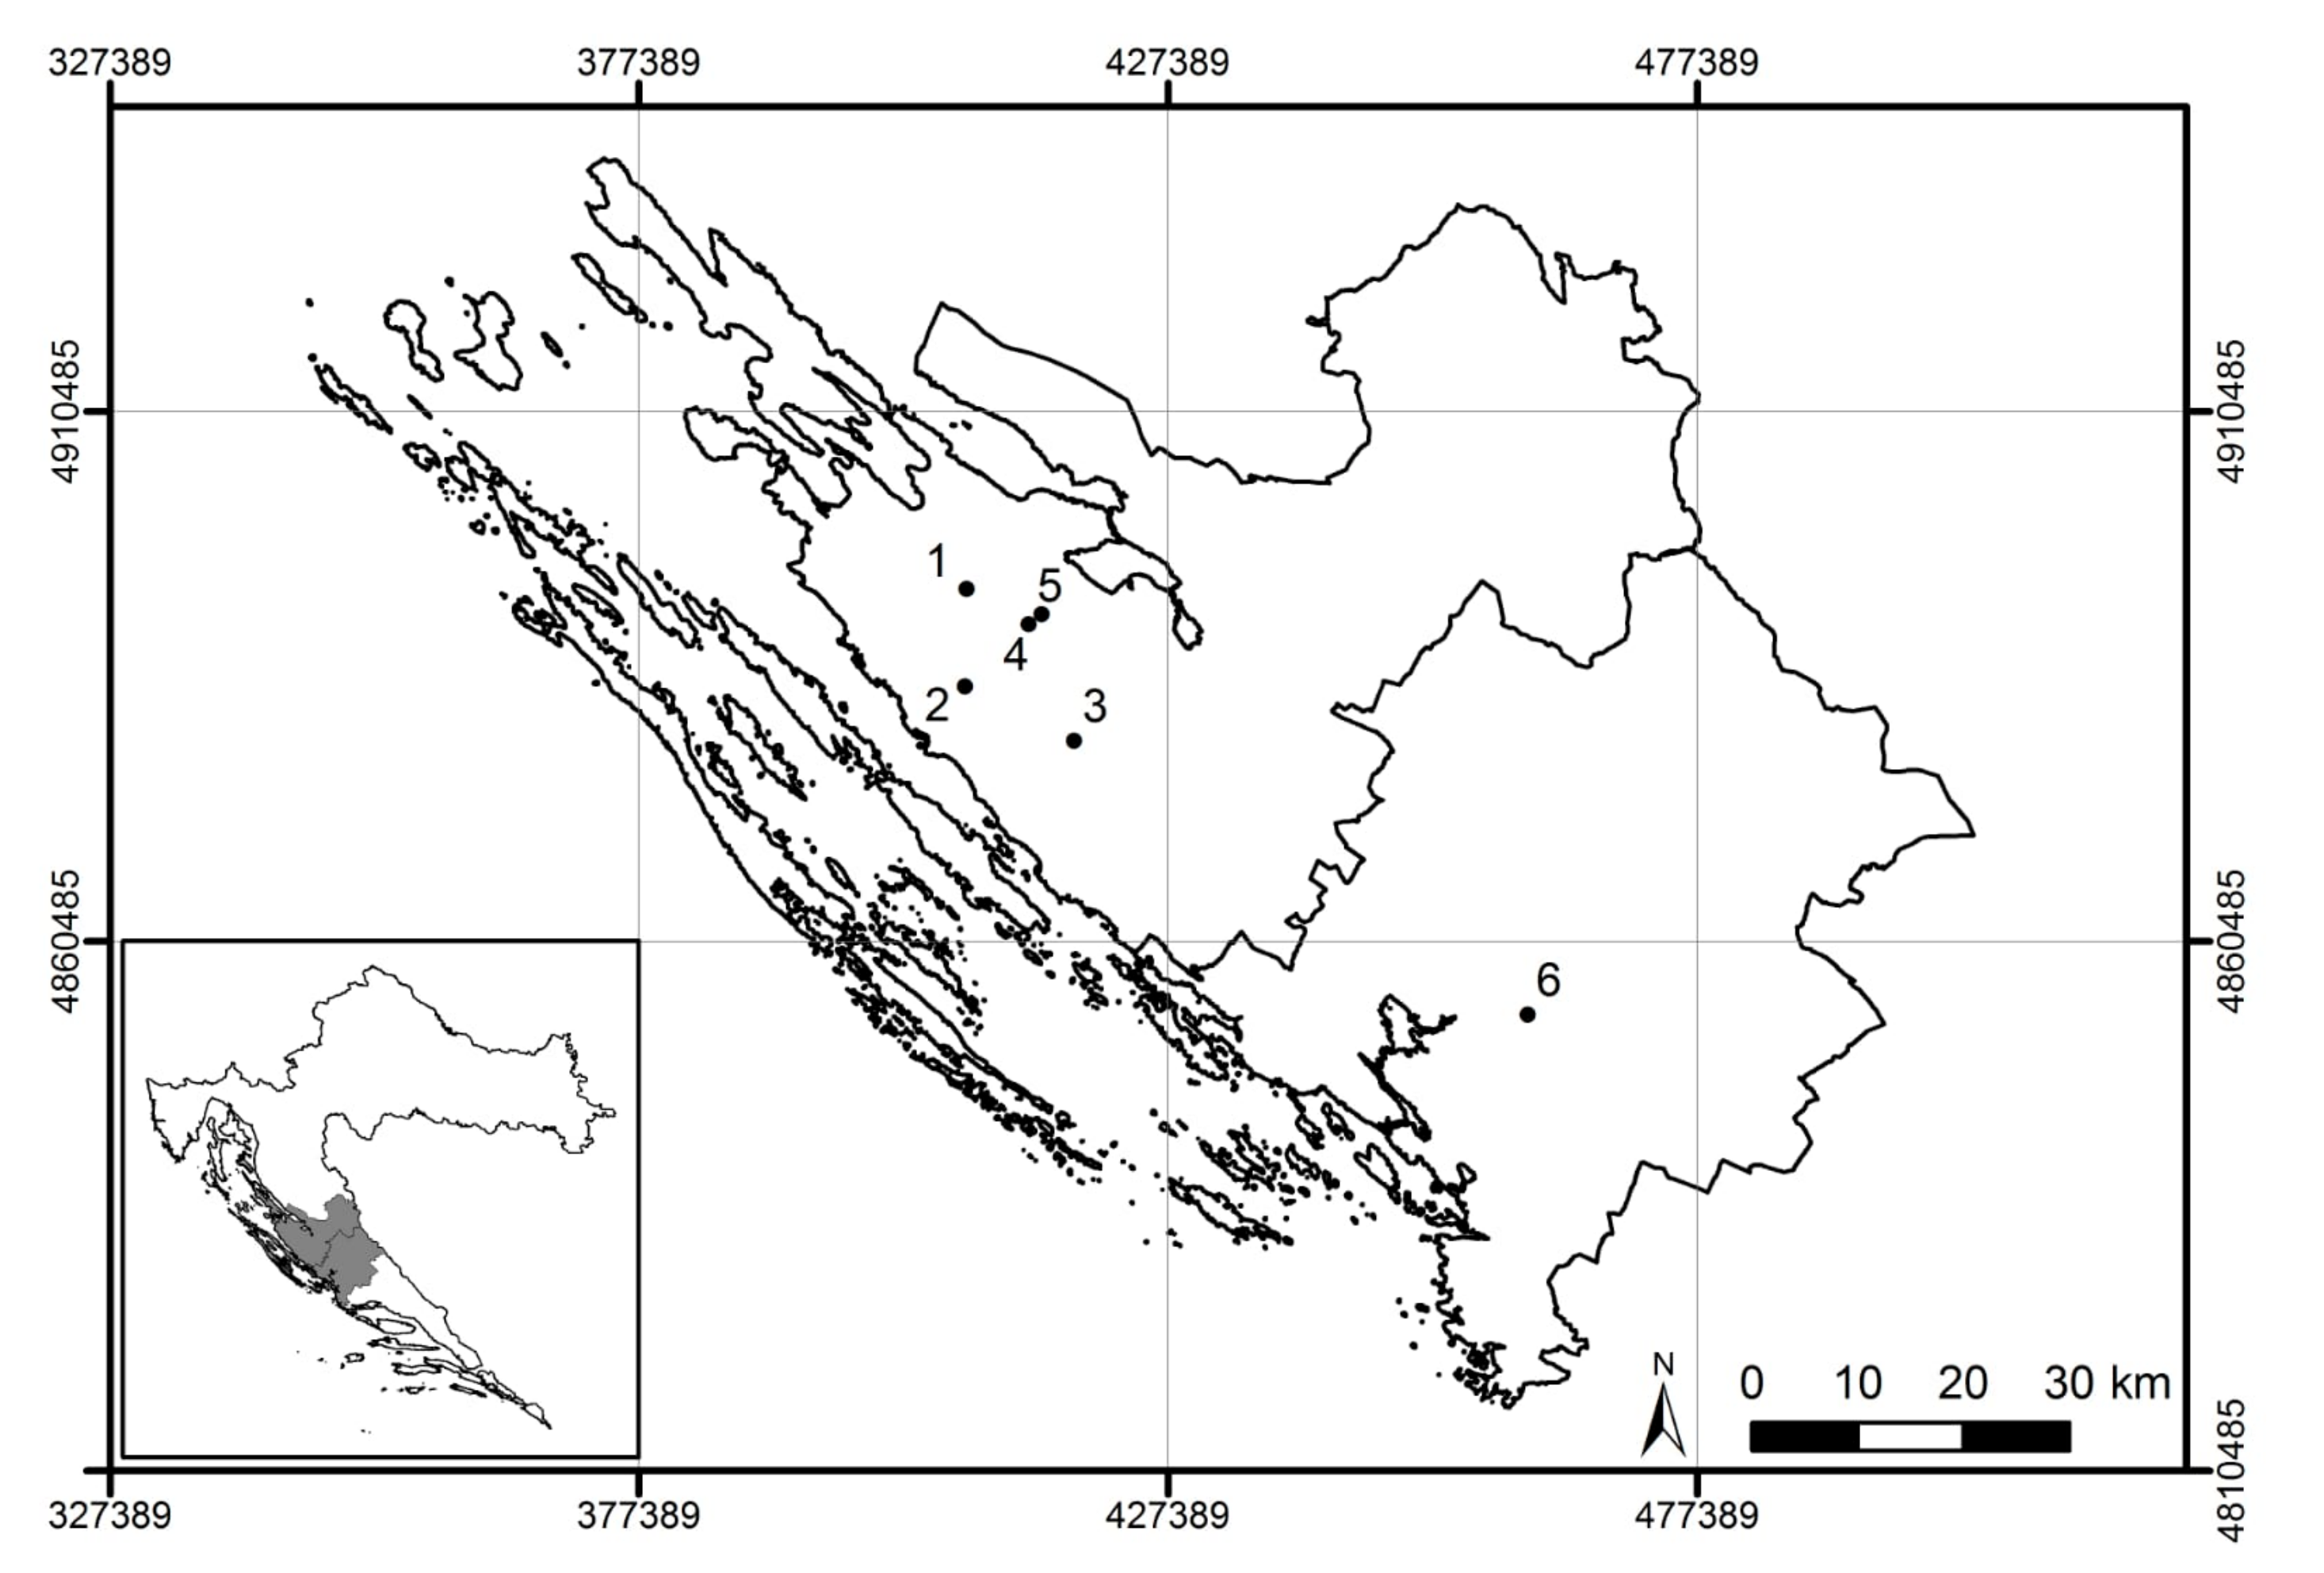
2.1. Sampling Sites
2.2. Collection of Specimens
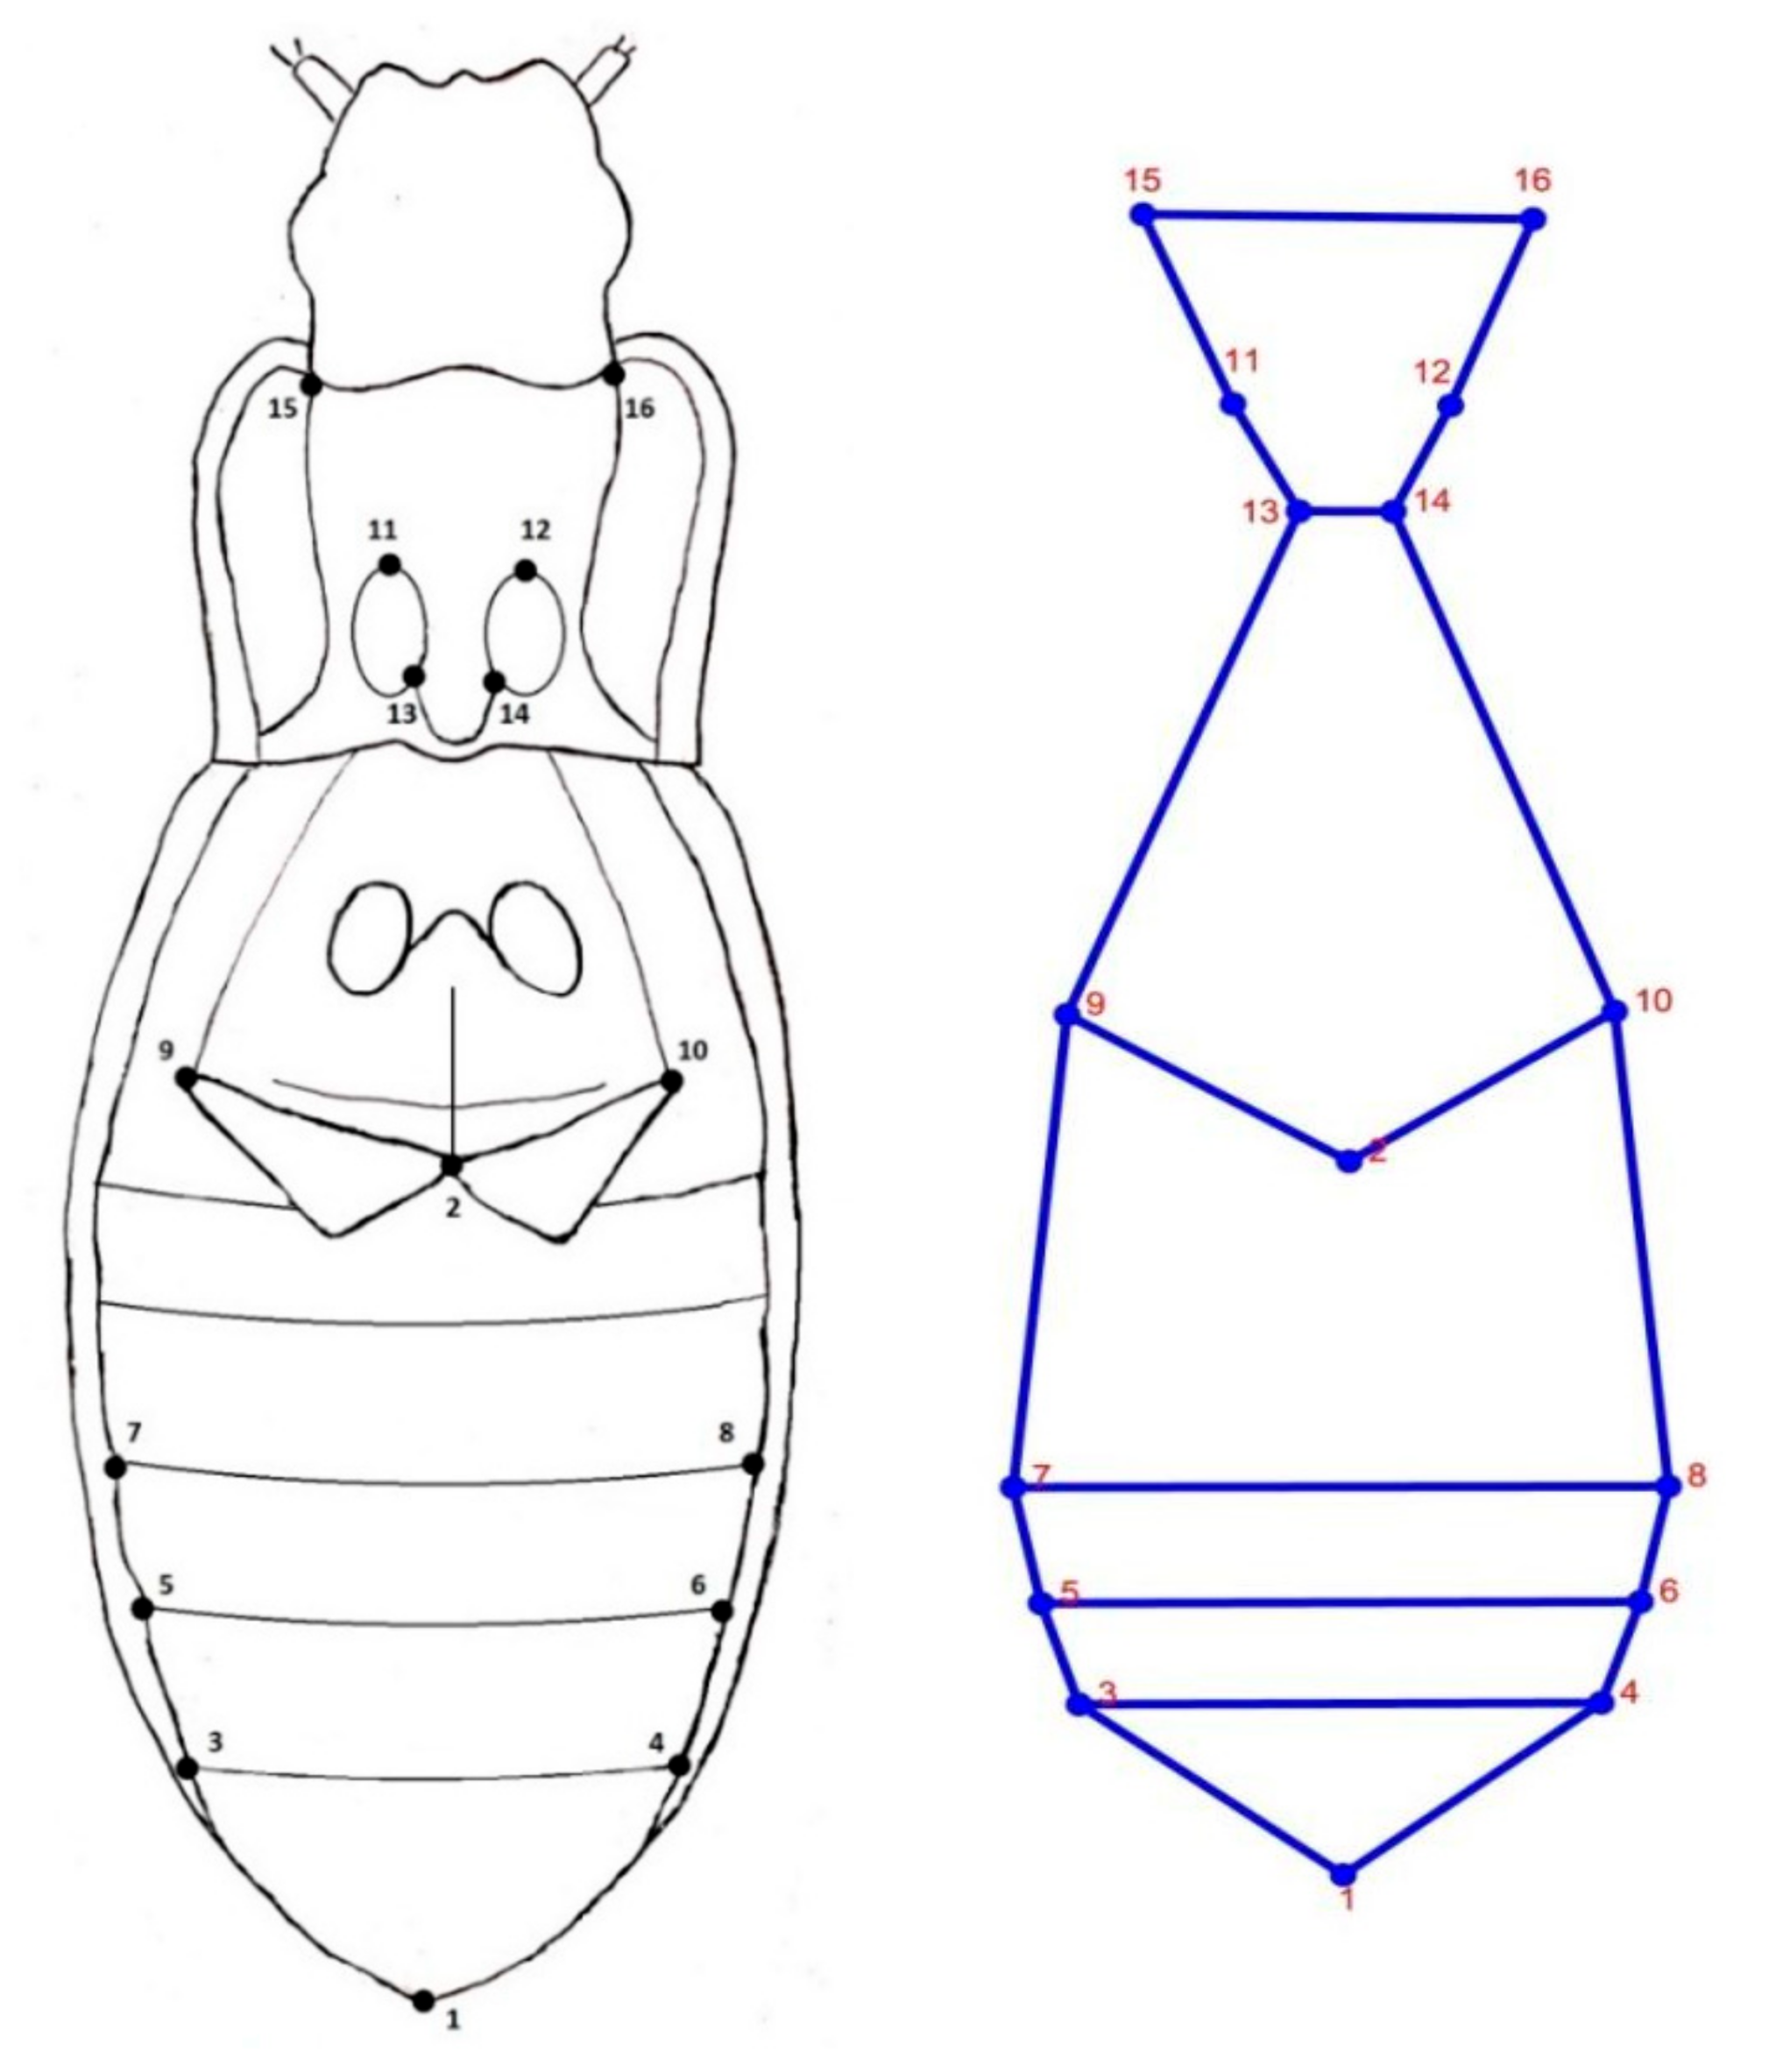
2.3. Shape Analysis
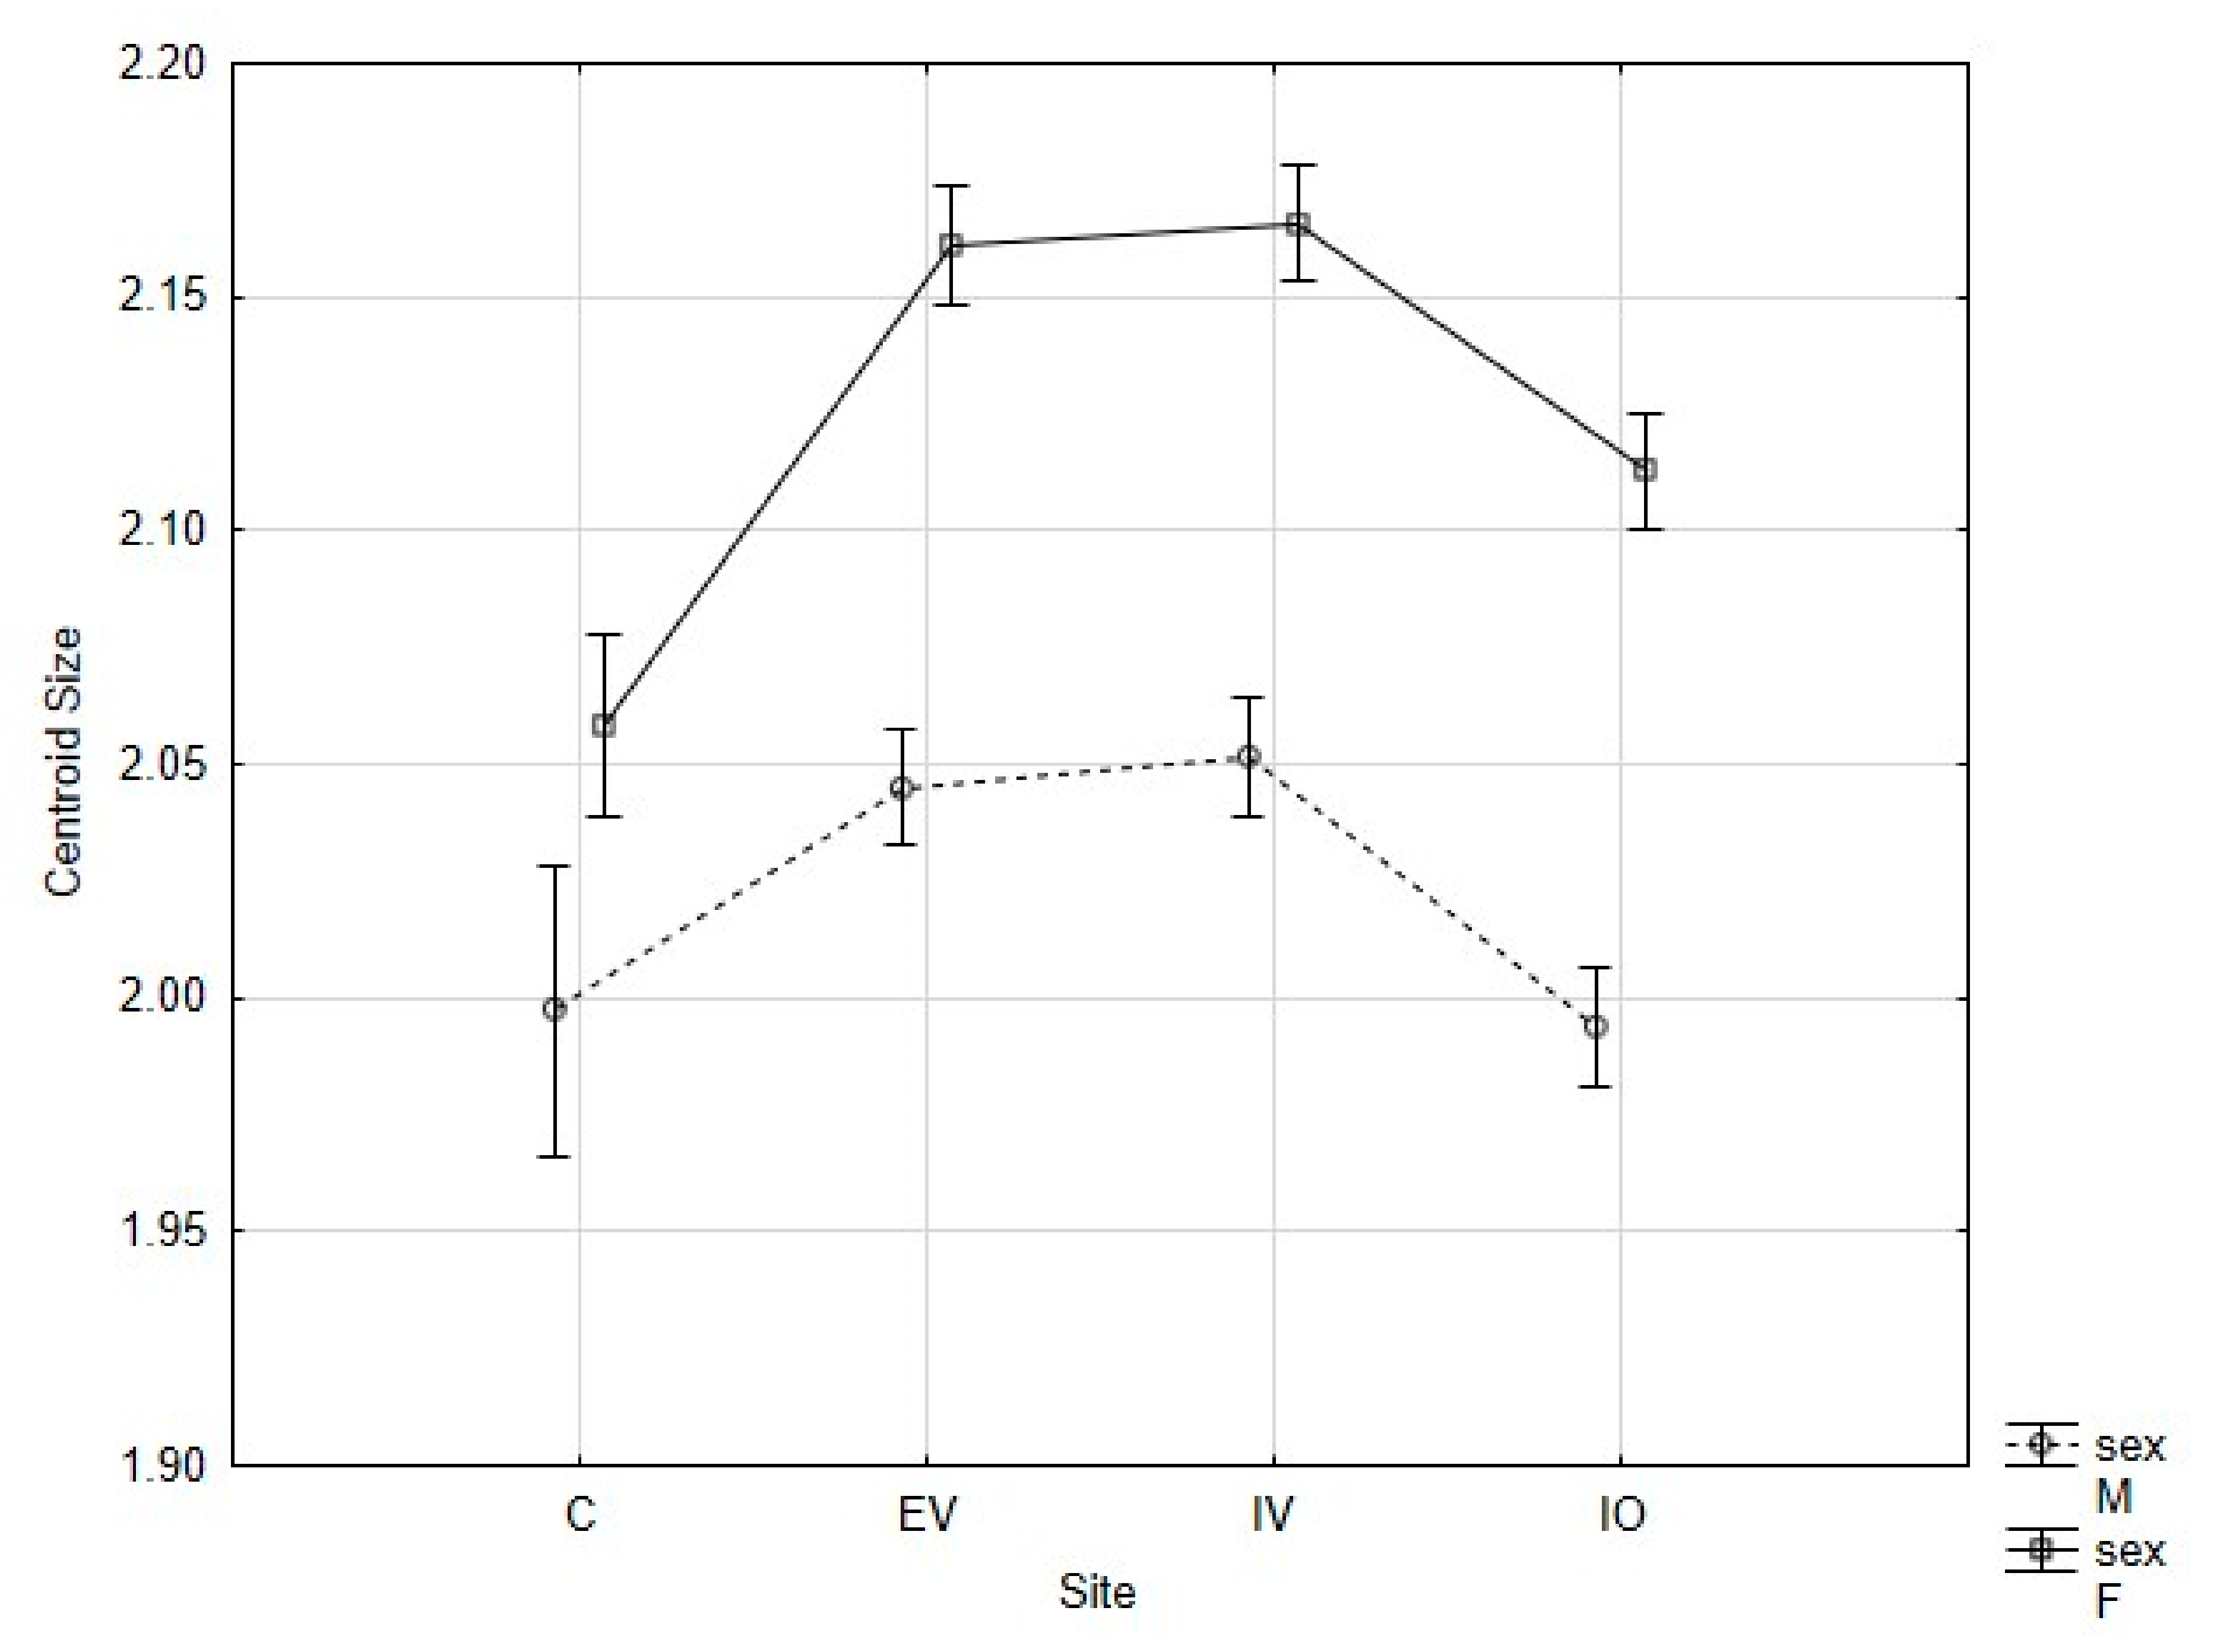
3. Results
4. Discussion
5. Conclusions
Author Contributions
Funding
Acknowledgments
Conflicts of Interest
References
- Benton, T.G.; Bryant, D.M.; Cole, L.; Crick, H.Q. Linking agricultural practice to insect and bird populations: A historical study over three decades. J. Appl. Ecol. 2002, 39, 673–687. [Google Scholar] [CrossRef]
- Sánchez-Bayo, F.; Wyckhuys, K.A. Worldwide decline of the entomofauna: A review of its drivers. Biol. Conserv. 2019, 232, 8–27. [Google Scholar] [CrossRef]
- Benítez, H.A.; Lemić, D.; Püschel, T.A.; Gašparić, H.V.; Kos, T.; Barić, B.; Bažok, R.; Živković, I.P. Fluctuating asymmetry indicates levels of disturbance between agricultural productions: An example in Croatian population of Pterostichus melas melas (Coleptera: Carabidae). Zool. Anz. 2018, 276, 42–49. [Google Scholar] [CrossRef]
- Grassini, P.; Eskridge, K.M.; Cassman, K.G. Distinguishing between yield advances and yield plateaus in historical crop production trends. Nat. Commun. 2013, 4, 1–11. [Google Scholar] [CrossRef]
- Wu-Smart, J.; Spivak, M. Sub-lethal effects of dietary neonicotinoid insecticide exposure on honey bee queen fecundity and colony development. Sci. Rep. 2016, 6, 1–11. [Google Scholar] [CrossRef]
- Nattero, J.; Piccinali, R.V.; Gaspe, M.S.; Gürtler, R.E. Fluctuating asymmetry and exposure to pyrethroid insecticides in Triatoma infestans populations in northeastern Argentina. Infect. Genet. Evol. 2019, 74, 103925. [Google Scholar] [CrossRef]
- Whittingham, M.J. The future of agri-environment schemes: Biodiversity gains and ecosystem service delivery? J. Appl. Ecol. 2011, 48, 509–513. [Google Scholar] [CrossRef]
- Avgın, S.S.; Luff, M.L. Ground beetles (Coleoptera: Carabidae) as bioindicators of human impact. Munis Entomol. Zool. 2010, 5, 209–215. [Google Scholar]
- Basedow, T. Effects of insecticides on Carabidae and the significance of these for agriculture and species number. In The Role of Ground Beetles in Ecological and Environmental Studies; Stork, N., Ed.; Intercept Ltd.: Andover, MA, USA, 1990; pp. 115–125. [Google Scholar]
- Rainio, J.; Niemelä, J. Ground beetles (Coleoptera: Carabidae) as bioindicators. Biodivers. Conserv. 2003, 12, 487–506. [Google Scholar] [CrossRef]
- Šerić Jelaska, L.; Jurasović, J.; Brown, D.S.; Vaughan, I.P.; Symondson, W.O. Molecular field analysis of trophic relationships in soil-dwelling invertebrates to identify mercury, lead and cadmium transmission through forest ecosystems. Mol. Ecol. 2014, 23, 3755–3766. [Google Scholar] [CrossRef]
- Giglio, A.; Cavaliere, F.; Giulianini, P.G.; Mazzei, A.; Talarico, F.; Vommaro, M.L.; Brandmayr, P. Impact of agrochemicals on non-target species: Calathus fuscipes Goeze 1777 (Coleoptera: Carabidae) as model. Ecotoxicol. Environ. Saf. 2017, 142, 522–529. [Google Scholar] [CrossRef] [PubMed]
- Pizzolotto, R.; Mazzei, A.; Bonacci, T.; Scalercio, S.; Iannotta, N.; Brandmayr, P. Ground beetles in Mediterranean olive agroecosystems: Their significance and functional role as bioindicators (Coleoptera, Carabidae). PLoS ONE 2018, 13, e0194551. [Google Scholar] [CrossRef] [PubMed]
- Sukhodolskaya, R. Intraspecific body size variation in ground beetles (Coleoptera, Carabidae) in urban-suburban-rural-natural gradient. Acta Biol. Univ. Daugavp. 2013, 13, 121–128. [Google Scholar]
- Labrie, G.; Prince, C.; Bergeron, J.-M. Abundance and developmental stability of Pterostichus melanarius (Coleoptera: Carabidae) in organic and integrated pest management orchards of Quebec, Canada. Environ. Entomol. 2003, 32, 123–132. [Google Scholar] [CrossRef]
- Benítez, H.A.; Lemić, D.; Villalobos-Leiva, A.; Bažok, R.; Ordenes-Claveria, R.; Živković, I.P.; Mikac, K.M. Breaking symmetry: Fluctuating asymmetry and geometric morphometrics as tools for evaluating developmental instability under diverse agroecosystems. Symmetry 2020, 12, 1789. [Google Scholar] [CrossRef]
- Weller, B.; Ganzhorn, J.U. Carabid beetle community composition, body size, and fluctuating asymmetry along an urban-rural gradient. Basic Appl. Ecol. 2004, 5, 193–201. [Google Scholar] [CrossRef]
- Elek, Z.; Lövei, G.; Batki, M. No increase in fluctuating asymmetry in ground beetles (Carabidae) as urbanisation progresses. Community Ecol. 2014, 15, 131–138. [Google Scholar] [CrossRef]
- Benítez, H.A. Assessment of patterns of fluctuating asymmetry and sexual dimorphism in carabid body shape. Neotrop. Entomol. 2013, 42, 164–169. [Google Scholar] [CrossRef]
- Benítez, H.; Briones, R.; Jerez, V. Fluctuating asymmetry in two populations of Ceroglossus chilensis (Eschscholtz, 1829) (Coleoptera: Carabidae) in agroecosystem of Pinus radiata d. Don, Bio-Bio region, Chile. Gayana 2008, 72, 131–139. [Google Scholar]
- Bravi, R.; Benítez, H.A. Left-right asymmetries and shape analysis on Ceroglossus chilensis (Coleoptera: Carabidae). Acta Oecologica Int. J. Ecol. 2013, 52, 57–62. [Google Scholar] [CrossRef]
- Henríquez, P.; Donoso, D.S.; Grez, A.A. Population density, sex ratio, body size and fluctuating asymmetry of Ceroglossus chilensis (Carabidae) in the fragmented Maulino forest and surrounding pine plantations. Acta Oecologica 2009, 35, 811–818. [Google Scholar] [CrossRef]
- Hardersen, S. The role of behavioural ecology of damselflies in the use of fluctuating asymmetry as a bioindicator of water pollution. Ecol. Entomol. 2000, 25, 45–53. [Google Scholar] [CrossRef]
- Ribeiro, B.; Guedes, R.; Corrêa, A.; Santos, C. Fluctuating asymmetry in insecticide-resistant and insecticide-susceptible strains of the maize weevil, Sitophilus zeamais (Coleoptera: Curculionidae). Arch. Environ. Contam. Toxicol. 2007, 53, 77–83. [Google Scholar] [CrossRef] [PubMed]
- Lemić, D.; Benítez, H.A.; Bjeliš, M.; Órdenes-Claveria, R.; Ninčević, P.; Mikac, K.M.; Živković, I.P. Agroecological effect and sexual shape dimorphism in medfly Ceratitis capitata (Diptera: Tephritidae) an example in Croatian populations. Zool. Anz. 2020, 288, 118–124. [Google Scholar] [CrossRef]
- Macfadyen, S.; Gibson, R.; Polaszek, A.; Morris, R.J.; Craze, P.G.; Planqué, R.; Symondson, W.O.; Memmott, J. Do differences in food web structure between organic and conventional farms affect the ecosystem service of pest control? Ecol. Lett. 2009, 12, 229–238. [Google Scholar] [CrossRef]
- Bengtsson, J.; Ahnström, J.; WEIBULL, A.C. The effects of organic agriculture on biodiversity and abundance: A meta-analysis. J. Appl. Ecol. 2005, 42, 261–269. [Google Scholar] [CrossRef]
- Bommarco, R. Reproduction and energy reserves of a predatory carabid beetle relative to agroecosystem complexity. Ecol. Appl. 1998, 8, 846–853. [Google Scholar] [CrossRef]
- Holland, J.; Luff, M. The effects of agricultural practices on Carabidae in temperate agroecosystems. Integr. Pest Manag. Rev. 2000, 5, 109–129. [Google Scholar] [CrossRef]
- Harwood, J.D.; Phillips, S.W.; Lello, J.; Sunderland, K.D.; Glen, D.M.; Bruford, M.W.; Harper, G.L.; Symondson, W.O. Invertebrate biodiversity affects predator fitness and hence potential to control pests in crops. Biol. Control 2009, 51, 499–506. [Google Scholar] [CrossRef]
- Kos, T.; Bažok, R.; Barčić, J. Abundance and frequency of ground beetles in three maize fields in Croatia. J. Environ. Prot. Ecol. 2011, 12, 894–902. [Google Scholar]
- Melnychuk, N.; Olfert, O.; Youngs, B.; Gillott, C. Abundance and diversity of Carabidae (Coleoptera) in different farming systems. Agric. Ecosyst. Environ. 2003, 95, 69–72. [Google Scholar] [CrossRef]
- Bourassa, S.; Cárcamo, H.; Larney, F.; Spence, J. Carabid assemblages (Coleoptera: Carabidae) in a rotation of three different crops in southern Alberta, Canada: A comparison of sustainable and conventional farming. Environ. Entomol. 2008, 37, 1214–1223. [Google Scholar] [CrossRef] [PubMed]
- Kromp, B. Carabid beetles in sustainable agriculture: A review on pest control efficacy, cultivation impacts and enhancement. Agric. Ecosyst. Environ. 1999, 74, 187–228. [Google Scholar] [CrossRef]
- Dinis, A.; Pereira, J.; Pimenta, M.; Oliveira, J.; Benhadi-Marín, J.; Santos, S.A. Suppression of Bactrocera oleae (Diptera: Tephritidae) pupae by soil arthropods in the olive grove. J. Appl. Entomol. 2016, 140, 677–687. [Google Scholar] [CrossRef]
- Panni, S.; Pizzolotto, R. Fast molecular assay to detect the rate of decay of Bactrocera oleae (Diptera: tephritidae) DNA in Pterostichus melas (coleoptera: Carabidae) gut contents. Appl. Entomol. Zool. 2018, 53, 425–431. [Google Scholar] [CrossRef]
- Popović, A.; Mitrović, M.; Petrović, M.; Petrović, A.; Bursić, V.; Marinković, D.; Gvozdenac, S. Molecular identification of ground beetles on arable land. Rom. Biotechnol. Lett. 2016, 21, 11357–11364. [Google Scholar]
- Giglio, A.; Giulianini, P.G.; Zetto, T.; Talarico, F. Effects of the pesticide dimethoate on a non-target generalist carabid, Pterostichus melas italicus (Dejean, 1828)(Coleoptera: Carabidae). Ital. J. Zool. 2011, 78, 471–477. [Google Scholar] [CrossRef]
- Popović, A.; Štrbac, P. Occurrence and fauna composition of gruond beetles in wheat fields. J. Cent. Eur. Agric. 2010, 11, 423–433. [Google Scholar] [CrossRef]
- Ivanković, L.; Anđelić, B.; Gajski, D.; Jelić, M.; Kos, T.; Šerić Jelaska, L. Diversity and ecology of non-target invertebrate fauna in Integrated and Ecologically based Pest Managements in agricultural sites within MEDITERATRI project. In Proceedings of the 55th Croatian & 15th International Symposium on Agriculture-Book of Abstracts, Vodice, Hrvatska, 16–21 February 2020; p. 62. [Google Scholar]
- Rohlf, F.J. TPSdig, v. 2.17; State University at Stony Brook: New York, USA, 2013. [Google Scholar]
- Klingenberg, C.P. MorphoJ: An integrated software package for geometric morphometrics. Mol. Ecol. Resour. 2011, 11, 353–357. [Google Scholar] [CrossRef]
- Rohlf, F.J.; Slice, D. Extensions of the Procustes methods for the optimal superimposition of landmarks. Syst. Zool. 1990, 39, 40–59. [Google Scholar] [CrossRef]
- De Anna, E.B.; Bonisoli-Alquati, A.; Mousseau, T.A. The use of fluctuating asymmetry as a measure of environmentally induced developmental instability: A meta-analysis. Ecol. Indic. 2013, 30, 218–226. [Google Scholar]
- Adams, D.C.; Funk, D.J. Morphometric inferences on sibling species and sexual dimorphism in Neochlamisus bebbianae leaf beetles: Multivariate applications of the thin-plate spline. Syst. Biol. 1997, 46, 180–194. [Google Scholar] [CrossRef]
- Alibert, P.; Moureau, B.; Dommergues, J.L.; David, B. Differentiation at a microgeographical scale within two species of ground beetle, Carabus auronitens and C. nemoralis (Coleoptera, Carabidae): A geometrical morphometric approach. Zool. Scr. 2001, 30, 299–311. [Google Scholar] [CrossRef]
- Lemić, D.; Benítez, H.A.; Bažok, R. Intercontinental effect on sexual shape dimorphism and allometric relationships in the beetle pest Diabrotica virgifera virgifera LeConte (Coleoptera: Chrysomelidae). Zool. Anz. A J. Comp. Zool. 2014, 253, 203–206. [Google Scholar] [CrossRef]
- Benítez, H.A.; Avaria-Llautureo, J.; Canales-Aguirre, C.B.; Jerez, V.; Parra, L.E.; Hernandez, C.E. Evolution of sexual size dimorphism and its relationship with sex ratio in carabid beetles of Genus Ceroglossus Solier. Curr. Zool. 2013, 59, 769–777. [Google Scholar] [CrossRef]
- Benítez, H.A.; Sanzana, M.-J.; Jerez, V.; Parra, L.E.; Hernandez, C.E.; Canales-Aguirre, C.B. Sexual shape and size dimorphism in carabid beetles of the genus Ceroglossus: Is geometric body size similar between sexes due to sex ratio? Zool. Sci. 2013, 30, 289–295. [Google Scholar] [CrossRef]
- Patton, J.; Smith, M. Population structure and the genetic and morphologic divergence among pocket gopher species (genus Thomomys). In Speciation and its Consequences; Otte, D., Endler, J.A., Eds.; Sinaur Associates: Sunderland, MA, USA, 1989; pp. 284–304. [Google Scholar]
- Jambrošić Vladić, Ž.; Benítez, H.A.; Pirnat, A.; Hristovski, S.; Šerić Jelaska, L. Variations in body shape of mountain habitat specialist Carabus croaticus and its sister species Carabus caelatus (Coleoptera: Carabidae) populations across Dinaric Alps. Zoomorphology 2019, 138, 85–96. [Google Scholar] [CrossRef]
- McCabe, J.; Partridge, L. An interaction between environmental temperature and genetic variation for body size for the fitness of adult female Drosophila melanogaster. Evolution 1997, 51, 1164–1174. [Google Scholar] [CrossRef] [PubMed]
- Abaga, N.O.Z.; Alibert, P.; Dousset, S.; Savadogo, P.W.; Savadogo, M.; Sedogo, M. Insecticide residues in cotton soils of Burkina Faso and effects of insecticides on fluctuating asymmetry in honey bees (Apis mellifera Linnaeus). Chemosphere 2011, 83, 585–592. [Google Scholar] [CrossRef] [PubMed]
- Coda, J.; Gomez, D.; Martínez, J.J.; Steinmann, A.; Priotto, J. The use of fluctuating asymmetry as a measure of farming practice effects in rodents: A species-specific response. Ecol. Indic. 2016, 70, 269–275. [Google Scholar] [CrossRef]
- Hunt, J.; Allen, G.R. Larval density and developmental instability in the acoustically orienting parasitoid Homotrixa alleni. Acta Ethologica 2000, 2, 129–132. [Google Scholar] [CrossRef]
- Floate, K.; Fox, A. Flies under stress: A test of fluctuating asymmetry as a biomonitor of environmental quality. Ecol. Appl. 2000, 10, 1541–1550. [Google Scholar] [CrossRef]
- Moller, A.P. Sexual selection, viability selection, and developmental stability in the domestic fly Musca domestica. Evolution 1996, 50, 746–753. [Google Scholar] [CrossRef] [PubMed]
- Swaddle, J.P. Developmental stability and predation success in an insect predator-prey system. Behav. Ecol. 1997, 8, 433–436. [Google Scholar] [CrossRef]
- Chang, X.; Zhai, B.; Liu, X.; Wang, M. Effects of temperature stress and pesticide exposure on fluctuating asymmetry and mortality of Copera annulata (Selys)(Odonata: Zygoptera) larvae. Ecotoxicol. Environ. Saf. 2007, 67, 120–127. [Google Scholar] [CrossRef] [PubMed]
- Hendrickx, F.; Maelfait, J.P.; Lens, L. Relationship between fluctuating asymmetry and fitness within and between stressed and unstressed populations of the wolf spider Pirata piraticus. J. Evol. Biol. 2003, 16, 1270–1279. [Google Scholar] [CrossRef]
- Nunes, L.A.; Araújo, E.D.D.; Marchini, L.C. Fluctuating asymmetry in Apis mellifera (Hymenoptera: Apidae) as bioindicator of anthropogenic environments. Rev. Biol. Trop. 2015, 63, 673–682. [Google Scholar] [CrossRef]
- Mazeed, A.M. Anomalies and asymmetry of wing venation pattern in Carniolan and Egyptian bee populations in Egypt. Egypt. Acad. J. Biol. Sci. A Entomol. 2011, 4, 149–161. [Google Scholar] [CrossRef]


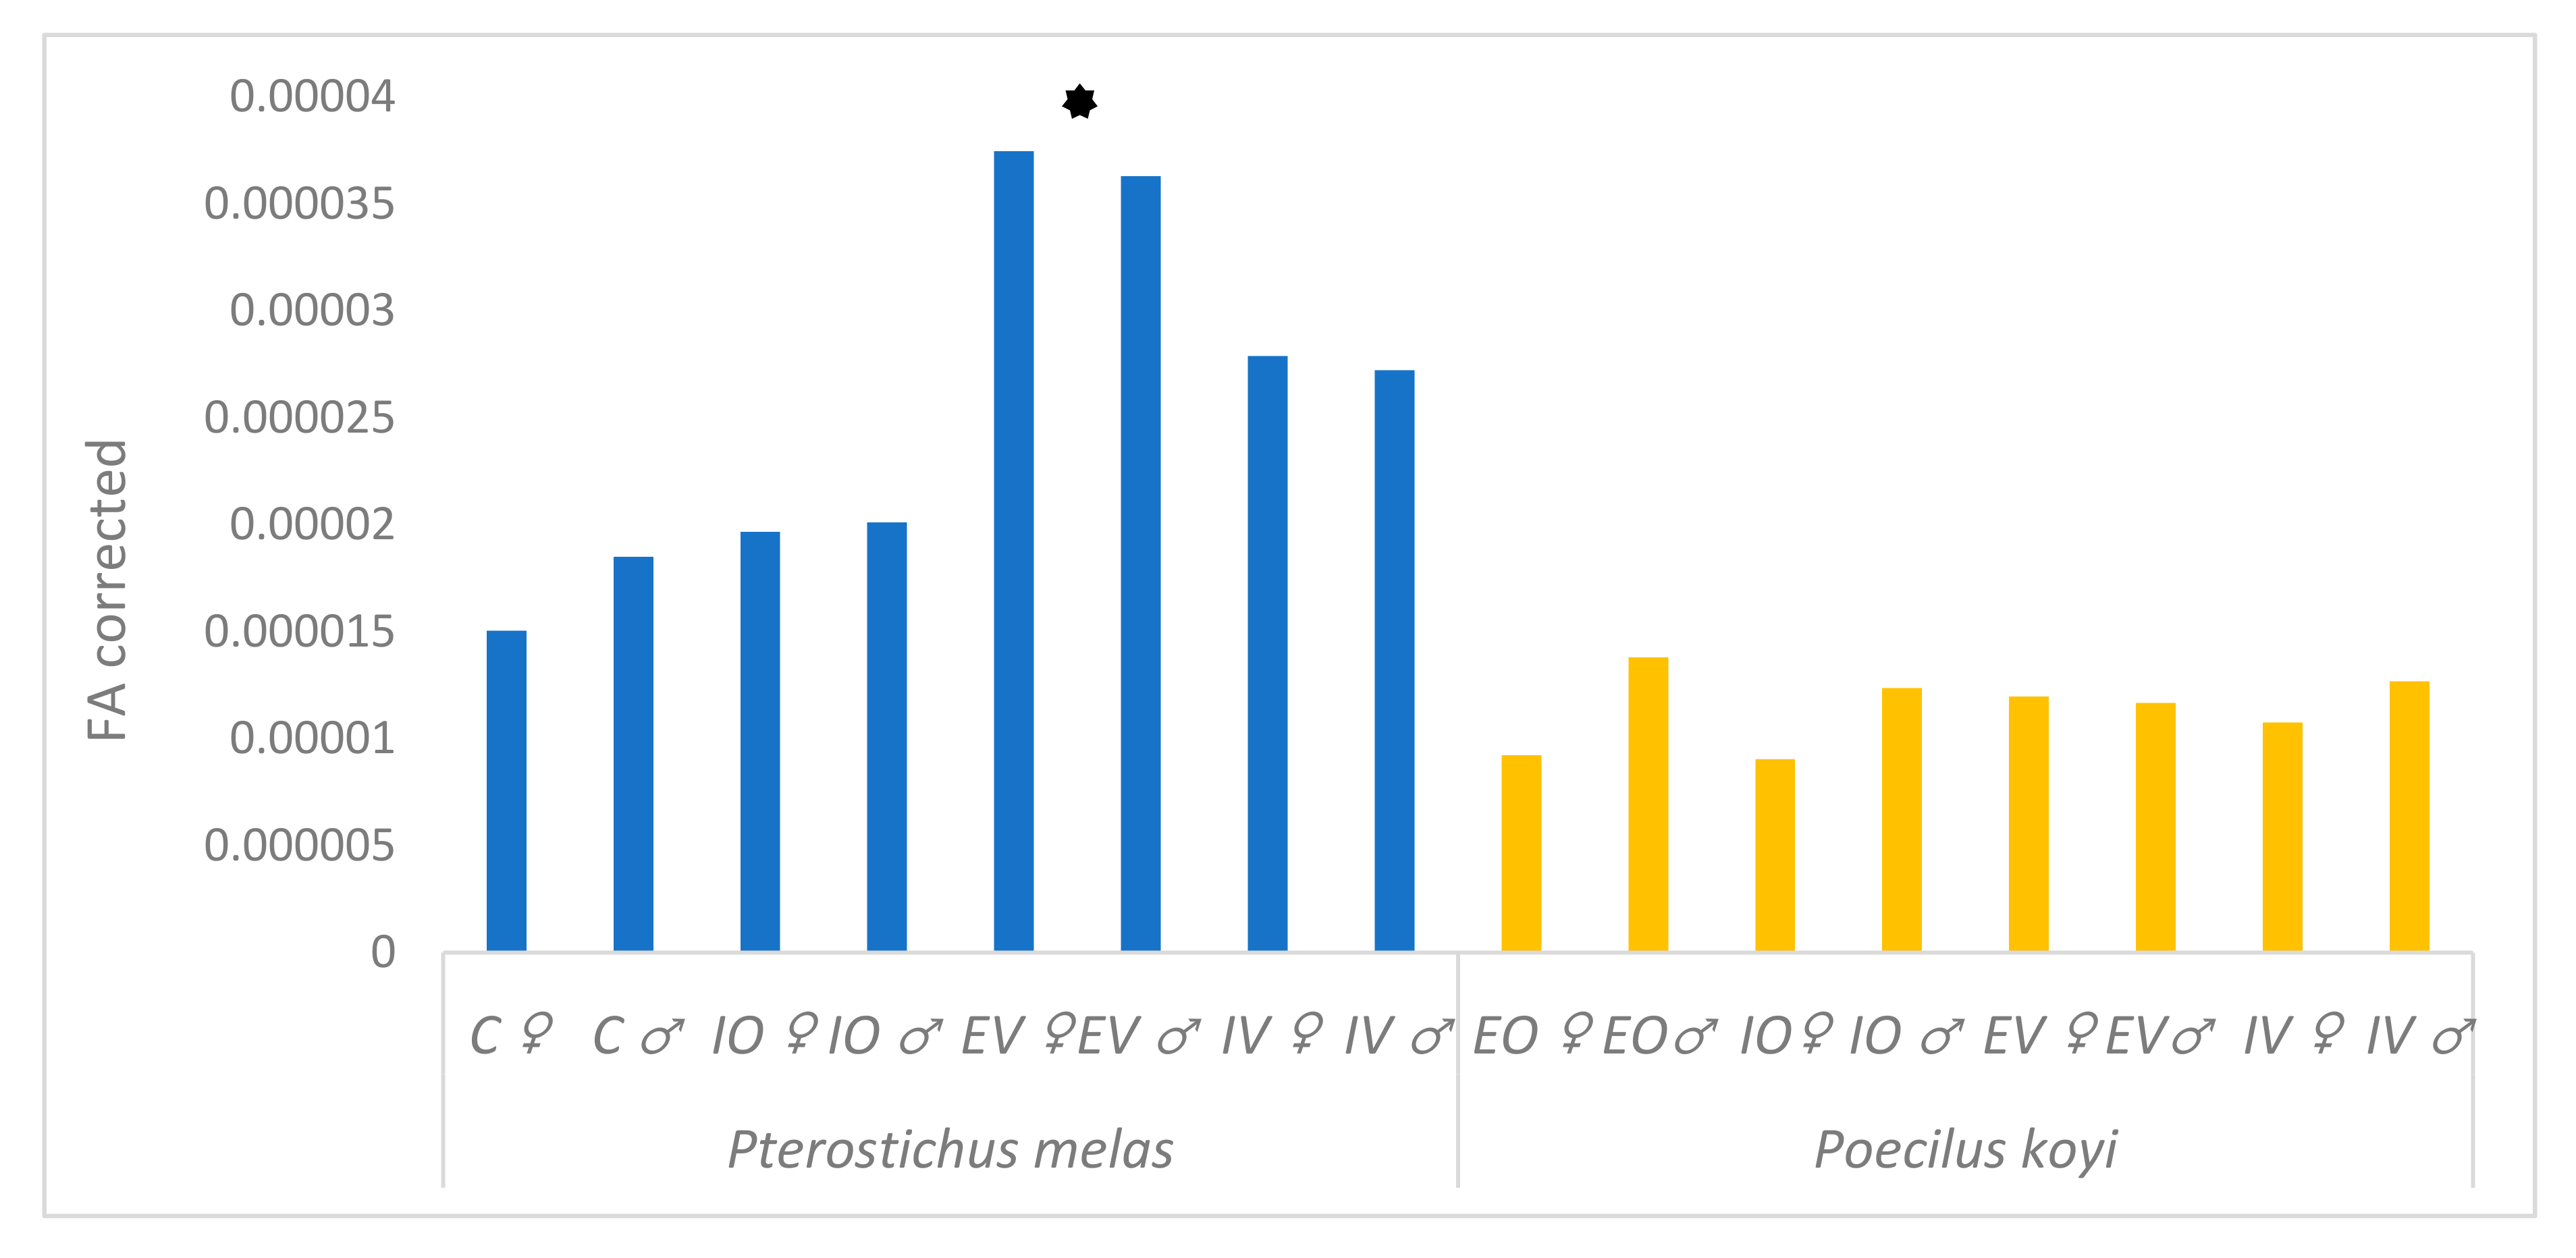
 denotes P. melas populations significantly different in Procrustes FA scores from others, ANOVA, p < 0.05).
denotes P. melas populations significantly different in Procrustes FA scores from others, ANOVA, p < 0.05).
denotes P. melas populations significantly different in Procrustes FA scores from others, ANOVA, p < 0.05).


| Number of Treatments in 2018 | |||||
|---|---|---|---|---|---|
| Treatments | Sites | IV | EV | IO | EO |
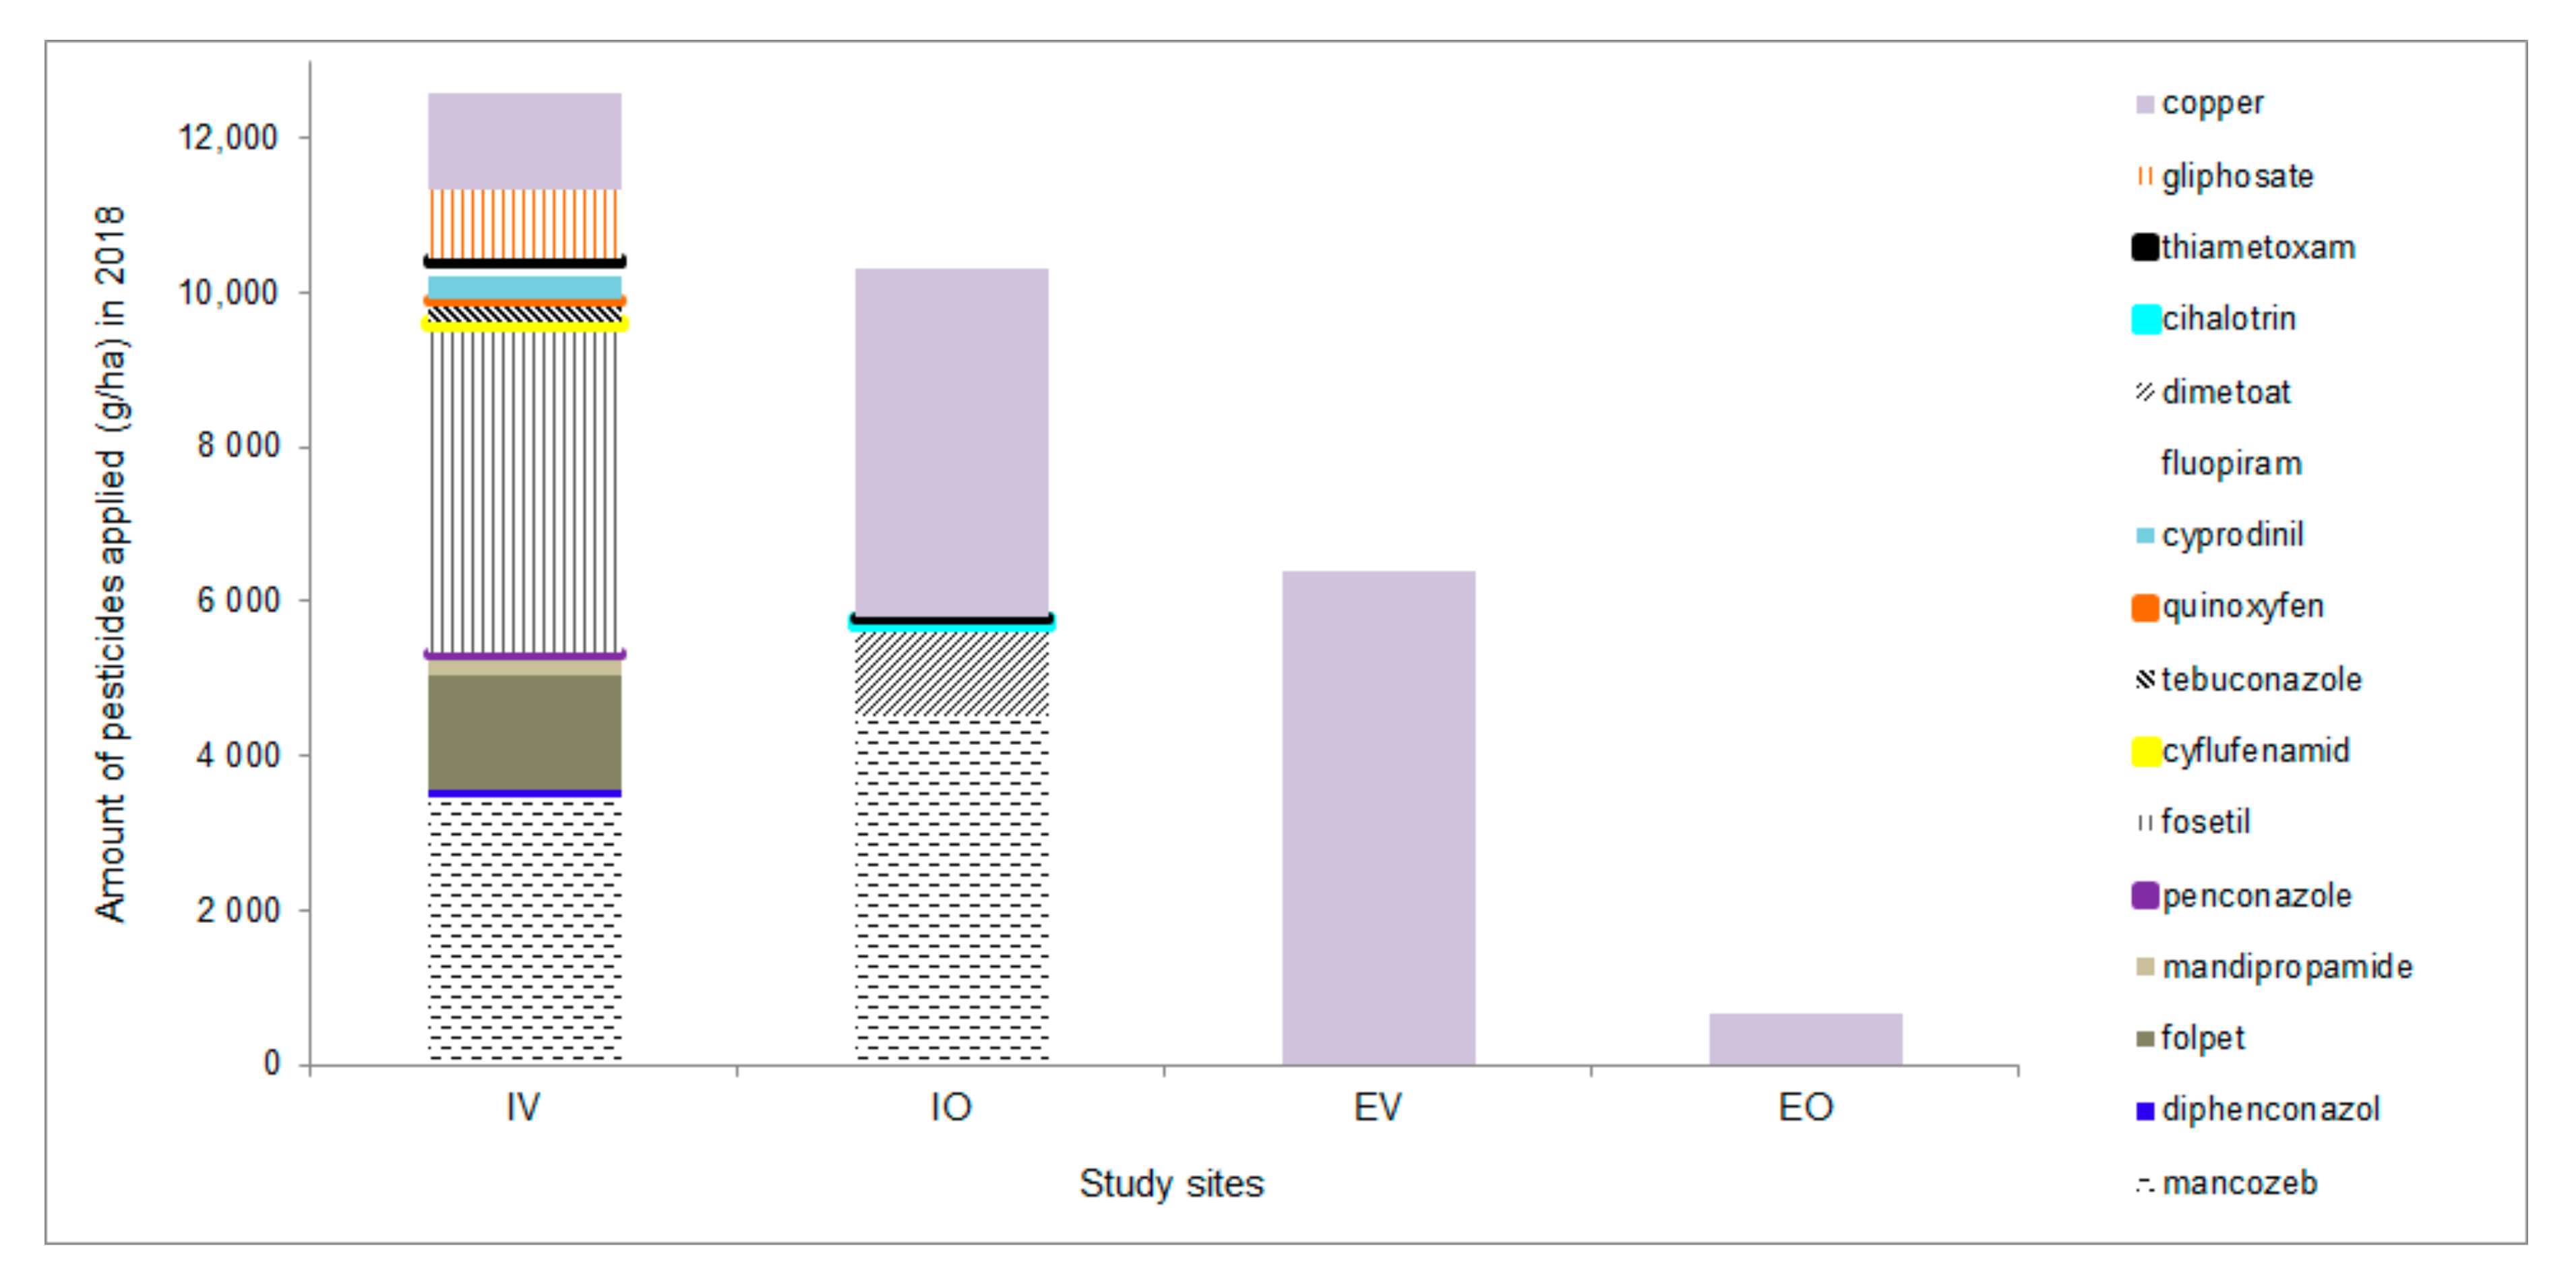
| Pesticides added | Synthetic pesticides * | 12 | 0 | 6 | 0 |
| Biological pesticides ** | 0 | 0 | 0 | 4 | |
| Copper compounds *** | 3 | 6 | 3 | 5 | |
| Soil processing | Mulching | 2 | 0 | 5 | 4 |
| Ploughing and shallow disking | 1 | 3 | 0 | 0 | |
| Type of Study Site | Site (Mark) | Pest Management Type | Number of Specimens for Poecilus koyi | Number of Specimens for Pterostichus melas | ||
|---|---|---|---|---|---|---|
| ♀ | ♂ | ♀ | ♂ | |||
| Olive groves | EO | Ecological | 27 | 53 | 0 | 0 |
| IO | Integrated | 26 | 53 | 50 | 50 | |
| Vineyards | EV | Ecological | 25 | 74 | 50 | 50 |
| IV | Integrated | 22 | 64 | 50 | 50 | |
| Control | C | unmanaged | 0 | 0 | 20 | 9 |
| Effect | SS | MS | df | F | P (param.) | |
|---|---|---|---|---|---|---|
| Pterostichus melas | Centroid size | |||||
| Individual | 10.438037 | 0.037682 | 277 | 35.14 | <0.0001 | |
| Error 1 | 0.585504 | 0.001072 | 546 | |||
| Shape | ||||||
| Individual | 0.62945837 | 0.000162315 | 3878 | 5.39 | <0.0001 | |
| Side | 0.0045157 | 0.00032255 | 14 | 10.71 | <0.0001 | |
| Ind* Side | 0.11677858 | 3.01131 × 10⁻⁵ | 3878 | 28.63 | <0.0001 | |
| Error 1 | 0.01608002 | 1.0518 × 10⁻⁶ | 15288 | |||
| Poecilus koyi | Centroid size | |||||
| Individual | 5.802676 | 0.016674 | 348 | 409.65 | <0.0001 | |
| Error 1 | 0.013676 | 0.000041 | 336 | |||
| Shape | ||||||
| Individual | 0.2256271 | 0.000046311 | 4872 | 3.25 | <0.0001 | |
| Side | 0.00885456 | 0.000632468 | 14 | 44.43 | <0.0001 | |
| Ind* Side | 0.06936083 | 1.42366E-05 | 4872 | 11.69 | <0.0001 | |
| Error 1 | 0.01145416 | 1.2175E-06 | 9408 |
| Species | Site and Sex Distance p Value | C ♂ Mahalanobis p Value | IO ♂ Mahalanobis p Value | EV ♂ Mahalanobis p Value | IV ♂ Mahalanobis p Value | C ♀ Mahalanobis p Value | IO ♀ Mahalanobis p Value | EV ♀ Mahalanobis p Value |
| Pterostichus melas | IO ♂ | 1.7771 0.0677 | ||||||
| EV ♂ | 2.3878 0.0057 | 2.0741 < 0.0001 | ||||||
| IV ♂ | 2.2988 0.0007 | 2.3702 < 0.0001 | 1.6511 < 0.0001 | |||||
| C ♀ | 3.8665 < 0.0001 | 4.7129 < 0.0001 | 4.1761 < 0.0001 | 4.1955 < 0.0001 | ||||
| IO ♀ | 2.781 < 0.0001 | 2.9191 < 0.0001 | 2.922 < 0.0001 | 2.5668 < 0.0001 | 3.0542 < 0.0001 | |||
| EV ♀ | 3.2551 < 0.0001 | 3.6275 < 0.0001 | 2.7623 < 0.0001 | 2.8527 < 0.0001 | 2.6604 < 0.0001 | 2.1433 < 0.0001 | ||
| IV ♀ | 3.4221 < 0.0001 | 3.9055 < 0.0001 | 3.4544 < 0.0001 | 2.7985 < 0.0001 | 2.5228 < 0.0001 | 1.5866 < 0.0001 | 1.9401 < 0.0001 | |
| Species | Site and Sex Distance p Value | EO ♀ Mahalanobis p Value | IO ♀ Mahalanobis p Value | EV ♀ Mahalanobis p Value | IV ♀ Mahalanobis p Value | EO ♂ Mahalanobis p Value | IO ♂ Mahalanobis p Value | EV ♂ Mahalanobis p Value |
| Poecilus koyi | IO ♀ | 1.1751 0.206 | ||||||
| EV ♀ | 1.4212 0.0041 | 1.8508 < 0.0001 | ||||||
| IV ♀ | 0.9435 0.6635 | 1.1502 0.3692 | 1.7277 0.0002 | |||||
| EO ♂ | 2.9347 < 0.0001 | 3.2679 < 0.0001 | 3.3421 < 0.0001 | 2.9529 < 0.0001 | ||||
| IO ♂ | 3.3318 < 0.0001 | 3.3071 < 0.0001 | 3.8005 < 0.0001 | 3.2384 < 0.0001 | 1.6127 < 0.0001 | |||
| EV ♂ | 3.0853 < 0.0001 | 3.3635 < 0.0001 | 3.1367 < 0.0001 | 3.0515 < 0.0001 | 0.9469 0.0123 | 1.8619 < 0.0001 | ||
| IV ♂ | 2.9559 < 0.0001 | 3.0142 < 0.0001 | 3.4758 < 0.0001 | 2.7716 < 0.0001 | 1.2945 0.0001 | 1.0131 0.0128 | 1.4896 < 0.0001 |
| Species | Site and Sex Distance p Value | C ♂ Procrustes p Value | IO ♂ Procrustes p Value | EV ♂ Procrustes p Value | IV ♂ Procrustes p Value | C ♀ Procrustes p Value | IO ♀ Procrustes p Value | EV ♀ Procrustes p Value |
| Pterostichus melas | IO ♂ | 0.0088 0.4891 | ||||||
| EV ♂ | 0.0152 0.0572 | 0.0189 < 0.0001 | ||||||
| IV ♂ | 0.0187 0.001 | 0.0247 < 0.0001 | 0.0152 < 0.0001 | |||||
| C ♀ | 0.0275 0.0002 | 0.0344 < 0.0001 | 0.0234 < 0.0001 | 0.0243 < 0.0001 | ||||
| IO ♀ | 0.0161 0.0143 | 0.0219 < 0.0001 | 0.0164 < 0.0001 | 0.0147 < 0.0001 | 0.0176 0.0001 | |||
| EV ♀ | 0.0237 0.0003 | 0.0294 < 0.0001 | 0.0181 < 0.0001 | 0.0227 < 0.0001 | 0.0113 0.0228 | 0.0177 < 0.0001 | ||
| IV ♀ | 0.025 0.0003 | 0.032 < 0.0001 | 0.0217 < 0.0001 | 0.016 < 0.0001 | 0.0123 0.0063 | 0.0116 0.0001 | 0.0161 < 0.0001 | |
| Species | Site and Sex Distance p Value | EO ♀ Procrustes p Value | IO ♀ Procrustes p Value | EV ♀ Procrustes p Value | IV ♀ Procrustes p Value | EO ♂ Procrustes p Value | IO ♂ Procrustes p Value | EV ♂ Procrustes p Value |
| Poecilus koyi | IO ♀ | 0.0071 0.0672 | ||||||
| EV ♀ | 0.006 0.1352 | 0.01 0.0036 | ||||||
| IV ♀ | 0.0055 0.2602 | 0.0039 0.6577 | 0.0091 0.0169 | |||||
| EO ♂ | 0.0109 0.0001 | 0.0155 < 0.0001 | 0.0107 0.0002 | 0.014 < 0.0001 | ||||
| IO ♂ | 0.0133 < 0.0001 | 0.0163 < 0.0001 | 0.0136 < 0.0001 | 0.0162 < 0.0001 | 0.0079 0.0005 | |||
| EV ♂ | 0.0125 < 0.0001 | 0.0171 < 0.0001 | 0.0108 < 0.0001 | 0.0156 < 0.0001 | 0.0034 0.3014 | 0.0096 < 0.0001 | ||
| IV ♂ | 0.0094 0.0014 | 0.0134 0.0001 | 0.0108 0.0002 | 0.0123 0.0001 | 0.0045 0.1098 | 0.0061 0.0057 | 0.007 0.0021 |
| Species | Population | MS | Error MS | MS-Error (MS) | df | F | P |
|---|---|---|---|---|---|---|---|
| Pterostichus melas | C ♀ | 1.67888 × 10⁻⁵ | 1.7489 × 10⁻⁶ | 1.50399 × 10⁻⁵ | 308 | 11.58 | <0.0001 |
| C ♂ | 2.02496 × 10⁻⁵ | 1.7489 × 10⁻⁶ | 1.85007 × 10⁻⁵ | 434 | 11.81 | <0.0001 | |
| IO ♀ | 2.03913 × 10⁻⁵ | 7.246 × 10⁻⁷ | 1.96667 × 10⁻⁵ | 672 | 28.14 | <0.0001 | |
| IO ♂ | 2.07874 × 10⁻⁵ | 6.739 × 10⁻⁷ | 2.01135 × 10⁻⁵ | 672 | 30.84 | <0.0001 | |
| EV ♀ | 3.85526 × 10⁻⁵ | 1.1008 × 10⁻⁶ | 3.74518 × 10⁻⁵ | 672 | 35.02 | <0.0001 | |
| EV ♂ | 3.75624 × 10⁻⁵ | 1.2696 × 10⁻⁶ | 3.62928 × 10⁻⁵ | 700 | 29.59 | <0.0001 | |
| IV ♀ | 2.90281 × 10⁻⁵ | 1.147 × 10⁻⁶ | 2.78811 × 10⁻⁵ | 686 | 25.31 | <0.0001 | |
| IV ♂ | 2.83715 × 10⁻⁵ | 1.1566 × 10⁻⁶ | 2.72149 × 10⁻⁵ | 686 | 24.53 | <0.0001 | |
| Poecilus koyi | EO ♀ | 1.01514 × 10⁻⁵ | 9.295 × 10⁻⁷ | 9.2219 × 10⁻⁶ | 378 | 10.92 | <0.0001 |
| EO ♂ | 1.48921 × 10⁻⁵ | 1.0947 × 10⁻⁶ | 1.37974 × 10⁻⁵ | 742 | 13.6 | <0.0001 | |
| IO ♀ | 1.00047 × 10⁻⁵ | 9.719 × 10⁻⁷ | 9.0328 × 10⁻⁶ | 350 | 10.29 | <0.0001 | |
| IO ♂ | 1.33458 × 10⁻⁵ | 9.843 × 10⁻⁷ | 1.23615 × 10⁻⁵ | 728 | 13.56 | <0.0001 | |
| EV ♀ | 1.3171 × 10⁻⁵ | 1.1953 × 10⁻⁶ | 1.19757 × 10⁻⁵ | 378 | 11.02 | <0.0001 | |
| EV ♂ | 1.26104 × 10⁻⁵ | 1.3333 × 10⁻⁶ | 1.16779 × 10⁻⁵ | 1022 | 9.01 | <0.0001 | |
| IV ♀ | 1.20838 × 10⁻⁵ | 1.3234 × 10⁻⁶ | 1.07604 × 10⁻⁵ | 308 | 9.42 | <0.0001 | |
| IV ♂ | 1.42704 × 10⁻⁵ | 1.5912 × 10⁻⁶ | 1.26792 × 10⁻⁵ | 896 | 8.97 | <0.0001 |
Publisher’s Note: MDPI stays neutral with regard to jurisdictional claims in published maps and institutional affiliations. |
© 2020 by the authors. Licensee MDPI, Basel, Switzerland. This article is an open access article distributed under the terms and conditions of the Creative Commons Attribution (CC BY) license (http://creativecommons.org/licenses/by/4.0/).
Share and Cite
Ivanković Tatalović, L.; Anđelić, B.; Jelić, M.; Kos, T.; A. Benítez, H.; Šerić Jelaska, L. Fluctuating Asymmetry as a Method of Assessing Environmental Stress in Two Predatory Carabid Species within Mediterranean Agroecosystems. Symmetry 2020, 12, 1890. https://doi.org/10.3390/sym12111890
Ivanković Tatalović L, Anđelić B, Jelić M, Kos T, A. Benítez H, Šerić Jelaska L. Fluctuating Asymmetry as a Method of Assessing Environmental Stress in Two Predatory Carabid Species within Mediterranean Agroecosystems. Symmetry. 2020; 12(11):1890. https://doi.org/10.3390/sym12111890
Chicago/Turabian StyleIvanković Tatalović, Lara, Barbara Anđelić, Mišel Jelić, Tomislav Kos, Hugo A. Benítez, and Lucija Šerić Jelaska. 2020. "Fluctuating Asymmetry as a Method of Assessing Environmental Stress in Two Predatory Carabid Species within Mediterranean Agroecosystems" Symmetry 12, no. 11: 1890. https://doi.org/10.3390/sym12111890
APA StyleIvanković Tatalović, L., Anđelić, B., Jelić, M., Kos, T., A. Benítez, H., & Šerić Jelaska, L. (2020). Fluctuating Asymmetry as a Method of Assessing Environmental Stress in Two Predatory Carabid Species within Mediterranean Agroecosystems. Symmetry, 12(11), 1890. https://doi.org/10.3390/sym12111890