Review

Breaking Symmetry: Fluctuating Asymmetry and Geometric Morphometrics as Tools for Evaluating Developmental Instability under Diverse Agroecosystems

by
Hugo A. Benítez
1,*,
Darija Lemic
2,*,
Amado Villalobos-Leiva
1,3,
Renata Bažok
2,
Rodrigo Órdenes-Claveria
1,
Ivana Pajač Živković
2 and
Katarina M. Mikac
4
1
Laboratorio de Ecología y Morfometría Evolutiva, Centro de Investigación de Estudios Avanzados del Maule, Universidad Católica del Maule, Talca 3466706, Chile
2
Department of Agricultural Zoology, Faculty of Agriculture, University of Zagreb, Svetosimunska 25, 10000 Zagreb, Croatia
3
Departamento de Zoología, Facultad de Ciencias Naturales y Oceanográficas, Universidad de Concepción, Barrio Universitario S/N, Concepción 4030000, Chile
4
Faculty of Science, Medicine and Health, School of Earth, Atmospheric and Life Sciences, Centre for Sustainable Ecosystem Solutions, University of Wollongong, Wollongong, NSW 2500, Australia
*
Authors to whom correspondence should be addressed.
Symmetry 2020, 12(11), 1789; https://doi.org/10.3390/sym12111789
Submission received: 28 August 2020 / Revised: 23 October 2020 / Accepted: 24 October 2020 / Published: 29 October 2020
(This article belongs to the Special Issue Fluctuating Asymmetry as a Measure of Stress)

Abstract

:
Fluctuating asymmetry (FA), in contrast with other asymmetries, is the bilateral asymmetry that represents small, random developmental differences between right and left sides. After nearly a century of using traditional morphometrics in the estimation of FA, geometric morphometrics (GM) now provides new insights into the use of FA as a tool, especially for assessing environmental and developmental stress. Thus, it will be possible to assess adaptation to various environmental stressors as particular triggers for unavoidable selection pressures. In this review, we describe measures of FA that use geometric morphometrics, and we include a flow chart of the methodology. We also describe how this combination (GM + FA) has been tested in several agroecosystems. Nutritional stress, temperature, chemical pollution, and population density are known stressors experienced by populations in agroecosystems.

1. Introduction

Phenotypic responses are the result of the interaction between genome and environment, acting in a noisy developmental system. Consequently, because all tissues and cells of an individual share the same genome, we can assume that environment and developmental noise determine the morphological variability among different parts of an individual [1]. Most organisms have a body plan that involves the repetition of structures in different positions or orientations [2,3]. These repetitive structures are often symmetrical [4]. In nature, we can find various symmetries, where radial symmetry (such as in some flowers, cnidaria, and echinoderms) and bilateral symmetry (in animals) are the most common in nature. In addition, there are spherical symmetries, such as those of some (microalgae and protists (e.g., Foraminifera) [2,5] (Figure 1). Animals with radial symmetry do not have a right or left side. Rather they have an upper or lower side. Such species are usually marine organisms, such as jellyfish and corals. Moreover, it is common for species to have juvenile forms with symmetry different from that of their adult form; for example, larval starfish are bilaterally symmetrical, whereas the adults are radially symmetrical.
Mathematically, an object is symmetric when its shape remains unchanged after some mathematical transformation, such as reflection (bilateral symmetry) or rotation (radial symmetry). For example, reflection on the sagittal plane leaves symmetrically bilateral structures unaltered. Similarly, rotating a radially symmetric object around its axis shall leave the object’s shape or structure unchanged [5]. Bilateral symmetry is characterized by the ability to distinguish a right side and a left side of a body plan, so that they are mirror images of one another (Figure 2).
Since both sides (right and left) are configured by the same genes, we can expect that, under suitable developmental conditions, both sides will develop as mirror images of one another [4,6,7,8]. Conversely, if asymmetry is detected in the shape of structures or organisms, then we are observing some factor or condition that causes alterations in development stability [9]. Asymmetry patterns are the observable expression of biological processes, but they are not biological processes in and of themselves [10]. In other words, asymmetry is the consequence of a biological process. However, inferring biological processes from asymmetry patterns is complex, and generally, additional evidence is required (e.g., wing development [11,12], mouse mandible [12]).
Traditionally, three types of asymmetry can be distinguished in a population according to the probability distribution of the differences between right and left sides: fluctuating asymmetry, directional asymmetry, and antisymmetry (Figure 3A). These asymmetries differ in their mathematical and statistical properties, as well as their origin and biological implications [2,13,14].
Fluctuating asymmetry (FA), unlike other asymmetries, denotes small differences between right and left sides due to random developmental processes [15]. According to Graham et al. [13], all life forms are more or less symmetrical; hence one can demonstrate fluctuating asymmetry in all living organisms, as well as extinct ones [13,16,17]. FA is the principal asymmetry of most organisms. It is not functionally harmful, and it is statistically distributed about a mean of zero (Figure 3A). The origins of FA have been debated for decades, and whether its origins are related (or unrelated) with other fitness components such as reproduction, survivorship, behavior, and physiology still remains unclear [13,14].
Figure 3. Different types of asymmetry (A), namely fluctuating asymmetry, directional asymmetry, and antisymmetry, and their translation into a geometric morphometric paradigm (by Neubauer et al. [18]) represented by a principal component analysis (B).
Symmetry 12 01789 g003
The expected expression of real traits (morphological change to either the right or the left side of the body) is thought to deviate to a particular degree because of genomic constraints, environmental constraints, or both together [19]. These deviations occur because the developmental processes are not completely deterministic, since they have an inherent random component [4]. This random, or residual, component is expressed as FA. The phenotype of the focal species is usually unknown, though it can be estimated (averaged) by examining each symmetrical component of the individual. FA can be calculated for conspecifics that have experienced the same genetic and environmental conditions. In simple terms, FA is the difference between individual asymmetry (left/right differences) and average directional asymmetry [9]. There has been speculation as to whether the distribution of FA is normal and whether tests of kurtosis can be used to understand the biological processes that might influence it or antisymmetry. It is thought that a kind of biological translation of the central limit theorem occurs when the normal distribution of symmetrical differences results from the accumulation of multiple small independent random effects [19]. However, this is unlikely because many developmental processes are nonlinear, multiplicative, and aggregative [8,20].
Adaptation of organisms to a particular environment is often influenced by environmental stress [21,22,23,24,25,26,27]. In addition, unfavorable temperatures, chemicals, population densities, and many other factors may increase fluctuating asymmetries [28,29]. By studying the relationship between morphology and environmental conditions, one can test hypotheses about the influence of agricultural production on organismal form. It has long been known that different environmental conditions are associated with different levels of stress, which can affect an individual’s ability to overcome this pressure and spread their alleles across a landscape. Environmental conditions related to agricultural production, such as nutritional stress, extreme temperatures, chemical pollution, and conditions of dense population, cause stress during development which can lead to increased FA in organisms [25,30,31,32,33]. Nevertheless, it should be clear that the combination of GM and FA opens a new world of analytical tools to investigate the pattern of development and has led researchers to ask new questions about the use of fluctuating asymmetry [4]. The aim of this article is to provide an overview of the use of fluctuating asymmetry (FA), specifically using geometric morphometrics in an environmental context. We highlight how advanced morphometric methods provide the accuracy needed to use FA as a biological indicator of environmental stress.

2. Traditional Morphometrics and Fluctuating Asymmetry

Historically, a series of indices have been suggested to estimate and characterize the numeric value of FA at the individual and population levels [2,3,34]. Only a few of these indices, however, are fundamental and in widespread use. According to Palmer [3], the asymmetry of a given trait in an individual is measured as the absolute difference between the right and left sides (|Ri − Li|), as the assigned difference (Lj − Rj), or as the proportion between the measurements of the sides (log (Ri/Li)). These indices have been used as the base to analyze differences among the asymmetries of specimens; the main difference is the presence or absence, or the way the variation in the size of a trait has been handled. Another index that estimates multiple characters is defined as 1 − r, where r is the correlation between the left and right sides. Windig and Nylin [35] argued that the index 1 − r is useful to compare characters because (a) it is scale independent, (b) it can correct measurement errors, and (c) it includes a normalized index for the variance of the character. Nevertheless, these approaches were criticized [2,36,37] because correlations are influenced by the range of values. Palmer and Strobeck [2] argue that the correlation of R and L acts differently from other indices and never achieves their statistical power [37].
The index used most frequently in the literature is FA1 (mean of absolute deviation |R − L|) being an alternative to var (R − L) but less influenced by outliers [3]. Correspondingly, there is a modification of those indices for positive size scaling. It involves dividing |R| or (R − L) by the size (R + L) of the principal character at the individual level (FA2, FA6, FA8) or at the sample level (FA3, FA7) [3]. Its important to notice that |log R − log L| accomplishes the same thing as |R − L|/(R + L) if R and L are lognormally distributed. Moreover, there is an index that comes from the output of ANOVA which simultaneously tests for measurement errors and size differences among individuals (FA10). More information about these indices can be found in the work of Palmer [3].

3. Fluctuating Asymmetry Using Geometric Morphometrics

Over the last 30 years, geometric morphometrics has been added as a tool in the search for more precise methods for quantifying fluctuating asymmetry, in particular the asymmetry of shape. This has resulted in the reduction of errors that often occur in measurements with traditional morphometrics and has allowed the estimation of more subtle and accurate variations for asymmetry calculation [18,38,39,40,41,42,43].
Procrustes analysis is undertaken to deduce shape data from raw paired data (landmark x, y coordinates); this results in the removal of superfluous data on size, position, and orientation of the starting material that have been landmarked [38,44]. In addition, studies of left–right asymmetry remove reflection by transforming all configurations from one side of the body into their mirror images (to adjust symmetry [38]) or by including both the original and mirror images of all configurations in the analysis, e.g., object symmetry [4]. It is important that GM not be considered a replacement for traditional morphometrics; rather, it should be considered as an option when studying the effect of biotic and abiotic stress upon organismal shape and form.
Figure 3B shows the kinds of asymmetry and their representation in a geometric morphometrics setting involving principal components analysis (PCA). Neubauer et al. [39] explained how to interpret the adjusted PCA to investigate multivariate shape asymmetry. Each vector (arrow in the PCA plot) represents an individual and their deviation from perfect symmetry. The direction of the vector(s) represents the spatial pattern of the symmetry. If individuals vary in asymmetry, but with no directionality (first PCA-panel to the right), the vectors point equally in all directions. In contrast, the second PCA-panel shows a directionality of the asymmetry in which 80% of the samples (individuals) share the same direction along the PC1 (directional asymmetry). The other 20% of individuals have lower magnitude and the reversed pattern. The third PCA-panel shows a bimodal distribution where 80% of individuals share a similar asymmetry pattern captured by PC1, while 20% show the reversed pattern with a comparable magnitude.
Beasley et al. [45], after a meta-analysis, predicted that geometric morphometric approaches to FA of shape and size would be more sensitive to environmental changes than traditional morphometric approaches. These authors suggested that an environmental stress is best shown using the combined biomarker of FA and GM. Nevertheless, they did not show examples of this combination in their article.
On the other hand, geometric morphometrics could have some disadvantages; Ekrami et al. [46] removed the effect of directional asymmetry in a multivariate context. The conventional method of DA correction does not compensate for the effects of DA in other dimensions of asymmetry. They introduced a new measure of asymmetry called fluctuating directional asymmetry (F-DA). Subtracting population-level DA from all individual asymmetry values can only provide unbiased FA measures (possibly reflecting developmental instability) if the underlying DA is the same (both in magnitude and direction) for all individuals (for more details see Ekrami et al. [46]). Nevertheless, these approaches are not new; they were studied in detail at least 20 years ago by Graham et al. [47] and Van Dongen et al. [48].
Shape asymmetry has been used as a measure of developmental instability [22,23,26,49,50,51,52,53] and to examine relationships between stress or other adverse conditions, inbreeding or hybridization, or fitness [10]. The literature on this topic assumes that if the right and left sides of an organism share the same genome and, generally, the same environment, it can be expected that the organs on the left side and those on the right side will share the same target phenotype (assuming that there is no directional asymmetry). Therefore, any differences will be attributable to developmental instability [4]. Nevertheless, generalizing this assumption can be problematic. Klingenberg [4] indicates that for many organisms, FA occurs because of small random variations in developmental processes; FA can be used to quantify developmental instability. More recently, studies have started to combine the use of shape asymmetry, particularly using GM approaches. So, what is intended to be evaluated with GM is the effect of development on the shape of an individual, where the variations are a response from the organism to developmental instability. A different type of application of FA, also with a major use of GM, is to infer the origin of morphological structures [10,38,41,49,54,55,56].
The use of geometric morphometrics in FA studies has provided a method to analyze matters that had been already addressed in FA studies with traditional morphometrics, using linear measures as length measurements (Figure 3). This has opened original research paths that address questions related with topics such as morphological integration [4,10,57].

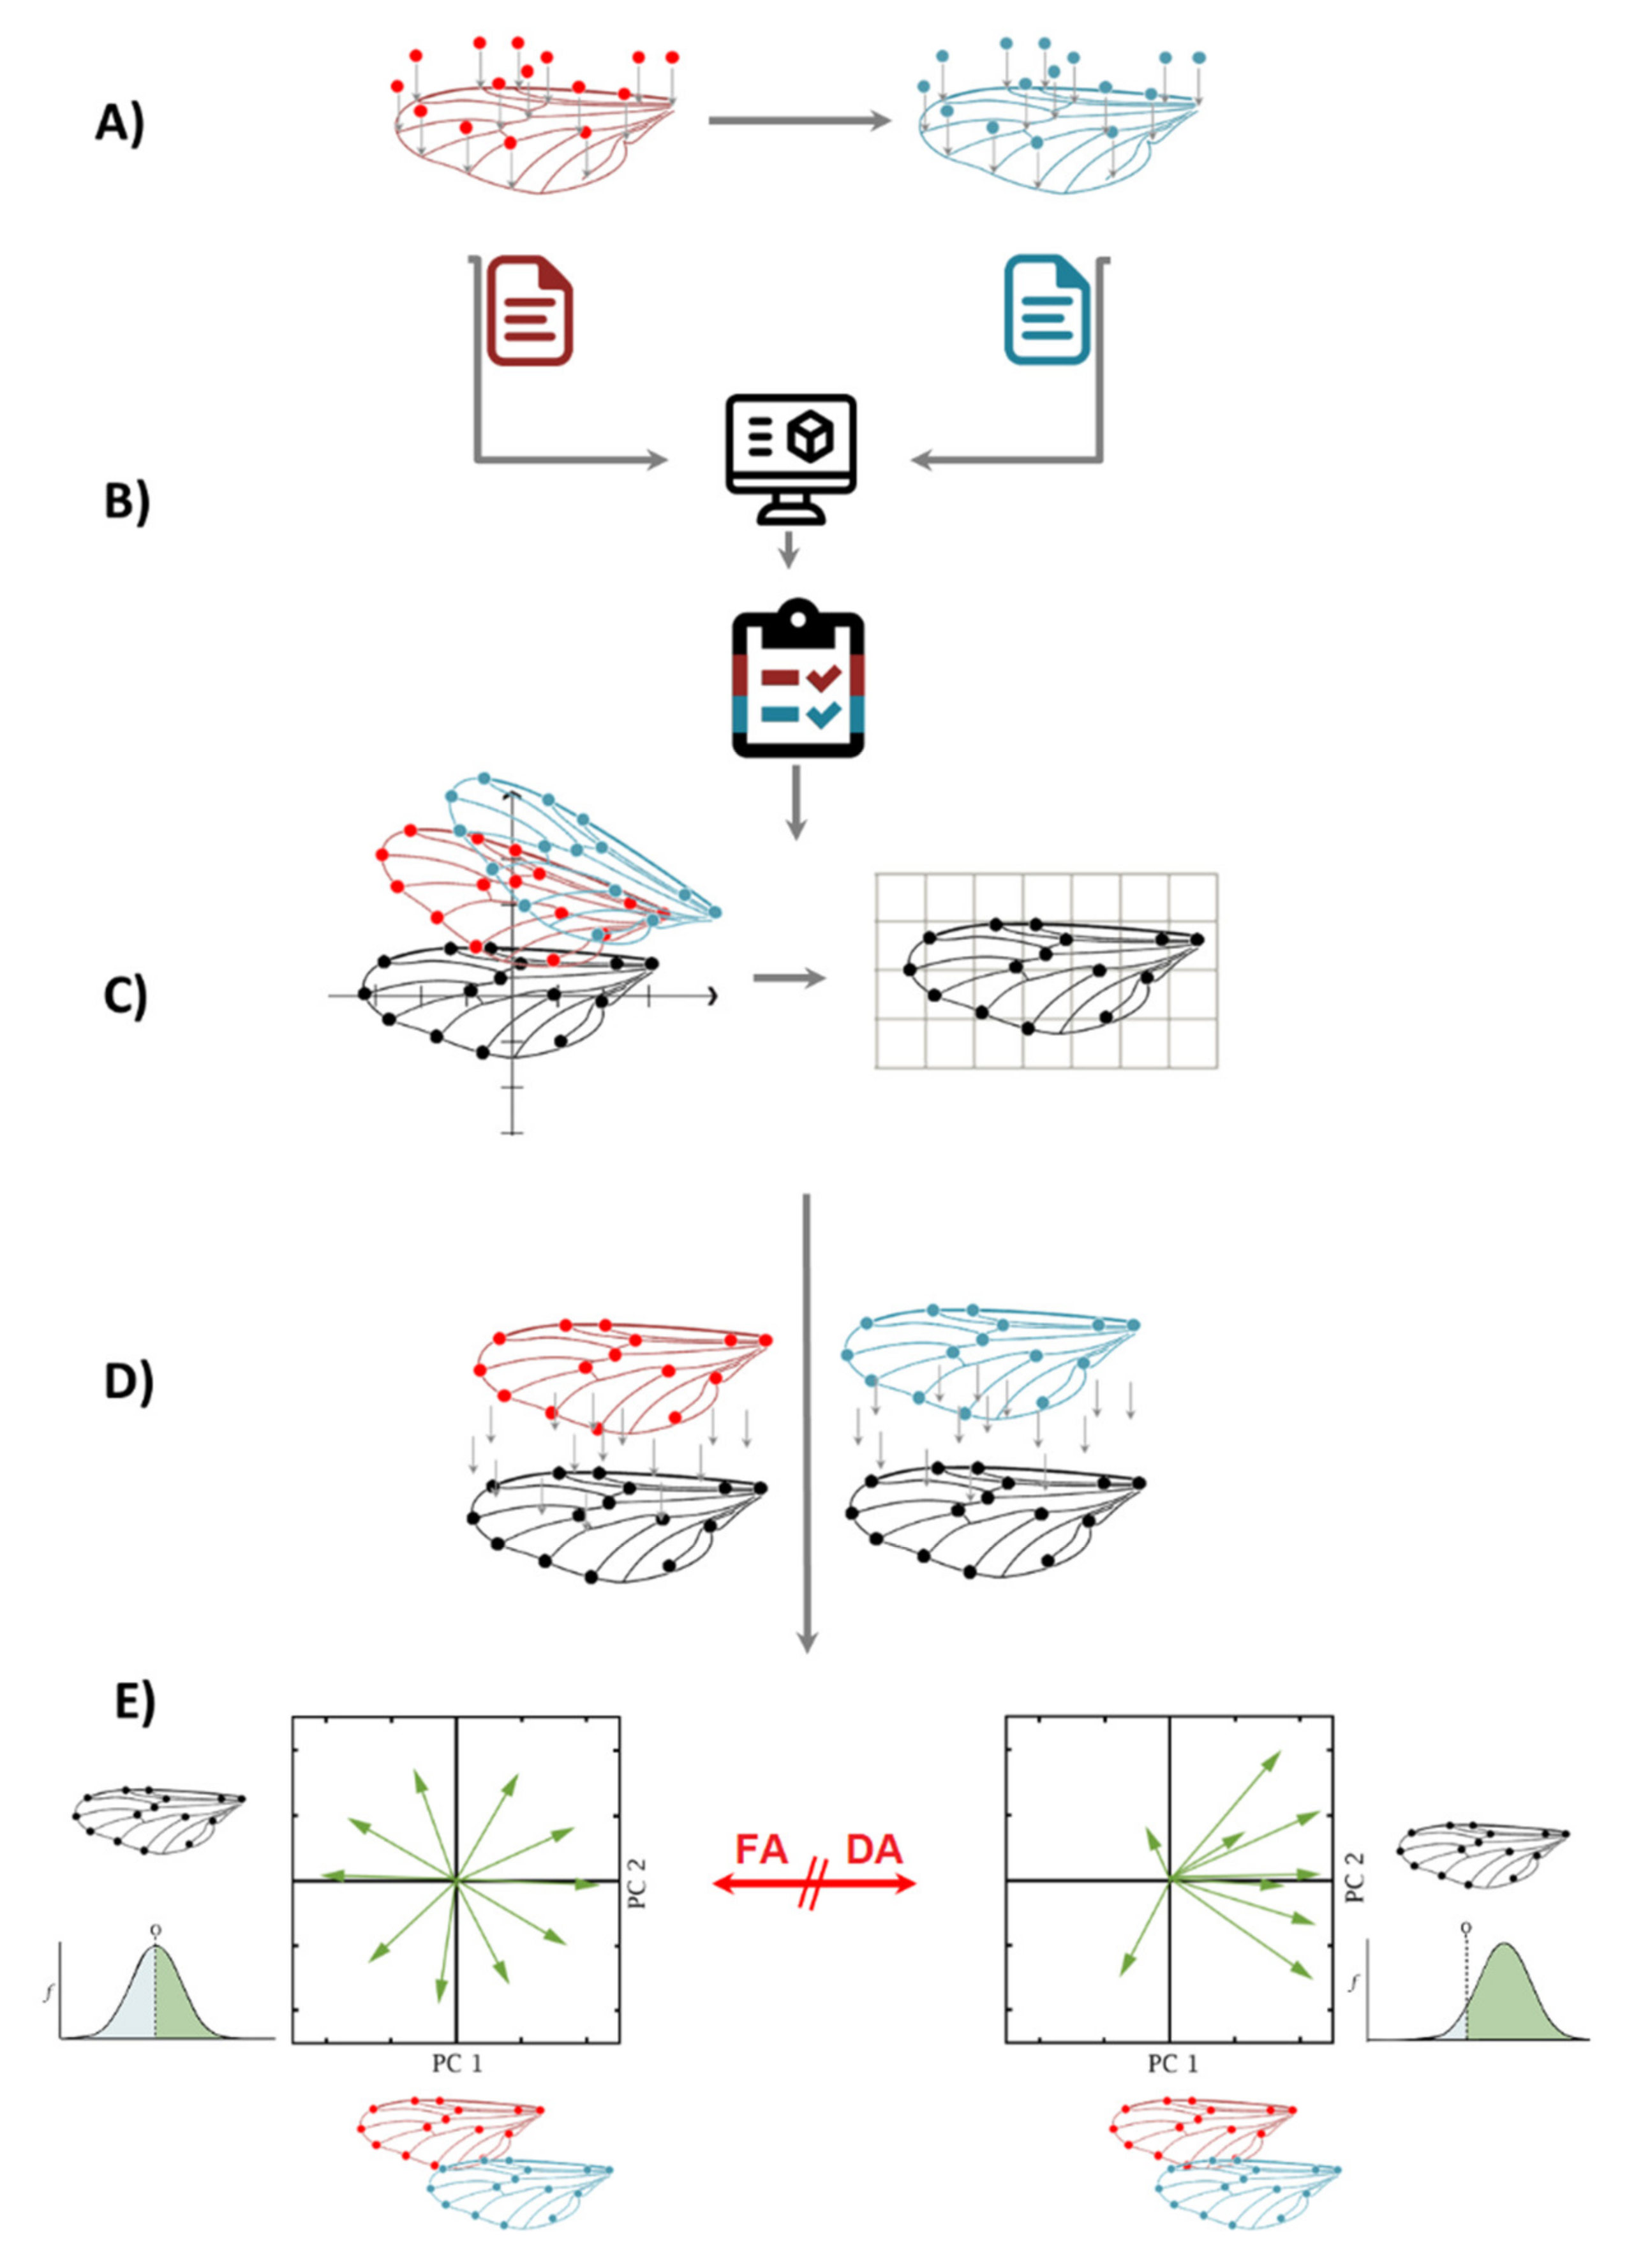
4. FA + GM, Step-by-Step Flow Chart

FA can be analyzed using geometric morphometrics in MorphoJ [58] as follows (outlined in Figure 4):
(a)
Two sets of independent images of the individuals are taken and landmarks are digitized, preferably not on the same day, to account for measurement error.
(b)
After digitizing the images, both independent datasets are combined in one single dataset. It is important to know that FA measurements of left and right sides are taken for each individual separately; therefore, classifiers of Individuals and Side (for matching asymmetry) need to be incorporated.
(c)
A Procrustes fit step is compulsory for all geometric morphometrics data. In this example, there are two matching symmetric wings; thus, the symmetries of paired structures are presented as separate, mirror-image copies, and the software automatically generates a reflection of each original landmark configuration to produce a reflected copy.
(d)
The shape asymmetry is calculated for individuals as the deviation from the original landmark configuration of the symmetric consensus. In this step, a Procrustes ANOVA is performed on the combined dataset, using the following classifiers: Individuals (in the Individual section) Side (in the Side section) and From Dataset (in the Error 1 section). It is important to note that the classifier “From Dataset” is the result of the combination of two repeated measurements, and it is compulsory for every fluctuating asymmetry analysis to calculate the measurement error as well.
(e)
When there is FA, the interaction of Individual × Side is significant in the Procrustes ANOVA; when there is directional asymmetry (DA), the classifier side is also significant. After this, there are two options to calculate the intensity of FA: one is extracting the MS values from the interaction of Individual × Side Procrustes ANOVA and comparing them between groups; the other is extracting the values of Mahalanobis or Procrustes FA scores from the dataset generated by the Procrustes ANOVA and comparing them between groups.
An example of an article using the flow chart, but using vertebrates, is the one provided by Maestri et al. [49], where the authors analyze the suitability of species for certain habitats, for conservation purposes, to predict the survival of a species in the long term. The authors analyzed FA as a measure of developmental stress, which is used as an indirect indicator of an individual’s performance in different regions.
To measure the variability of habitat suitability, the average FA and morphological variance (within the same population) were correlated with the values of habitat suitability generated by modeling. In addition, spatial autocorrelation tests were conducted to determine if the shape variables were correlated in space, since this may have generated bias in the analysis as it breaks the principles of independence between samples.
Maestri et al. [49] found a negative relationship between suitability and FA. In the less suitable areas, individuals experience a number of disturbances during the ontogenetic development of the cranium. Moreover, they found no association between the morphological variance and the habitat suitability. These results confirm the prediction that developmental stress is greater in less suitable environments. This work paves the way for similar studies. At this time, there are no such studies in any agroecosystem. Future work should explore the methods used by Maestri et al. [49] and apply them to agroecosystems; these highly disturbed environments are likely to exert significant and measurable phenotypic changes on organisms in agroecosystems.

5. Fluctuating Asymmetry Using Geometric Morphometrics in Agroecosystems

Landscape structure and habitat fragmentation influence the ecological interactions and morphology of species [59]. Agricultural land forms a large part of the terrestrial landscape, so the effects of agricultural management on populations are numerous and worthy of investigation. Intensive use of agrochemicals, like pesticides and fertilizers, and disturbance after tillage affect biodiversity in intensively used agroecosystems [60] and natural landscapes [61,62]. Fluctuating asymmetry has been used as an indicator of such stress [2,62,63]. While there are many investigations of FA using traditional morphometrics, only a few studies deal with shape FA landmark-based geometric morphometrics. The number is even smaller if agricultural landscape is included in FA patterns.
In the last few decades, FA has been used to answer many questions related to agroecosystems, principally with the use of pesticides and the ensuing environmental stress. Most of these studies involved traditional approaches [64,65,66,67,68,69,70]. Møller et al. [71,72], for example, investigated FA in poultry, showing increasing levels of FA in response to various stressors, such as population density and lighting conditions. Moreover, high FA may be related with prenatal stressors [73,74]. If the mother is exposed to different stressors, it can affect the future offspring. By investigating the body properties of chickens, Eeva et al. [75] and Satterlee et al. [76] confirmed that FA is observed in tarsus length and increases under environmental stress. Similar responses are seen with face length [76,77]. Eriksen et al. [78] concluded that FA in tarsus length and face length in chickens is a reliable indicator of developmental stress.
In a study of young livestock, Pares-Casanova [79] found that size variance was not reflected in the bone lengths: acropodial sizes were similar between the medial and lateral series. Nevertheless, shape asymmetry was indeed present. Another study showed that DA in Araucan horses was always higher than FA after the effect of size was eliminated. This was attributed to the effects of mechanical forces. The dominance of one side may determine differential mastication and bone remodeling, contributing to directional asymmetry [80].
An example of a study using FA of insects in various agricultural landscapes comes from the work of Benítez et al. These authors used FA as a bio-indicator of the development of shape stability of the carabid beetle Pterostichus melas, considering populations living among annual and perennial crops. To collect shape data, the researchers used 2D images of the ventral zone of the beetle body. For this purpose, sixteen landmarks were used, considering right and left sides, and the shape coordinates were derived through a Procrustes fit. To measure symmetry, the reflection was eliminated by including the mirror image and the original image of all the configurations analyzed and performing the superimposition of all of them simultaneously. Measurement error was addressed by digitizing each individual twice. The centroid size variance was used to detect potential size differences, whereas a Procrustes ANOVA was conducted to assess shape asymmetry differences. These analyses were performed by sex to investigate the effects of sexual dimorphism on shape asymmetry. Shape variation was visualized using a PCA of the population average of the symmetric component of shape. The relationship between shape and FA was examined by a multivariate regression. The relationship between climate data and shape was determined using a partial least squares analysis (PLS). Results indicated that carabids inhabiting the perennial agroecosystem showed phenotypic adaptation to anthropogenic influences compared to carabids from annual agroecosystems where the environment was more unpredictable.
Other work on coleopteran species by Benitez et al. [6] investigated how wing shape and size differ in the endemic and extensive/invasive distribution areas of an invasive pest (Diabrotica virgifera LeConte). The morphological integration of D. v. virgifera was estimated using fourteen 2D “type 1 landmarks” defined by vein junctions or vein terminations on the hind wings. Analysis of asymmetry was performed as follows: (1) single-sided configurations were mirrored; (2) configurations were then simultaneously superimposed using Procrustes symmetric variation; and (3) asymmetry components were finally obtained from the mean values and contrasts to the original and reflected configurations [55]. Using standard statistical procedures [81], it was then shown that D. v. virgifera has a moderately integrated hind wing, and thus the symmetrical or asymmetrical variation patterns found had common variation and thus a common origin.
Nattero et al. [82] demonstrated temporal variations in FA wing size and shape of Triatoma infestans populations. By using Procrustes ANOVA, they showed wing FA for each ecotope, sex, and collection year. They concluded that wing FA can be used as a measure of developmental instability. Nattero et al. [83] also noted that the history of insecticide spraying seems to be related to the FA patterns observed; for that reason, Nattero et al. [26] estimated FA under insecticide exposure and described FA for the first time as a marker of insecticide resistance. In their work, they used geometric morphometrics based on landmarks. To assess the wing size asymmetry, the authors estimated centroid size (CS) using orientation configurations of the left and right sides of each individual. Nattero et al. [26] presented the following results of their research: (i) the wing size FA was statistically significant in both females and males before and after spraying; (ii) females showed lower FA values before and after insecticide spraying than males; (iii) females showed higher FA values before spraying than after spraying. In this study, it was documented that wing size and wing shape FA consistently decreased in T. infestans shortly after spraying with pyrethroids. The main finding was that the effects of insecticide application on wing developmental instability are modified by the body size of the insects in the context of insecticide resistance.
It has been argued that FA cannot simply be applied as a general predictor of environmental or genetic stress unless evolutionary, ecological, and methodological assumptions are understood. De Coster et al. reported that FA is widely regarded as a proxy for environmental and genetic stress effects, although empirical associations between FA and stress are often weak or heterogeneous among traits. Some authors believe that only a small number of studies provide (indirect) evidence of a relationship between FA and stress (as reported for Gasterosteus aculeatus by Van Dongen et al., Drosophila melanogaster by Pelabon et al., and D. bipectinate by Polak and Taylor [83]).
The studies of Benitez et al. [6], Nattero et al. [82], and Nattero et al. [26], among other articles using GM exposed before by Klingenberg [4], give an insight into the possibility of using FA as a biomarker for detecting environmentally driven changes in the shape of the organism under different stressors.

6. Conclusions

FA can be used to measure phenotypic response to environmental stress. Many studies have confirmed the use of traditional morphometric FA as a biomarker for stress in agricultural production or for quantifying environmental stress. Geometric morphometric methods of quantifying shape variation have emerged as an alternative way to examine effects of stress on FA. Whether FA is indeed a good measure of development continues to be debated.
Therefore, it is very important to identify FA in an organism, because it does not always reflect perturbations an organism has experienced. Working hypotheses related to population stress and developmental instability should be carefully posed and tested to understand this biological phenomenon further.
The 21st century comes with a new era of integrated science, integrating the analysis of ecological evolutionary developmental biology (Eco-Evo-Devo) to gain a better understanding of the organism’s adaptation to stressors and in response to the need to understand how global environmental changes and management practices affect the adaptation response of a species [1].
FA as an index of environmental stress reveals that organisms are constantly exposed to a changing environment, whether through changes in diet, temperature, predators, competitors, or all these factors simultaneously. The integration with GM has allowed researchers to use it for inferring the developmental origins of integration within or between morphological structures.
Knowledge of the levels of FA in a given organism will reveal the rules underlying the interactions between environment, genes, and the development of an organism and thus aims to broaden our current view of how evolution works. With a better understanding of this, researchers will be able to better understand how certain organisms adapt to environmental stressors.

Author Contributions

Conceptualization, H.A.B. and D.L.; methodology, H.A.B., D.L., and I.P.Ž.; validation, H.A.B., D.L., I.P.Ž., R.B., A.V.-L., R.Ó.-C., and K.M.M.; formal analysis, H.A.B. and D.L.; investigation, H.A.B., D.L., A.V.-L., R.Ó.-C., and K.M.M.; resources, H.A.B., R.B., and D.L.; writing—original draft preparation, H.A.B., D.L., and K.M.M.; writing—review and editing, H.A.B., D.L., and K.M.M.; project administration, H.A.B.; funding acquisition, H.A.B., R.B., and D.L. All authors have read and agreed to the published version of the manuscript.

Funding

This research was funded by the ANID grant FONDECYT DE INICIACION, grant number 11180366 from the government of Chile and Croatian Science Foundation through the project Monitoring of Insect Pest Resistance: Novel Approach for Detection, and Effective Resistance Management Strategies (MONPERES) grant number IP-2016-06-7458.

Acknowledgments

The authors thank John H. Graham for valuable help with the last version of this manuscript, graphic designer Alonso Salazar for contribution to the figures, and Stephan Van Dongen and Chris Klingenberg for the old advice that after more than 5–10 years helped to organize this review.

Conflicts of Interest

The authors declare no conflict of interest.

References

  1. Gilbert, S.F.; Bosch, T.C.; Ledón-Rettig, C. Eco-Evo-Devo: Developmental symbiosis and developmental plasticity as evolutionary agents. Nat. Rev. Genet. 2015, 16, 611–622. [Google Scholar] [CrossRef] [PubMed]
  2. Palmer, A.R.; Strobeck, C. Fluctuating Asymmetry—Measurement, Analysis, Patterns. Annu. Rev. Ecol. Syst. 1986, 17, 391–421. [Google Scholar] [CrossRef]
  3. Palmer, A.R. Fluctuating asymmetry analyses: A primer. In Developmental Instability: Its Origins and Evolutionary Implications; Springer: Berlin/Heidelberg, Germany, 1994; pp. 335–364. [Google Scholar]
  4. Klingenberg, C. Analyzing Fluctuating Asymmetry with Geometric Morphometrics: Concepts, Methods, and Applications. Symmetry 2015, 7, 843–934. [Google Scholar] [CrossRef] [Green Version]
  5. Savriama, Y.; Klingenberg, C.P. Beyond bilateral symmetry: Geometric morphometric methods for any type of symmetry. BMC Evol. Biol. 2011, 11. [Google Scholar] [CrossRef]
  6. Benítez, H.A.; Lemic, D.; Bažok, R.; Bravi, R.; Buketa, M.; Püschel, T. Morphological integration and modularity in Diabrotica virgifera virgifera LeConte (Coleoptera: Chrysomelidae) hind wings. Zool. Anz. A J. Comp. Zool. 2014, 253, 461–468. [Google Scholar] [CrossRef]
  7. Benítez, H.A.; Püschel, T.A. Modelando la Varianza de la Forma: Morfometría Geométrica Aplicaciones en Biología Evolutiva. Int. J. Morphol. 2014, 32, 998–1008. [Google Scholar] [CrossRef] [Green Version]
  8. Klingenberg, C.P. Developmental instability as a research tool: Using patterns of fluctuating asymmetry to infer the developmental origins of morphological integration. In Developmental Instability: Causes and Consequences; Polak, M., Ed.; Oxford University Press: Oxford, UK, 2003; pp. 427–442. [Google Scholar]
  9. Polak, M. Developmental Instability: Causes and Consequences; Oxford University Press: Oxford, UK, 2003. [Google Scholar]
  10. Klingenberg, C.P. Morphological Integration and Developmental Modularity. In Annual Review of Ecology Evolution and Systematics; Annual Reviews: Palo Alto, CA, USA, 2008; Volume 39, pp. 115–132. [Google Scholar]
  11. Klingenberg, C.P.; Zaklan, S.D. Morphological integration between developmental compartments in the Drosophila wing. Evolution 2000, 54, 1273–1285. [Google Scholar] [CrossRef]
  12. Klingenberg, C.P.; Mebus, K.; Auffray, J.C. Developmental integration in a complex morphological structure: How distinct are the modules in the mouse mandible? Evol. Dev. 2003, 5, 522–531. [Google Scholar] [CrossRef]
  13. Graham, J.H.; Raz, S.; Hel-Or, H.; Nevo, E. Fluctuating asymmetry: Methods, theory, and applications. Symmetry 2010, 2, 466–540. [Google Scholar] [CrossRef] [Green Version]
  14. Van Dongen, S. Fluctuating asymmetry and developmental instability in evolutionary biology: Past, present and future. J. Evol. Biol. 2006, 19, 1727–1743. [Google Scholar] [CrossRef]
  15. Van Valen, L. A study of fluctuating asymmetry. Evolution 1962, 16, 125–142. [Google Scholar] [CrossRef]
  16. Babcock, L.E. Asymmetry in the fossil record. Eur. Rev. 2005, 13, 135. [Google Scholar] [CrossRef] [Green Version]
  17. Balzeau, A.; Gilissen, E.; Grimaud-Hervé, D. Shared pattern of endocranial shape asymmetries among great apes, anatomically modern humans, and fossil hominins. PLoS ONE 2012, 7, e29581. [Google Scholar] [CrossRef] [PubMed] [Green Version]
  18. Neubauer, S.; Gunz, P.; Scott, N.A.; Hublin, J.-J.; Mitteroecker, P. Evolution of brain lateralization: A shared hominid pattern of endocranial asymmetry is much more variable in humans than in great apes. Sci. Adv. 2020, 6, eaax9935. [Google Scholar] [CrossRef] [PubMed] [Green Version]
  19. Nijhout, H.; Davidowitz, G. Developmental Perspectives on Phenotypic Variation, Canalization, and Fluctuating Asymmetry; Oxford University Press: New York, NY, USA, 2003; pp. 3–13. [Google Scholar]
  20. Graham, J.H.; Shimizu, K.; Emlen, J.M.; Freeman, D.C.; Merkel, J. Growth models and the expected distribution of fluctuating asymmetry. Biol. J. Linn. Soc. 2003, 80, 57–65. [Google Scholar] [CrossRef] [Green Version]
  21. Alibert, P.; Moureau, B.; Dommergues, J.L.; David, B. Differentiation at a microgeographical scale within two species of ground beetle, Carabus auronitens and C-nemoralis (Coleoptera, Carabidae): A geometrical morphometric approach. Zool. Scr. 2001, 30, 299–311. [Google Scholar] [CrossRef]
  22. Bravi, R.; Benítez, H.A. Left-right asymmetries and shape analysis on Ceroglossus chilensis (Coleoptera: Carabidae). Acta Oecologica-Int. J. Ecol. 2013, 52, 57–62. [Google Scholar] [CrossRef]
  23. Benítez, H.A. Assessment of Patterns of Fluctuating Asymmetry and Sexual Dimorphism in Carabid Body Shape. Neotrop. Entomol. 2013, 42, 164–169. [Google Scholar] [CrossRef]
  24. Debat, V.; Begin, M.; Legout, H.; David, J.R. Allometric and nonallometric components of Drosophila wing shape respond differently to developmental temperature. Evolution 2003, 57, 2773–2784. [Google Scholar] [CrossRef]
  25. Parsons, P.A. Fluctuating asymmetry–a biological monitor of environmental and genomic stress. Heredity 1992, 68, 361–364. [Google Scholar] [CrossRef] [Green Version]
  26. Nattero, J.; Piccinali, R.V.; Gaspe, M.S.; Gürtler, R.E. Fluctuating asymmetry and exposure to pyrethroid insecticides in Triatoma infestans populations in northeastern Argentina. Infect. Genet. Evol. 2019, 74, 103925. [Google Scholar] [CrossRef]
  27. Nattero, J.; Malerba, R.; Rodríguez, C.S.; Crocco, L. Phenotypic plasticity in response to food source in Triatoma infestans (Klug, 1834) (Hemiptera, Reduviidae: Triatominae). Infect. Genet. Evol. 2013, 19, 38–44. [Google Scholar] [CrossRef] [PubMed]
  28. Benítez, H.; Briones, R.; Jerez, V. Fluctuating asymmetry in two populations of Ceroglossus chilensis (Eschscholtz, 1829) (Coleoptera: Carabidae) in agroecosystem of Pinus radiata d. Don, Bio-Bio region, Chile. Gayana 2008, 72, 131–139. [Google Scholar]
  29. Clarke, G. Developmental Stability and Fitness: The Evidence Is Not Quite So Clear. Am. Nat. 1998, 152, 762–766. [Google Scholar] [CrossRef] [PubMed]
  30. Garnier, S.; Gidaszewski, N.; Charlot, M.; Rasplus, J.-Y.; Alibert, P. Hybridization, developmental stability, and functionality of morphological traits in the ground beetle Carabus solieri (Coleoptera, Carabidae). Biol. J. Linn. Soc. 2006, 89, 151–158. [Google Scholar] [CrossRef] [Green Version]
  31. Hoffmann, A.; Woods, R. Associating environmental stress with developmental stability: Problems and patterns. In Developmental Instability: Causes and Consequences; Polak, M., Ed.; Oxford University Press: Oxford, UK, 2003; pp. 387–401. [Google Scholar]
  32. Markow, T.A. Evolutionary ecology and developmental instability. Annu. Rev. Entomol. 1995, 40, 105–120. [Google Scholar] [CrossRef]
  33. Chirichella, R.; Rocca, M.; Brugnoli, A.; Mustoni, A.; Apollonio, M. Fluctuating asymmetry in Alpine chamois horns: An indicator of environmental stress. Evol. Ecol. 2020, 34, 573–587. [Google Scholar] [CrossRef]
  34. Palmer, A.R.; Strobeck, C. Fluctuating asymmetry analyses revisited. In Developmental Instability: Causes and Consequences; Polak, M., Ed.; Oxford University Press: Oxford, UK, 2003; pp. 279–319. [Google Scholar]
  35. Windig, J.; Nylin, S. How to compare fluctuating asymmetry of different traits. J. Evol. Biol. 2000, 13, 29–37. [Google Scholar] [CrossRef]
  36. Angus, R. Quantifying Fluctuating Asymmetry: Not All Methods are Equivalent. Growth 1982, 46, 337–342. [Google Scholar]
  37. Graham, J.H.; Özener, B. Fluctuating asymmetry of human populations: A review. Symmetry 2016, 8, 154. [Google Scholar] [CrossRef] [Green Version]
  38. Klingenberg, C.P.; McIntyre, G.S. Geometric morphometrics of developmental instability: Analyzing patterns of fluctuating asymmetry with procrustes methods. Evolution 1998, 52, 1363–1375. [Google Scholar] [CrossRef] [PubMed]
  39. Klingenberg, C.P.; McIntyre, G.S.; Zaklan, S.D. Left-right asymmetry of fly wings and the evolution of body axes. Proc. R. Soc. B-Biol. Sci. 1998, 265, 1255–1259. [Google Scholar] [CrossRef] [PubMed] [Green Version]
  40. Auffray, J.; Debat, V.; Alibert, P. Shape asymmetry and developmental stability. In On Growth and Form: Spatio-Temporal Pattern Formation in Biology; Wiley: Chichester, UK, 1999; pp. 309–324. [Google Scholar]
  41. Zelditch, M.L.; Wood, A.R.; Swiderski, D.L. Building Developmental Integration into Functional Systems: Function-Induced Integration of Mandibular Shape. Evol. Biol. 2009, 36, 71–87. [Google Scholar] [CrossRef]
  42. Lawing, A.M.; Polly, P.D. Geometric morphometrics: Recent applications to the study of evolution and development. J. Zool. 2010, 280, 1–7. [Google Scholar] [CrossRef]
  43. Benítez, H.A.; Parra, L.E. Asimetría fluctuante: Una herramienta morfo-funcional para medir estabilidad del desarrollo. Int. J. Morphol. 2011, 29, 1459–1469. [Google Scholar] [CrossRef]
  44. Dryden, I.L.; Mardia, K.V. Statistical Shape Analysis; Wiley Chichester: New York, NY, USA, 1998; Volume 4. [Google Scholar]
  45. De Anna, E.B.; Bonisoli-Alquati, A.; Mousseau, T.A. The use of fluctuating asymmetry as a measure of environmentally induced developmental instability: A meta-analysis. Ecol. Indic. 2013, 30, 218–226. [Google Scholar]
  46. Ekrami, O.; Claes, P.; White, J.D.; Weinberg, S.M.; Marazita, M.L.; Walsh, S.; Shriver, M.D.; Dongen, S.V. A multivariate approach to determine the dimensionality of human facial asymmetry. Symmetry 2020, 12, 348. [Google Scholar] [CrossRef] [Green Version]
  47. Graham, J.H.; Emlen, J.M.; Freeman, D.C.; Leamy, L.J.; Kieser, J.A. Directional asymmetry and the measurement of developmental instability. Biol. J. Linn. Soc. 1998, 64, 1–16. [Google Scholar] [CrossRef]
  48. Dongen, S.V. How repeatable is the estimation of developmental stability by fluctuating asymmetry? Proc. R. Soc. Lond. Ser. B Biol. Sci. 1998, 265, 1423–1427. [Google Scholar] [CrossRef]
  49. Maestri, R.; Fornel, R.; Galiano, D.; de Freitas, T.R. Niche suitability affects development: Skull asymmetry increases in less suitable areas. PLoS ONE 2015, 10, e0122412. [Google Scholar] [CrossRef]
  50. Viscosi, V. Geometric morphometrics and leaf phenotypic plasticity: Assessing fluctuating asymmetry and allometry in European white oaks (Quercus). Bot. J. Linn. Soc. 2015, 179, 335–348. [Google Scholar] [CrossRef] [Green Version]
  51. Urošević, A.; Ljubisavljević, K.; Ivanović, A. Fluctuating asymmetry and individual variation in the skull shape of the common wall lizard (Podarcis muralis Laurenti, 1768) estimated by geometric morphometrics. Herpetol. J. 2015, 25, 177–186. [Google Scholar]
  52. Neustupa, J.; Woodard, K. Geometric morphometrics reveals increased symmetric shape variation and asymmetry related to lead exposure in the freshwater green alga Micrasterias compereana. Ecol. Indic. 2020, 111, 106054. [Google Scholar] [CrossRef]
  53. Sandner, T.M.; Zverev, V.; Kozlov, M.V. Can the use of landmarks improve the suitability of fluctuating asymmetry in plant leaves as an indicator of stress? Ecol. Indic. 2019, 97, 457–465. [Google Scholar] [CrossRef]
  54. Debat, V.; Debelle, A.; Dworkin, I. Plasticity, canalization, and developmental stability of the Drosophila wing: Joint effects of mutations and developmental temperature. Evol. Int. J. Org. Evol. 2009, 63, 2864–2876. [Google Scholar] [CrossRef]
  55. Klingenberg, C.P.; Barluenga, M.; Meyer, A. Shape analysis of symmetric structures: Quantifying variation among individuals and asymmetry. Evolution 2002, 56, 1909–1920. [Google Scholar] [CrossRef] [PubMed] [Green Version]
  56. Lehoux, C.; Cloutier, R. Building blocks of a fish head: Developmental and variational modularity in a complex system. J. Exp. Zool. Part. B Mol. Dev. Evol. 2015, 324, 614–628. [Google Scholar] [CrossRef]
  57. Villalobos-Leiva, A.; Benítez, H.A. Morfometría geométrica y sus nuevas aplicaciones en ecología y biología evolutiva. Parte 2. Int. J. Morphol. 2020, 38, 1818–1836. [Google Scholar]
  58. Klingenberg, C.P. MorphoJ: An integrated software package for geometric morphometrics. Mol. Ecol. Resour. 2011, 11, 353–357. [Google Scholar] [CrossRef]
  59. Hunter, M.D. Landscape structure, habitat fragmentation, and the ecology of insects. Agric. For. Entomol. 2002, 4, 159–166. [Google Scholar] [CrossRef]
  60. Tscharntke, T.; Klein, A.M.; Kruess, A.; Steffan-Dewenter, I.; Thies, C. Landscape perspectives on agricultural intensification and biodiversity–ecosystem service management. Ecol. Lett. 2005, 8, 857–874. [Google Scholar] [CrossRef]
  61. Geiger, F.; Bengtsson, J.; Berendse, F.; Weisser, W.W.; Emmerson, M.; Morales, M.B.; Ceryngier, P.; Liira, J.; Tscharntke, T.; Winqvist, C. Persistent negative effects of pesticides on biodiversity and biological control potential on European farmland. Basic Appl. Ecol. 2010, 11, 97–105. [Google Scholar] [CrossRef]
  62. Marchand, H.; Paillat, G.; Montuire, S.; Butet, A. Fluctuating asymmetry in bank vole populations (Rodentia, Arvicolinae) reflects stress caused by landscape fragmentation in the Mont-Saint-Michel Bay. Biol. J. Linn. Soc. 2003, 80, 37–44. [Google Scholar] [CrossRef]
  63. Leary, R.F.; Allendorf, F.W. Fluctuating asymmetry as an indicator of stress: Implications for conservation biology. Trends Ecol. Evol. 1989, 4, 214–217. [Google Scholar] [CrossRef]
  64. Clarke, G.M. Fluctuating asymmetry of invertebrate populations as a biological indicator of environmental quality. Environ. Pollut. 1993, 82, 207–211. [Google Scholar] [CrossRef]
  65. Naugler, C.T.; Leech, S.M. Fluctuating asymmetry and survival ability in the forest tent caterpillar moth Malacosoma disstria: Implications for pest management. Entomol. Exp. Appl. 1994, 70, 295–298. [Google Scholar] [CrossRef]
  66. Floate, K.; Fox, A. Flies under stress: A test of fluctuating asymmetry as a biomonitor of environmental quality. Ecol. Appl. 2000, 10, 1541–1550. [Google Scholar] [CrossRef]
  67. Ribeiro, B.; Guedes, R.; Corrêa, A.; Santos, C. Fluctuating asymmetry in insecticide-resistant and insecticide-susceptible strains of the maize weevil, Sitophilus zeamais (Coleoptera: Curculionidae). Arch. Environ. Contam. Toxicol. 2007, 53, 77–83. [Google Scholar] [CrossRef]
  68. Chang, X.; Zhai, B.; Wang, M.; Wang, B. Relationship between exposure to an insecticide and fluctuating asymmetry in a damselfly (Odonata, Coenagriidae). Hydrobiologia 2007, 586, 213–220. [Google Scholar] [CrossRef]
  69. Abaga, N.O.Z.; Alibert, P.; Dousset, S.; Savadogo, P.W.; Savadogo, M.; Sedogo, M. Insecticide residues in cotton soils of Burkina Faso and effects of insecticides on fluctuating asymmetry in honey bees (Apis mellifera Linnaeus). Chemosphere 2011, 83, 585–592. [Google Scholar] [CrossRef]
  70. Graham, J.H.; Freeman, D.C.; Emlen, J.M. Developmental stability: A sensitive indicator of populations under stress. Astm Spec. Tech. Publ. 1993, 1179, 136–158. [Google Scholar]
  71. Møller, A.; Sanotra, G.; Vestergaard, K. Developmental stability in relation to population density and breed of chickens Gallus gallus. Poult. Sci. 1995, 74, 1761–1771. [Google Scholar] [CrossRef] [PubMed]
  72. Møller, A.; Sanotra, G.; Vestergaard, K. Developmental instability and light regime in chickens (Gallus gallus). Appl. Anim. Behav. Sci. 1999, 62, 57–71. [Google Scholar] [CrossRef]
  73. Gest, T.; Siegel, M.; Anistranski, J. Increased fluctuating asymmetry in the long bones of neonatal rats stressed in cold, heat, and noise. Growth 1986, 50, 385–389. [Google Scholar]
  74. Newell-Morris, L.; Fahrenbruch, C.; Sackett, G. Prenatal psychological stress, dermatoglyphic asymmetry and pregnancy outcome in the pigtailed macaque (Macaca nemestrina). Neonatology 1989, 56, 61–75. [Google Scholar] [CrossRef] [PubMed]
  75. Eeva, T.; Tanhuanpaa, S.; Rabergh, C.; Airaksinen, S.; Nikinmaa, M.; Lehikoinen, E. Biomarkers and fluctuating asymmetry as indicators of pollution-induced stress in two hole-nesting passerines. Funct. Ecol. 2000, 14, 235–243. [Google Scholar] [CrossRef] [Green Version]
  76. Satterlee, D.; Cadd, G.; Jones, R. Developmental instability in Japanese quail genetically selected for contrasting adrenocortical responsiveness. Poult. Sci. 2000, 79, 1710–1714. [Google Scholar] [CrossRef]
  77. Yang, A.; Dunnington, E.; Siegel, P. Developmental stability in stocks of White Leghorn chickens. Poult. Sci. 1997, 76, 1632–1636. [Google Scholar] [CrossRef]
  78. Eriksen, M.; Haug, A.; Torjesen, P.; Bakken, M. Prenatal exposure to corticosterone impairs embryonic development and increases fluctuating asymmetry in chickens (Gallus gallus domesticus). Br. Poult. Sci. 2003, 44, 690–697. [Google Scholar] [CrossRef]
  79. Parés-Casanova, P.M.; Castel-Mas, L.; Jones-Capdevila, K.N. Asymmetries of Forelimb Digits of Young Cattle. Vet. Sci. 2020, 7, 83. [Google Scholar] [CrossRef]
  80. Parés Casanova, P.-M.; Crosby-Granados, R.; Muñoz, F.; Salamanca-Carreño, A. Marked directional skull asymmetry in the Araucan horse. Vet. Comp. Orthop. Traumatol. 2020, 3, 11–18. [Google Scholar] [CrossRef] [Green Version]
  81. Rohlf, F.J.; Corti, M. Use of two-block partial least-squares to study covariation in shape. Syst. Biol. 2000, 49, 740–753. [Google Scholar] [CrossRef] [Green Version]
  82. Nattero, J.; Piccinali, R.V.; Lopes, C.M.; Hernández, M.L.; Abrahan, L.; Lobbia, P.A.; Rodríguez, C.S.; de la Fuente, A.L.C. Morphometric variability among the species of the Sordida subcomplex (Hemiptera: Reduviidae: Triatominae): Evidence for differentiation across the distribution range of Triatoma sordida. Parasites Vectors 2017, 10, 412. [Google Scholar] [CrossRef] [Green Version]
  83. Polak, M.; Taylor, P.W. A primary role of developmental instability in sexual selection. Proc. R. Soc. B Biol. Sci. 2007, 274, 3133–3140. [Google Scholar] [CrossRef] [Green Version]
Figure 1. Three different type of symmetry in organisms from left to right: bilateral, radial, and spherical symmetry. Red lines represents the axes of symmetry.
Symmetry 12 01789 g001
Figure 2. Representation of a carabid beetle (Ceroglossus chilensis) indicating the different planes of a bilateral symmetry.
Symmetry 12 01789 g002
Figure 4. Step-by-step graphical flow chart of the fluctuating asymmetry procedure using geometric morphometrics (AE explanation can be checked in FA + GM, Step-by-Step Flow Chart section).
Symmetry 12 01789 g004
Publisher’s Note: MDPI stays neutral with regard to jurisdictional claims in published maps and institutional affiliations.

