Thermo-Hydraulic Performance Analysis on the Effects of Truncated Twisted Tape Inserts in a Tube Heat Exchanger


 and
and 
Abstract
1. Introduction
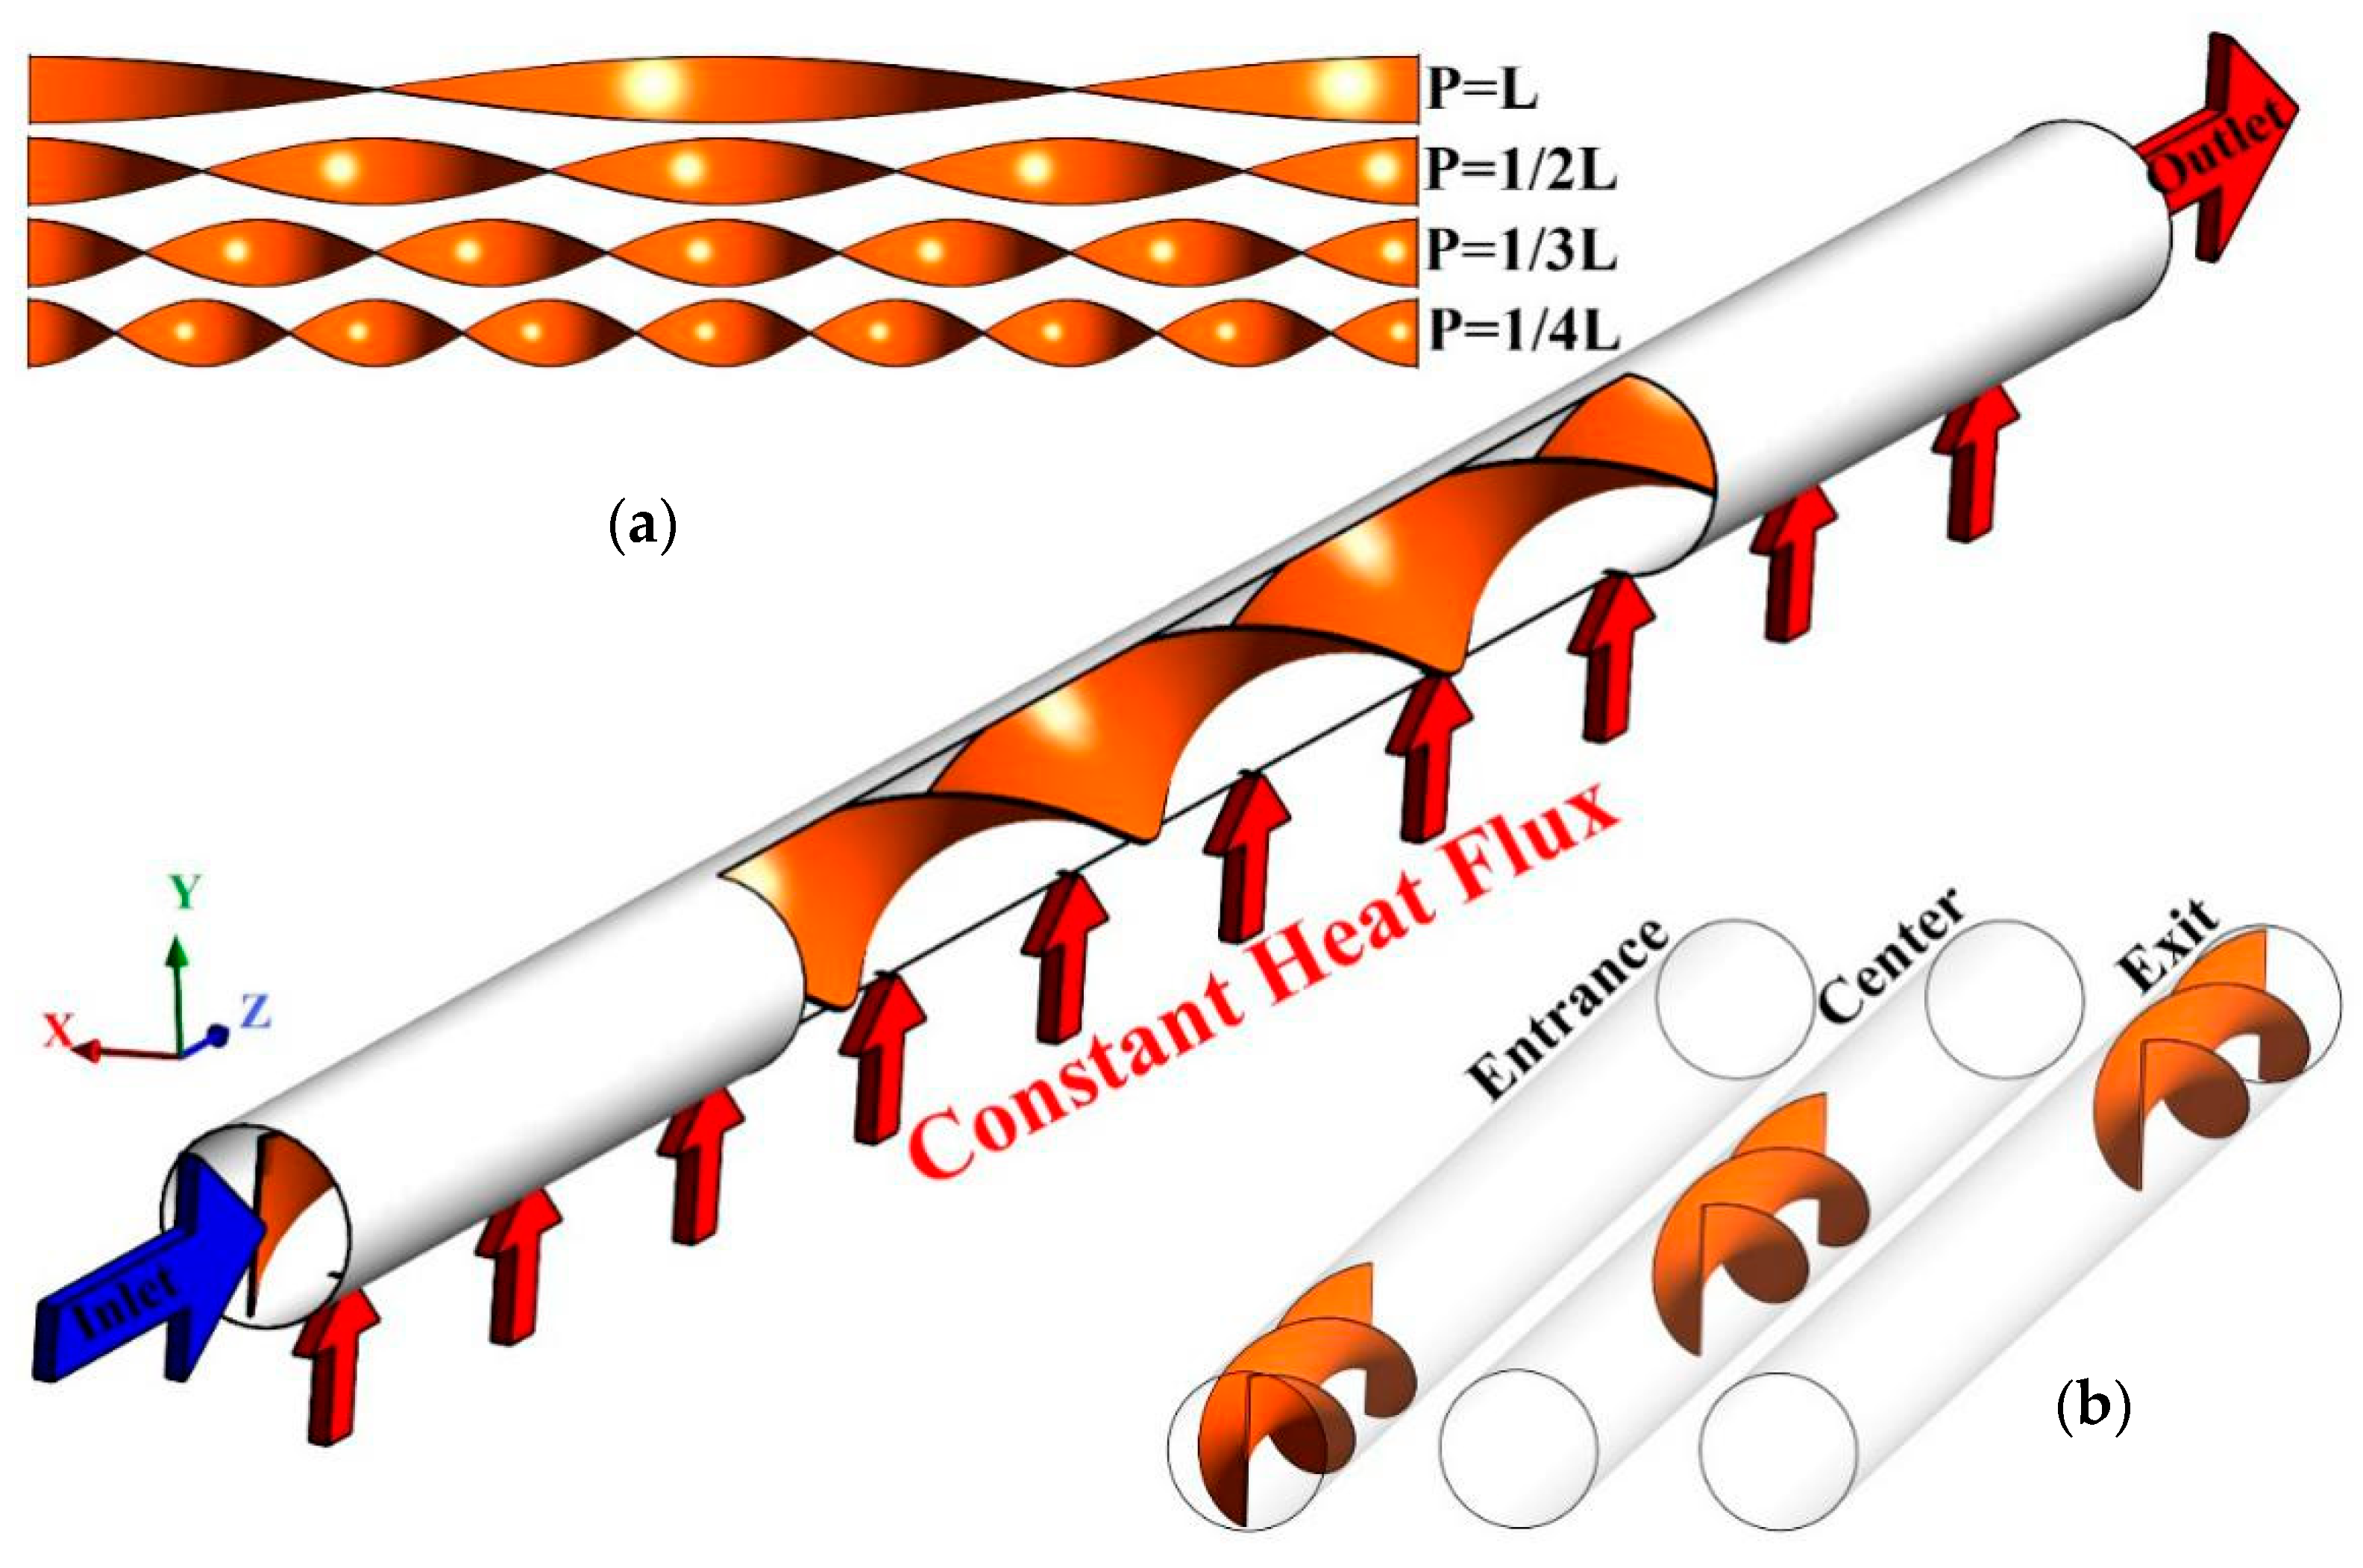
2. Problem Statement and Boundary Conditions
3. Governing Equations
4. Numerical Procedure
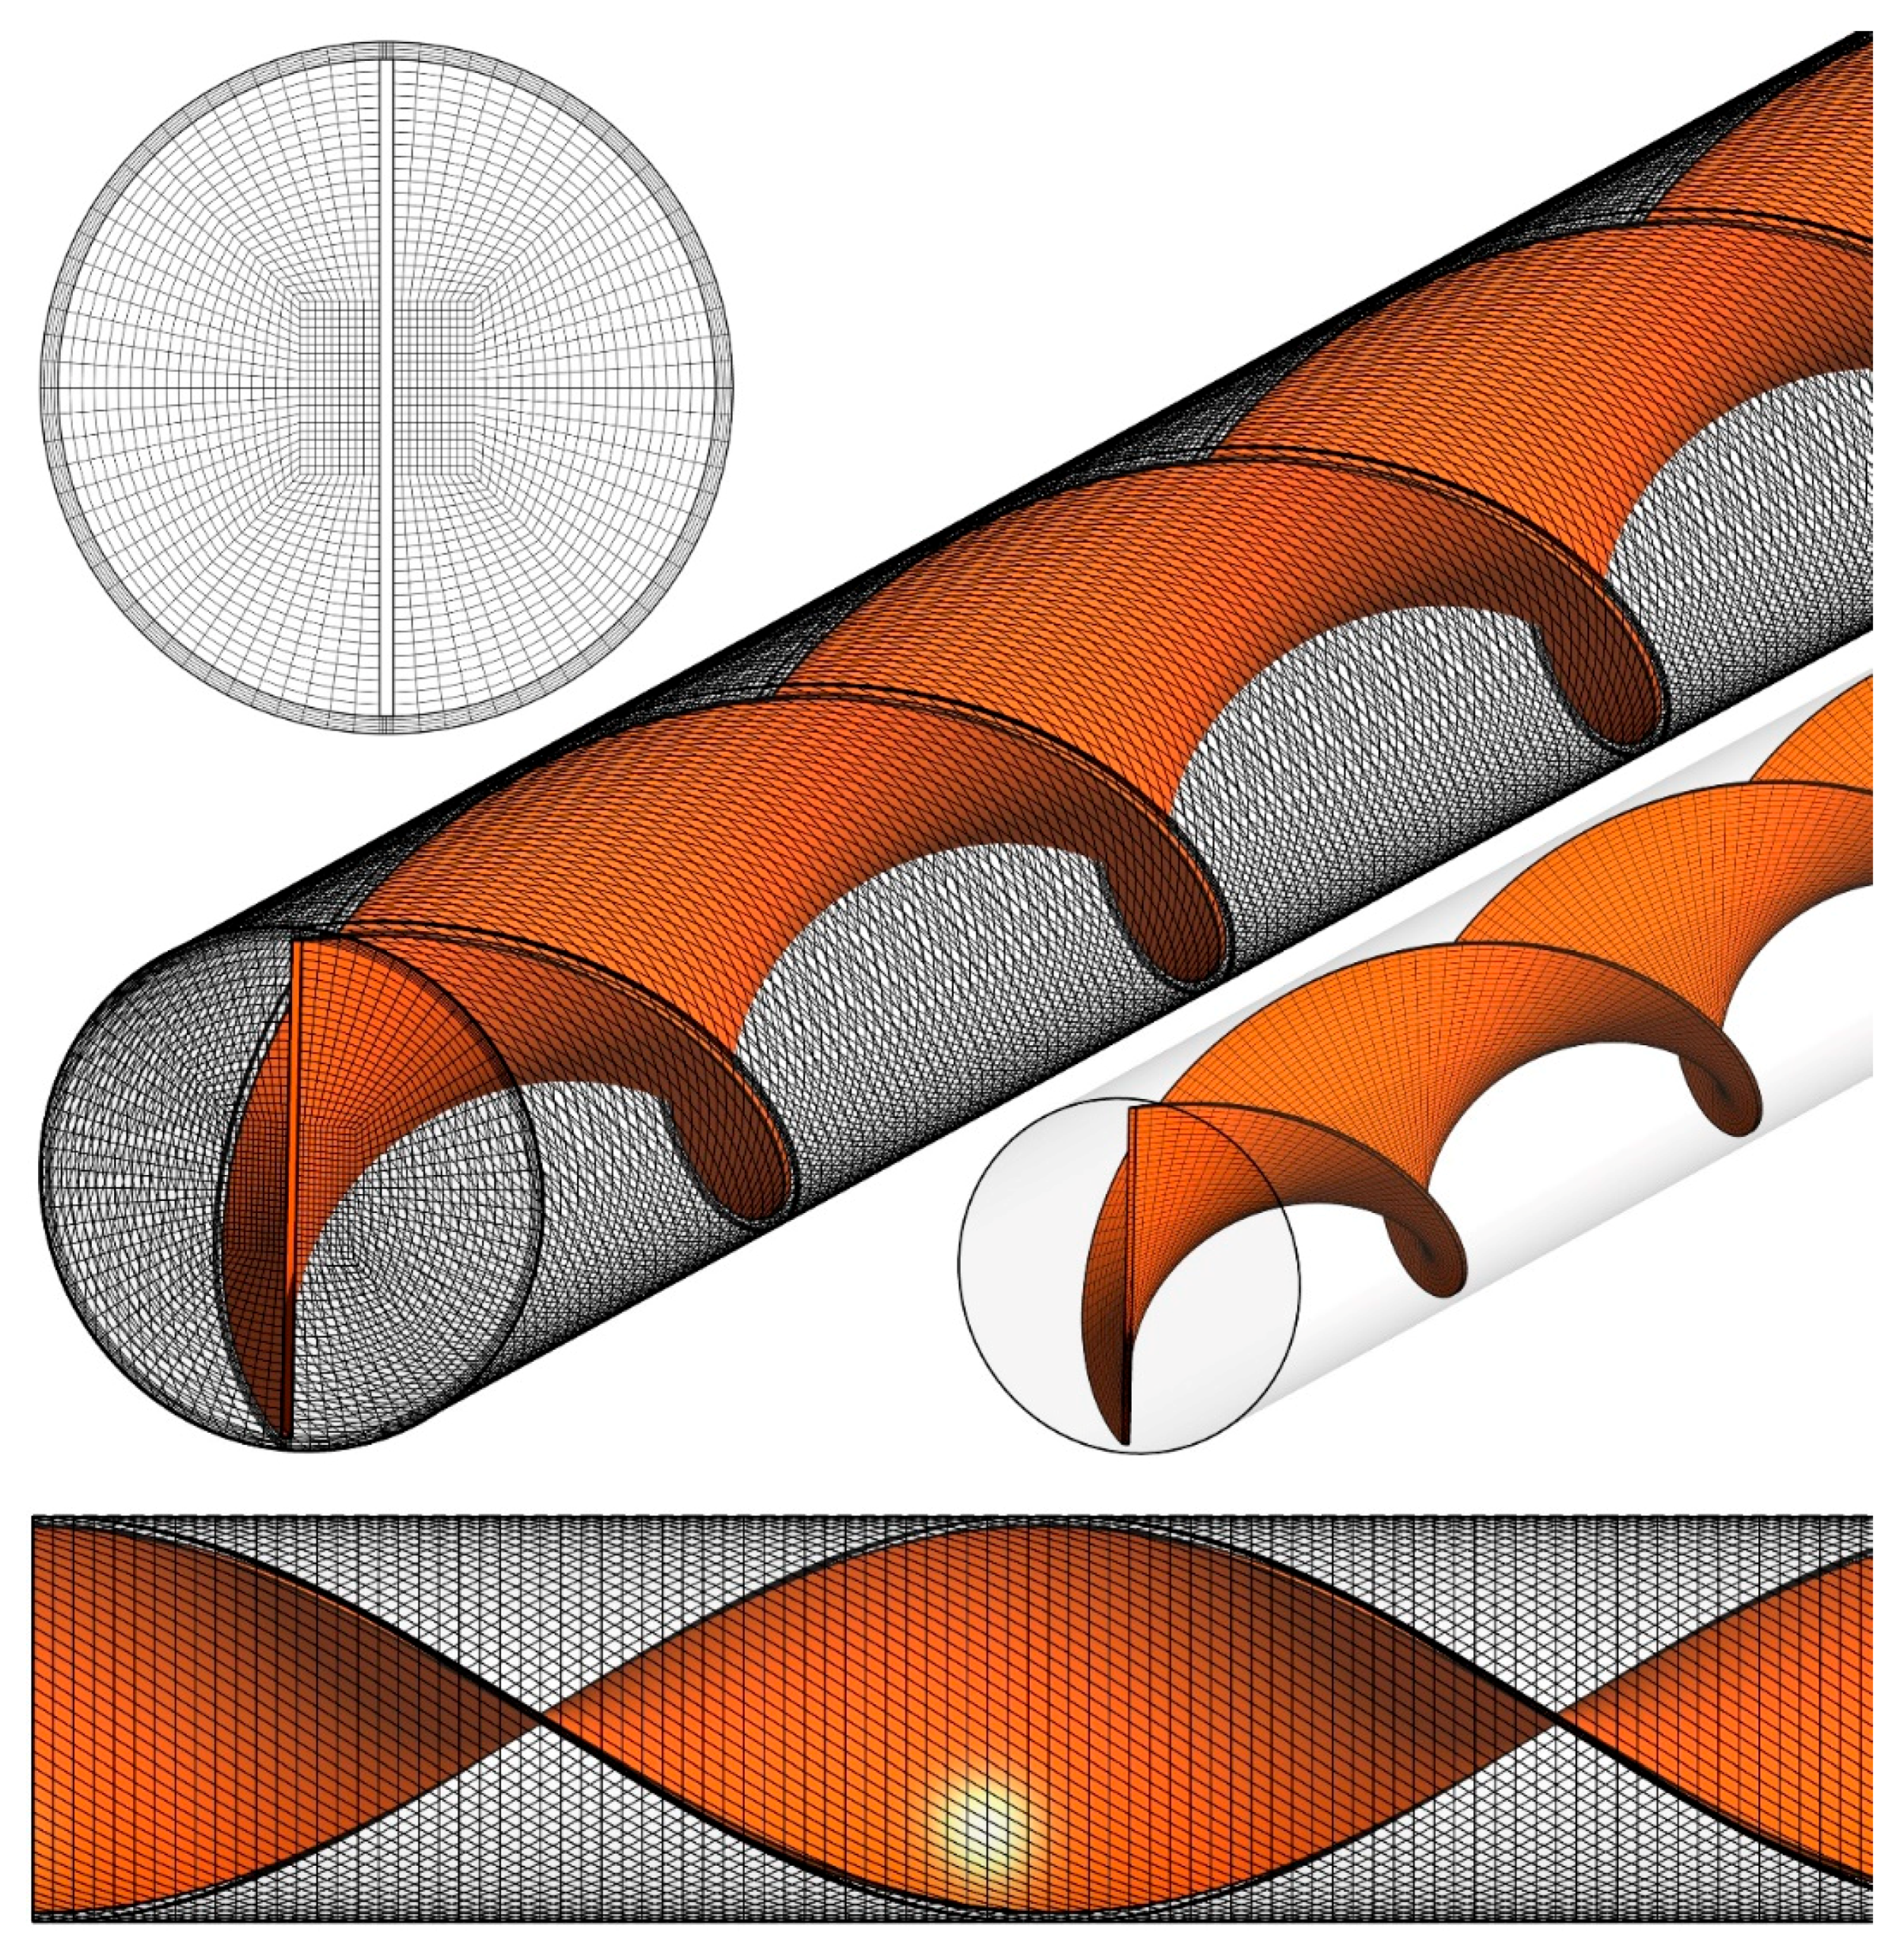
4.1. Grid Study
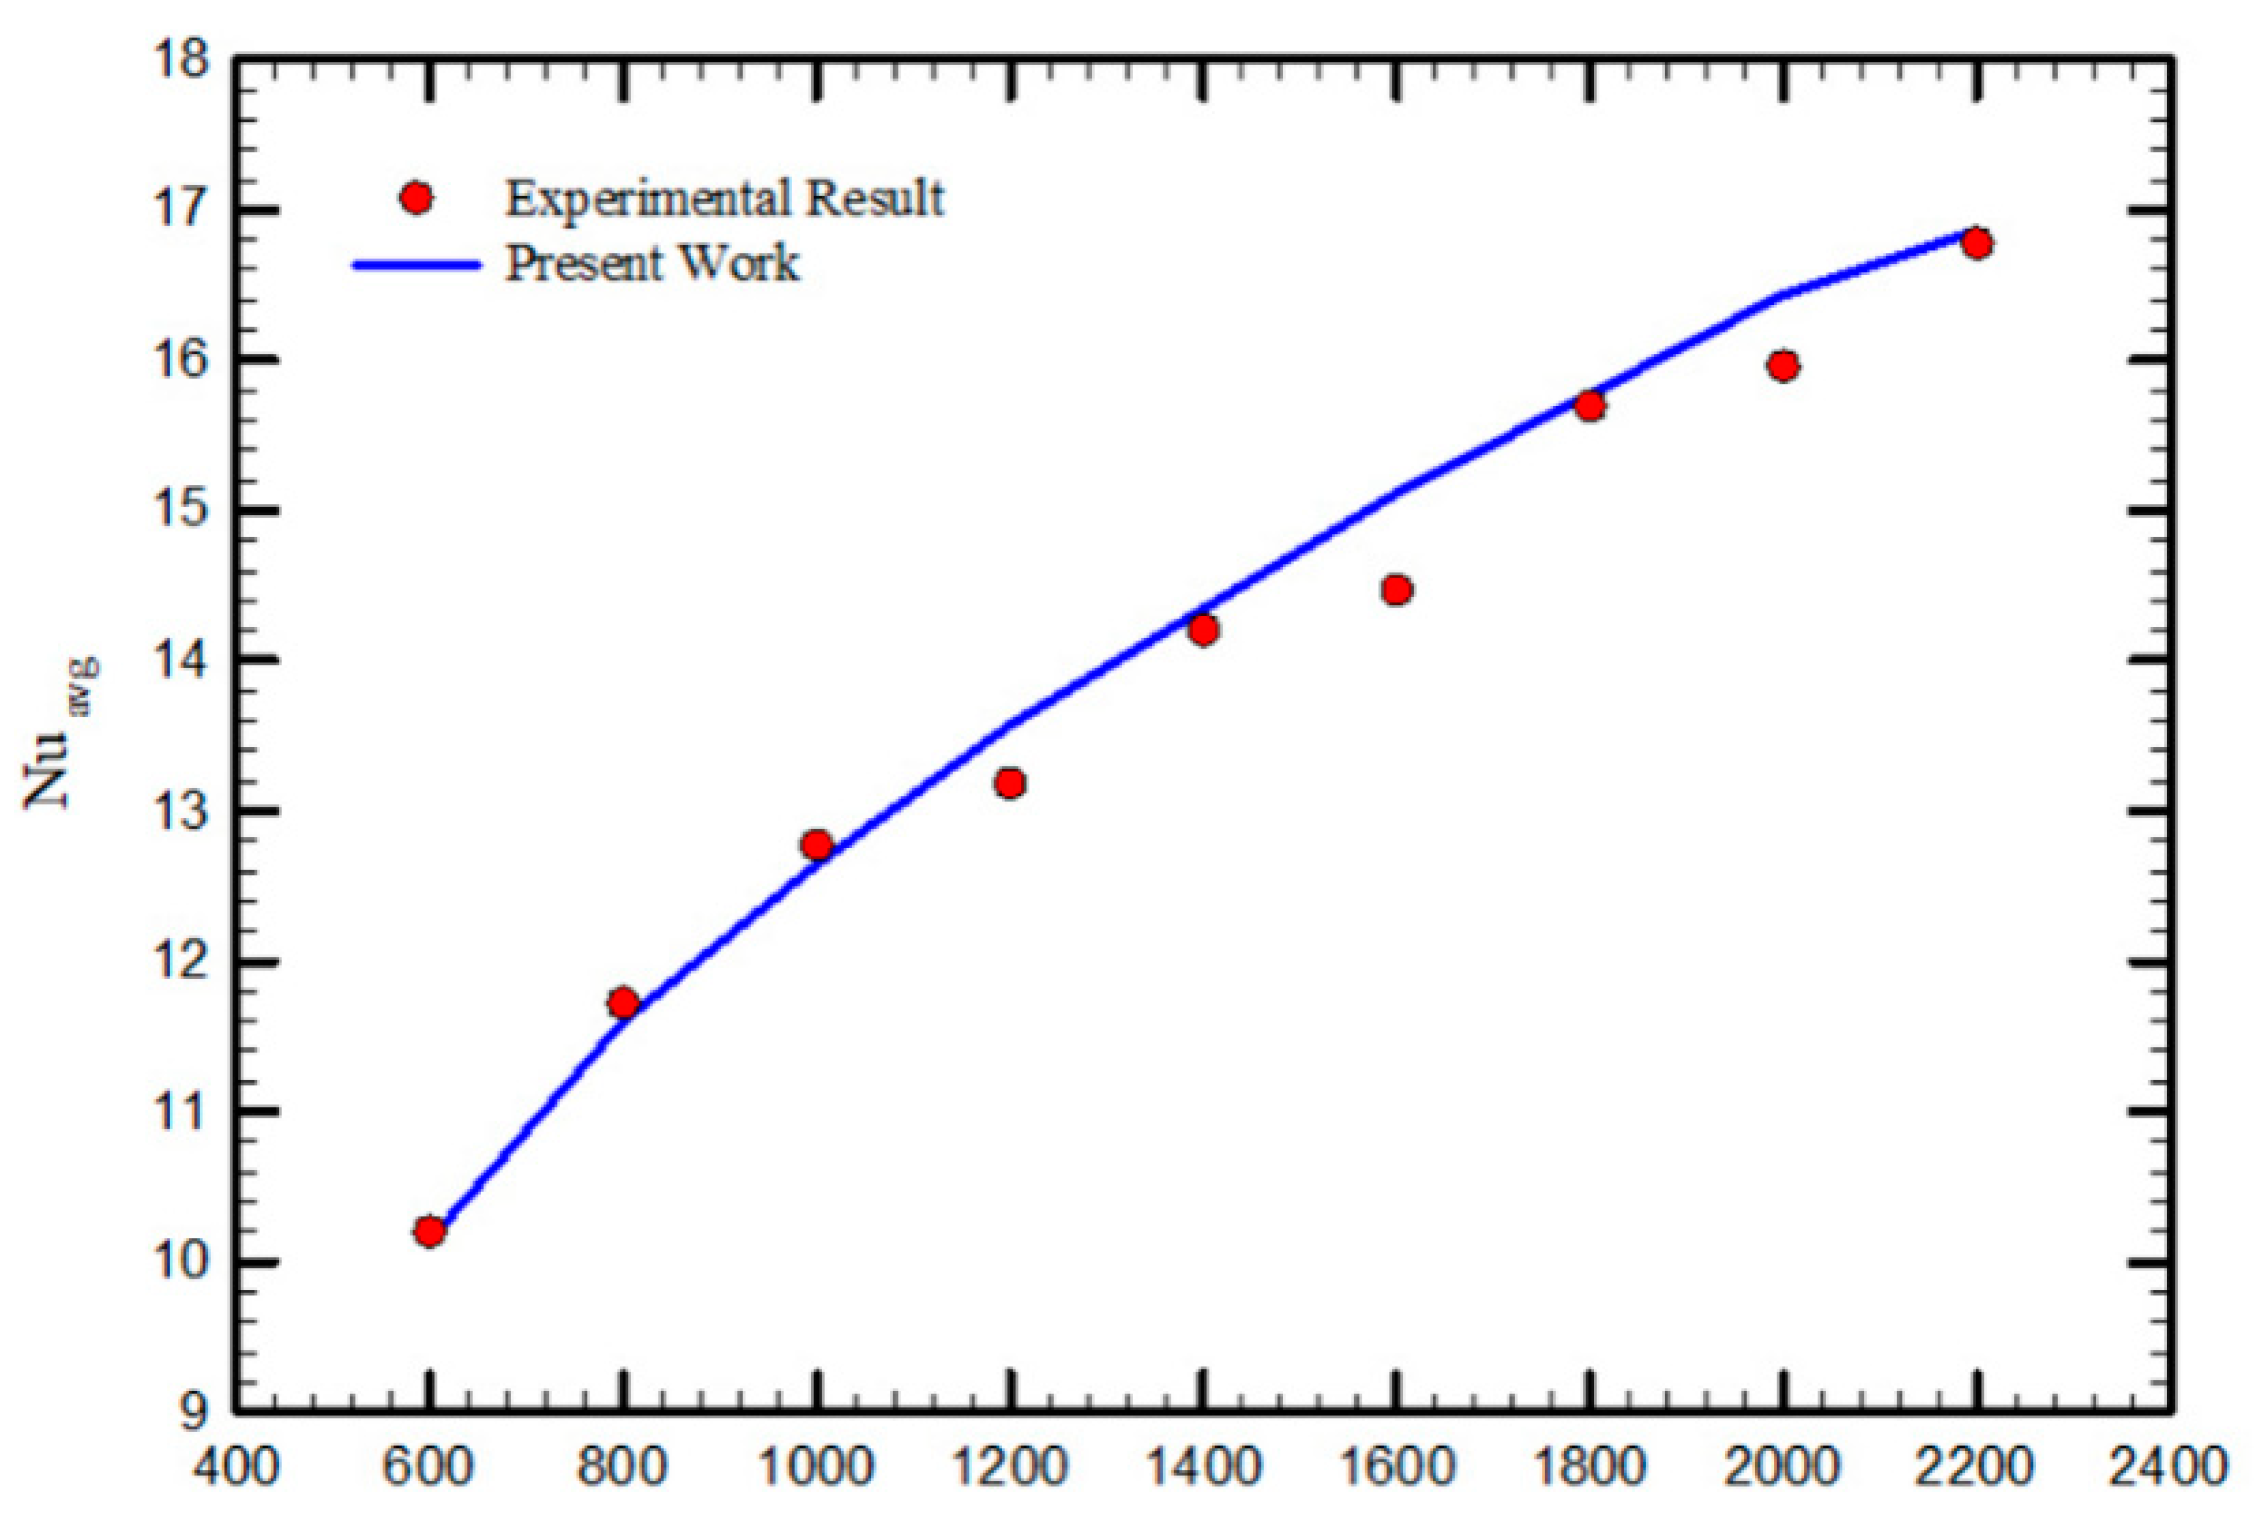
4.2. Validation
5. Results and Discussion
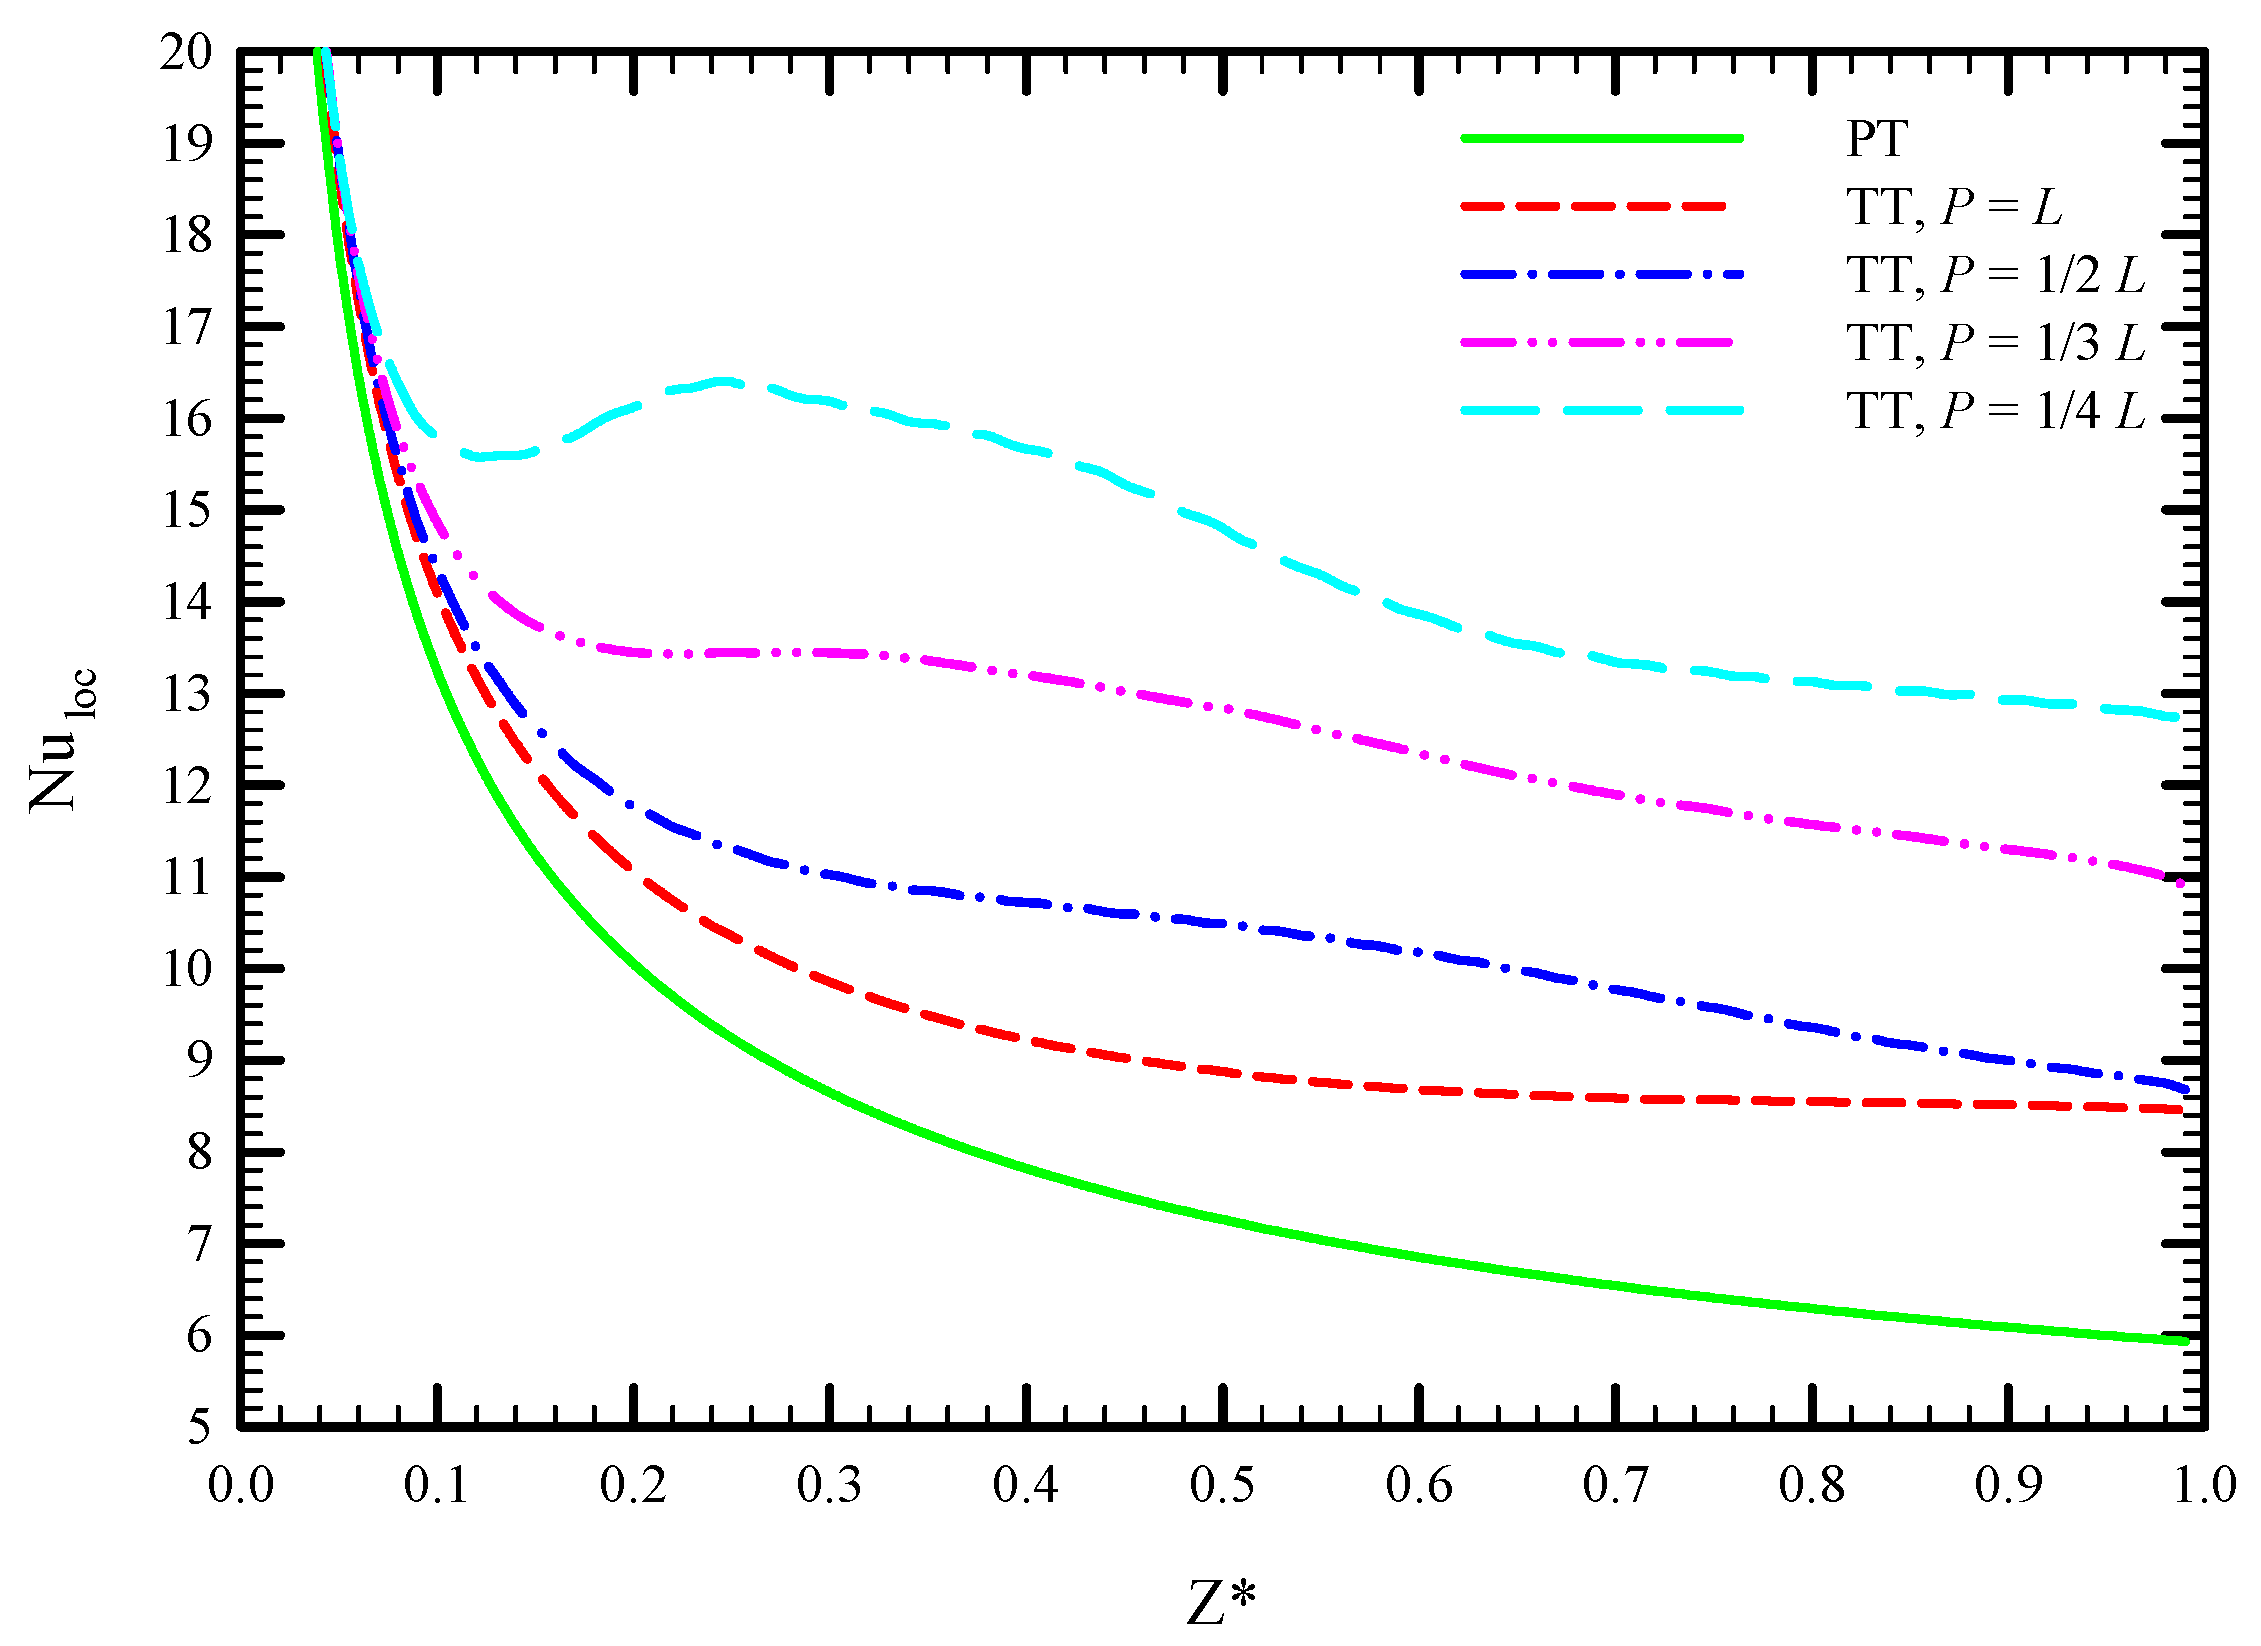
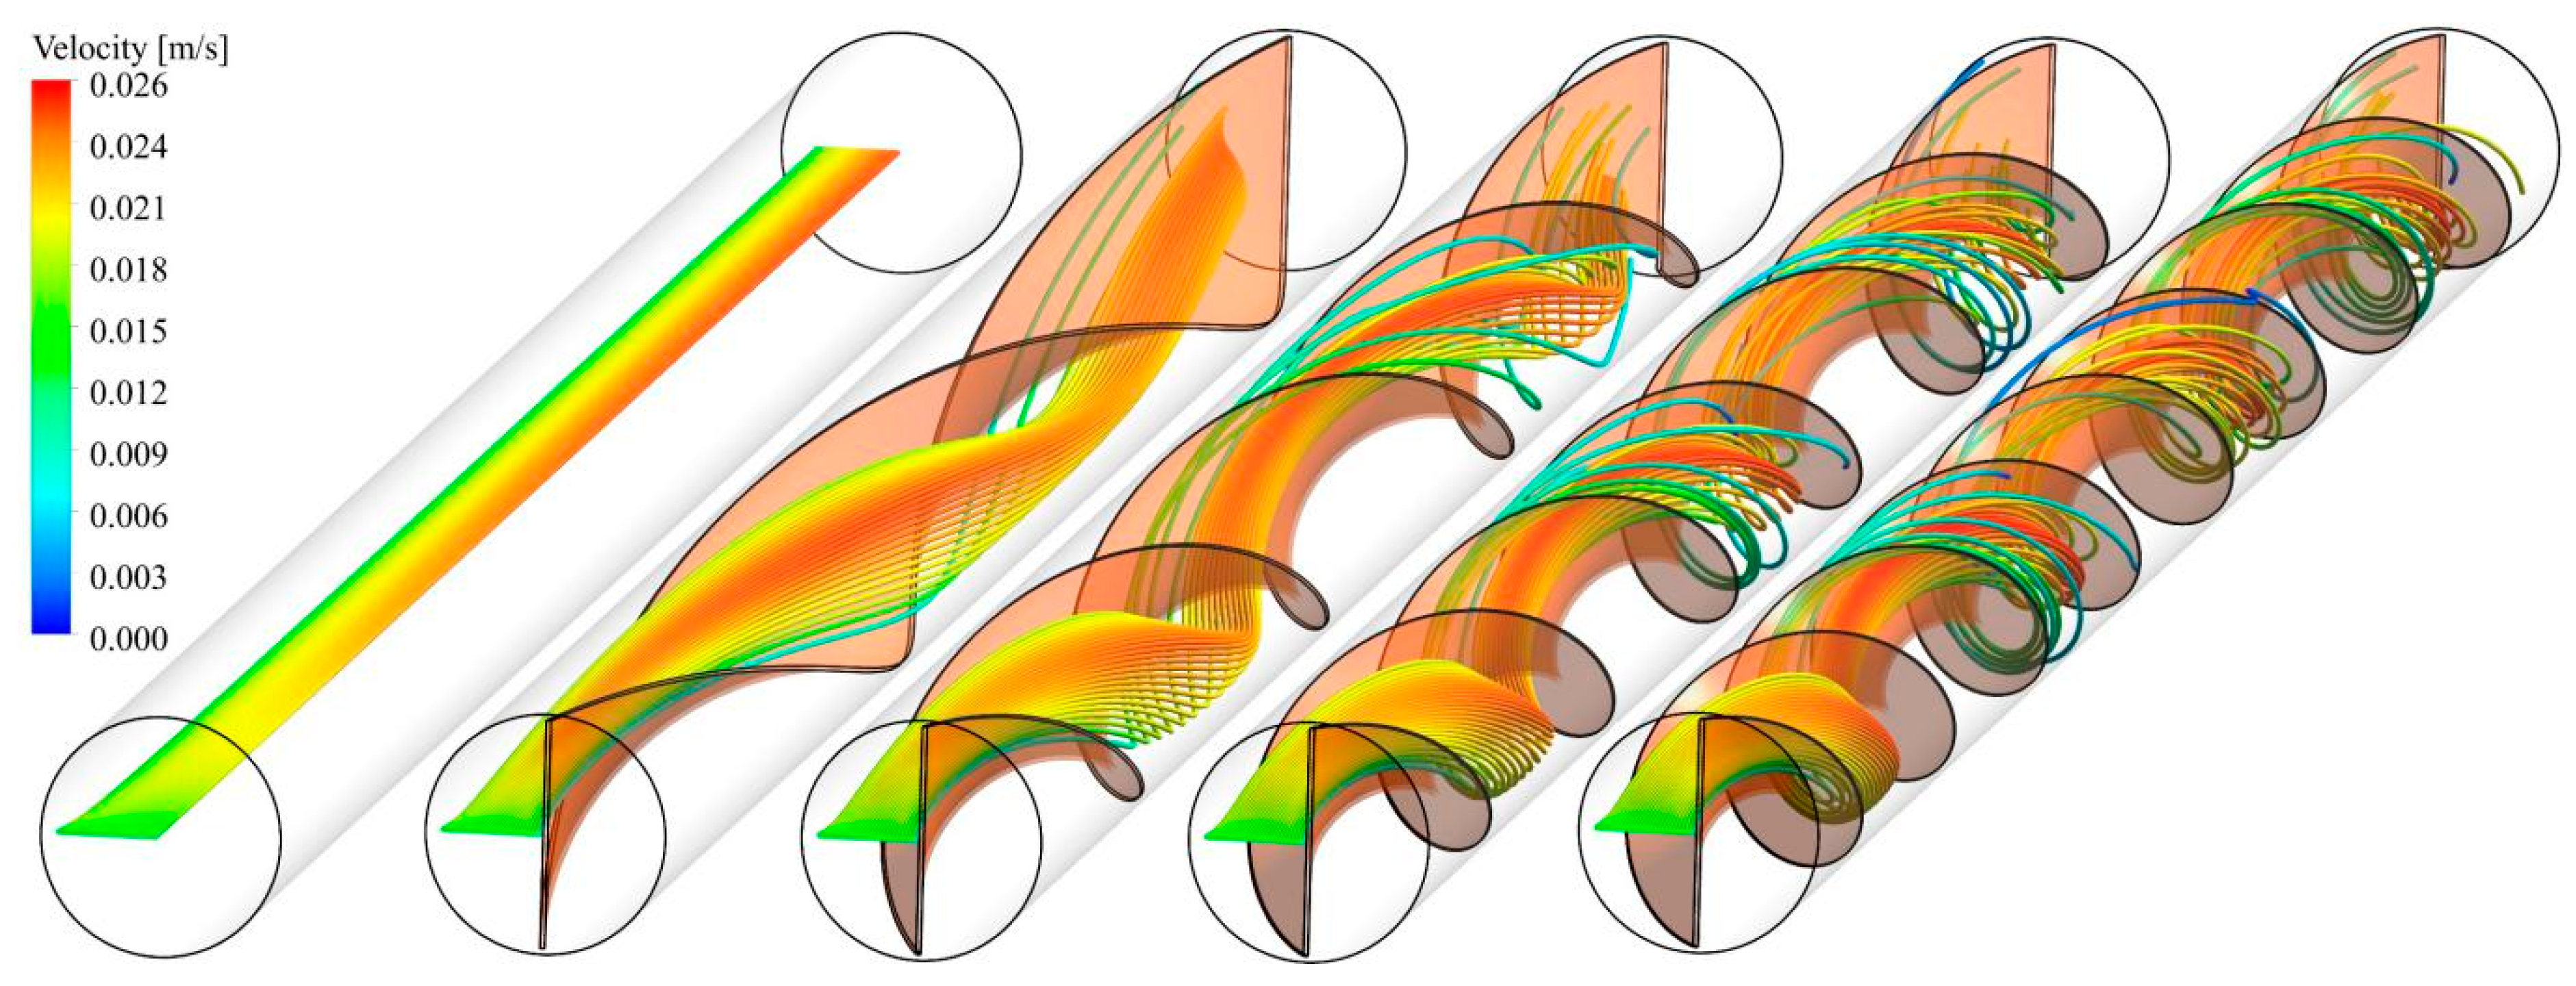
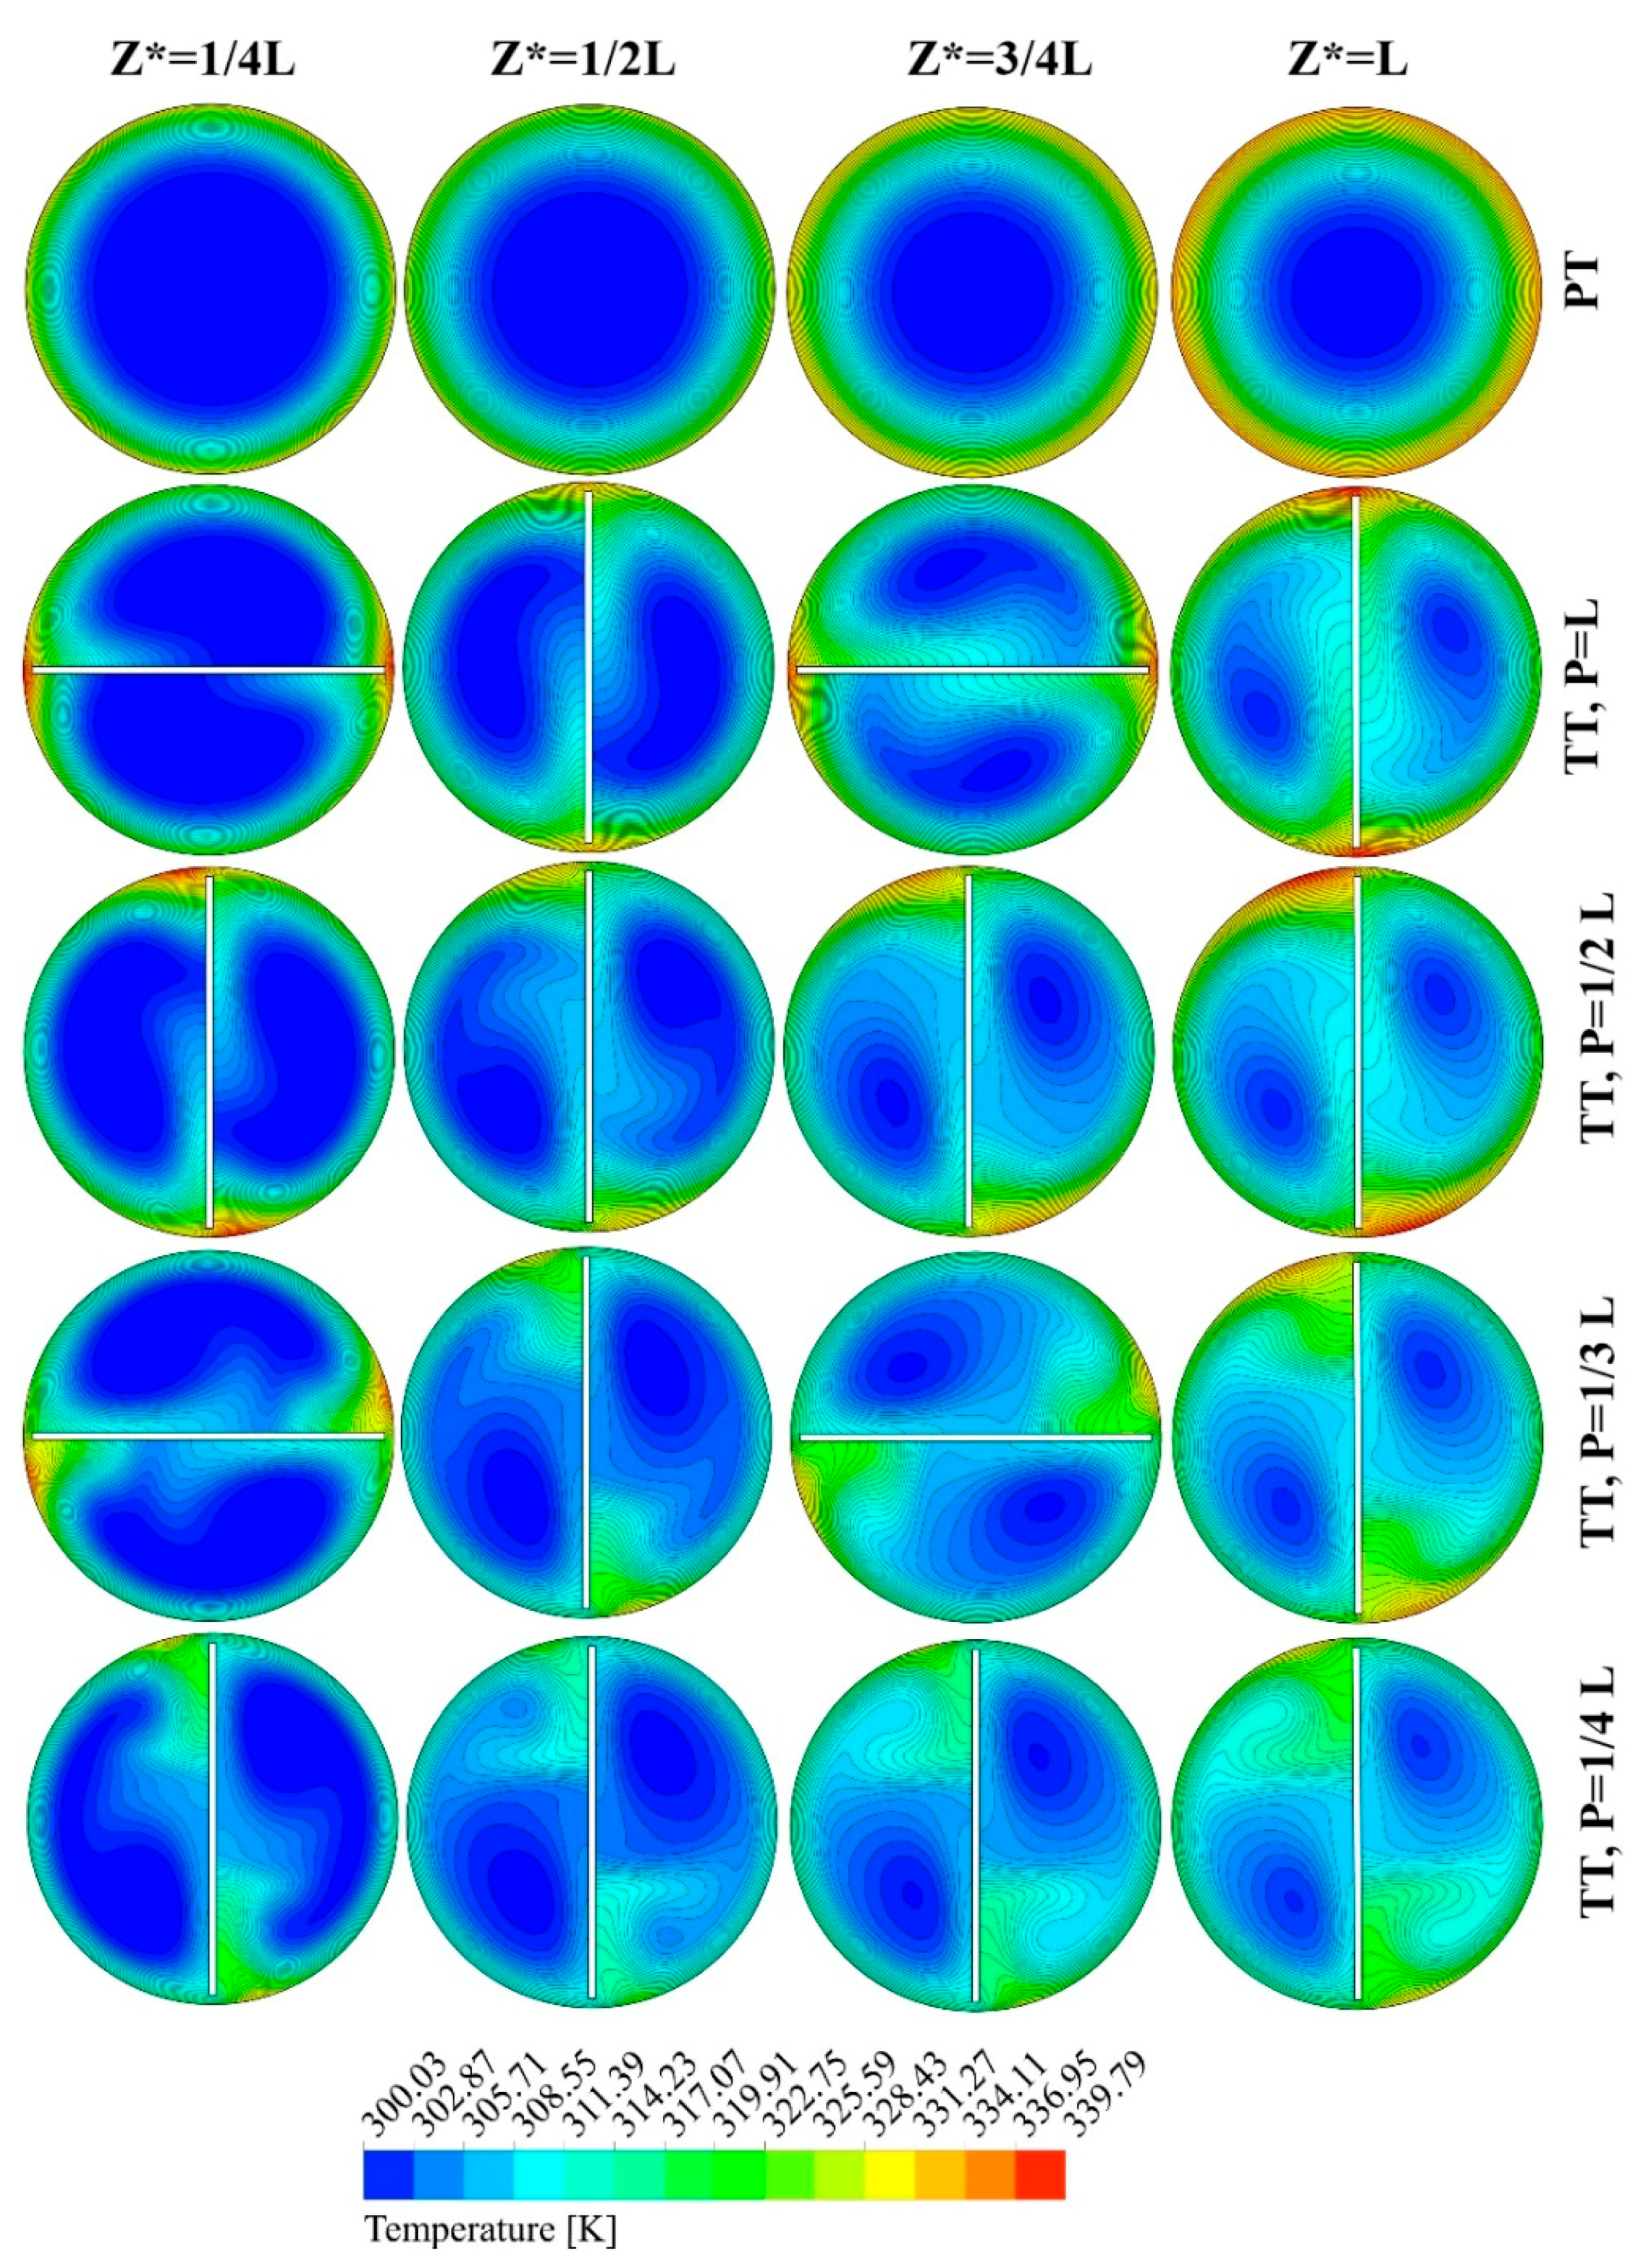
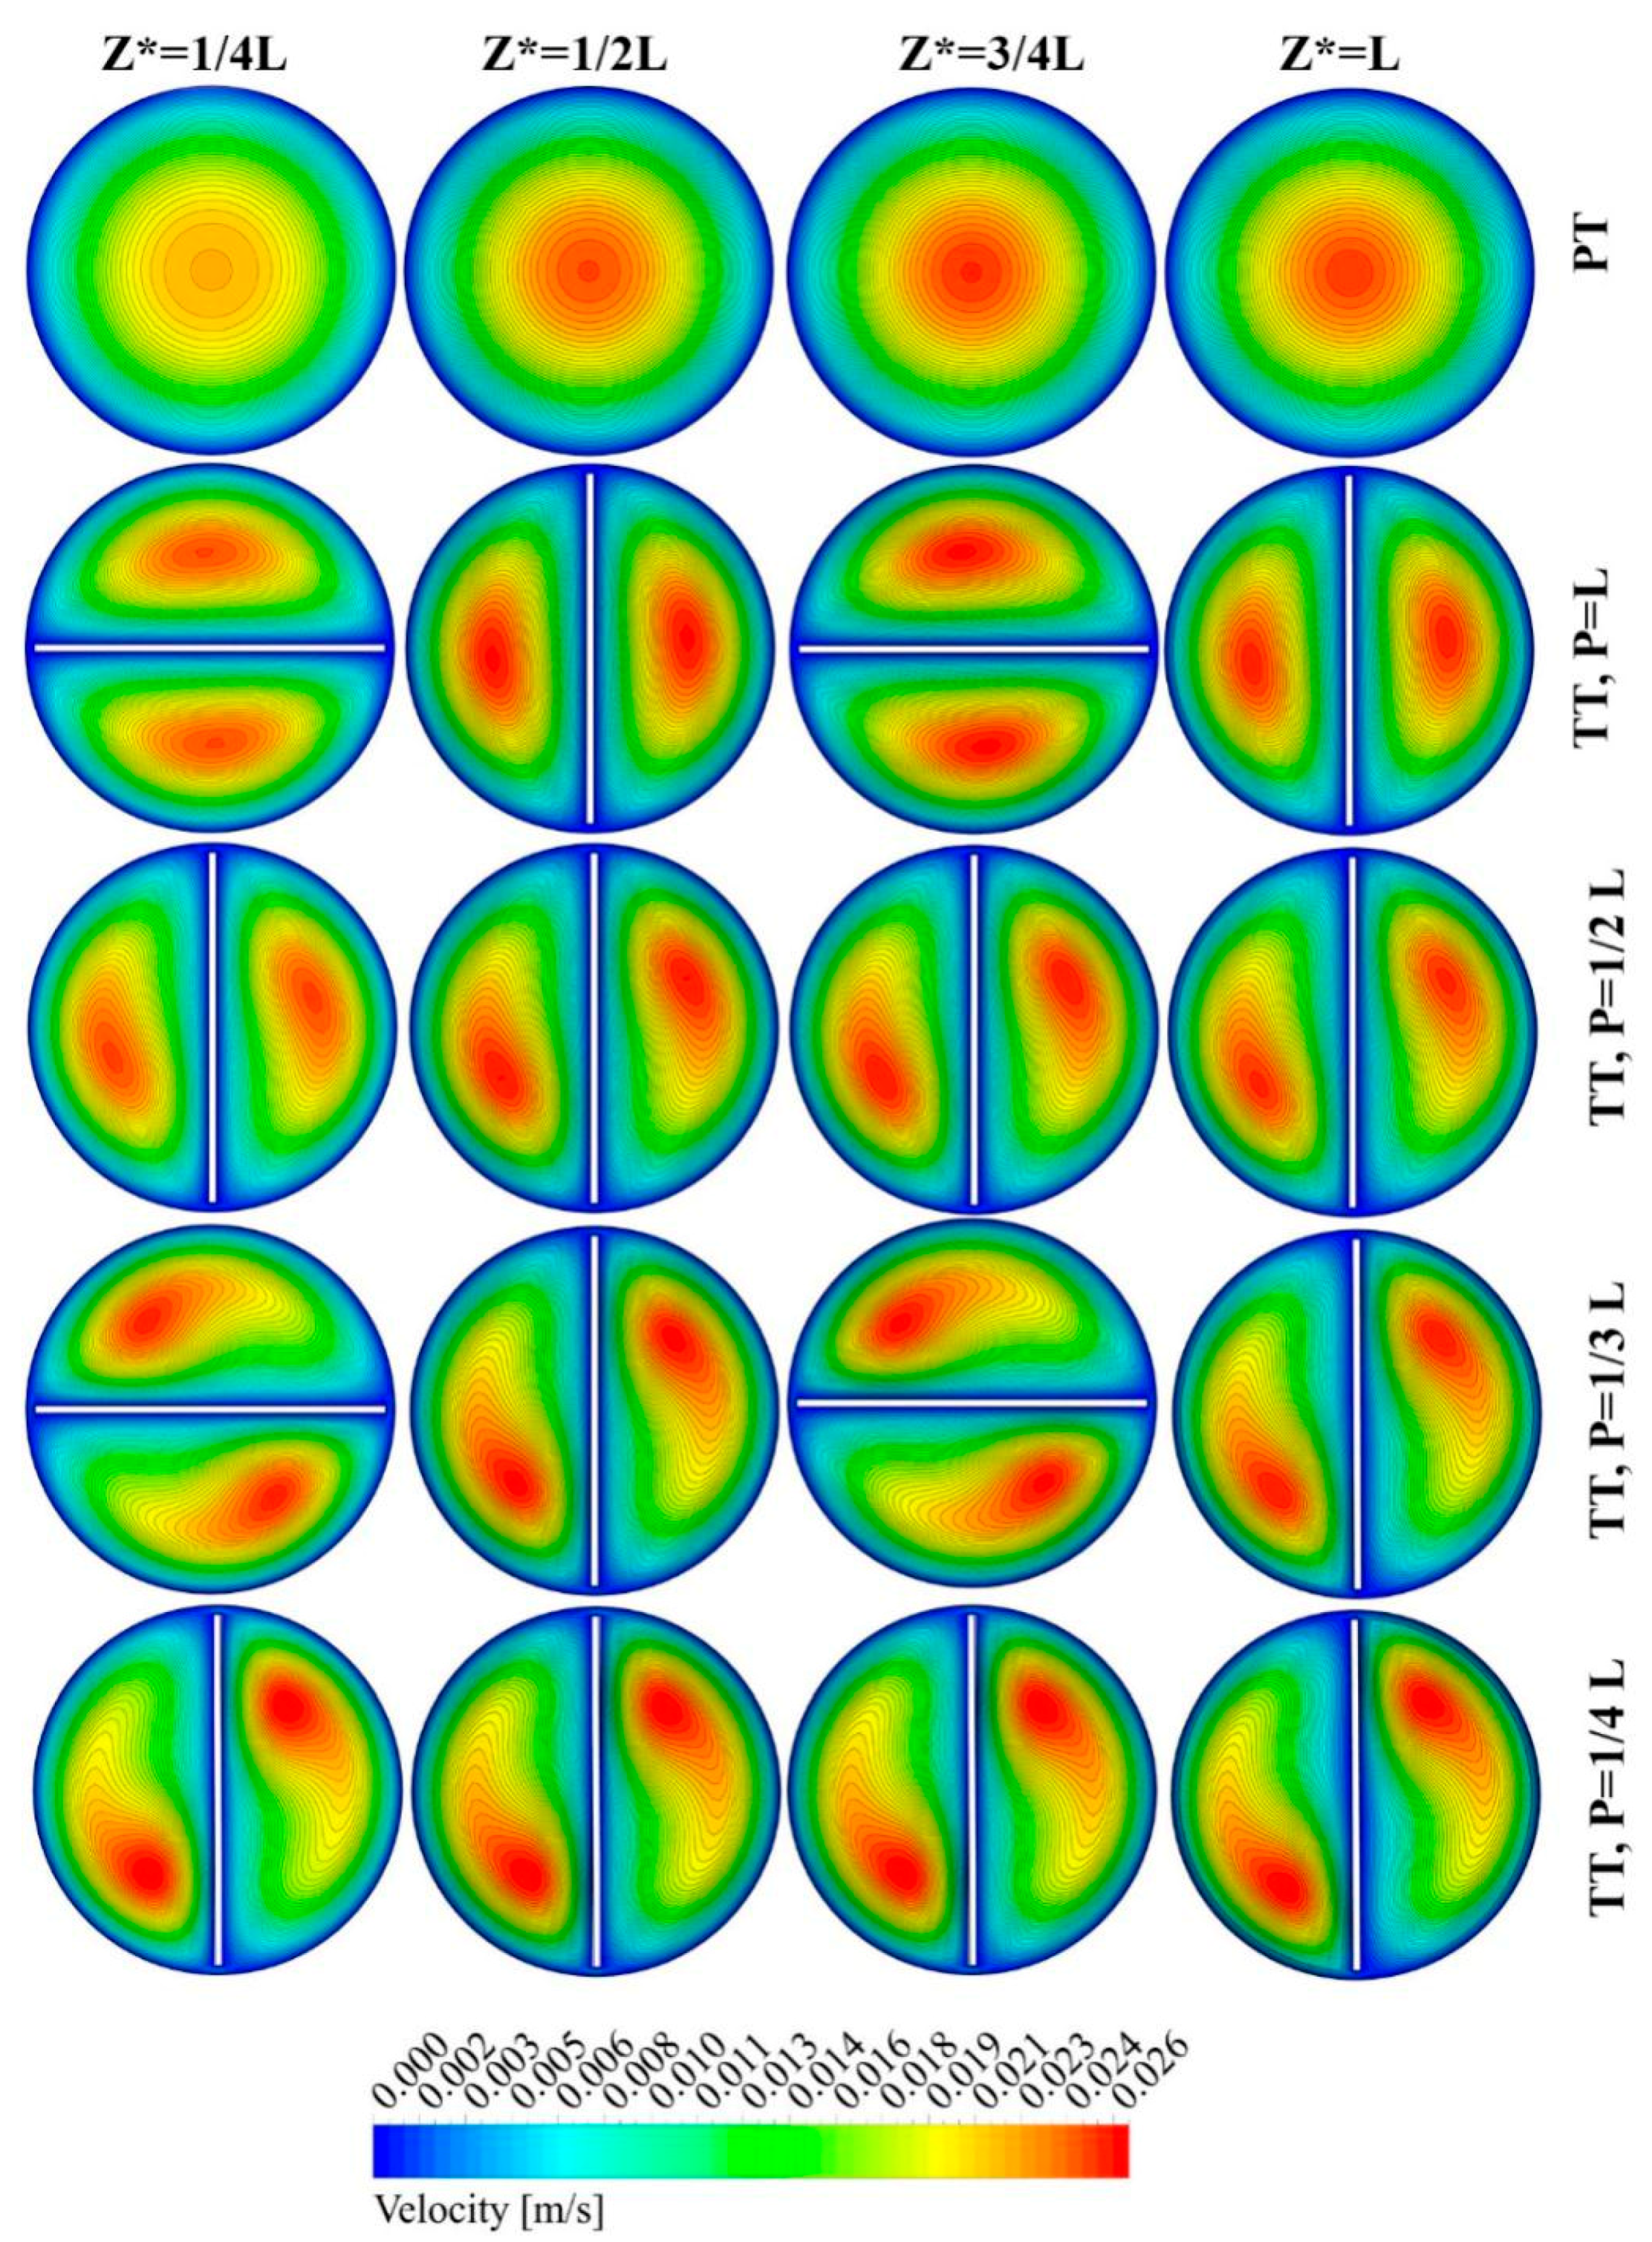
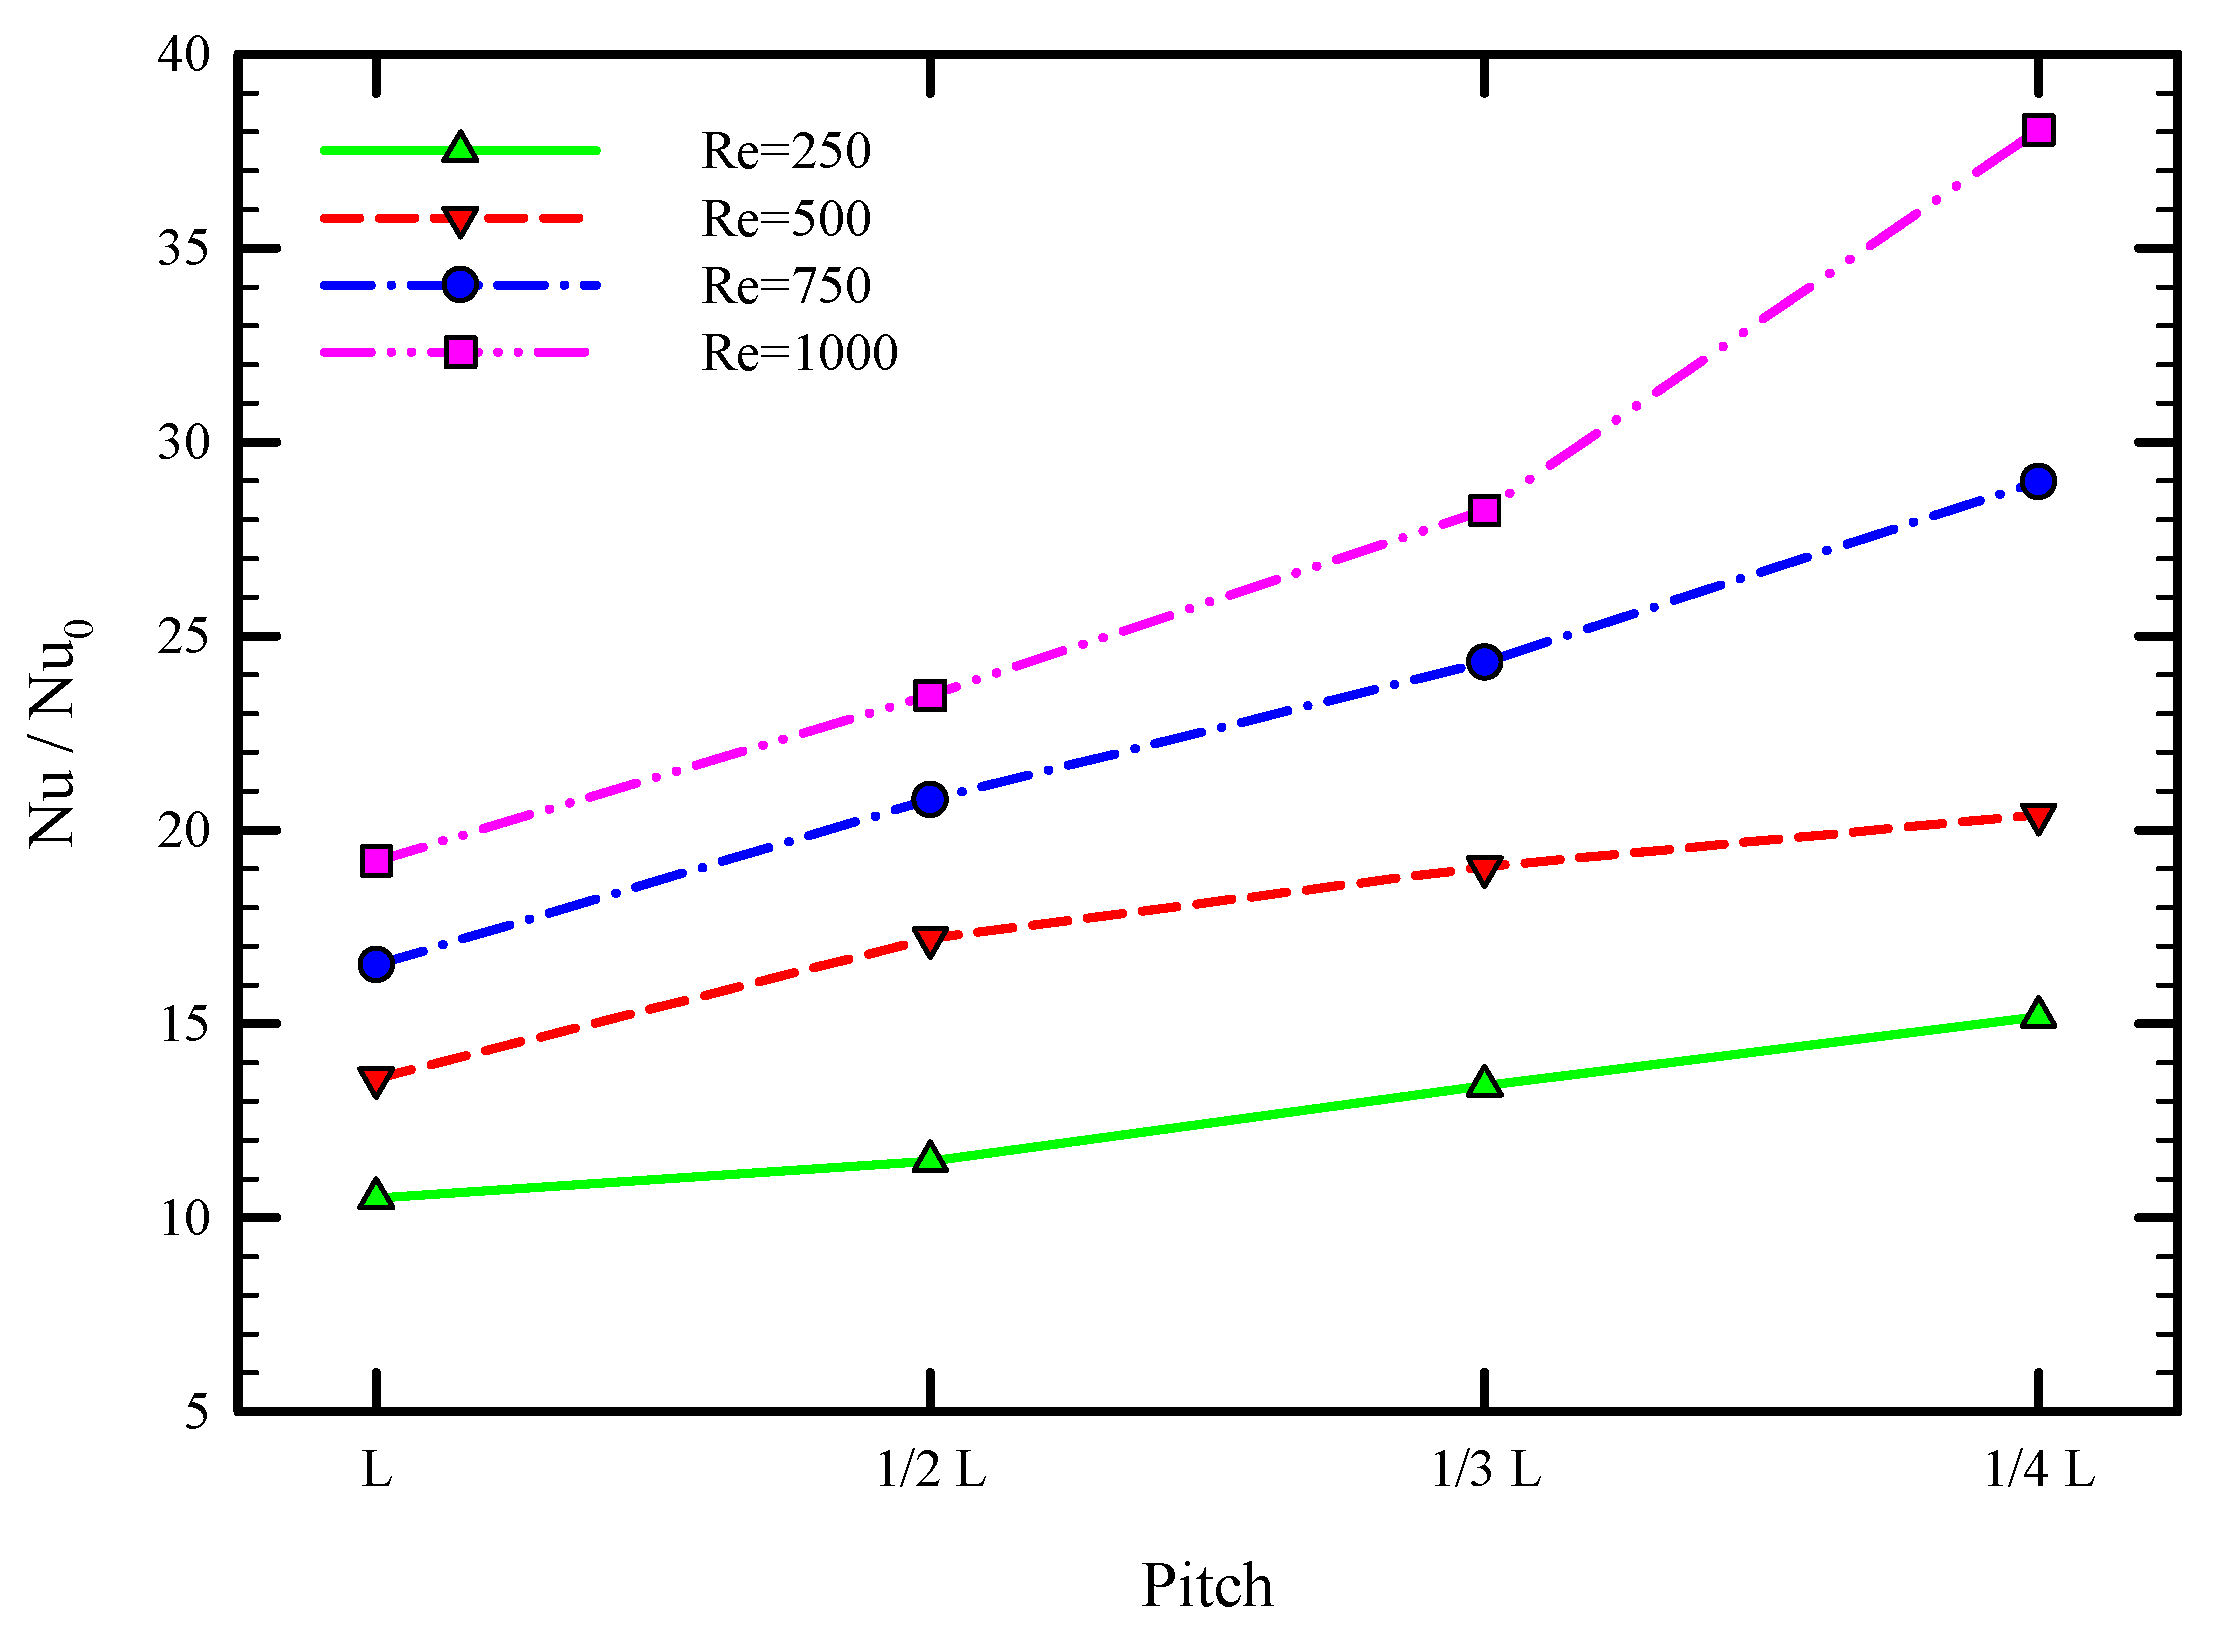
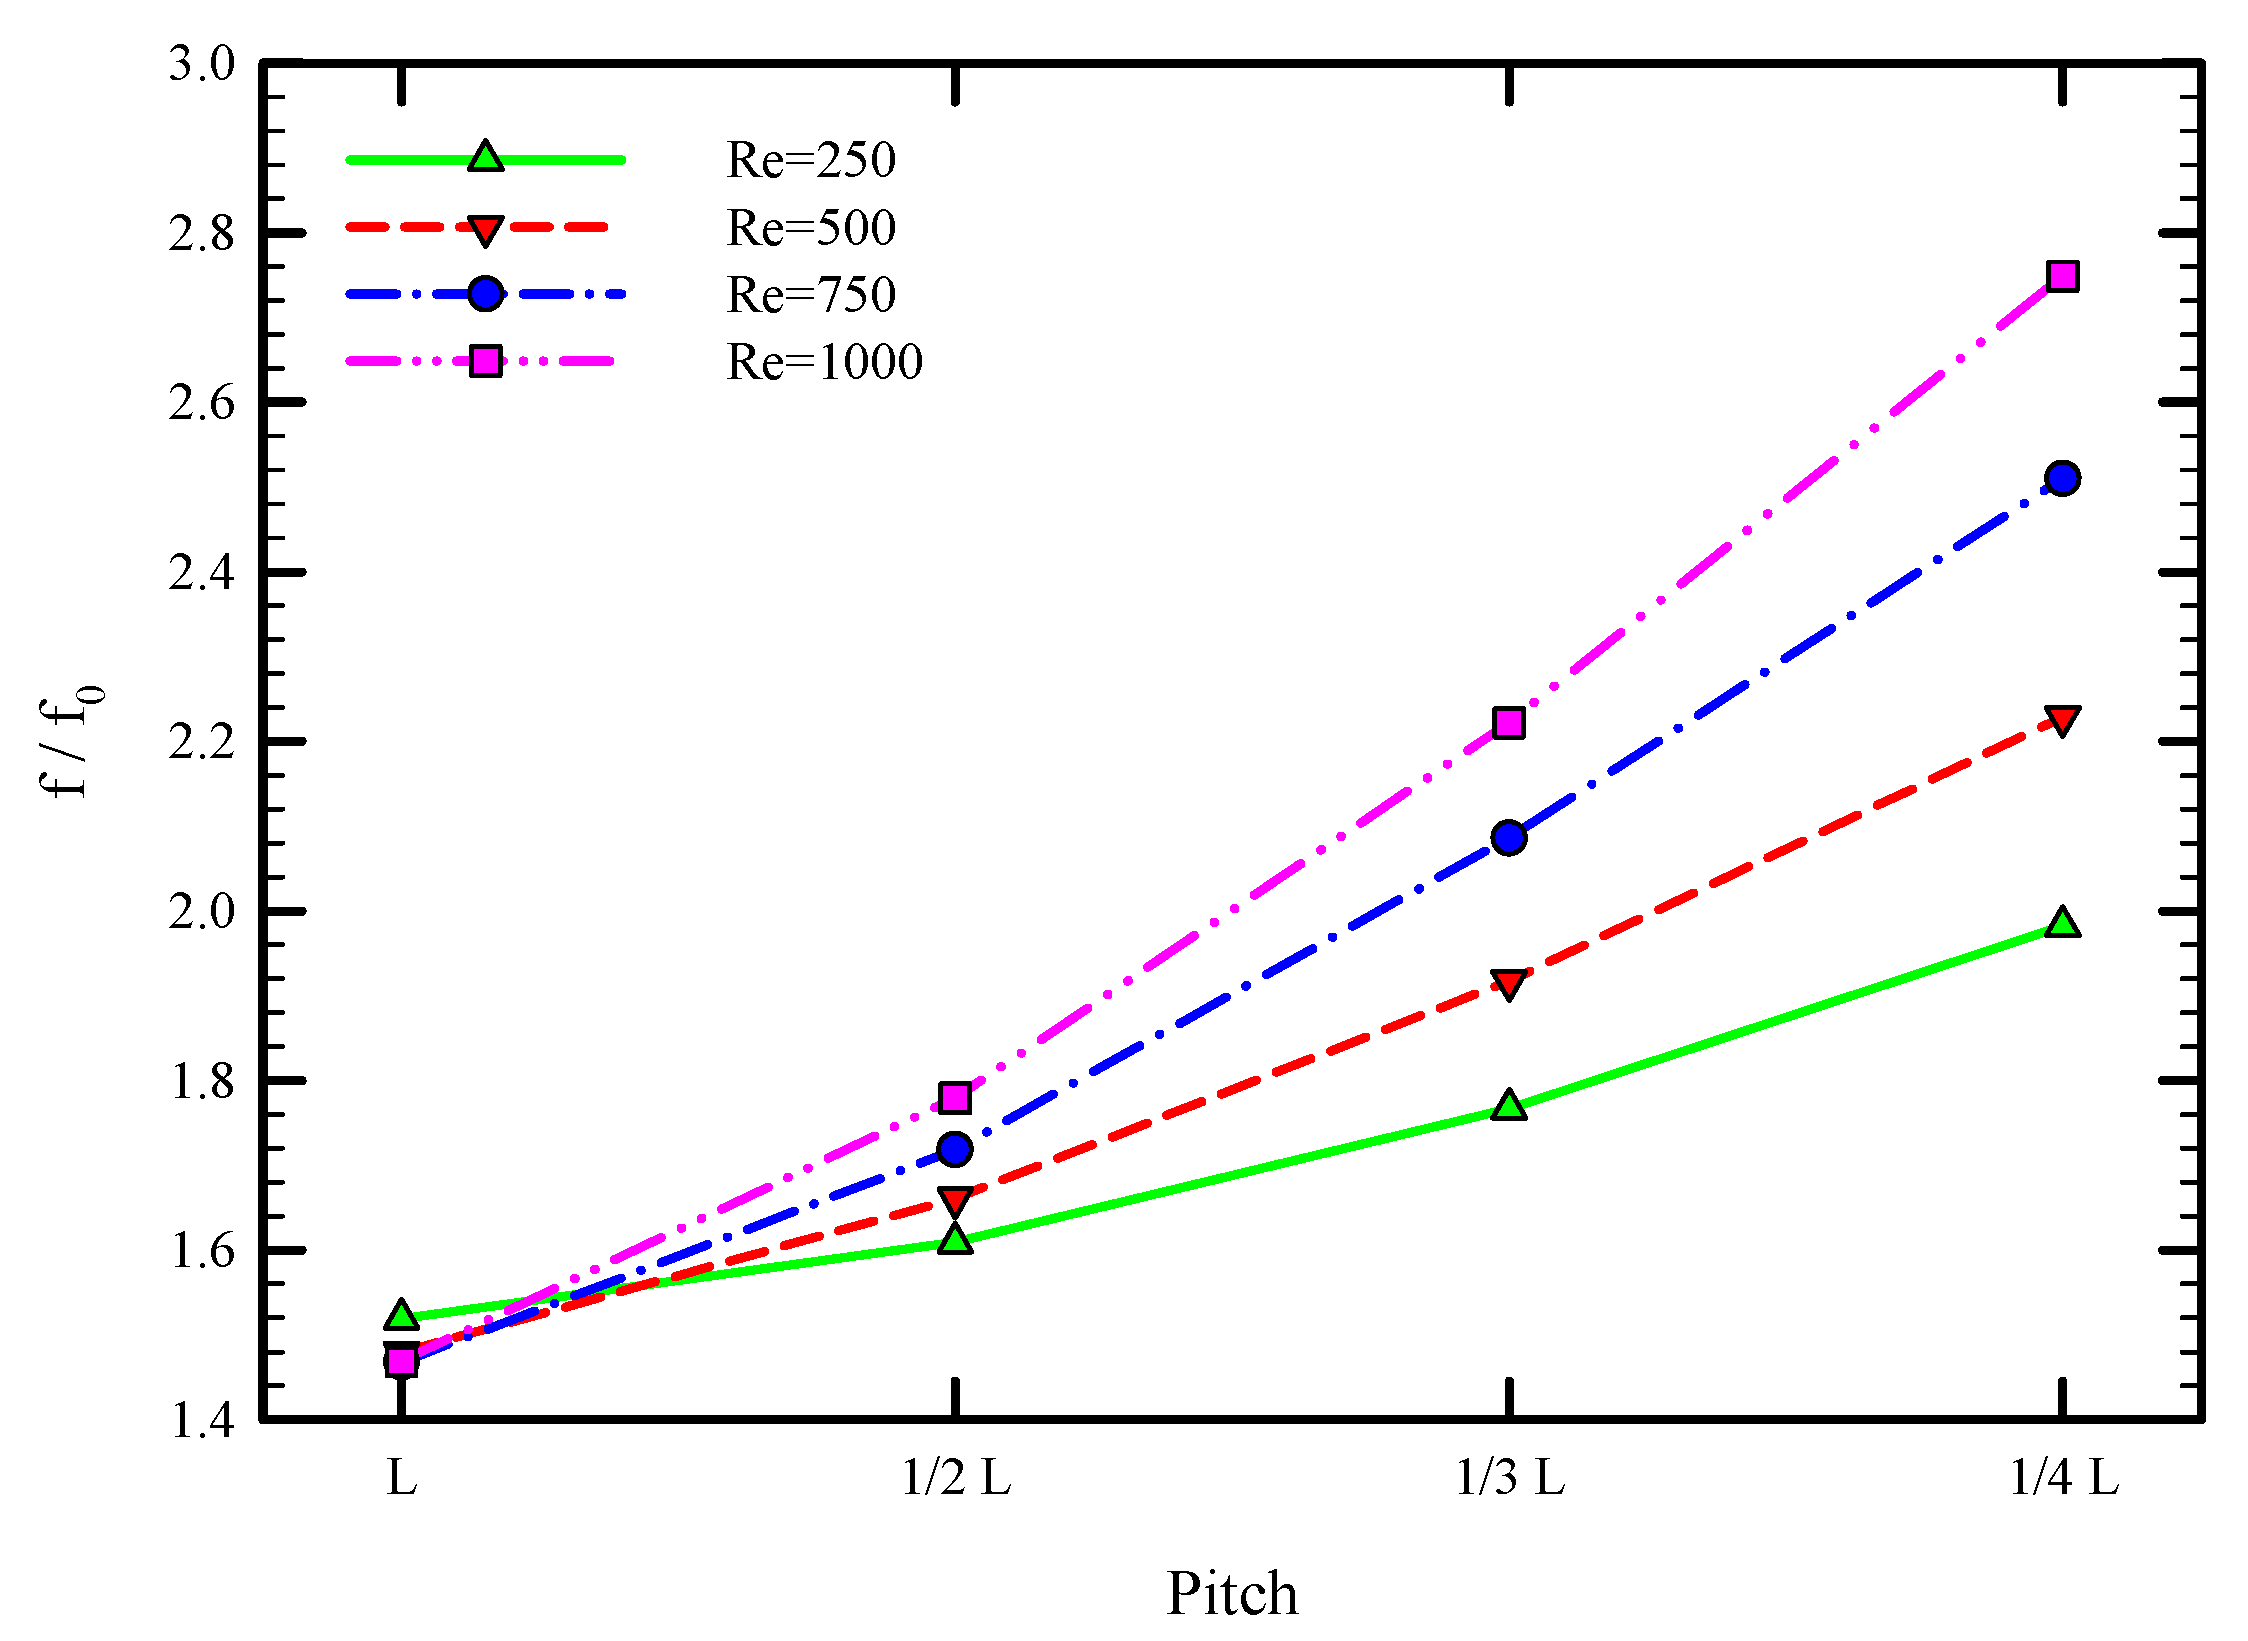
5.1. Effect of Twisted Tape Pitch
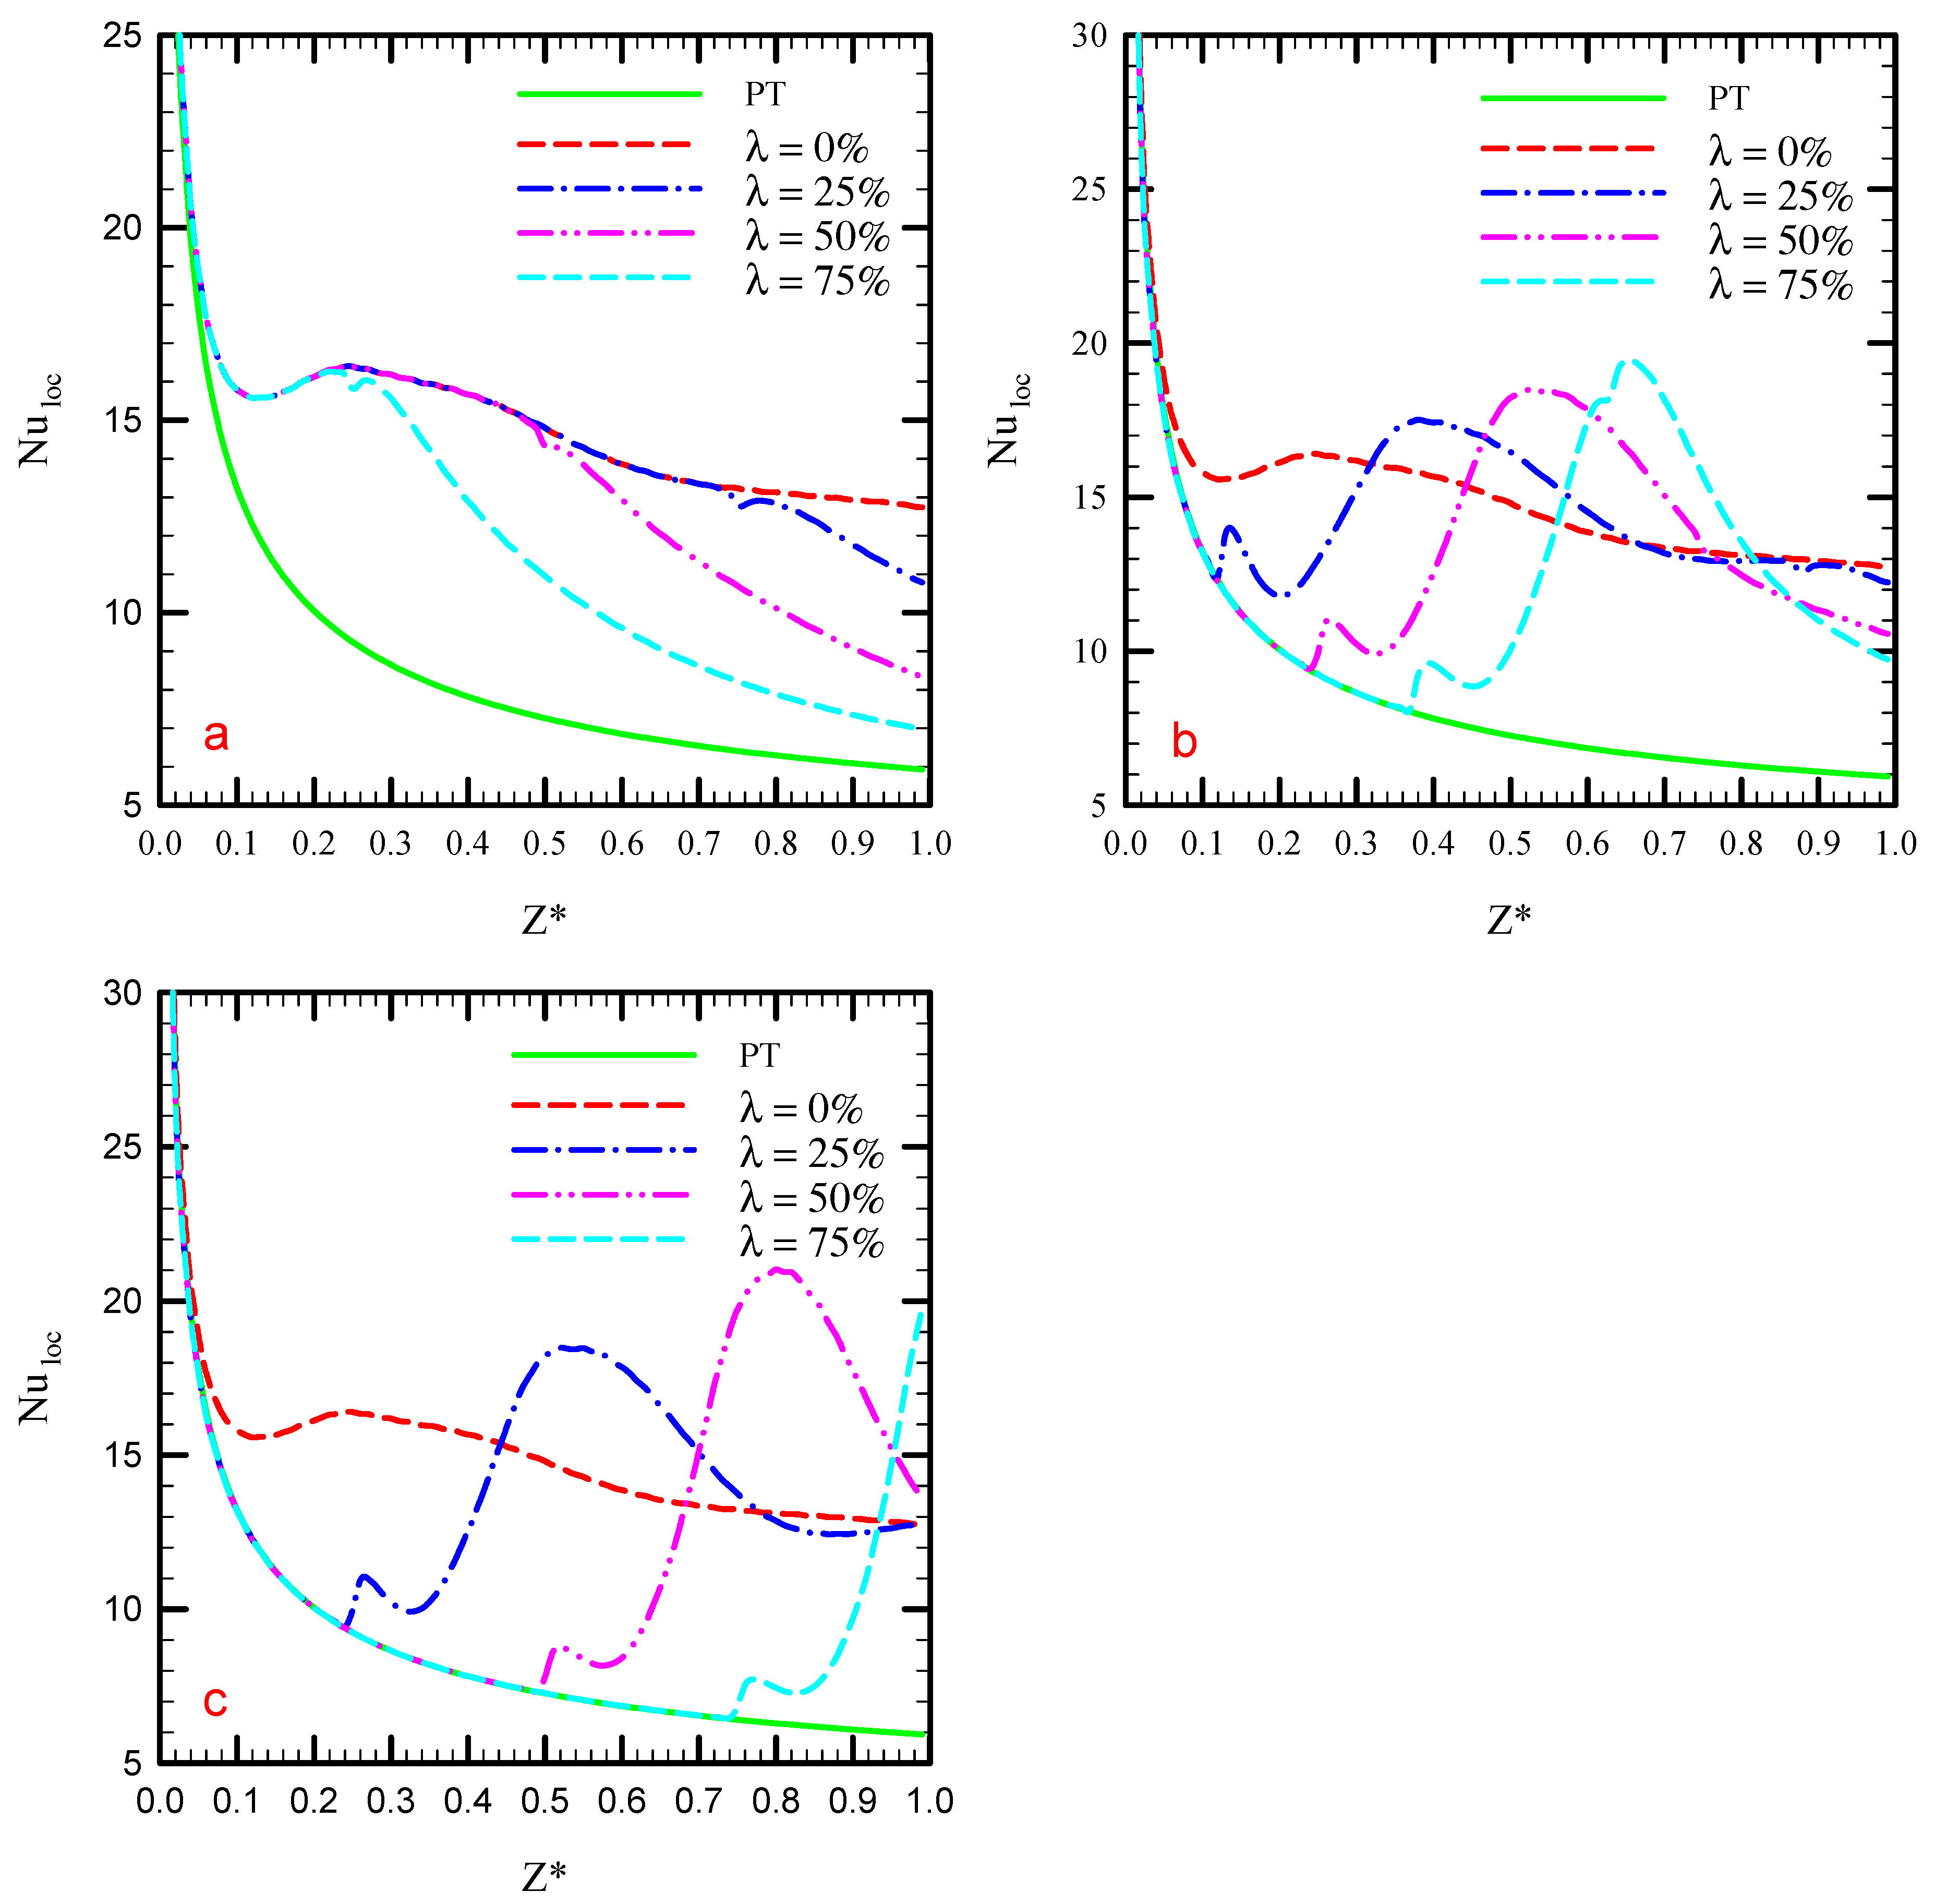
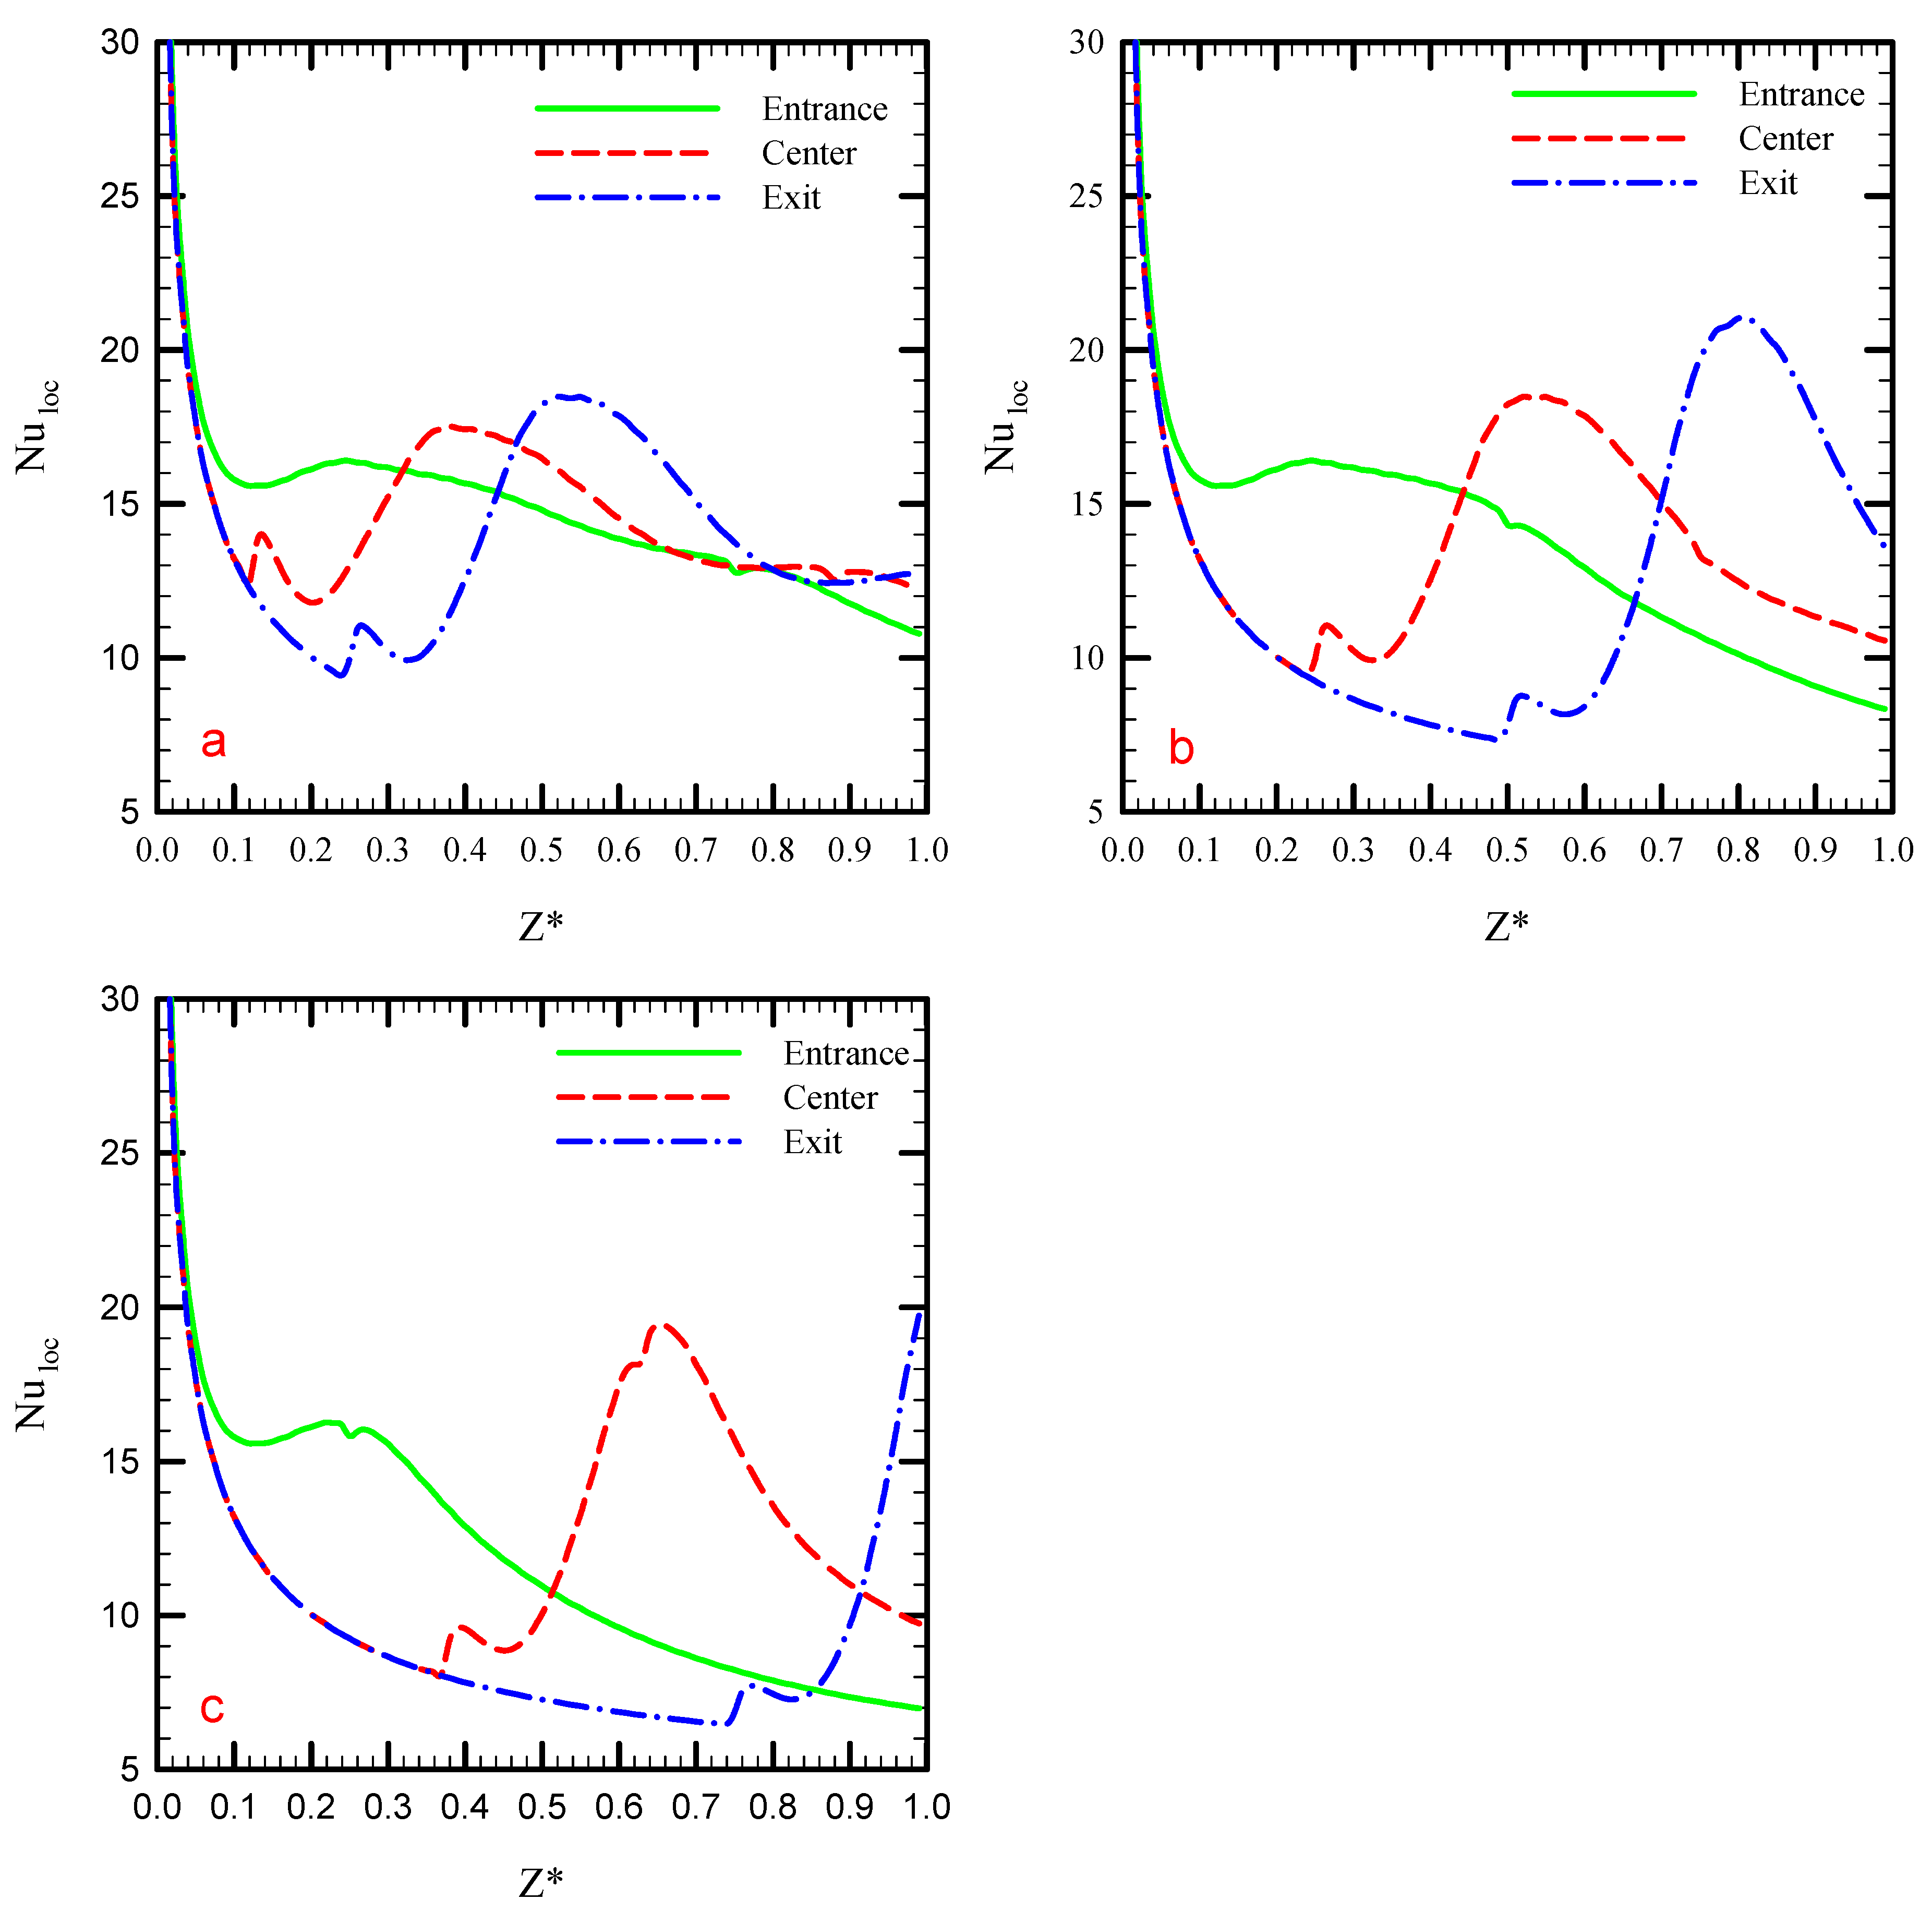
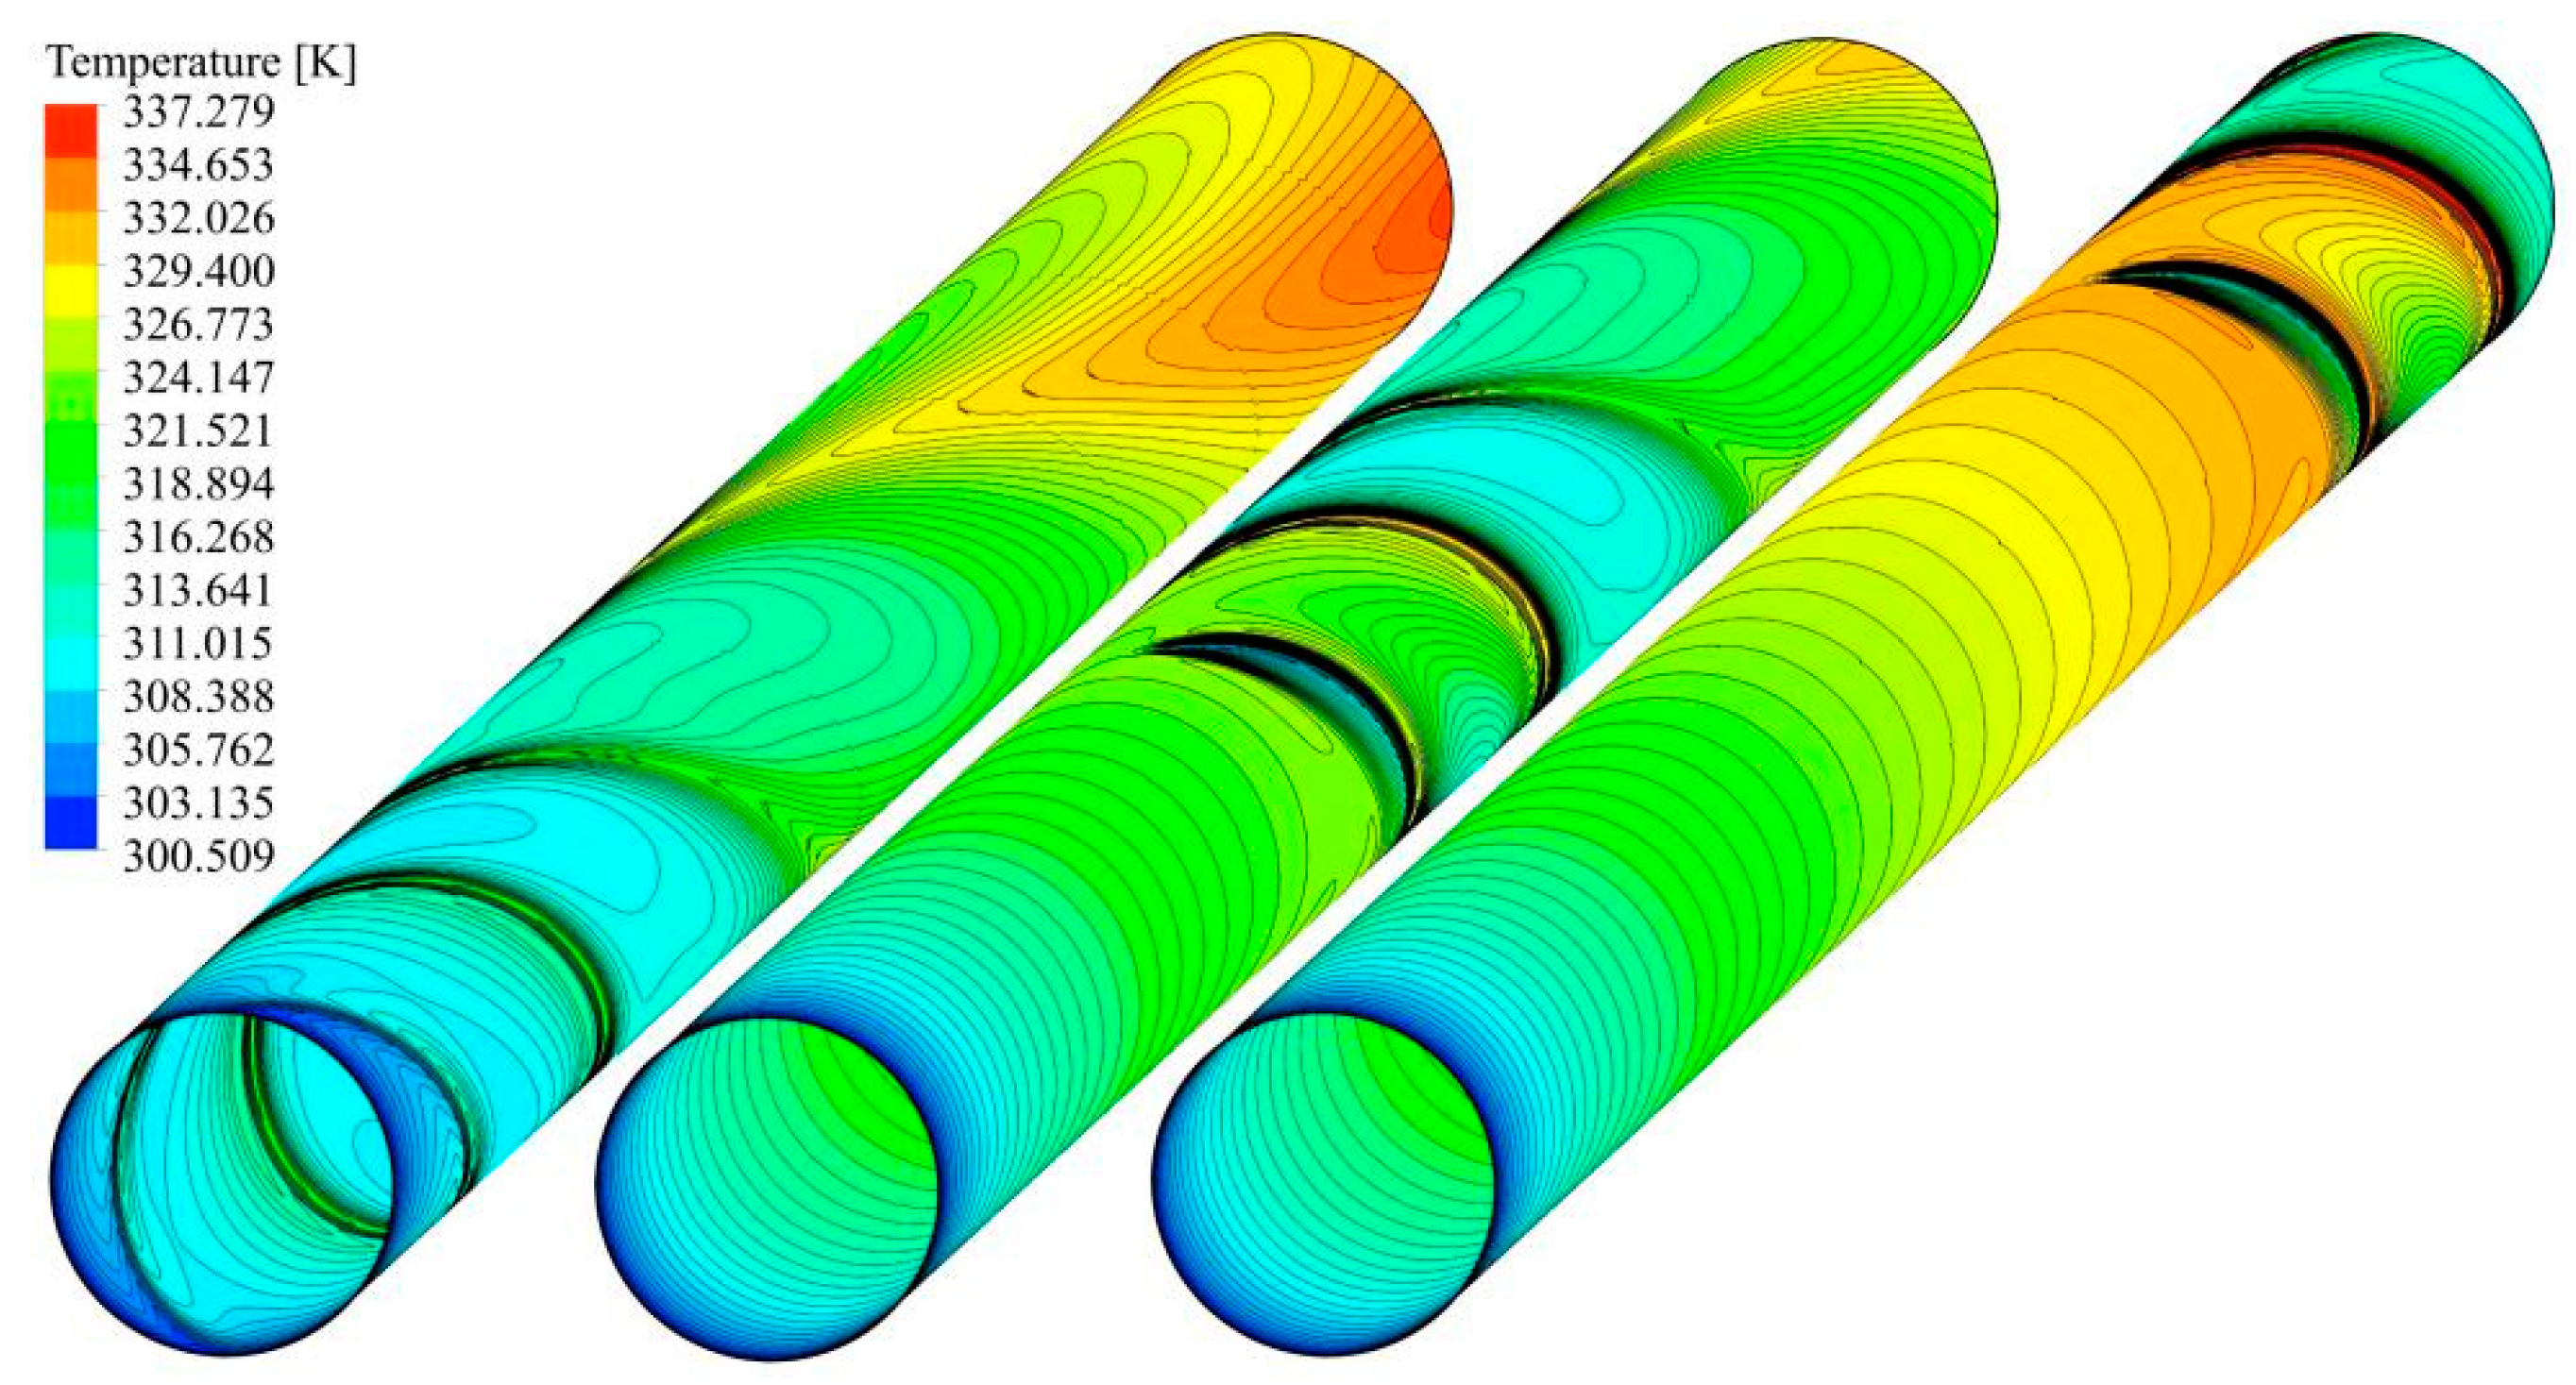
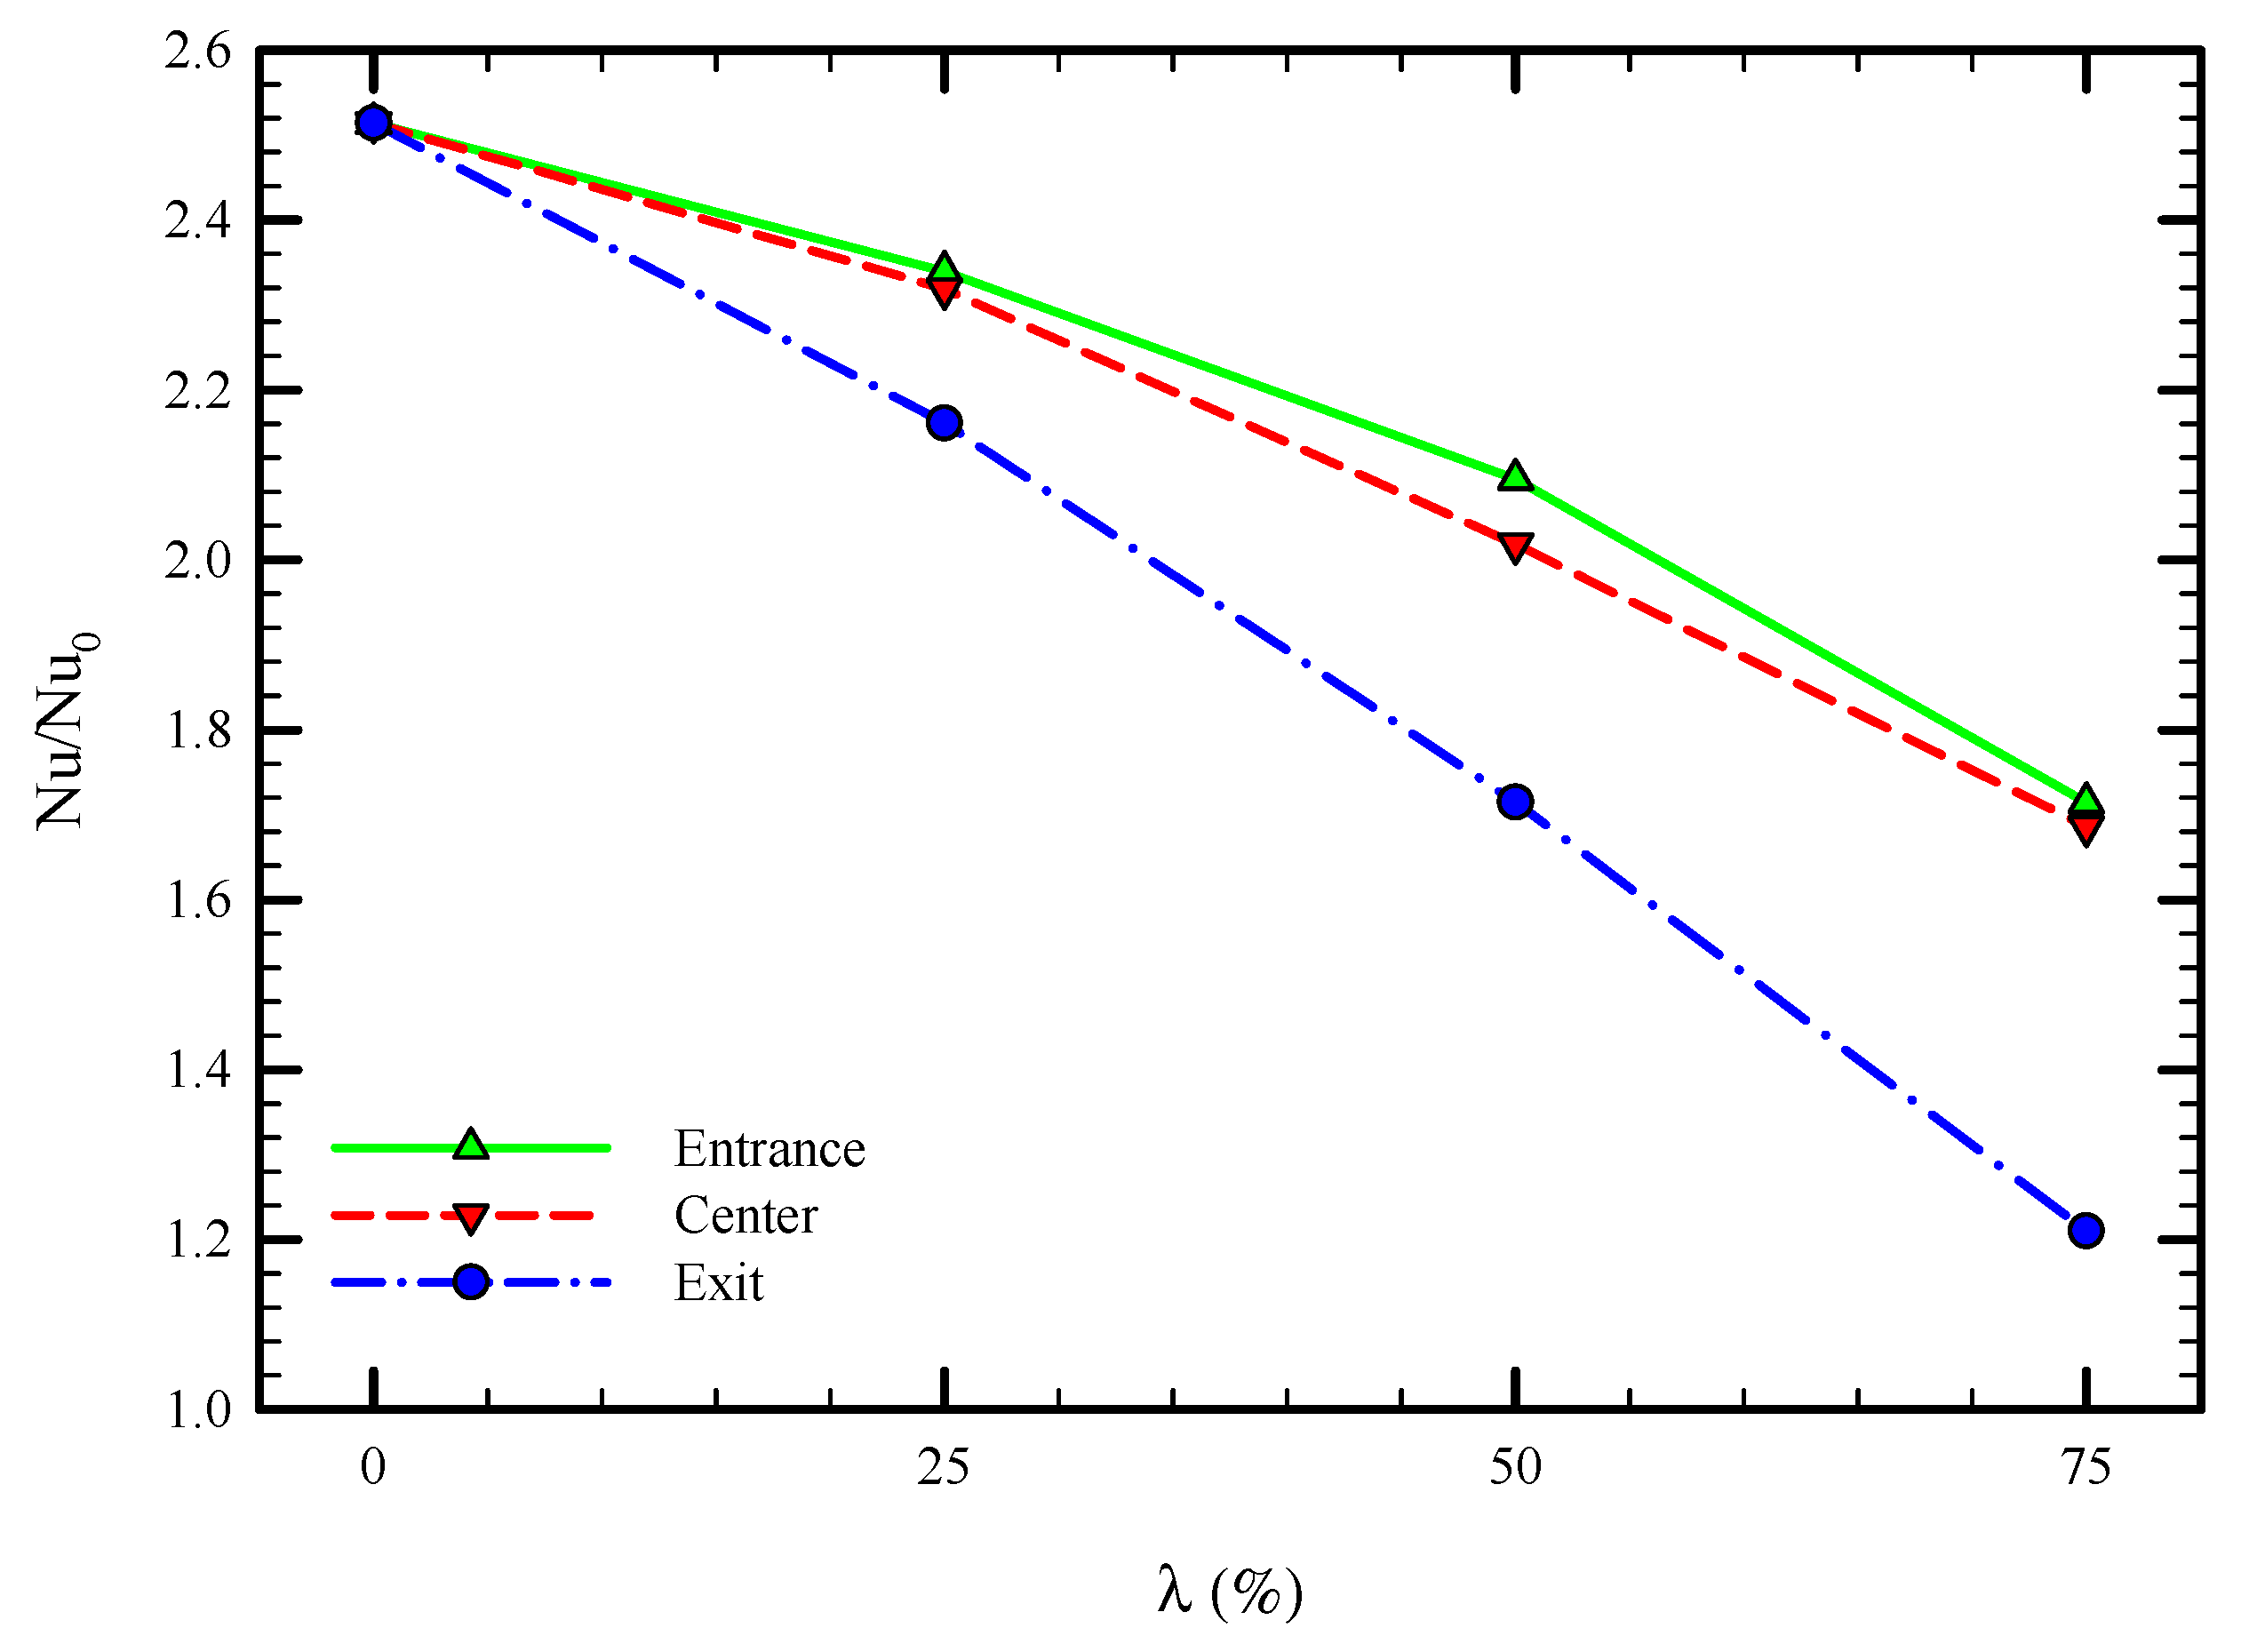
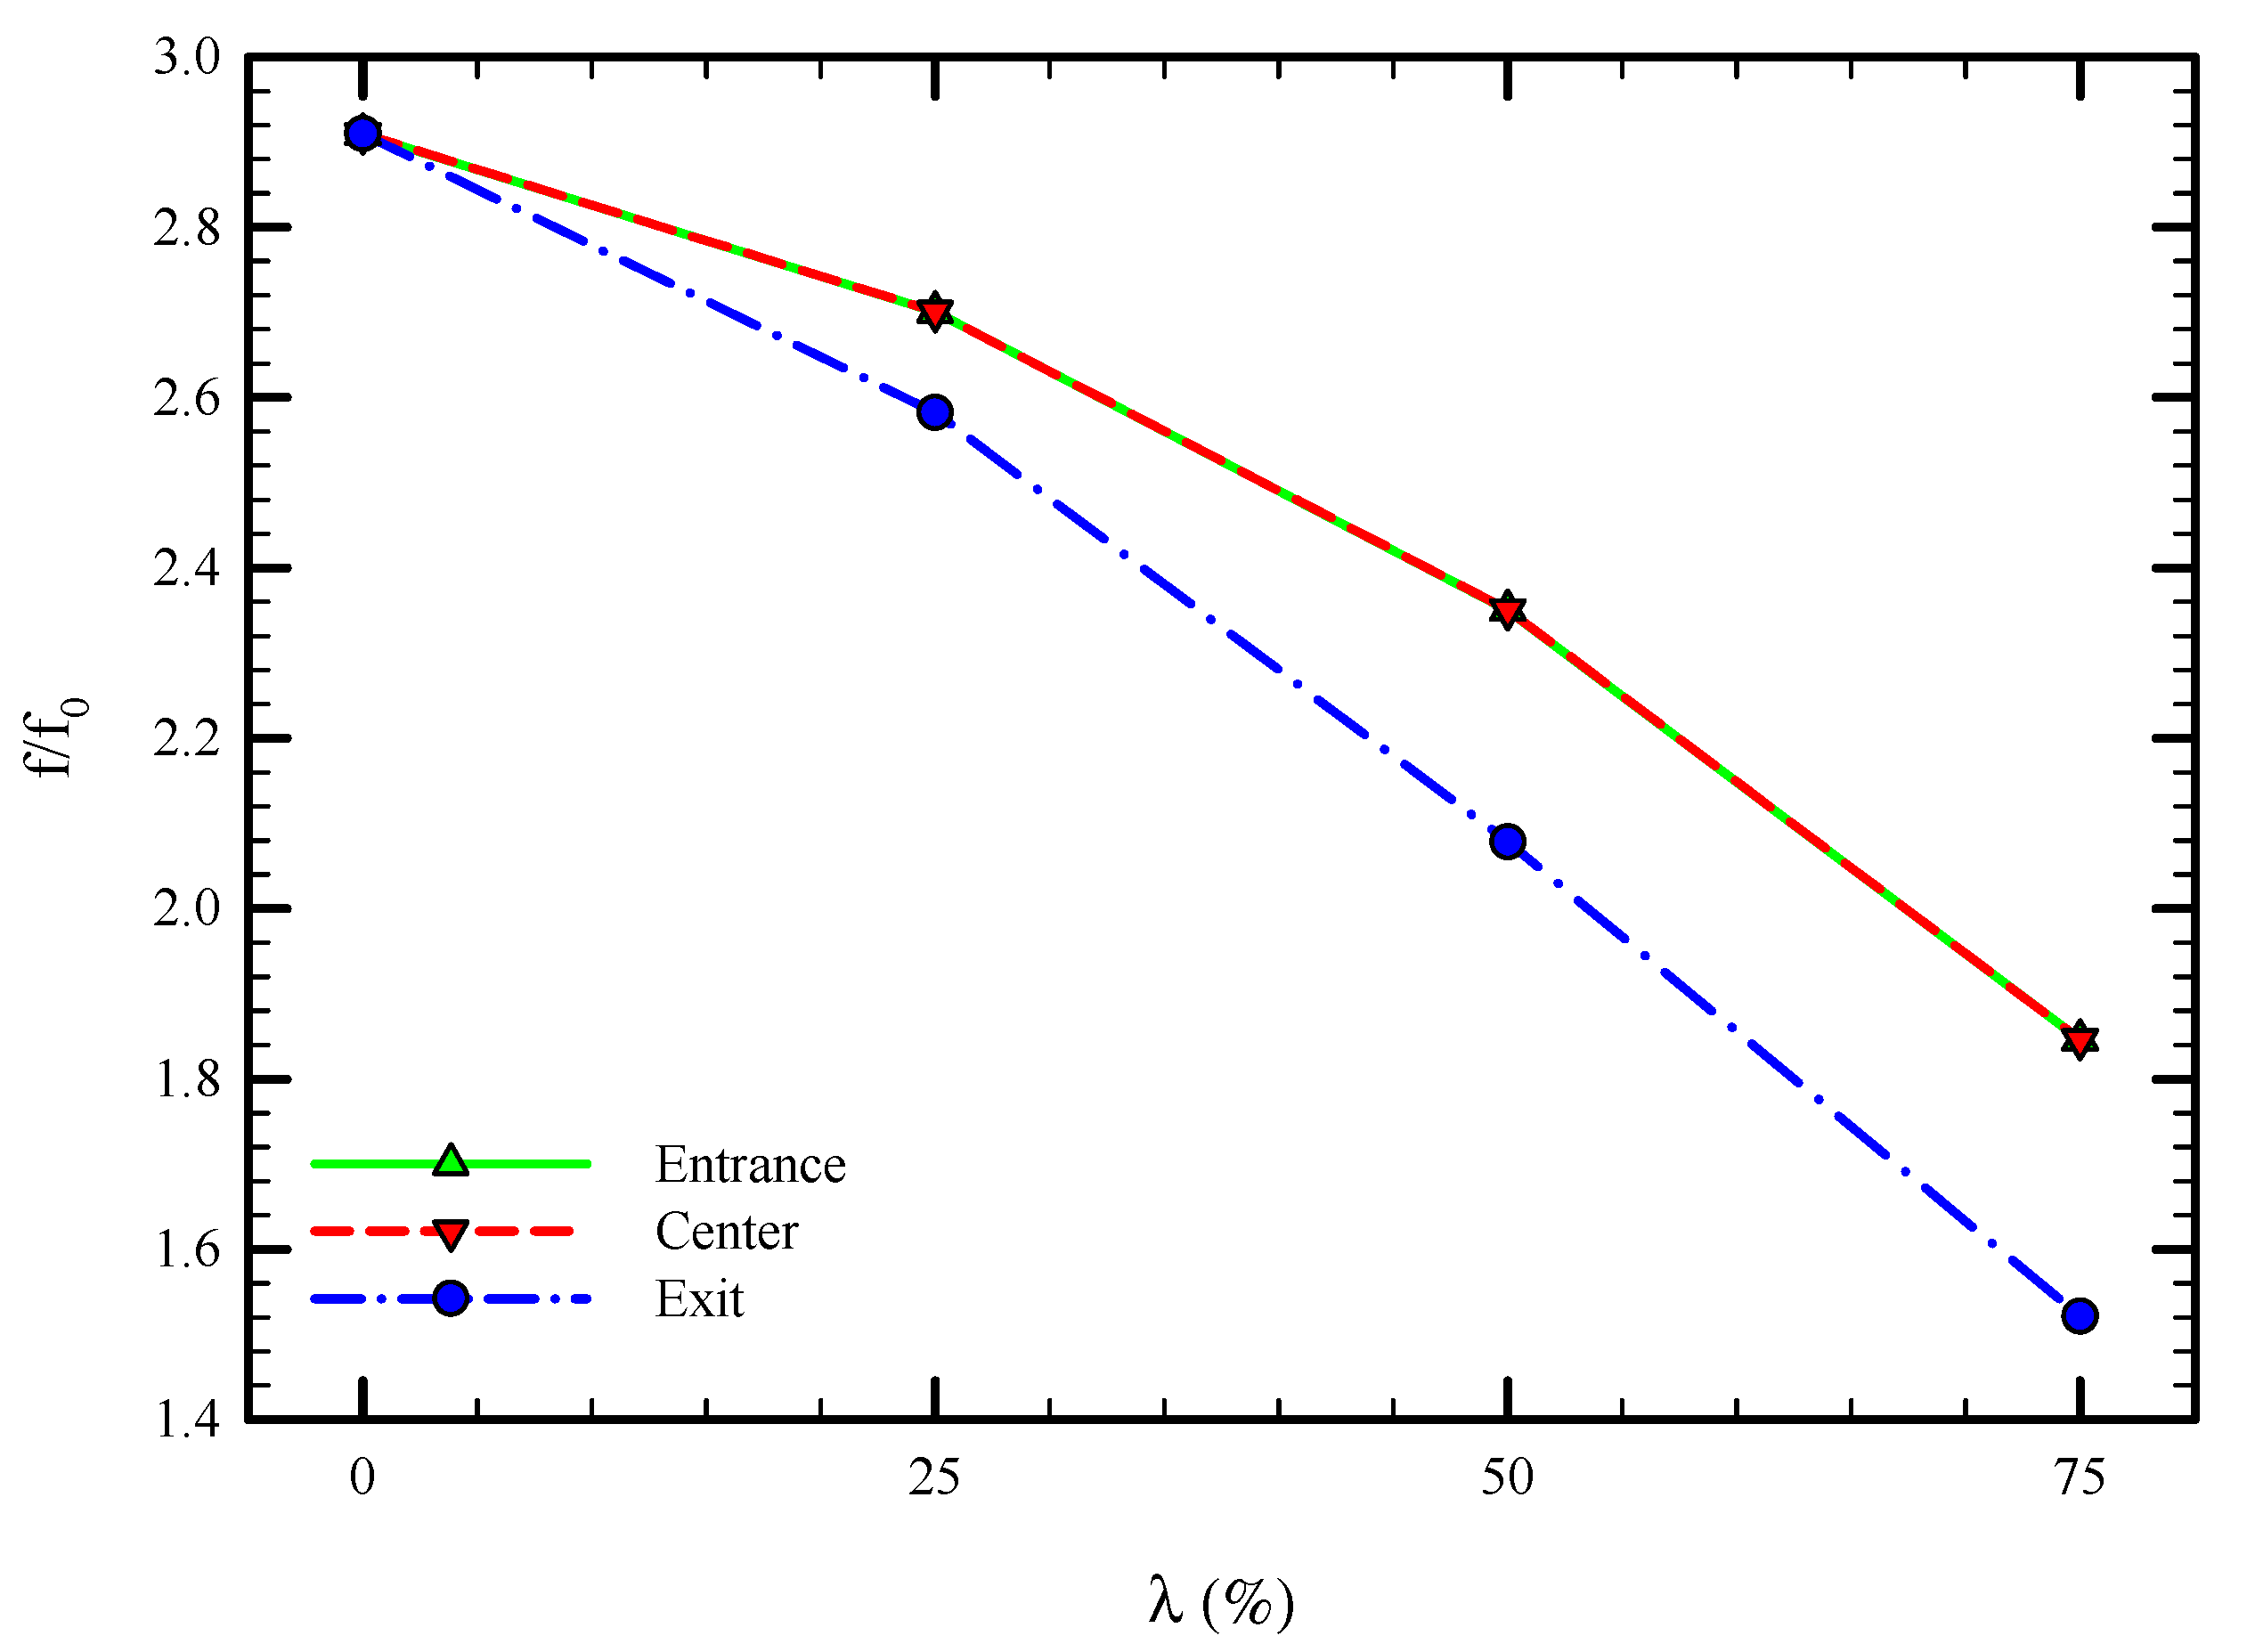
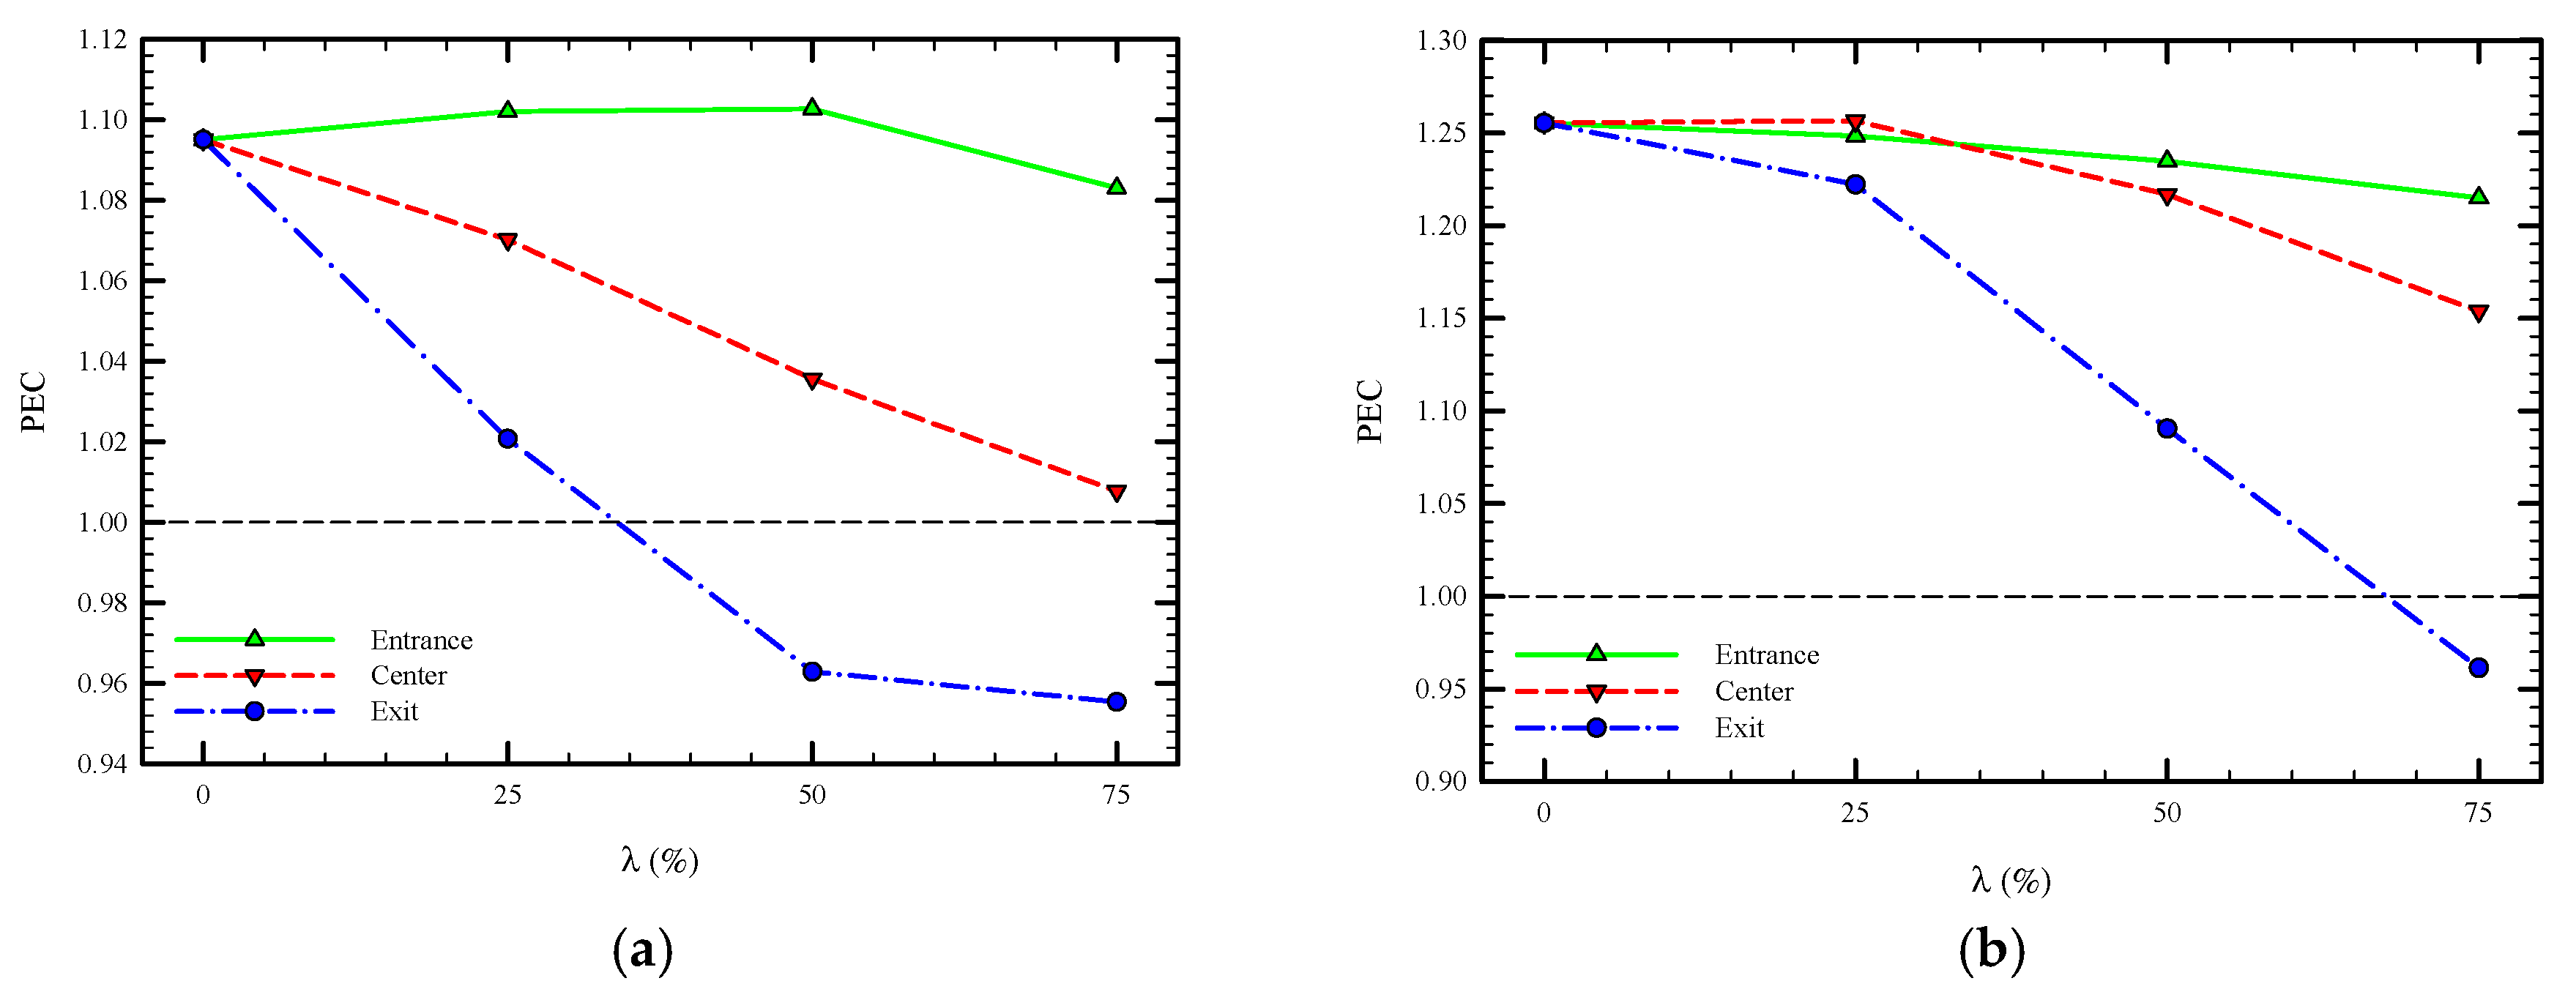
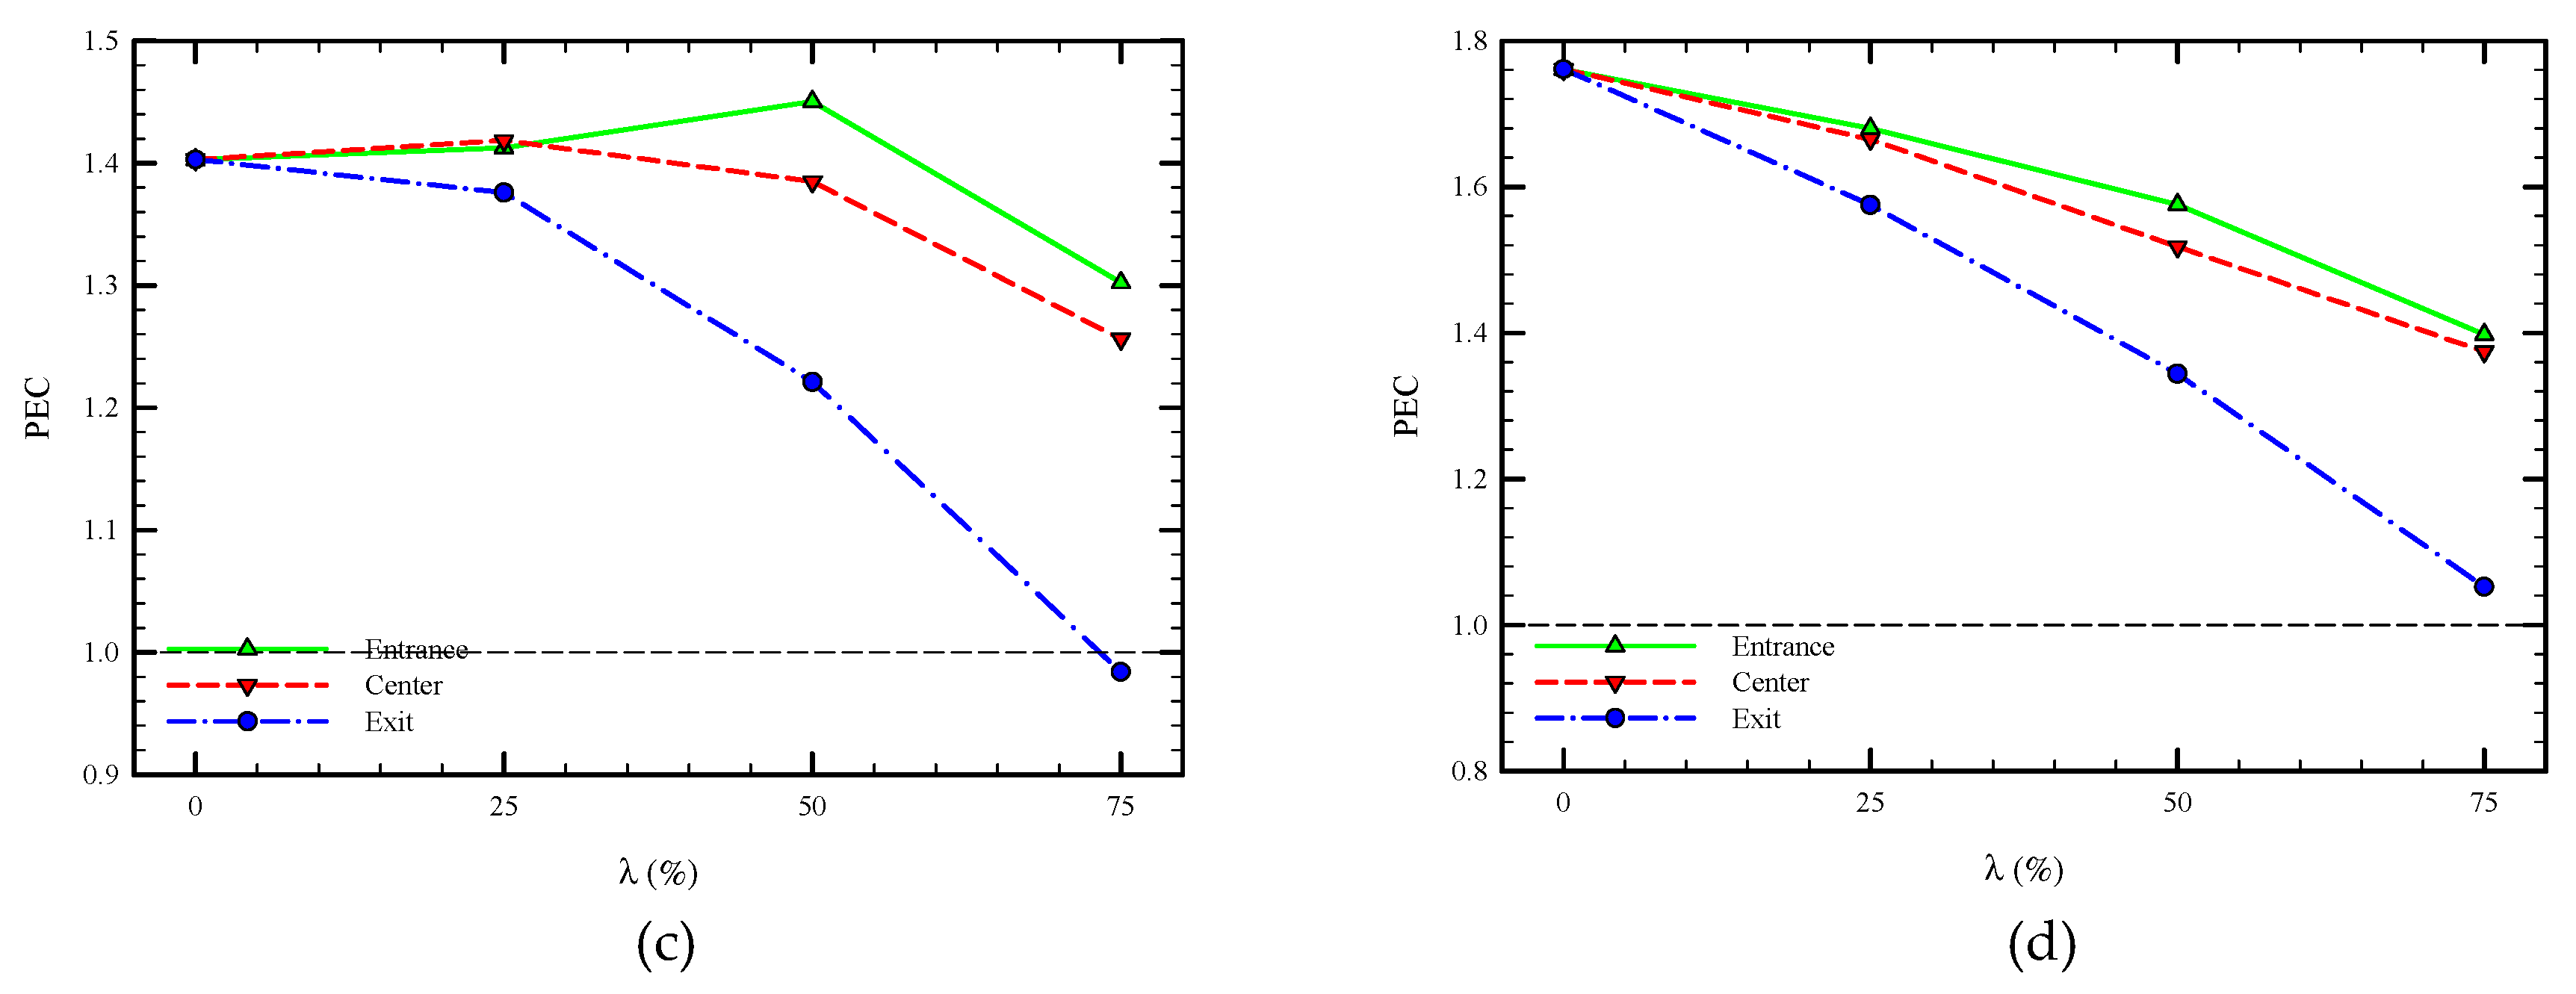
5.2. Effect of Truncated Twisted Tape Position and Percentage
6. Conclusions
Author Contributions
Funding
Conflicts of Interest
Appendix A

| Re | 250 | 500 | 750 | 1000 | ||
|---|---|---|---|---|---|---|
| λ (%) | ||||||
| 0 | 1.011295 | 1.021043 | 1.059828 | 1.095052 | P = L | |
| 25 | 1.01388 | 1.017496 | 1.045332 | 1.070205 | ||
| 50 | 1.004123 | 1.006426 | 1.02249 | 1.035571 | ||
| 75 | 0.995671 | 0.99766 | 1.003663 | 1.007723 | ||
| 0 | 1.082103 | 1.24311 | 1.265074 | 1.255414 | P = L/2 | |
| 25 | 1.089229 | 1.232876 | 1.263873 | 1.256518 | ||
| 50 | 1.092546 | 1.194338 | 1.220967 | 1.216784 | ||
| 75 | 1.074308 | 1.131182 | 1.149658 | 1.153739 | ||
| 0 | 1.227265 | 1.311893 | 1.387978 | 1.402961 | P = L/3 | |
| 25 | 1.227311 | 1.319265 | 1.401682 | 1.418449 | ||
| 50 | 1.210159 | 1.302567 | 1.334738 | 1.384967 | ||
| 75 | 1.199981 | 1.258698 | 1.265143 | 1.25622 | ||
| 0 | 1.337716 | 1.336512 | 1.555087 | 1.761103 | P = L/4 | |
| 25 | 1.338476 | 1.40221 | 1.515203 | 1.665051 | ||
| 50 | 1.315334 | 1.37707 | 1.476264 | 1.517847 | ||
| 75 | 1.29284 | 1.345982 | 1.368546 | 1.374241 | ||
| Re | 250 | 500 | 750 | 1000 | ||
|---|---|---|---|---|---|---|
| λ (%) | ||||||
| 0 | 1.011295 | 1.021043 | 1.059828 | 1.095052 | P = L | |
| 25 | 1.030648 | 1.043332 | 1.079246 | 1.102066 | ||
| 50 | 1.033091 | 1.058554 | 1.08903 | 1.102768 | ||
| 75 | 1.018142 | 1.046153 | 1.071832 | 1.083035 | ||
| 0 | 1.082103 | 1.24311 | 1.265074 | 1.255414 | P = L/2 | |
| 25 | 1.109637 | 1.255035 | 1.268496 | 1.248454 | ||
| 50 | 1.130221 | 1.236448 | 1.245266 | 1.234765 | ||
| 75 | 1.098127 | 1.18203 | 1.205088 | 1.215016 | ||
| 0 | 1.227265 | 1.311893 | 1.387978 | 1.402961 | P = L/3 | |
| 25 | 1.257101 | 1.318361 | 1.391219 | 1.412675 | ||
| 50 | 1.246763 | 1.292509 | 1.340597 | 1.450322 | ||
| 75 | 1.18302 | 1.256449 | 1.293239 | 1.302188 | ||
| 0 | 1.337716 | 1.336512 | 1.555087 | 1.761103 | P = L/4 | |
| 25 | 1.357279 | 1.340645 | 1.49818 | 1.680165 | ||
| 50 | 1.332735 | 1.385675 | 1.507737 | 1.575765 | ||
| 75 | 1.237176 | 1.333577 | 1.375402 | 1.397482 | ||
| Re | 250 | 500 | 750 | 1000 | ||
|---|---|---|---|---|---|---|
| λ (%) | ||||||
| 0 | 1.011295 | 1.021043 | 1.059828 | 1.095052 | P = L | |
| 25 | 0.984648 | 0.983887 | 1.002881 | 1.02074 | ||
| 50 | 0.95755 | 0.953732 | 0.958557 | 0.962848 | ||
| 75 | 0.956485 | 0.954873 | 0.955329 | 0.955342 | ||
| 0 | 1.082103 | 1.24311 | 1.265074 | 1.255414 | P = L/2 | |
| 25 | 1.06148 | 1.185216 | 1.225127 | 1.222088 | ||
| 50 | 1.005875 | 1.052004 | 1.083942 | 1.090425 | ||
| 75 | 0.959385 | 0.95912 | 0.960504 | 0.961318 | ||
| 0 | 1.227265 | 1.311893 | 1.387978 | 1.402961 | P = L/3 | |
| 25 | 1.18397 | 1.29666 | 1.343979 | 1.375853 | ||
| 50 | 1.115867 | 1.214709 | 1.214682 | 1.220923 | ||
| 75 | 0.971801 | 0.980115 | 0.98335 | 0.98392 | ||
| 0 | 1.337716 | 1.336512 | 1.555087 | 1.761103 | P = L/4 | |
| 25 | 1.294428 | 1.382539 | 1.469811 | 1.574971 | ||
| 50 | 1.252857 | 1.297774 | 1.344916 | 1.343726 | ||
| 75 | 1.021773 | 1.049235 | 1.050204 | 1.052115 | ||
References
- Hosseini, M.; Afrouzi, H.H.; Arasteh, H.; Toghraie, D. Energy analysis of a proton exchange membrane fuel cell (PEMFC) with an open-ended anode using agglomerate model: A CFD study. Energy 2019, 188, 116090. [Google Scholar] [CrossRef]
- Purusothaman, A. Investigation of natural convection heat transfer performance of the QFN-PCB electronic module by using nanofluid for power electronics cooling applications. Adv. Powder Technol. 2018, 29, 996–1004. [Google Scholar] [CrossRef]
- Dabiri, S.; Khodabandeh, E.; Poorfar, A.K.; Mashayekhi, R.; Toghraie, D.; Zade, S.A.A. Parametric investigation of thermal characteristic in trapezoidal cavity receiver for a linear Fresnel solar collector concentrator. Energy 2018, 153, 17–26. [Google Scholar] [CrossRef]
- Sakanova, A.; Tong, C.F.; Tseng, K.J.; Simanjorang, R.; Gupta, A.K. Weight consideration of liquid metal cooling technology for power electronics converter in future aircraft. In Proceedings of the 2016 IEEE 2nd Annual Southern Power Electronics Conference (SPEC), Auckland, New Zealand, 5–8 December 2017; pp. 1–5. [Google Scholar]
- Ravi, R.; Pachamuthu, S.; Kasinathan, P. Computational and experimental investigation on effective utilization of waste heat from diesel engine exhaust using a fin protracted heat exchanger. Energy 2020, 200, 117489. [Google Scholar] [CrossRef]
- Kadam, S.T.; Gkouletsos, D.; Hassan, I.; Rahman, M.A.; Kyriakides, A.-S.; Papadopoulos, A.I.; Seferlis, P. Investigation of binary, ternary and quaternary mixtures across solution heat exchanger used in absorption refrigeration and process modifications to improve cycle performance. Energy 2020, 198, 117254. [Google Scholar] [CrossRef]
- Jung, J.; Jeon, Y.; Cho, W.; Kim, Y. Effects of injection-port angle and internal heat exchanger length in vapor injection heat pumps for electric vehicles. Energy 2020, 193. [Google Scholar] [CrossRef]
- Wu, J.; Ju, Y. Design and optimization of natural gas liquefaction process using brazed plate heat exchangers based on the modified single mixed refrigerant process. Energy 2019, 186, 115819. [Google Scholar] [CrossRef]
- Chai, S.; Sun, X.; Zhao, Y.; Dai, Y. Experimental investigation on a fresh air dehumidification system using heat pump with desiccant coated heat exchanger. Energy 2019, 171, 306–314. [Google Scholar] [CrossRef]
- Toghraie, D.; Mashayekhi, R.; Niknejadi, M.; Arasteh, H. Hydrothermal performance analysis of various surface roughness configurations in trapezoidal microchannels at slip flow regime. Chin. J. Chem. Eng. 2020, 28, 1522–1532. [Google Scholar] [CrossRef]
- Ghalambaz, M.; Arasteh, H.; Mashayekhi, R.; Keshmiri, A.; Talebizadehsardari, P.; Yaïci, W. Investigation of Overlapped Twisted Tapes Inserted in a Double-Pipe Heat Exchanger Using Two-Phase Nanofluid. Nanomaterials 2020, 10, 1656. [Google Scholar] [CrossRef] [PubMed]
- Hamid, K.A.; Azmi, W.; Mamat, R.; Sharma, K. Heat transfer performance of TiO2–SiO2 nanofluids in a tube with wire coil inserts. Appl. Therm. Eng. 2019, 152, 275–286. [Google Scholar] [CrossRef]
- Song, X.; Dong, G.; Gao, F.; Diao, X.; Zheng, L.; Zhou, F. A numerical study of parabolic trough receiver with nonuniform heat flux and helical screw-tape inserts. Energy 2014, 77, 771–782. [Google Scholar] [CrossRef]
- Murugan, M.; Vijayan, R.; Saravanan, A.; Jaisankar, S. Performance enhancement of centrally finned twist inserted solar collector using corrugated booster reflectors. Energy 2019, 168, 858–869. [Google Scholar] [CrossRef]
- Jaisankar, S.; Radhakrishnan, T.; Sheeba, K. Studies on heat transfer and friction factor characteristics of thermosyphon solar water heating system with helical twisted tapes. Energy 2009, 34, 1054–1064. [Google Scholar] [CrossRef]
- Ananth, J.; Jaisankar, S. Investigation on heat transfer and friction factor characteristics of thermosiphon solar water heating system with left-right twist regularly spaced with rod and spacer. Energy 2014, 65, 357–363. [Google Scholar] [CrossRef]
- Saravanan, A.; Senthilkumaar, J.; Jaisankar, S. Experimental studies on heat transfer and friction factor characteristics of twist inserted V-trough thermosyphon solar water heating system. Energy 2016, 112, 642–654. [Google Scholar] [CrossRef]
- Man, C.; Lv, X.; Hu, J.; Sun, P.; Tang, Y. Experimental study on effect of heat transfer enhancement for single-phase forced convective flow with twisted tape inserts. Int. J. Heat Mass Transf. 2017, 106, 877–883. [Google Scholar] [CrossRef]
- Lim, K.Y.; Hung, Y.M.; Tan, B.T. Performance evaluation of twisted-tape insert induced swirl flow in a laminar thermally developing heat exchanger. Appl. Therm. Eng. 2017, 121, 652–661. [Google Scholar] [CrossRef]
- Kumar, N.R.; Bhramara, P.; Kirubeil, A.; Sundar, L.S.; Singh, M.K.; Sousa, A. Effect of twisted tape inserts on heat transfer, friction factor of Fe3O4 nanofluids flow in a double pipe U-bend heat exchanger. Int. Commun. Heat Mass Transf. 2018, 95, 53–62. [Google Scholar] [CrossRef]
- Ho, C.; Chiou, Y.-H.; Yan, W.-M.; Ghalambaz, M. Transient cooling characteristics of Al2O3-water nanofluid flow in a microchannel subject to a sudden-pulsed heat flux. Int. J. Mech. Sci. 2019, 151, 95–105. [Google Scholar] [CrossRef]
- Ghalambaz, M.; Doostani, A.; Izadpanahi, E.; Chamkha, A.J. Conjugate natural convection flow of Ag–MgO/water hybrid nanofluid in a square cavity. J. Therm. Anal. Calorim. 2019, 139, 2321–2336. [Google Scholar] [CrossRef]
- Mehryan, S.; Ghalambaz, M.; Chamkha, A.J.; Izadi, M. Numerical study on natural convection of Ag–MgO hybrid/water nanofluid inside a porous enclosure: A local thermal non-equilibrium model. Powder Technol. 2020, 367, 443–455. [Google Scholar] [CrossRef]
- Ho, C.; Liu, Y.-C.; Ghalambaz, M.; Yan, W. Forced convection heat transfer of Nano-Encapsulated Phase Change Material (NEPCM) suspension in a mini-channel heatsink. Int. J. Heat Mass Transf. 2020, 155. [Google Scholar] [CrossRef]
- Ghalambaz, M.; Chamkha, A.J.; Wen, D. Natural convective flow and heat transfer of Nano-Encapsulated Phase Change Materials (NEPCMs) in a cavity. Int. J. Heat Mass Transf. 2019, 138, 738–749. [Google Scholar] [CrossRef]
- Ghalambaz, M.; Groşan, T.; Pop, I. Mixed convection boundary layer flow and heat transfer over a vertical plate embedded in a porous medium filled with a suspension of nano-encapsulated phase change materials. J. Mol. Liq. 2019, 293. [Google Scholar] [CrossRef]
- Chien, L.-H.; Cheng, Y.-T.; Lai, Y.-L.; Yan, W.-M.; Ghalambaz, M. Experimental and numerical study on convective boiling in a staggered array of micro pin-fin microgap. Int. J. Heat Mass Transf. 2020, 149, 119203. [Google Scholar] [CrossRef]
- Chien, L.-H.; Liao, W.-R.; Ghalambaz, M.; Yan, W.-M. Experimental study on convective boiling flow and heat transfer in a microgap enhanced with a staggered arrangement of nucleated micro-pin-fins. Int. J. Heat Mass Transf. 2019, 144, 118653. [Google Scholar] [CrossRef]
- Jaramillo, O.A.; Borunda, M.; Velazquez-Lucho, K.; Robles, M. Parabolic trough solar collector for low enthalpy processes: An analysis of the efficiency enhancement by using twisted tape inserts. Renew. Energy 2016, 93, 125–141. [Google Scholar] [CrossRef]
- Mwesigye, A.; Bello-Ochende, T.; Meyer, J.P. Heat transfer and entropy generation in a parabolic trough receiver with wall-detached twisted tape inserts. Int. J. Therm. Sci. 2016, 99, 238–257. [Google Scholar] [CrossRef]
- Esfe, M.H.; Mazaheri, H.; Mirzaei, S.S.; Kashi, E.; Kazemi, M.; Afrand, M. Effects of twisted tapes on thermal performance of tri-lobed tube: An applicable numerical study. Appl. Therm. Eng. 2018, 144, 512–521. [Google Scholar] [CrossRef]
- Saysroy, A.; Eiamsa-Ard, S. Periodically fully-developed heat and fluid flow behaviors in a turbulent tube flow with square-cut twisted tape inserts. Appl. Therm. Eng. 2017, 112, 895–910. [Google Scholar] [CrossRef]
- Saysroy, A.; Eiamsa-Ard, S. Enhancing convective heat transfer in laminar and turbulent flow regions using multi-channel twisted tape inserts. Int. J. Therm. Sci. 2017, 121, 55–74. [Google Scholar] [CrossRef]
- He, Y.; Liu, L.; Li, P.; Ma, L. Experimental study on heat transfer enhancement characteristics of tube with cross hollow twisted tape inserts. Appl. Therm. Eng. 2018, 131, 743–749. [Google Scholar] [CrossRef]
- Samruaisin, P.; Changcharoen, W.; Thianpong, C.; Chuwattanakul, V.; Pimsarn, M.; Eiamsa-Ard, S. Influence of regularly spaced quadruple twisted tape elements on thermal enhancement characteristics. Chem. Eng. Process. Process. Intensif. 2018, 128, 114–123. [Google Scholar] [CrossRef]
- Ruengpayungsak, K.; Saysroy, A.; Wongcharee, K.; Eiamsa-Ard, S. Thermohydraulic performance evaluation of heat exchangers equipped with centrally perforated twisted tape: Laminar and turbulent flows. J. Therm. Sci. Technol. 2019, 14, JTST0002. [Google Scholar] [CrossRef]
- Hasanpour, A.; Farhadi, M.; Sedighi, K. Intensification of heat exchangers performance by modified and optimized twisted tapes. Chem. Eng. Process. Process. Intensif. 2017, 120, 276–285. [Google Scholar] [CrossRef]
- Hong, Y.; Du, J.; Wang, S. Experimental heat transfer and flow characteristics in a spiral grooved tube with overlapped large/small twin twisted tapes. Int. J. Heat Mass Transf. 2017, 106, 1178–1190. [Google Scholar] [CrossRef]
- Hong, Y.; Du, J.; Wang, S. Turbulent thermal, fluid flow and thermodynamic characteristics in a plain tube fitted with overlapped multiple twisted tapes. Int. J. Heat Mass Transf. 2017, 115, 551–565. [Google Scholar] [CrossRef]
- Eiamsa-Ard, S.; Samravysin, P.; Eiamsa-Ard, S.; Samruaysin, P. Characterization of Heat Transfer by Overlapped-Quadruple Counter Tapes. J. Heat Transf. 2018, 140, 114501. [Google Scholar] [CrossRef]
- Rudrabhiramu, R.; Kumar, K.H.; Rao, K.M. Heat Transfer Enhancement Using Overlapped Dual Twisted Tape Inserts with Nanofluids. In Advances in Automotive Technologies; Springer Science and Business Media LLC.: Berlin/Heidelberg, Germany, 2020; pp. 123–130. [Google Scholar]
- Qi, C.; Wang, G.; Yan, Y.; Mei, S.; Luo, T. Effect of rotating twisted tape on thermo-hydraulic performances of nanofluids in heat-exchanger systems. Energy Convers. Manag. 2018, 166, 744–757. [Google Scholar] [CrossRef]
- Sundar, L.S.; Singh, M.K.; Punnaiah, V.; Sousa, A.C.M. Experimental investigation of Al2O3/water nanofluids on the effectiveness of solar flat-plate collectors with and without twisted tape inserts. Renew. Energy 2018, 119, 820–833. [Google Scholar] [CrossRef]
- Tian, Z.; Abdollahi, A.; Shariati, M.; Amindoust, A.; Arasteh, H.; Karimipour, A.; Goodarzi, M.; Bach, Q.-V. Turbulent flows in a spiral double-pipe heat exchanger. Int. J. Numer. Methods Heat Fluid Flow 2019, 30, 39–53. [Google Scholar] [CrossRef]
- Toghraie, D.; Mashayekhi, R.; Arasteh, H.; Sheykhi, S.; Niknejadi, M.; Chamkha, A.J. Two-phase investigation of water-Al2O3 nanofluid in a micro concentric annulus under non-uniform heat flux boundary conditions. Int. J. Numer. Methods Heat Fluid Flow 2019, 30, 1795–1814. [Google Scholar] [CrossRef]
- Arasteh, H.; Salimpour, M.; Tavakoli, M.R. Optimal distribution of metal foam inserts in a double-pipe heat exchanger. Int. J. Numer. Methods Heat Fluid Flow 2019, 29, 1322–3142. [Google Scholar] [CrossRef]
- Wei, L.; Arasteh, H.; Abdollahi, A.; Parsian, A.; Taghipour, A.; Mashayekhi, R.; Tlili, I. Locally weighted moving regression: A non-parametric method for modeling nanofluid features of dynamic viscosity. Phys. A Stat. Mech. Appl. 2020, 550, 124124. [Google Scholar] [CrossRef]
- Rezaei, O.; Akbari, O.A.; Marzban, A.; Toghraie, D.; Pourfattah, F.; Mashayekhi, R. The numerical investigation of heat transfer and pressure drop of turbulent flow in a triangular microchannel. Phys. E Low Dimens. Syst. Nanostruct. 2017, 93, 179–189. [Google Scholar] [CrossRef]
- Khodabandeh, E.; Toghraie, D.; Chamkha, A.J.; Mashayekhi, R.; Akbari, O.A.; Rozati, S.A. Energy saving with using of elliptic pillows in turbulent flow of two-phase water-silver nanofluid in a spiral heat exchanger. Int. J. Numer. Methods Heat Fluid Flow 2019, 30, 2025–2049. [Google Scholar] [CrossRef]
- Ghaneifar, M.; Arasteh, H.; Mashayekhi, R.; Rahbari, A.; Mahani, R.B.; Talebizadehsardari, P. Thermohydraulic analysis of hybrid nanofluid in a multilayered copper foam heat sink employing local thermal non-equilibrium condition: Optimization of layers thickness. Appl. Therm. Eng. 2020, 181, 115961. [Google Scholar] [CrossRef]
- Hong, S.W.; Bergles, A.E. Augmentation of Laminar Flow Heat Transfer in Tubes by Means of Twisted-Tape Inserts. J. Heat Transf. 1976, 98, 251–256. [Google Scholar] [CrossRef]
- Sarviya, R.; Fuskele, V. Heat Transfer and Pressure Drop in a Circular Tube Fitted with Twisted Tape Insert Having Continuous Cut Edges. J. Energy Storage 2018, 19, 10–14. [Google Scholar] [CrossRef]


| Case | Number of Elements | Nusselt Number | Error (%) |
|---|---|---|---|
| 1 | 750,000 | 41.61 | - |
| 2 | 1,250,000 | 39.12 | 5.98 |
| 3 | 1,750,000 | 38.04 | 2.74 |
| 4 | 2,250,000 | 37.85 | 0.52 |
| 5 | 3,000,000 | 37.7 | 0.39 |
© 2020 by the authors. Licensee MDPI, Basel, Switzerland. This article is an open access article distributed under the terms and conditions of the Creative Commons Attribution (CC BY) license (http://creativecommons.org/licenses/by/4.0/).
Share and Cite
Ghalambaz, M.; Mashayekhi, R.; Arasteh, H.; Ali, H.M.; Talebizadehsardari, P.; Yaïci, W. Thermo-Hydraulic Performance Analysis on the Effects of Truncated Twisted Tape Inserts in a Tube Heat Exchanger. Symmetry 2020, 12, 1652. https://doi.org/10.3390/sym12101652
Ghalambaz M, Mashayekhi R, Arasteh H, Ali HM, Talebizadehsardari P, Yaïci W. Thermo-Hydraulic Performance Analysis on the Effects of Truncated Twisted Tape Inserts in a Tube Heat Exchanger. Symmetry. 2020; 12(10):1652. https://doi.org/10.3390/sym12101652
Chicago/Turabian StyleGhalambaz, Mehdi, Ramin Mashayekhi, Hossein Arasteh, Hafiz Muhammad Ali, Pouyan Talebizadehsardari, and Wahiba Yaïci. 2020. "Thermo-Hydraulic Performance Analysis on the Effects of Truncated Twisted Tape Inserts in a Tube Heat Exchanger" Symmetry 12, no. 10: 1652. https://doi.org/10.3390/sym12101652
APA StyleGhalambaz, M., Mashayekhi, R., Arasteh, H., Ali, H. M., Talebizadehsardari, P., & Yaïci, W. (2020). Thermo-Hydraulic Performance Analysis on the Effects of Truncated Twisted Tape Inserts in a Tube Heat Exchanger. Symmetry, 12(10), 1652. https://doi.org/10.3390/sym12101652