Article

Energy Efficiency and Coverage Trade-Off in 5G for Eco-Friendly and Sustainable Cellular Networks

1
Department of Electrical Engineering, College of Electronics and Information Engineering, Sejong University, 209 Neungdong-ro, Gwangjin-gu, Seoul 05006, Korea
2
Department of Electrical Engineering and Information Engineering, College of Engineering, Covenant University, Canaanland, Ota, Ogun State 740005, Nigeria
*
Author to whom correspondence should be addressed.
Symmetry 2019, 11(3), 408; https://doi.org/10.3390/sym11030408
Submission received: 18 January 2019 / Revised: 8 March 2019 / Accepted: 13 March 2019 / Published: 20 March 2019
(This article belongs to the Special Issue Information Technology and Its Applications 2021)

Abstract

:
Recently, cellular networks’ energy efficiency has garnered research interest from academia and industry because of its considerable economic and ecological effects in the near future. This study proposes an approach to cooperation between the Long-Term Evolution (LTE) and next-generation wireless networks. The fifth-generation (5G) wireless network aims to negotiate a trade-off between wireless network performance (sustaining the demand for high speed packet rates during busy traffic periods) and energy efficiency (EE) by alternating 5G base stations’ (BSs) switching off/on based on the traffic instantaneous load condition and, at the same time, guaranteeing network coverage for mobile subscribers by the remaining active LTE BSs. The particle swarm optimization (PSO) algorithm was used to determine the optimum criteria of the active LTE BSs (transmission power, total antenna gain, spectrum/channel bandwidth, and signal-to-interference-noise ratio) that achieves maximum coverage for the entire area during the switch-off session of 5G BSs. Simulation results indicate that the energy savings can reach 3.52 kW per day, with a maximum data rate of up to 22.4 Gbps at peak traffic hours and 80.64 Mbps during a 5G BS switched-off session along with guaranteed full coverage over the entire region by the remaining active LTE BSs.

1. Introduction

Cellular networks are one of the most important technological innovations witnessed in recent times, improving the quality of human life and contributing to economic growth. Recently, cellular networks have developed tremendously to offer video streaming data, which explains the rapid growth in mobile subscribers [1]. Mobile subscriptions grew approximately 3% between 2017 and 2018 to reach 7.9 billion in Q3 2018, while mobile data traffic grew by approximately 79% in the same period to reach approximately 20.7 ExaBytes (EB) per month in Q3 2018 [2]. Moreover, the number of mobile subscribers will increase exponentially due to continuous development of cellular networks, the advent of the fifth generation (5G) of cellular networks, and the Internet of Things (IoT), which is considered the backbone of emerging applications, moving the telecommunications forward to contribute to quality of life and grow the world’s economy [3]. By 2024, mobile subscriptions are expected to reach 8.9 billion; meanwhile, cellular IoT connections will reach 4.1 billion, with mobile data traffic using approximately up to 136 EB per month, wherein 74% will be utilized for mobile video traffic, and 5G networks will carry 25% of global mobile data traffic [2]. Figure 1 presents the growth of global mobile subscribers and mobile data traffic based on cellular generations.
The 5G technology is expected to address some of the critical requirements of network issues because this technology will not only provide personal mobile service but also massive machine communications [4]. However, 5G is not intended to replace the legacy of cellular networks but rather to enhance and support it to provide superior performance of cellular networks (CNs) [5]. Thus, the number of base stations, considered the main source of cellular networks energy utilization, will increase considerably [6]. Judging from the cellular network operators (CNOs) context, energy efficiency (EE) is of paramount interest to CNOs based on its significant economic and ecological influence in the coming years. Therefore, a novel research discipline termed “green communication” has emerged [7]. What actually constitutes “green communication” is the first question that needs attention. Secondly, is it measurable, and if so, how do we define the degree of “greenness” in CNs? It is plausible to use carbon footprint or CO2 emissions as a measure of “greenness,” but CNs’ carbon emissions are negligible. Apart from the carbon emissions issue, there are other drivers of “green” wireless technology that include financial gains (lower energy costs). With the adoption of economic gains in the “green” concept, energy savings or energy efficiency appears to be a more appropriate way to measure “greenness.” Hence, the concept of “green communication” technology in wireless systems can be made meaningful with a comprehensive evaluation of energy savings and performance in a practical system [8]. Thus, the goal of green communication is to enhance the EE of BSs, decrease OPEX, and eradicate greenhouse gases. For further information on green wireless communications network, see [9,10,11,12].

1.1. Motivation

Environmental and energy concerns are core drivers of green technology.
(i)
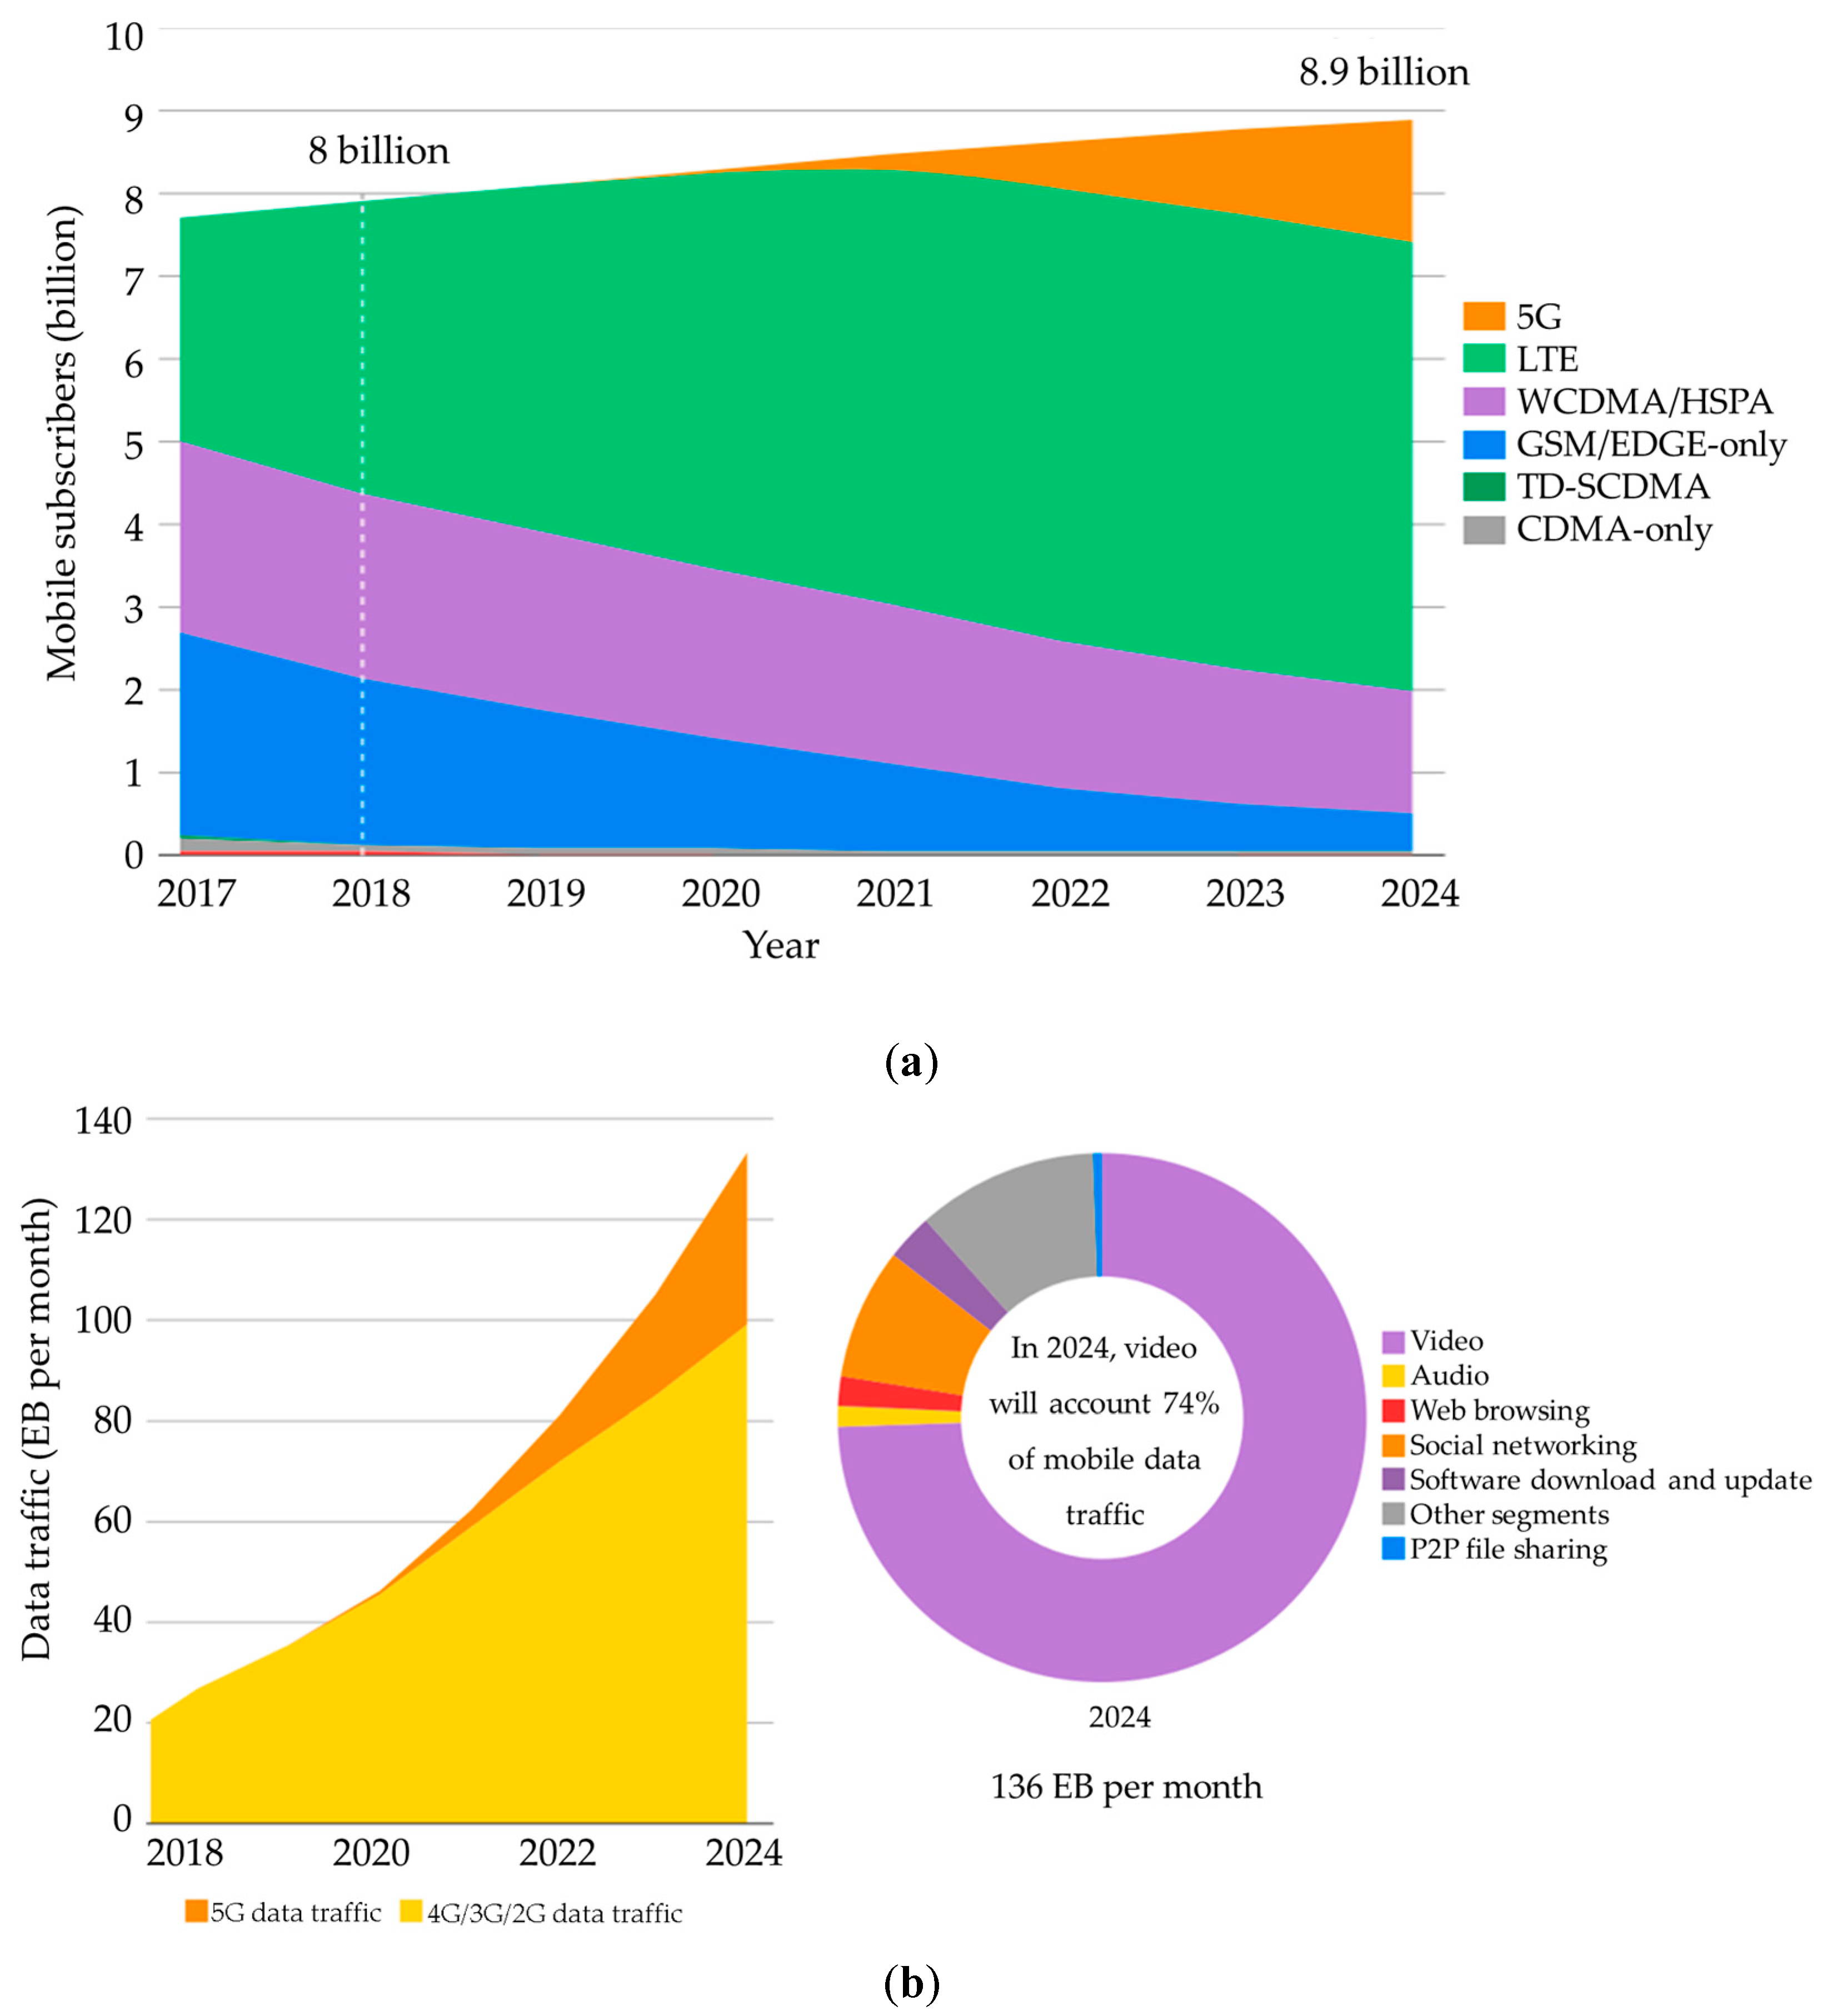
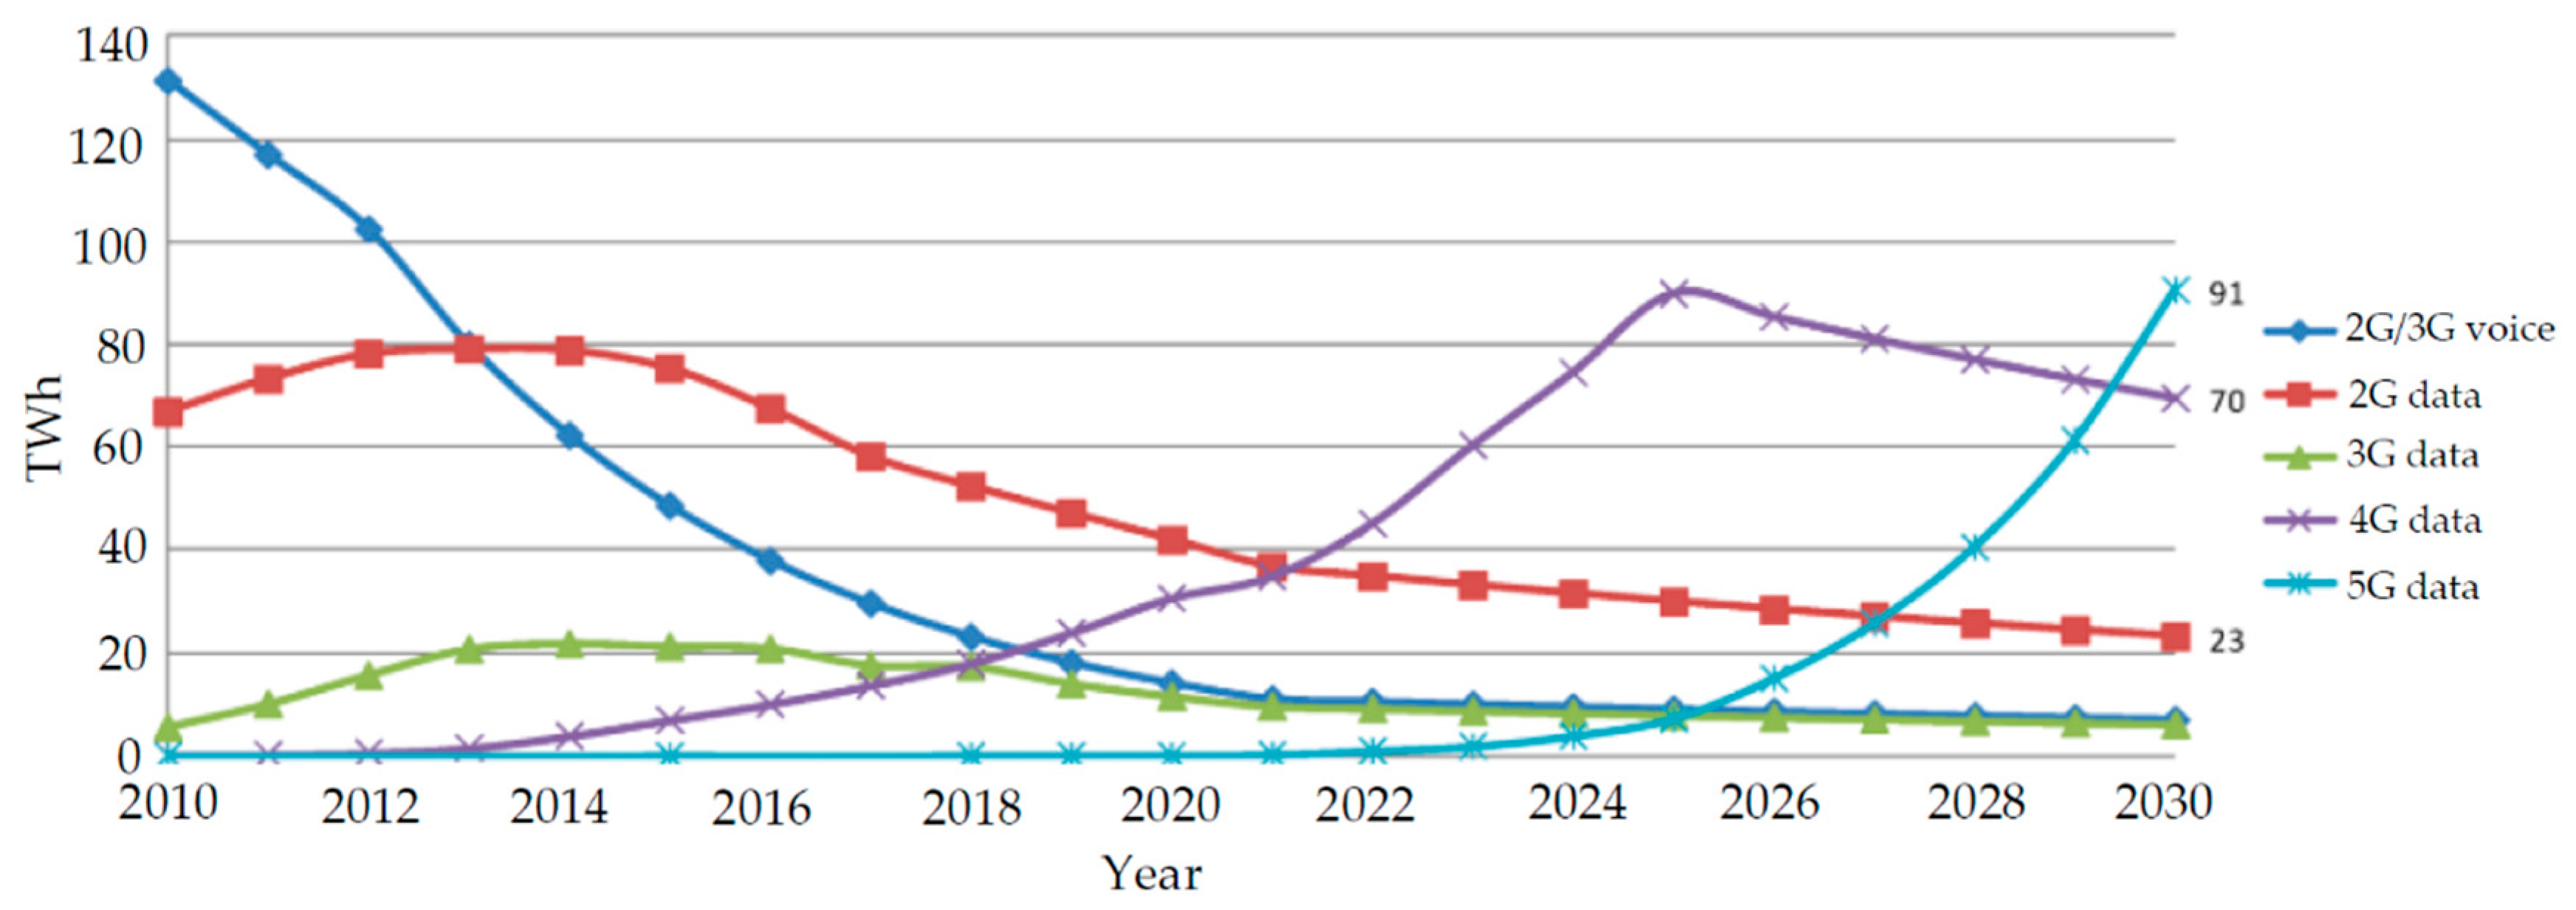
According to [13], the world’s yearly electricity usage for the telecommunications sector is increasing and expected to reach 51% of global electricity in 2030 unless the electricity efficiency of wireless access networks and access/data center networks is sufficiently improved. CNs are considered the cardinal contributor to the appreciable rise in energy utilization in the telecommunication sector [14]. Figure 2 shows the expected global electricity usage of cellular networks based on different cellular generations to 2030. BSs are the major consumer of energy in CNs and account for 57% of the total energy consumed [15]. The number of BSs worldwide is increasing, which led OPEX to rise conspicuously because a greater percentage of the OPEX entails electricity bills [16].
(ii)
CNOs contribute significantly to greenhouse gas (GHG) emissions. According to [17], the carbon dioxide (CO2) quantity emitted by the mobile sector is envisaged to increase to 179 MtCO2 by 2020, which translates to 51% of the carbon footprint of the information and communication technology (ICT) sector.
Many interesting studies [9,10,18,19,20,21] have been conducted to find a “greener” cellular network and reduce OPEX. These studies can be categorized into two main approaches: first, enhance the energy efficiency of hardware [18]; and second, intelligent management of core network elements driven by dynamic traffic load fluctuations, such as switching BSs and cell zooming [22]. However, BS switching on/off is agreed to be a justifiable approach to improve the energy efficiency for the following reasons. (i) The approach of the improving energy efficiency of the hardware entails high implementation costs. Thus, network owners must meticulously consider the operational and economic dimensions of this approach before initiating hardware replacement [9,18]. (ii) BS switching off/on schemes can be easily executed using the current network topology without hardware replacement. (iii) Out of the total energy consumption of CNs, BSs are responsible for 57% [9]. (iv) The infrastructures of CNs are fashioned to support daytime traffic. Diurnal traffic loads differ from nocturnal traffic loads. As a result, energy wastage arising because of inefficient use of resources cannot be overemphasized, especially for low traffic loads [23,24]. (v) The BS switch-off approach is a system-level approach that operates in an area covered by multiple cells, where those cells may use different radio access technologies that offer various services.
In the philosophy of the BS switching on/off technique, the BSs monitor and exploit the traffic load of the cellular network to create a trade-off between network performance and EE. This can be implemented by a dynamic BSs switching on/off strategy motivated by the traffic demand conditions. In areas where there is low traffic, it is advisable that the BSs be switched off. However, with a minimum number of BSs switched on for service provisioning, users’ coverage and the basic operations of the network can be supported.
Operations of BSs switching on/off should adopt certain operational guidelines, which should be considered for execution and evaluation along CN. The typical questions that arise are as follows: (i) Which cells should be switched off and which cells should remain active? (ii) How can we manage the cooperation between BSs via a dynamic BSs switching off/on technique? (iii) What policies do we adopt for the BSs switching implementation? (iv) Parameter-wise, which are the key ones to be considered when executing the switch-off session?

1.2. Contributions

The key contributions of this study are summarized as follows:
(i)
To propose a mechanism of cooperation between the LTE and next-generation wireless networks, such as 5G. Thereby, we create an equilibrium between network performance and EE via a 5G BSs switching off/on strategy driven by the network instantaneous traffic load demand while guaranteeing service coverage for mobile subscribers by the remaining active LTE BSs. The proposed BSs switching on/off decision-making algorithm is presented in Section 3.1.
(ii)
To determine the optimum criteria of the active LTE BSs (transmission power, the total antenna gain, bandwidth/spectrum, and SINR) that achieves the maximum coverage for the entire area during the 5G BS switch-off session.

1.3. Paper Organization

Section 2 describes the work conducted. In Section 3, the detailed system model and problem formulation are presented. Optimization programming and simulation setup are presented in Section 4. Results and a comparison with previous works are presented in Section 5 to evaluate the performance of the proposed mechanism. Section 6 gives our conclusions.

2. Related Work

A plethora of works have studied the switch-off approach. Various strategies for switching off BSs based on Universal Mobile Telecommunications System (UMTS) CNs during off-peak traffic conditions have been implemented [25,26,27]. Chiaraviglio et al. (2008) explored the likelihood of switching off some cells and BSs in the UMTS network during off-peak traffic durations, at the same time guaranteeing quality of service (QoS) constraints from the perspective of blocking probability and electromagnetic exposure limits. The researchers analyzed three kinds of scenarios: non-commercial, commercial, and hierarchical. It was shown that there was a 50% power saving in all the three scenarios utilizing BS switching. The previous work was extended by proposing a responsive network planning framework for BSs switching off/on involving uniform and hierarchical scenarios [26]. The results were extended in [27], and a realistic regular cell architecture was proposed wherein each of these configurations has a specific energy-saving ratio by turning three out of four or eight out of nine BSs off, thereby achieving an energy savings on the order of 25% to 30%. Furthermore, two energy-saving mechanisms have been proposed in [28]: (i) A greedy centralized algorithm, which is based on the concept that each BS determines which BS is fit to be switched off based on the traffic, and (ii) a decentralized algorithm involving an individual BS locally estimating its traffic load and making independent decisions as to whether it will be switched off. Gong et al. (2010) adopted a dynamic switch on/off algorithm motivated by blocking probabilities. The BSs switched off are moderated based on the traffic variation with regards to a blocking probability constraint [29]. Xiang et al. (2011) analyzed the minimal number of active BSs that will be utilized based on the balance between fixed and dynamic powers [30]. Lorincz et al. (2012) proposed a new UMTS cellular access network energy-saving optimization model [31]. Using the average distance among BSs and UEs as a decision-making metric, Bousia et al. (2012) proposed an algorithm in which the BSs with maximum average distance will be switched off [32].
This study proposes an approach to cooperation between the LTE and 5G technologies, which aims to strike an equilibrium between network performance and energy savings via switching off/on the 5G BSs influenced by instantaneous load traffic, ensuring the service coverage of the remaining mobile subscribers by the remaining active LTE BSs.

3. System Model and Problem Formulation

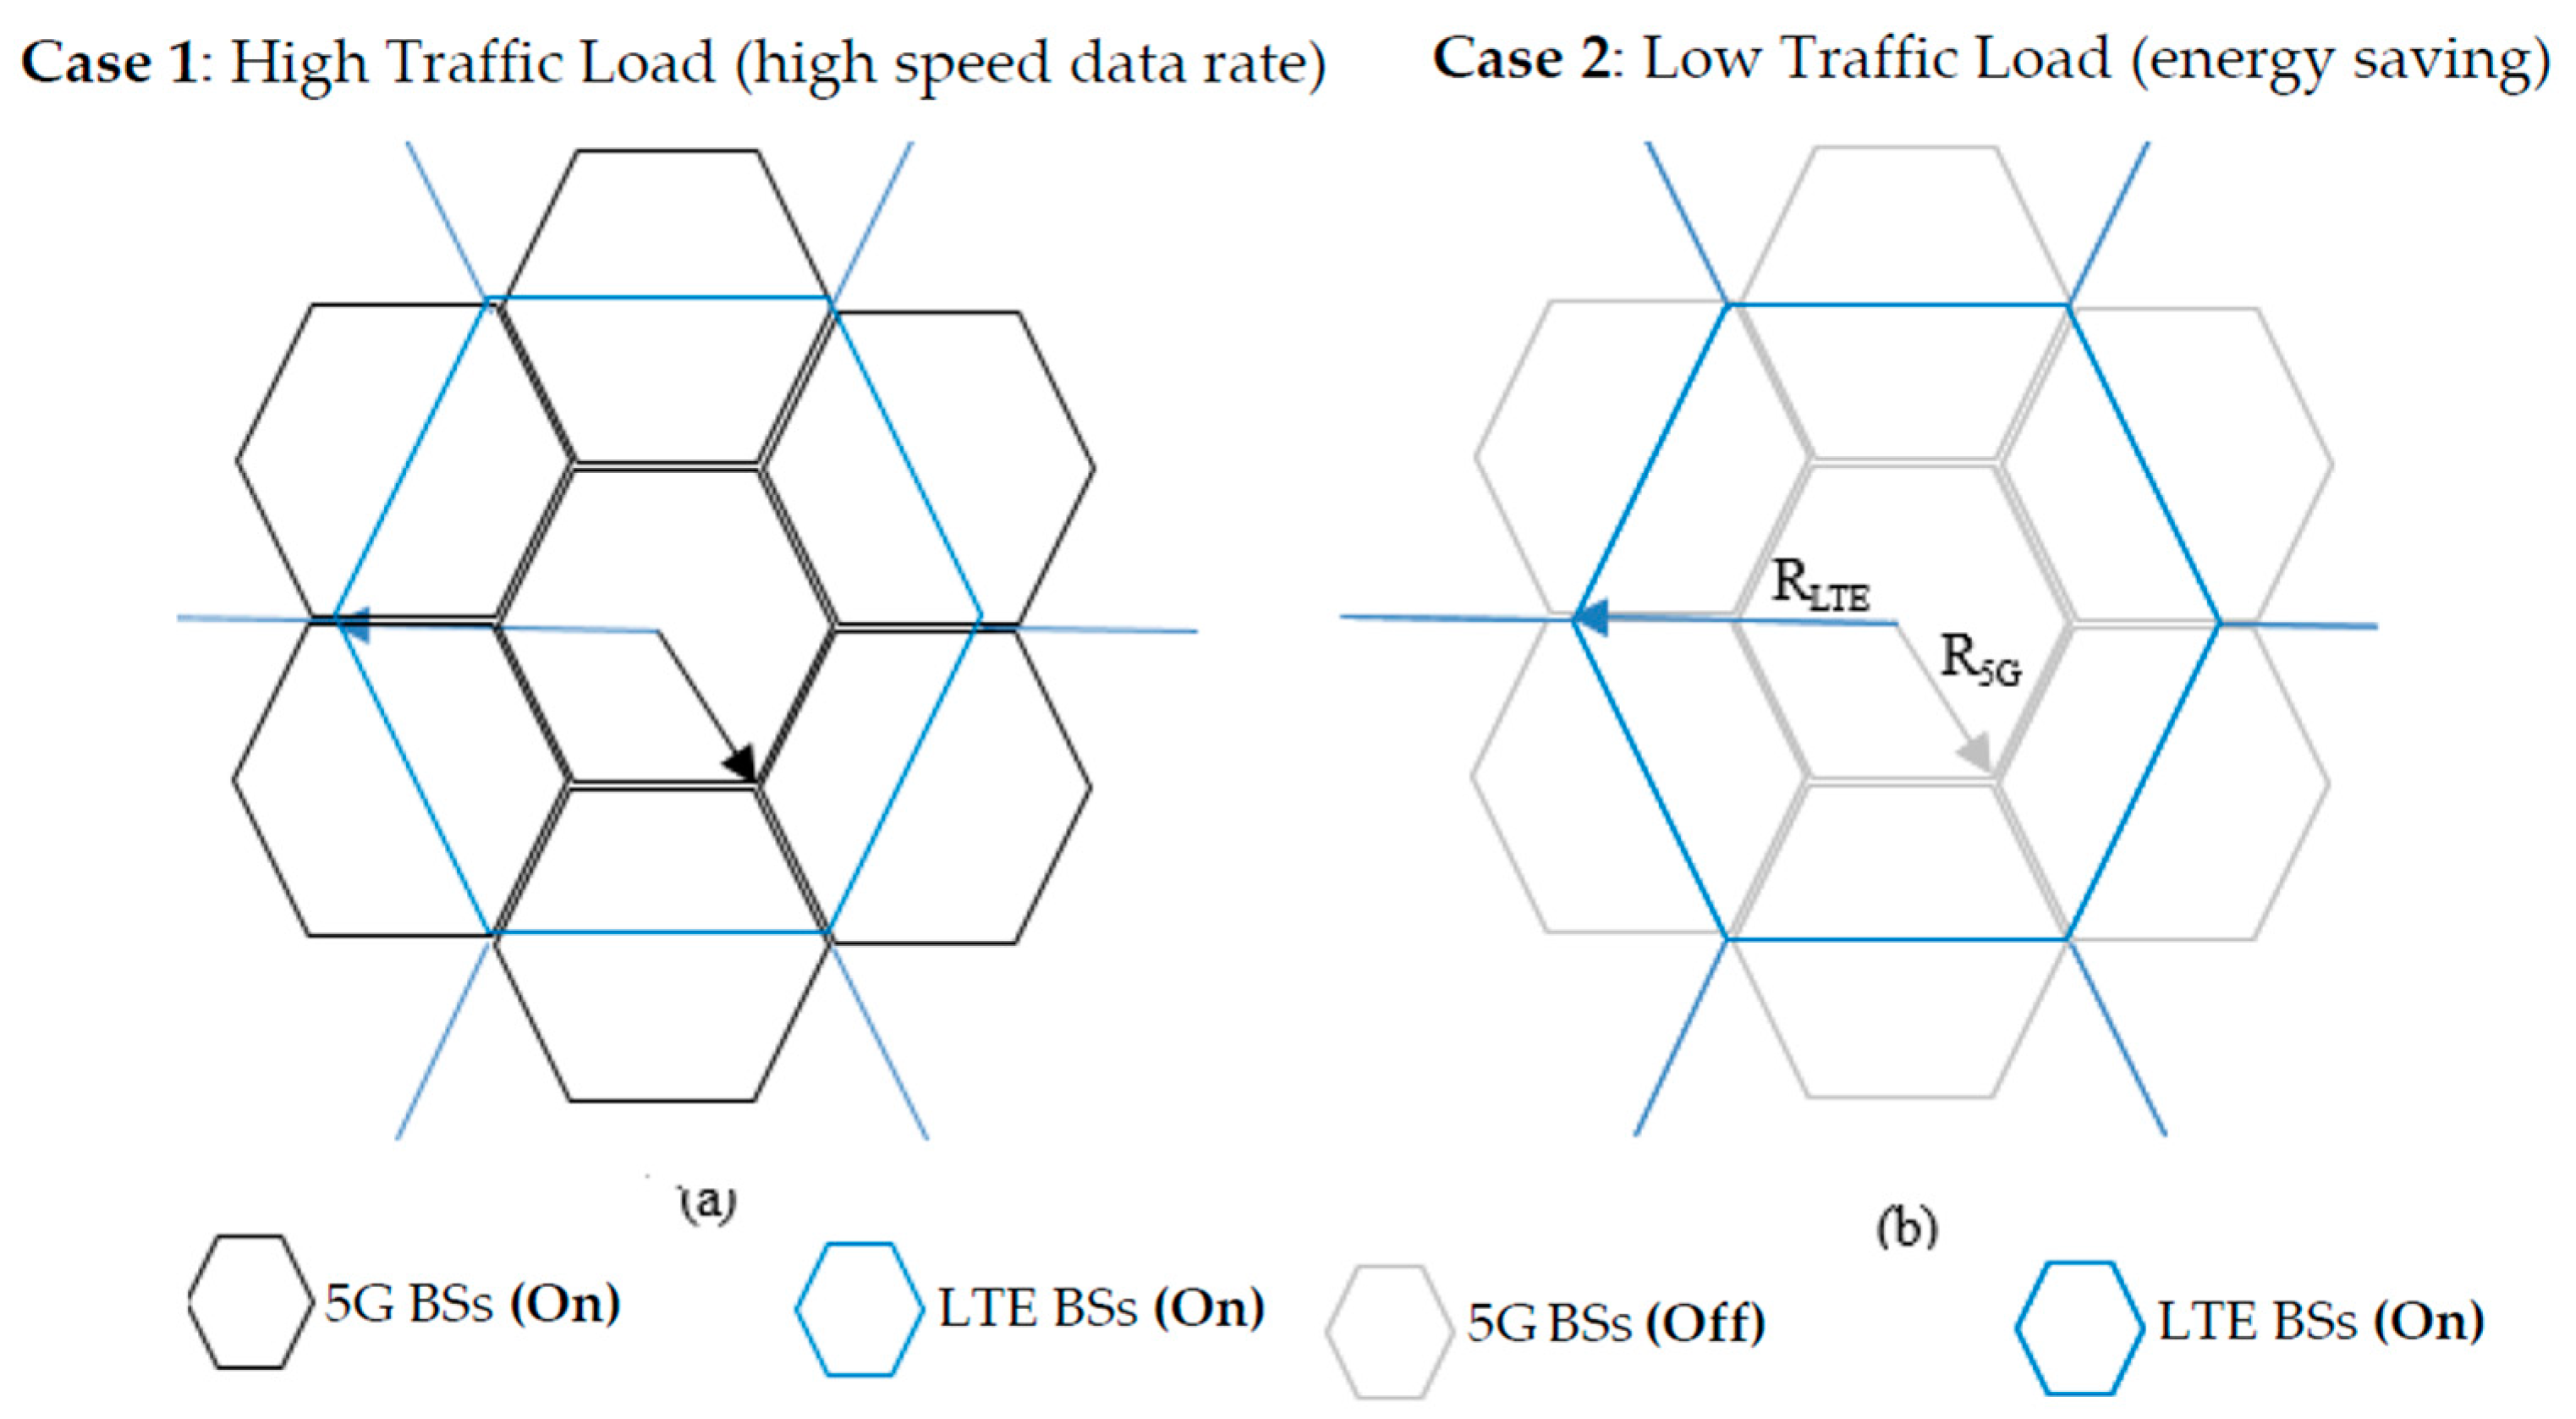
3.1. System Model and Proposed BSs Switching On/Off Mechanism

This section describes a cooperation management algorithm involving the LTE and 5G networks, motivated by a responsive dual radio access technology (RAT) BSs switching off/on approach that considers the cell coverage and energy savings. The cellular network topology model considered in this study is shown in Figure 3, wherein the 5G small cells are integrated with the existing LTE macrocell. Every seven 5G small cells are covered by one LTE macrocell. In addition, all the cells in the network are connected via a switching off/on server that is located in the central office. The questions that may arise in the proposed approach are: (i) How do we identify the cells that should be switched off, and those that should remain active? (ii) What key performance indicators (KPIs) for BSs switching scheme should be adopted? (iii) What is the mechanism for the switching scheme of BSs? (iv) What KPIs should be considered during the switch-off session? (v) During a switch-off session, is there enough radio coverage for guaranteed QoS considering a given cell?
Basically, the idea behind the proposed algorithm is to exploit the coexistence between LTE and 5G and achieve an equilibrium between network performance and EE through a dynamic BS switching off/on approach based to the traffic demand conditions. Figure 4 depicts a real-world wireless CN traffic profile, as reported in [33]. The traffic profile during the day is higher than that of the night. The high traffic load ranges between 0.4 and 1, and occurs between 10 a.m. and 11 p.m. (13 h). The low traffic load ranges between 0 and 0.4, and occurs between 11 p.m. and 10 a.m. (11 h).
During the off-peak period, a 5G BS is expected to be switched off while the remaining active LTE BSs will provide coverage for users, as well as support the basic operations of the network. However, the BS switching off/on paradigm is expected to adhere to certain guidelines. The guidelines are expected to consider execution, evaluation, and energy utilization. The operational BS off/on decision is subject to three parameters: (i) Maintaining the high-speed packet requirement for mobile users during peak periods; (ii) switching on the smallest possible number of neighboring cells during low traffic, which guarantees an appreciable reduction in the energy used; and (iii) ensure adequate wireless coverage to neighboring cells, while maintaining coverage during switch-off sessions. The details will be given in the following subsections.

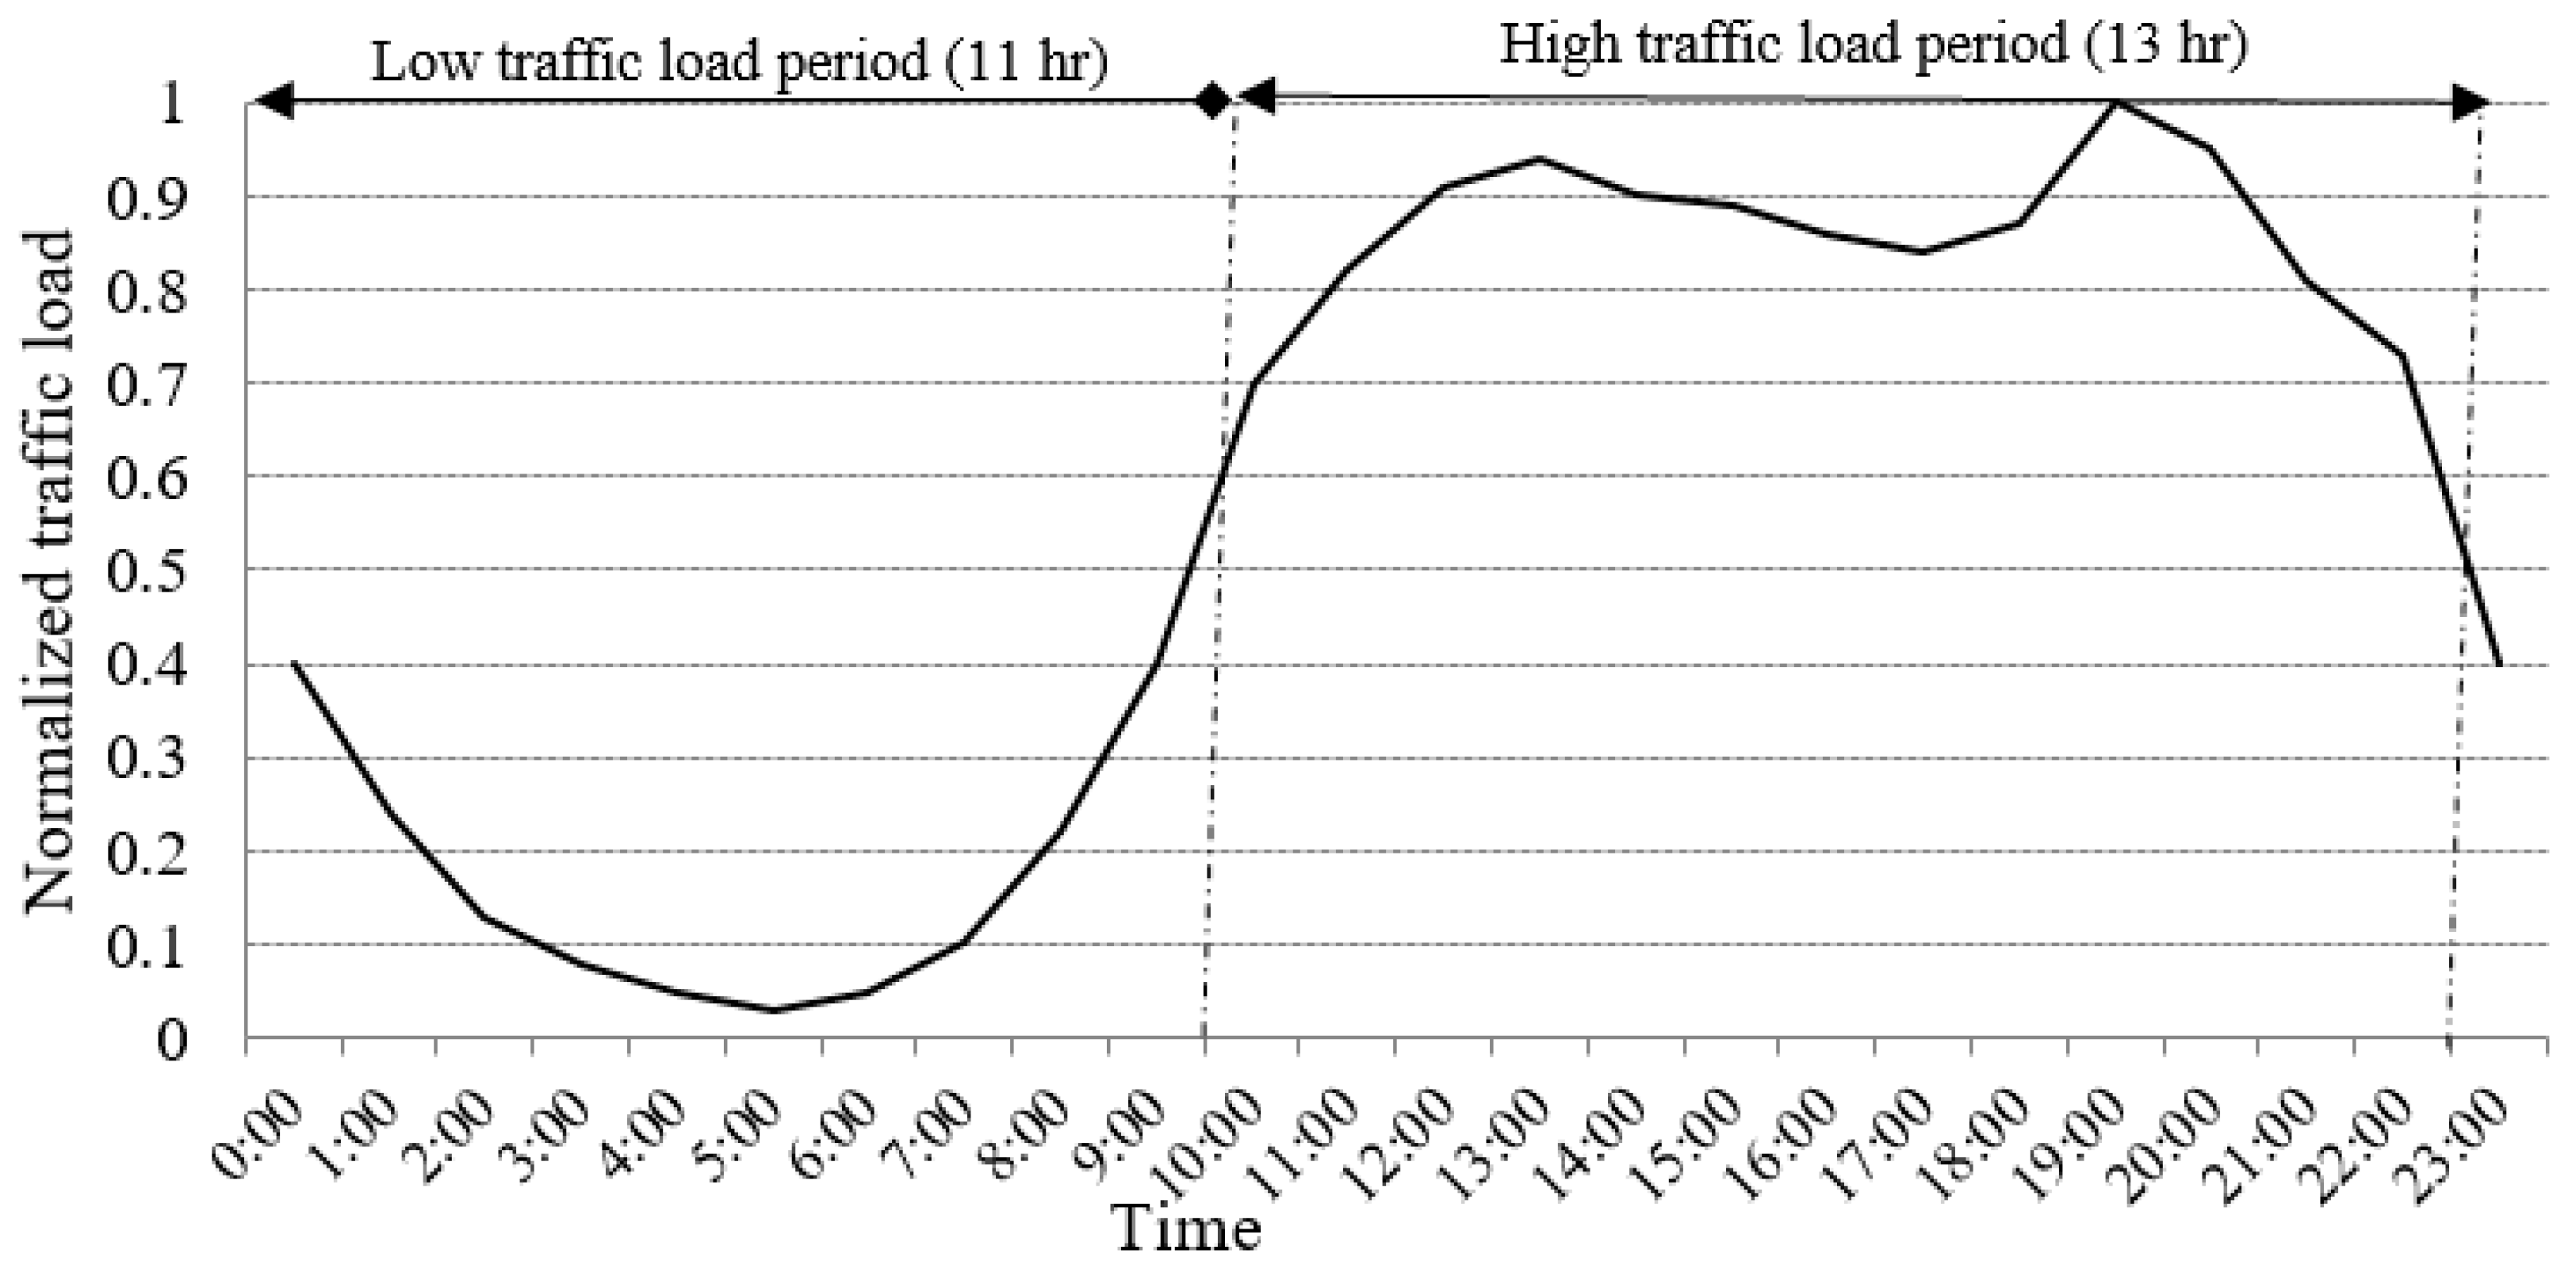
3.1.1. High Traffic Load (0.4 < λ ≤ 1)

Mobile users’ demand can be summarized as a high data rate with QoS and full radio frequency coverage. Hence, in order to meet subscribers’ QoS expectations, all BSs inclusive of LTE and 5G are required to be active and functional. This will lead to the provisioning of optimal network performance meeting mobile subscribers’ expectations. Priority should be given to 5G cells because of the small cells involved. 5G BSs should perform traffic monitoring periodically, along with data delivery. This will enable the 5G BSs to switch off in case the mobile wireless traffic load decreases under a certain threshold, λ ≤ 0.4, and remains under the threshold for a certain period. This denotes the low mobile wireless traffic use case (energy-saving case). However, LTE BSs are active in a high traffic case to assist 5G BSs with the provisioning of extra coverage to subscribers.

3.1.2. Low Traffic Load (0 < λ ≤ 0.4)

The goal is to strike an equilibrium among network performance and EE. In this scenario, the 5G BSs will be switched off, with the assurance that the service and coverage for users will be protected by the LTE BSs, which can meet the demand of data speed rates of subscribers with 100 Megabits per second (Mbps) and can increase up to 1 Gigabit per second (Gbps) via carrier aggregation and bandwidth extensions of up to 100 MHz.

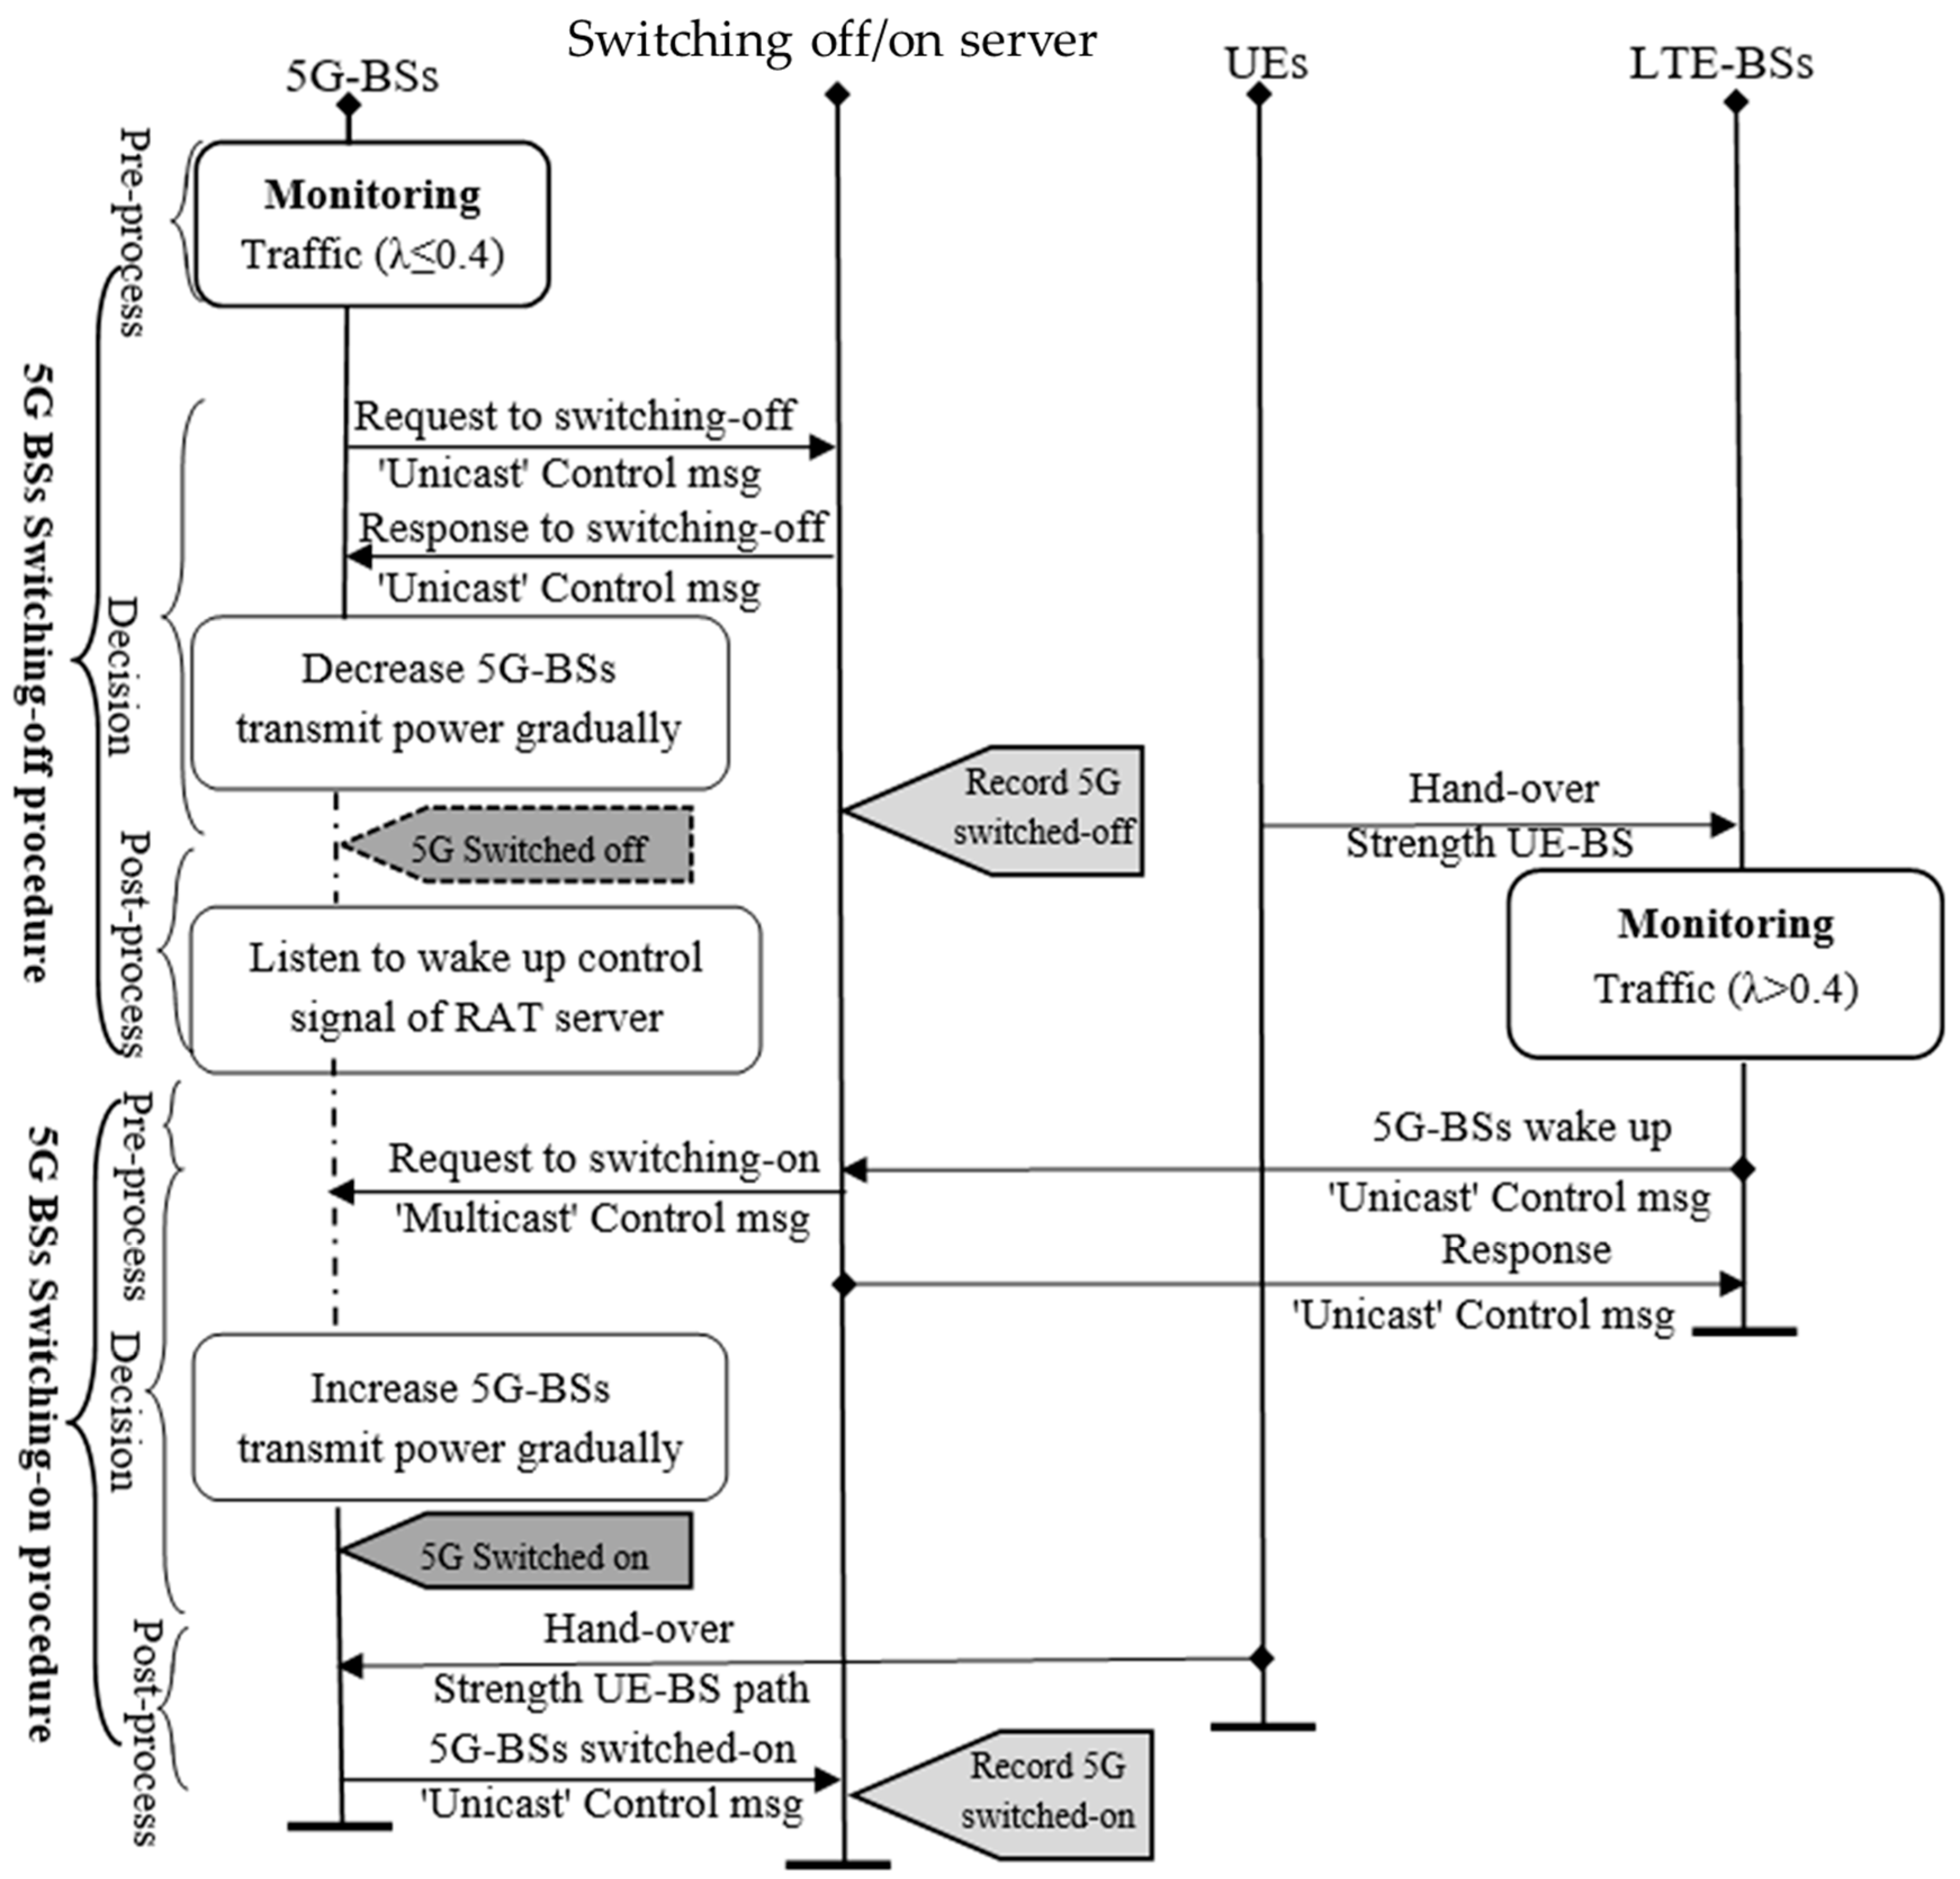
5G BSs Switch-Off Procedures

The 5G BSs switch-off strategies entails three steps: (i) pre-processing status; (ii) decision status; and (iii) post-processing status. Figure 5 summarizes these steps. In addition, the details of the 5G BSs switch-off procedures are provided in the following points.
(i)
Pre-processing Status: The 5G BS is assigned with the task of monitoring the generated traffic load often (e.g., every few minutes) and decides if it would be best, performance-wise, to turn off 5G BSs, depending on the given traffic load. In situations where the traffic load decreases below a given benchmark (λ ≤ 0.4) and remains below it for a specific duration, then the 5G BSs switch-off decision algorithm can be executed. The 5G BSs are the sole determinant of this information.
(ii)
Decision Status: At the onset, a unicast control signal is sent from the 5G BSs to the switching off/on module located in the central office requesting that they be switched off. On the receipt of a go-ahead response signal from the module, the 5G BSs initiate a gradual decrease in their transmission power mechanism that will ultimately result in a switch-off. Meanwhile, UEs that are in control of the switched-off 5G BSs are reassigned to active LTE BSs within the neighborhood. Of course, this will be determined by the signal strength. This procedure is akin to the current handover scheme, the only difference being that this involves handing over group of UEs other than a single UE. Considerable research has been performed on group handovers. Most of the relevant studies targeted the support of commuters on mass transit systems like buses and trains. There might be a need for a strategy to predict the group handover a priori. In this case, one of the current group handover techniques [34], in conjunction with our proposed switching-off algorithm, may be adopted for the implementation of our group handover policy.
(iii)
Post-processing Status:The 5G BSs that are switched off listen for the wake-up control signal from the switching off/on server.. Meanwhile, the active LTE BSs are in full functionality and are capable of supplying subscribers’ QoS requirements. In addition, LTE BSs are mandated to monitor traffic across the network based on LTE BSs’ information, which is based on the decision to keep the 5G BSs off or start switching them on if the traffic increases to more than 0.4.
The primary objective of CNOs is solving coverage issues as well as guaranteeing wireless service coverage for cell membership areas in switched-off mode. The mathematical details and the associated conceptual work meant to tackle the cell coverage optimization problems will be discussed in Section 3.2.

II. 5G BSs Switching-On Procedures

Reverse switching-off algorithm is one of the techniques to execute the 5G BSs’ switching-on algorithm. The philosophy behind the switching-on algorithm is that each of the 5G BSs should be switched on if the system traffic load reaches the original value before they were switched off. Incapacitated by the lack of global system information, the switched-off 5G BSs are not able to undertake a switch-on decision. As a result, an alternate route is to rely on LTE BSs measurements with reference to the instantaneous traffic load as well as the switching-off/on module control signal. Just like the switching-off algorithm already discussed, the switching-on algorithm is tripartite, as discussed and shown below in Figure 5.
(i)
Pre-processing Status: In this phase, it is the duty of the LTE BSs to continuously monitor the generated traffic load and make a decision on whether the 5G BSs should be switched on or off. If the current load is more than the stated threshold of 0.4 and stays over the threshold for a given duration, it is plausible to invoke the 5G BSs switching-on decision. This decision is solely dependent on LTE BSs signal information.
(ii)
Decision Status: Having analyzed the instantaneous traffic load, the LTE BSs initiate a unicast control signal to be sent to the switching-off/on module, requesting that the 5G BSs be switched on. After the traffic load has been analyzed and the switching-off/on module deems it necessary, multicast signals are then transmitted to wake up the 5G BSs’ control signals. Next, the 5G BSs begin to gradually increase their transmission power and, subsequently, propagate a unicast signal to the switching-off/on module containing the response to the switch-on request. Using the signal strength paths metrics, the UEs serviced by the LTE BSs are handed over to the active 5G BSs (small cells). This transfer is solely determined by the signal strength path of the UE_BS. Meanwhile, LTE BSs remain active to support the 5G BSs while guaranteeing coverage and radio services.
(iii)
Post-processing Status: In this status, there is a role reversal in which the post-processing phase of the switching-on algorithm assumes the role and duties of the pre-processing state of the switching-off algorithm already discussed. In this phase, the 5G BSs become active and continue the task of monitoring the UE load traffic.

3.2. Problem Formulation and Mathematical Modeling

3.2.1. Propagation Channel Model

The properties of the received signal are affected by three attributes, small-scale fading-multipath, large-scale path fading-shadowing, and propagation path loss. Hence, an all-inclusive received power (Prx) propagation model can be written as follows [35]:
Pr = Ptx + GPLossσ,
where Ptx, G, PLoss, σ, denote device transmitted power, total antenna gains, path loss, shadow fading margin, respectively.

LTE Path Loss Model

The path loss model utilized herein is the 3GPP Urban Macro (Uma-NLOS propagation model for the channels between BSs and UEs [36]. The model consists of: the frequency (f), BS antenna height (hBS), UE antenna height (hUE), average building height (hbl), street width (wst), and radius (R) in meters. The function is given as follows:
P L = 161.04 7.1 log 10 ( w s t ) + 7.5 log 10 ( h b l ) ( 24.37 23.7 ( h h B S ) 2 ) × log 10 ( h B S ) + ( 43.42 3.1 log 10 ( h B S ) ) × ( log 10 ( R ) 3 ) + 20 log 10 ( f ) ( 3.2 ( log 10 ( 11.75 h U E ) ) 2 4.97 )

II. 5G Path Loss Model

The modified Stanford University Interim (SUI) path loss model (PL_mod_SUI) for a frequency of 28 GHz for Non-Line of Sight (NLOS) is proposed, as given in Equation (3). This mathematical model (the modified SUI path loss model) is constructed based on extensive empirical measurements [37].
PL_mod_SUI(d) = αNLOS × (PL_SUI(d) − PL_SUI(do)) + PL(do) + Xσ,
where αNLOS is the mean slope correction factor, obtained directly from the NLOS empirical results; PL_SUI(d) is an original SUI model at a distance d; PL_SUI(do) is an original SUI model at a reference distance do; PL(do) represents free space path loss (dB) in close-in reference distance do; and Xσ is a typical lognormal random shadowing with variable mean of (0dB) and standard deviation (σ). The original SUI model PL_SUI(d) for a frequency above 2 GHz is [37]
PL_SUI(d) = PL(do) + 10nlog10(d/do) + Xfc + XRX + Xσ,
where
P L ( d o )   =   20 log 10 ( 4 Π d o λ )
n = a b h T X + C h T X
X f c = 6 log 10 ( f M H z 2000 ) X
X R X = 10.8 log 10 ( h R X 2 ) .
λ denotes carrier wavelength (m); Xfc and XRX signify the correction factors for frequency and receiver heights, respectively; fMHz denotes carrier frequency (MHz); and hTX and hRX denote the transmitter and receiver antenna heights in meters, respectively. The parameters a, b, and c are constants that are service area. The SUI terrain type A is considered, with parameters given as a = 4.6, b = 0.0075, and c = 12.6 [37].
Cellular cell coverage area is defined as the fraction of the area within a cell receiving signal power above a given minimum, Pmin. In reality, signal degradation factors of random shadowing and path loss will lead to some cell portions having a received power below Pmin. Given by [38],
Pmin = NoBW + Nf + SINR + IM,
where NoBW connotes thermal noise level assigned for a specified noise bandwidth; Nf is the receiver noise figure; while IM connotes implementation margin.

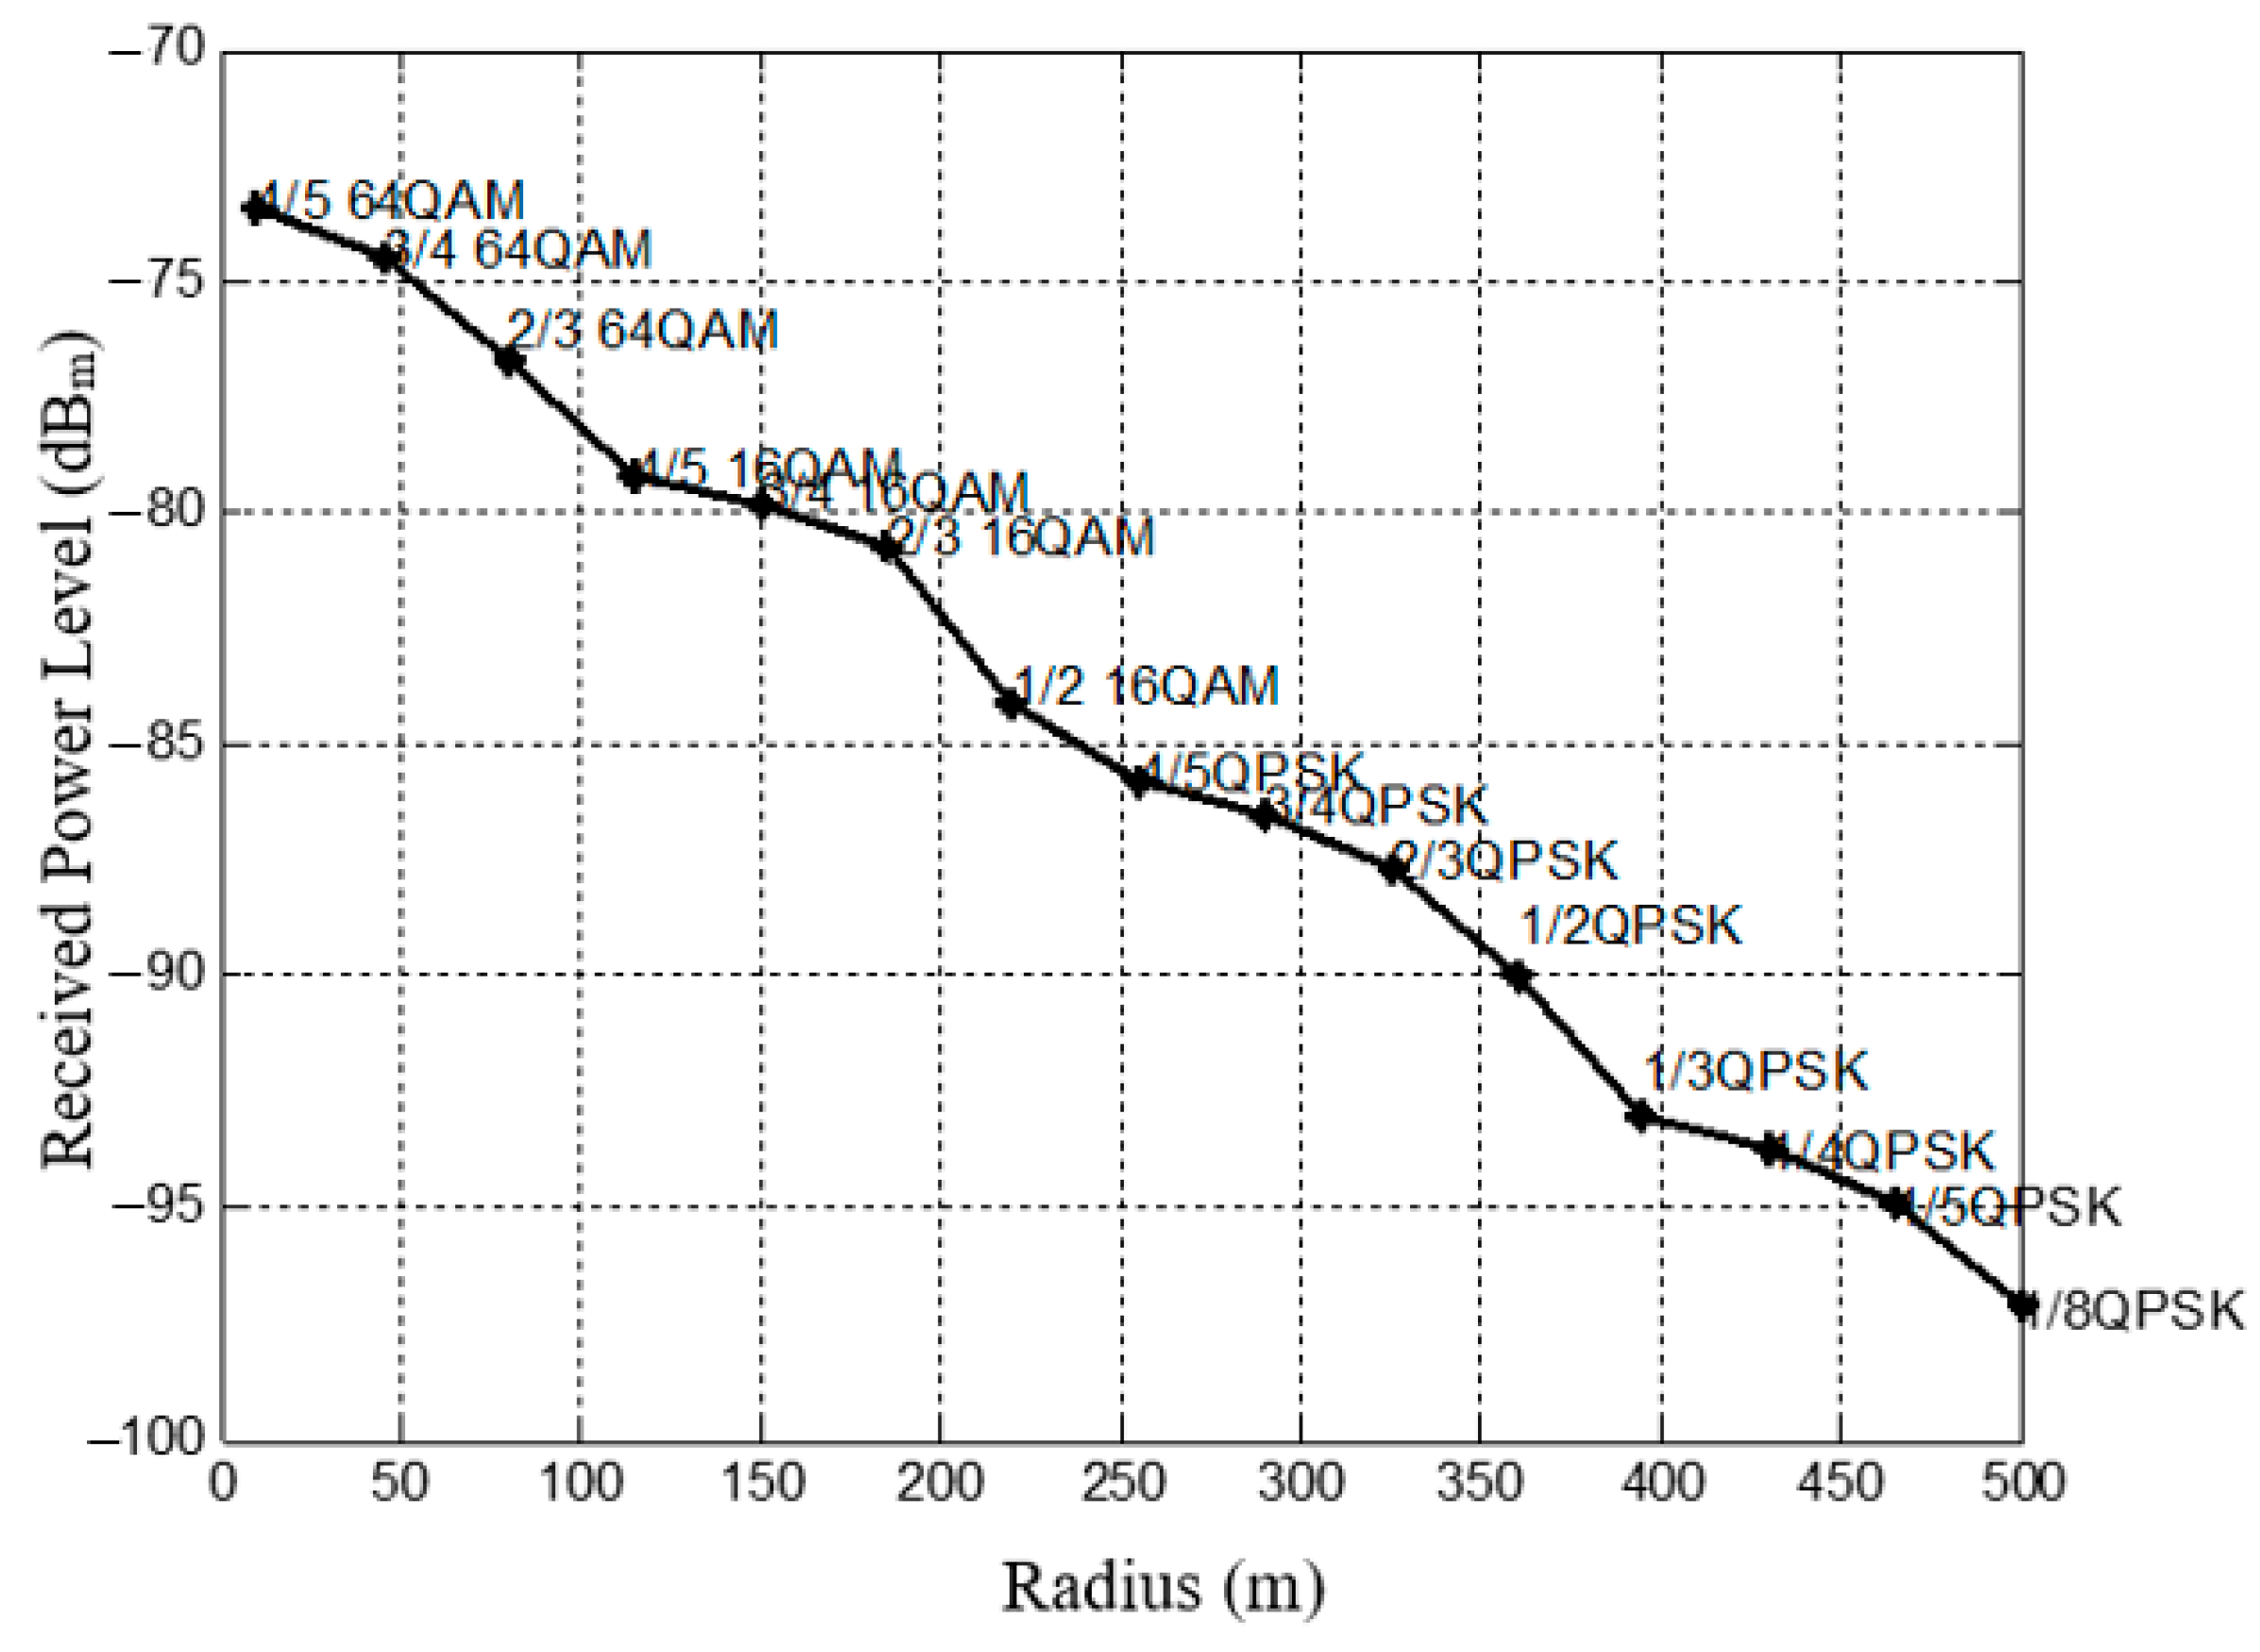
3.2.2. Cell Coverage
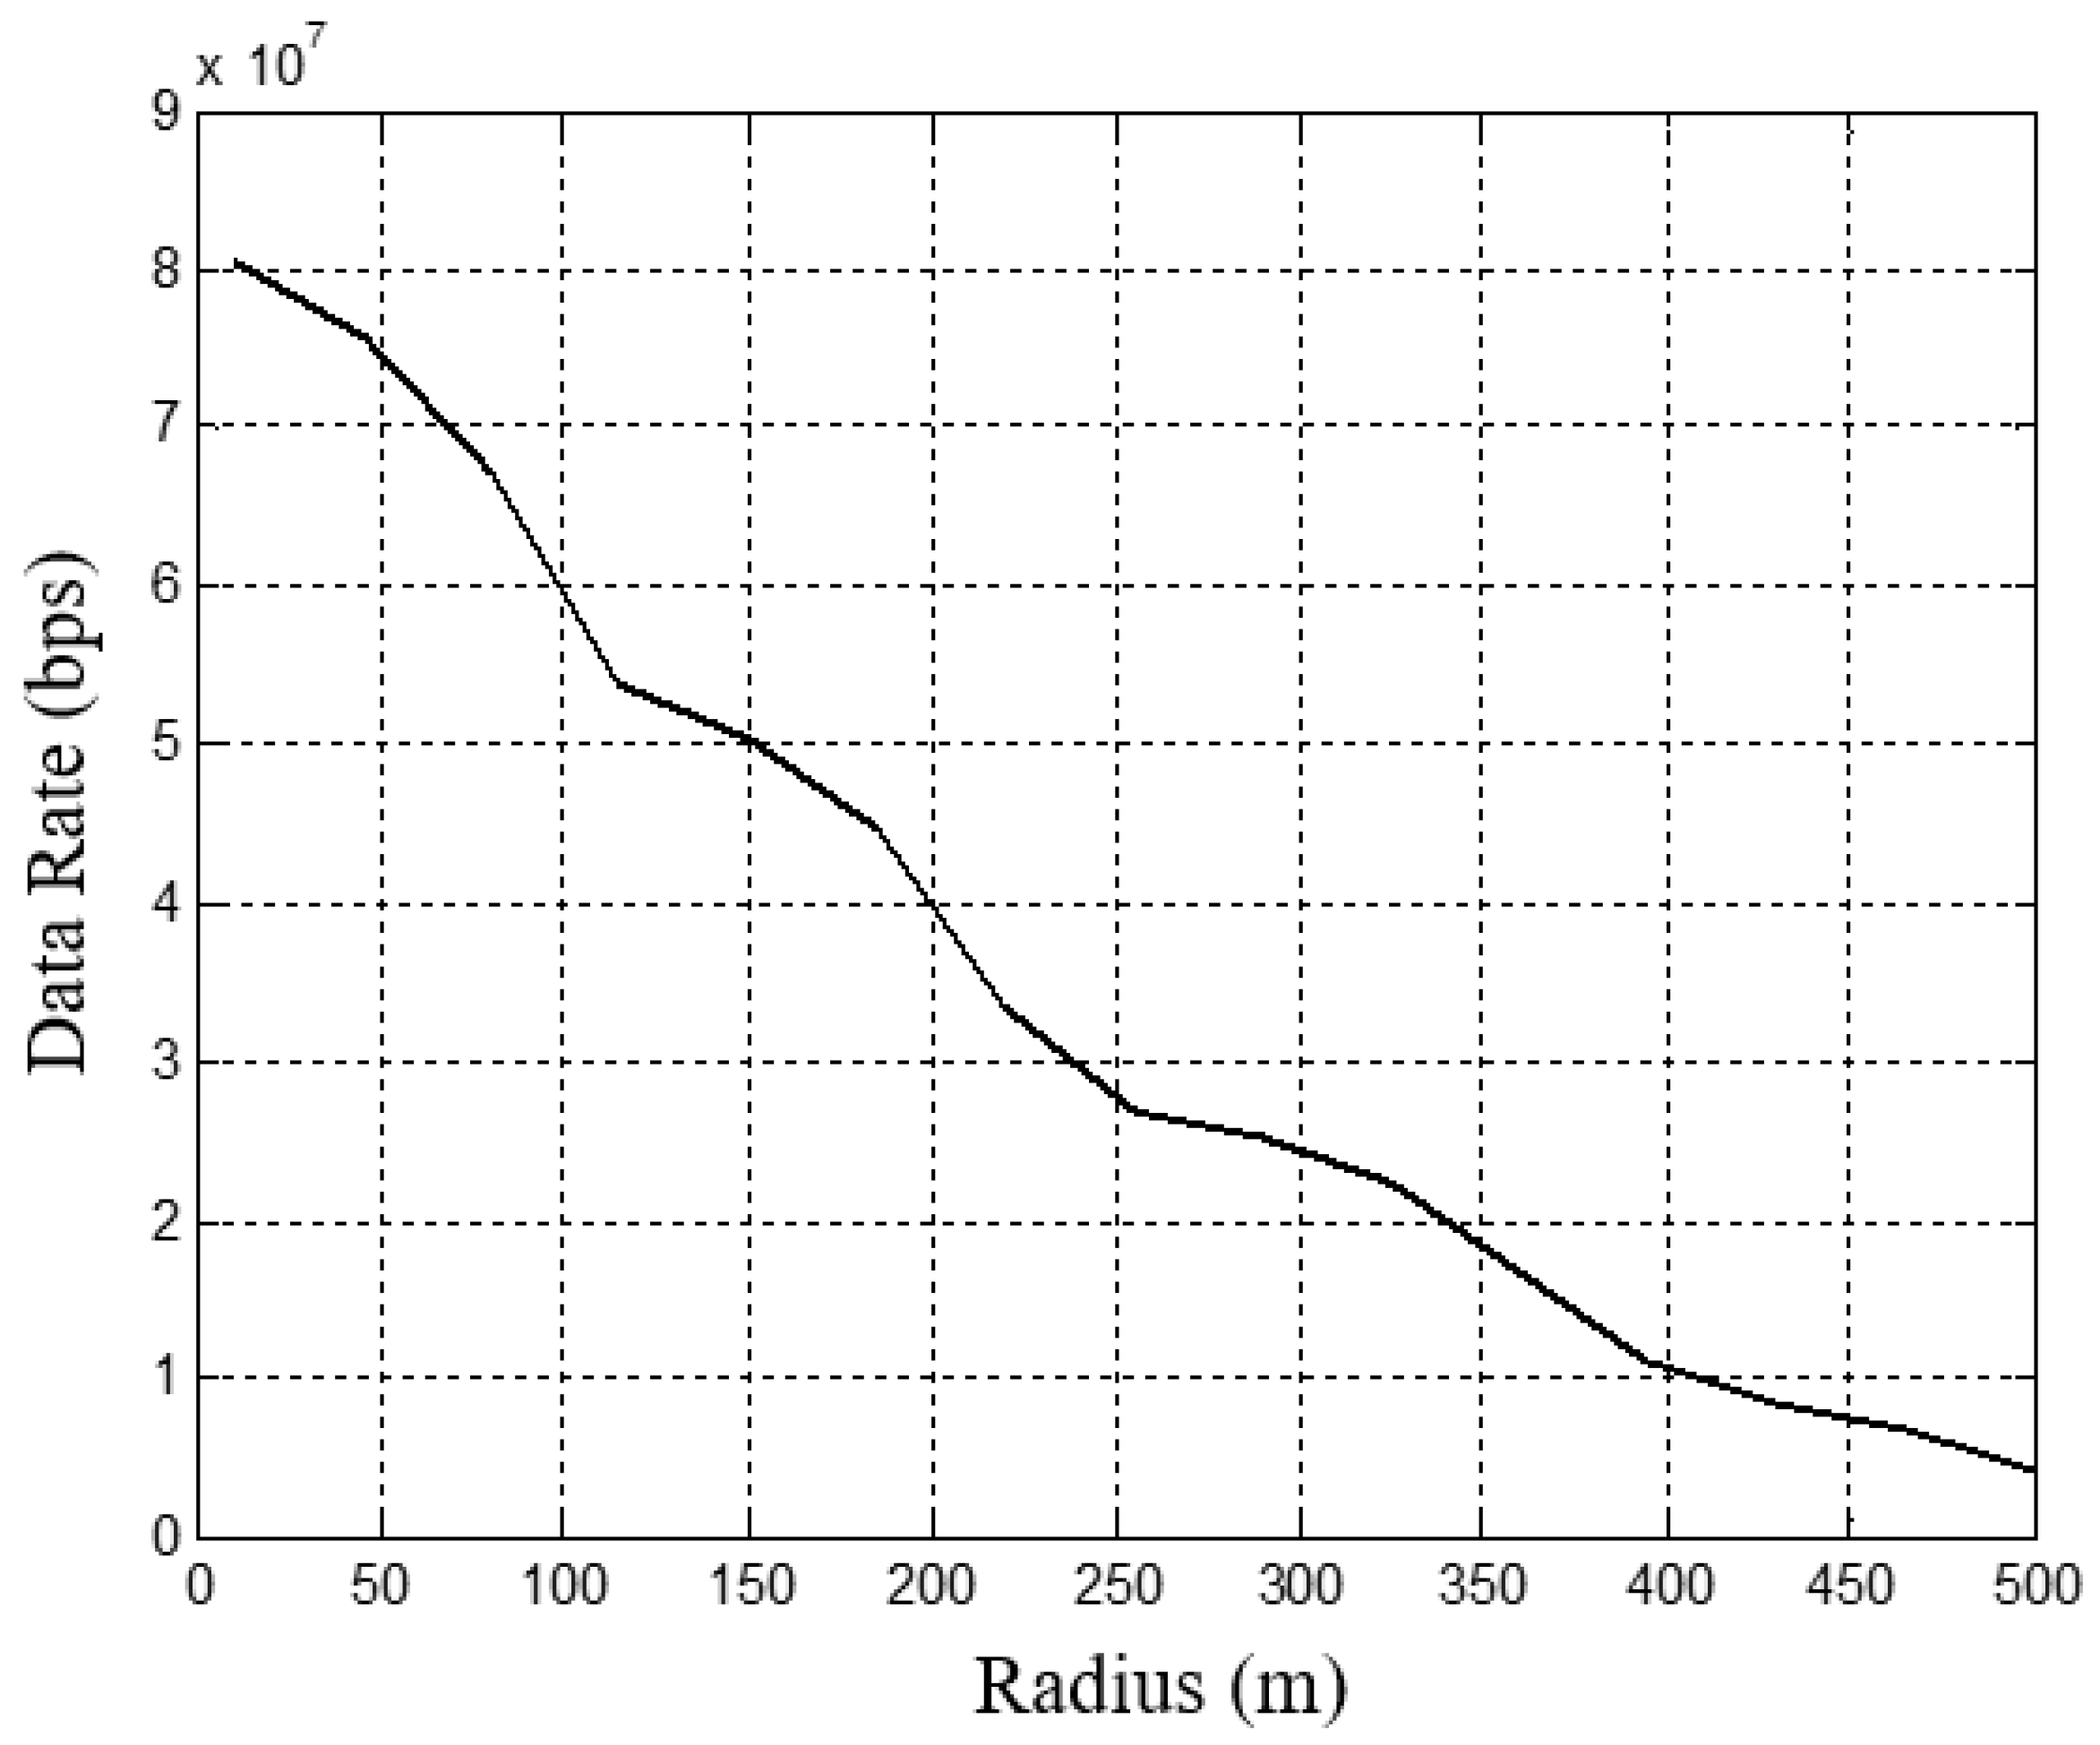
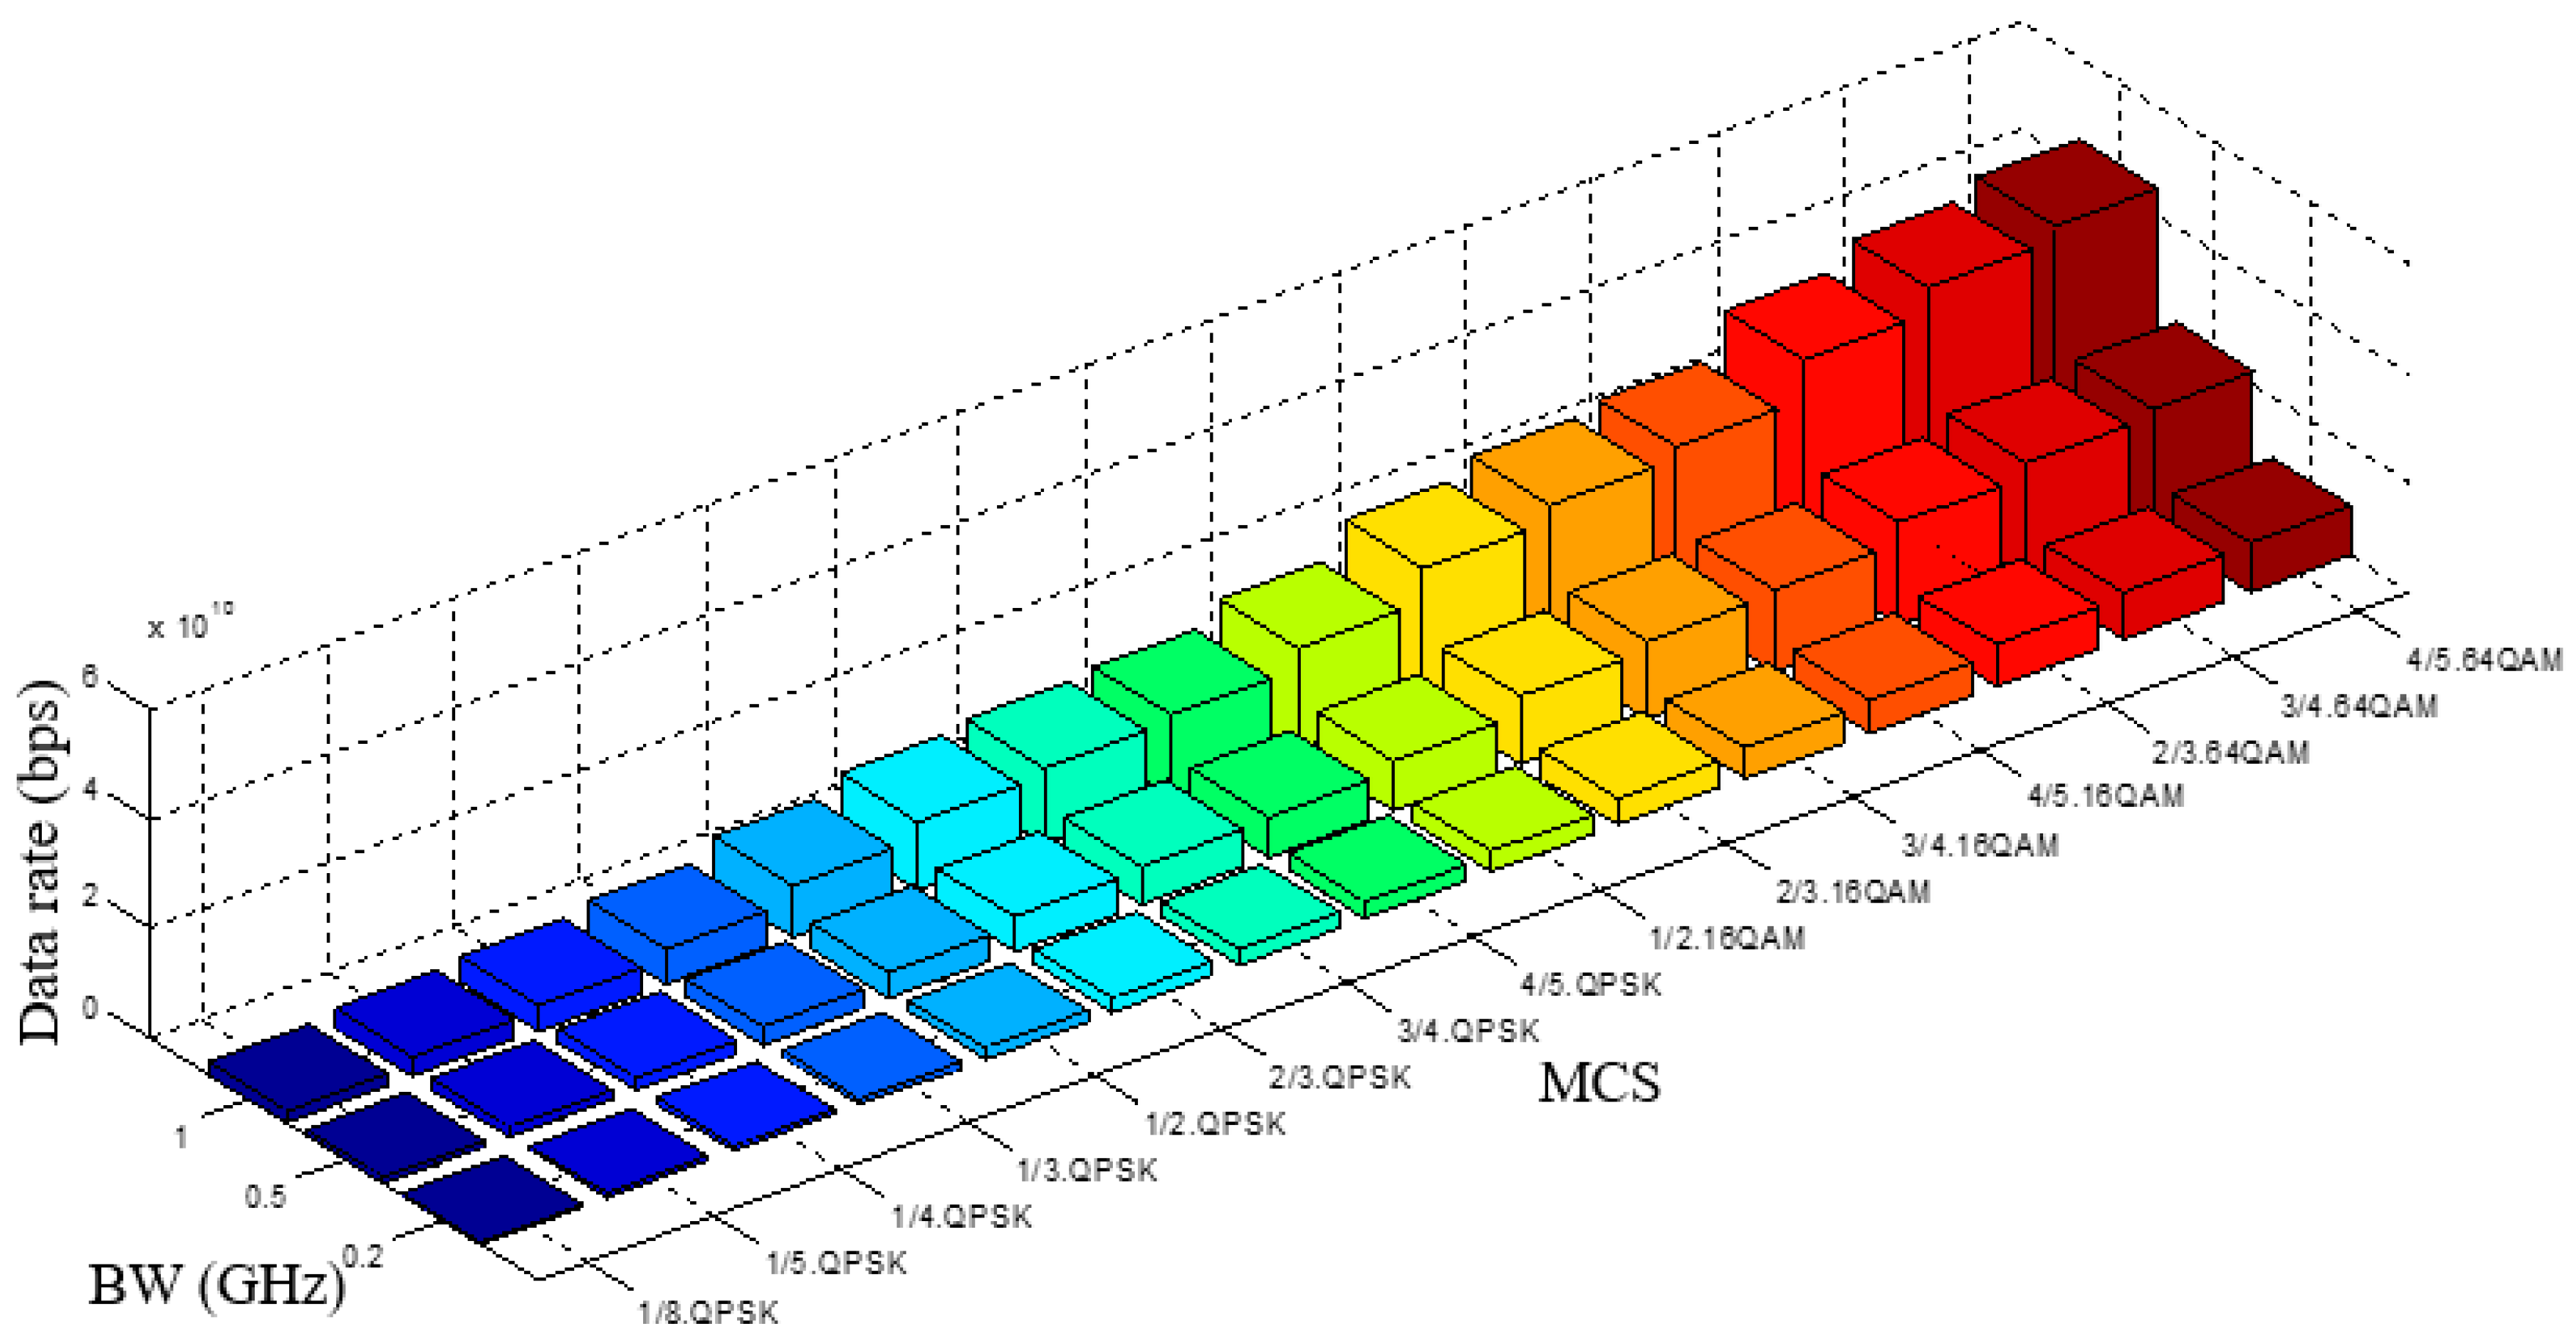
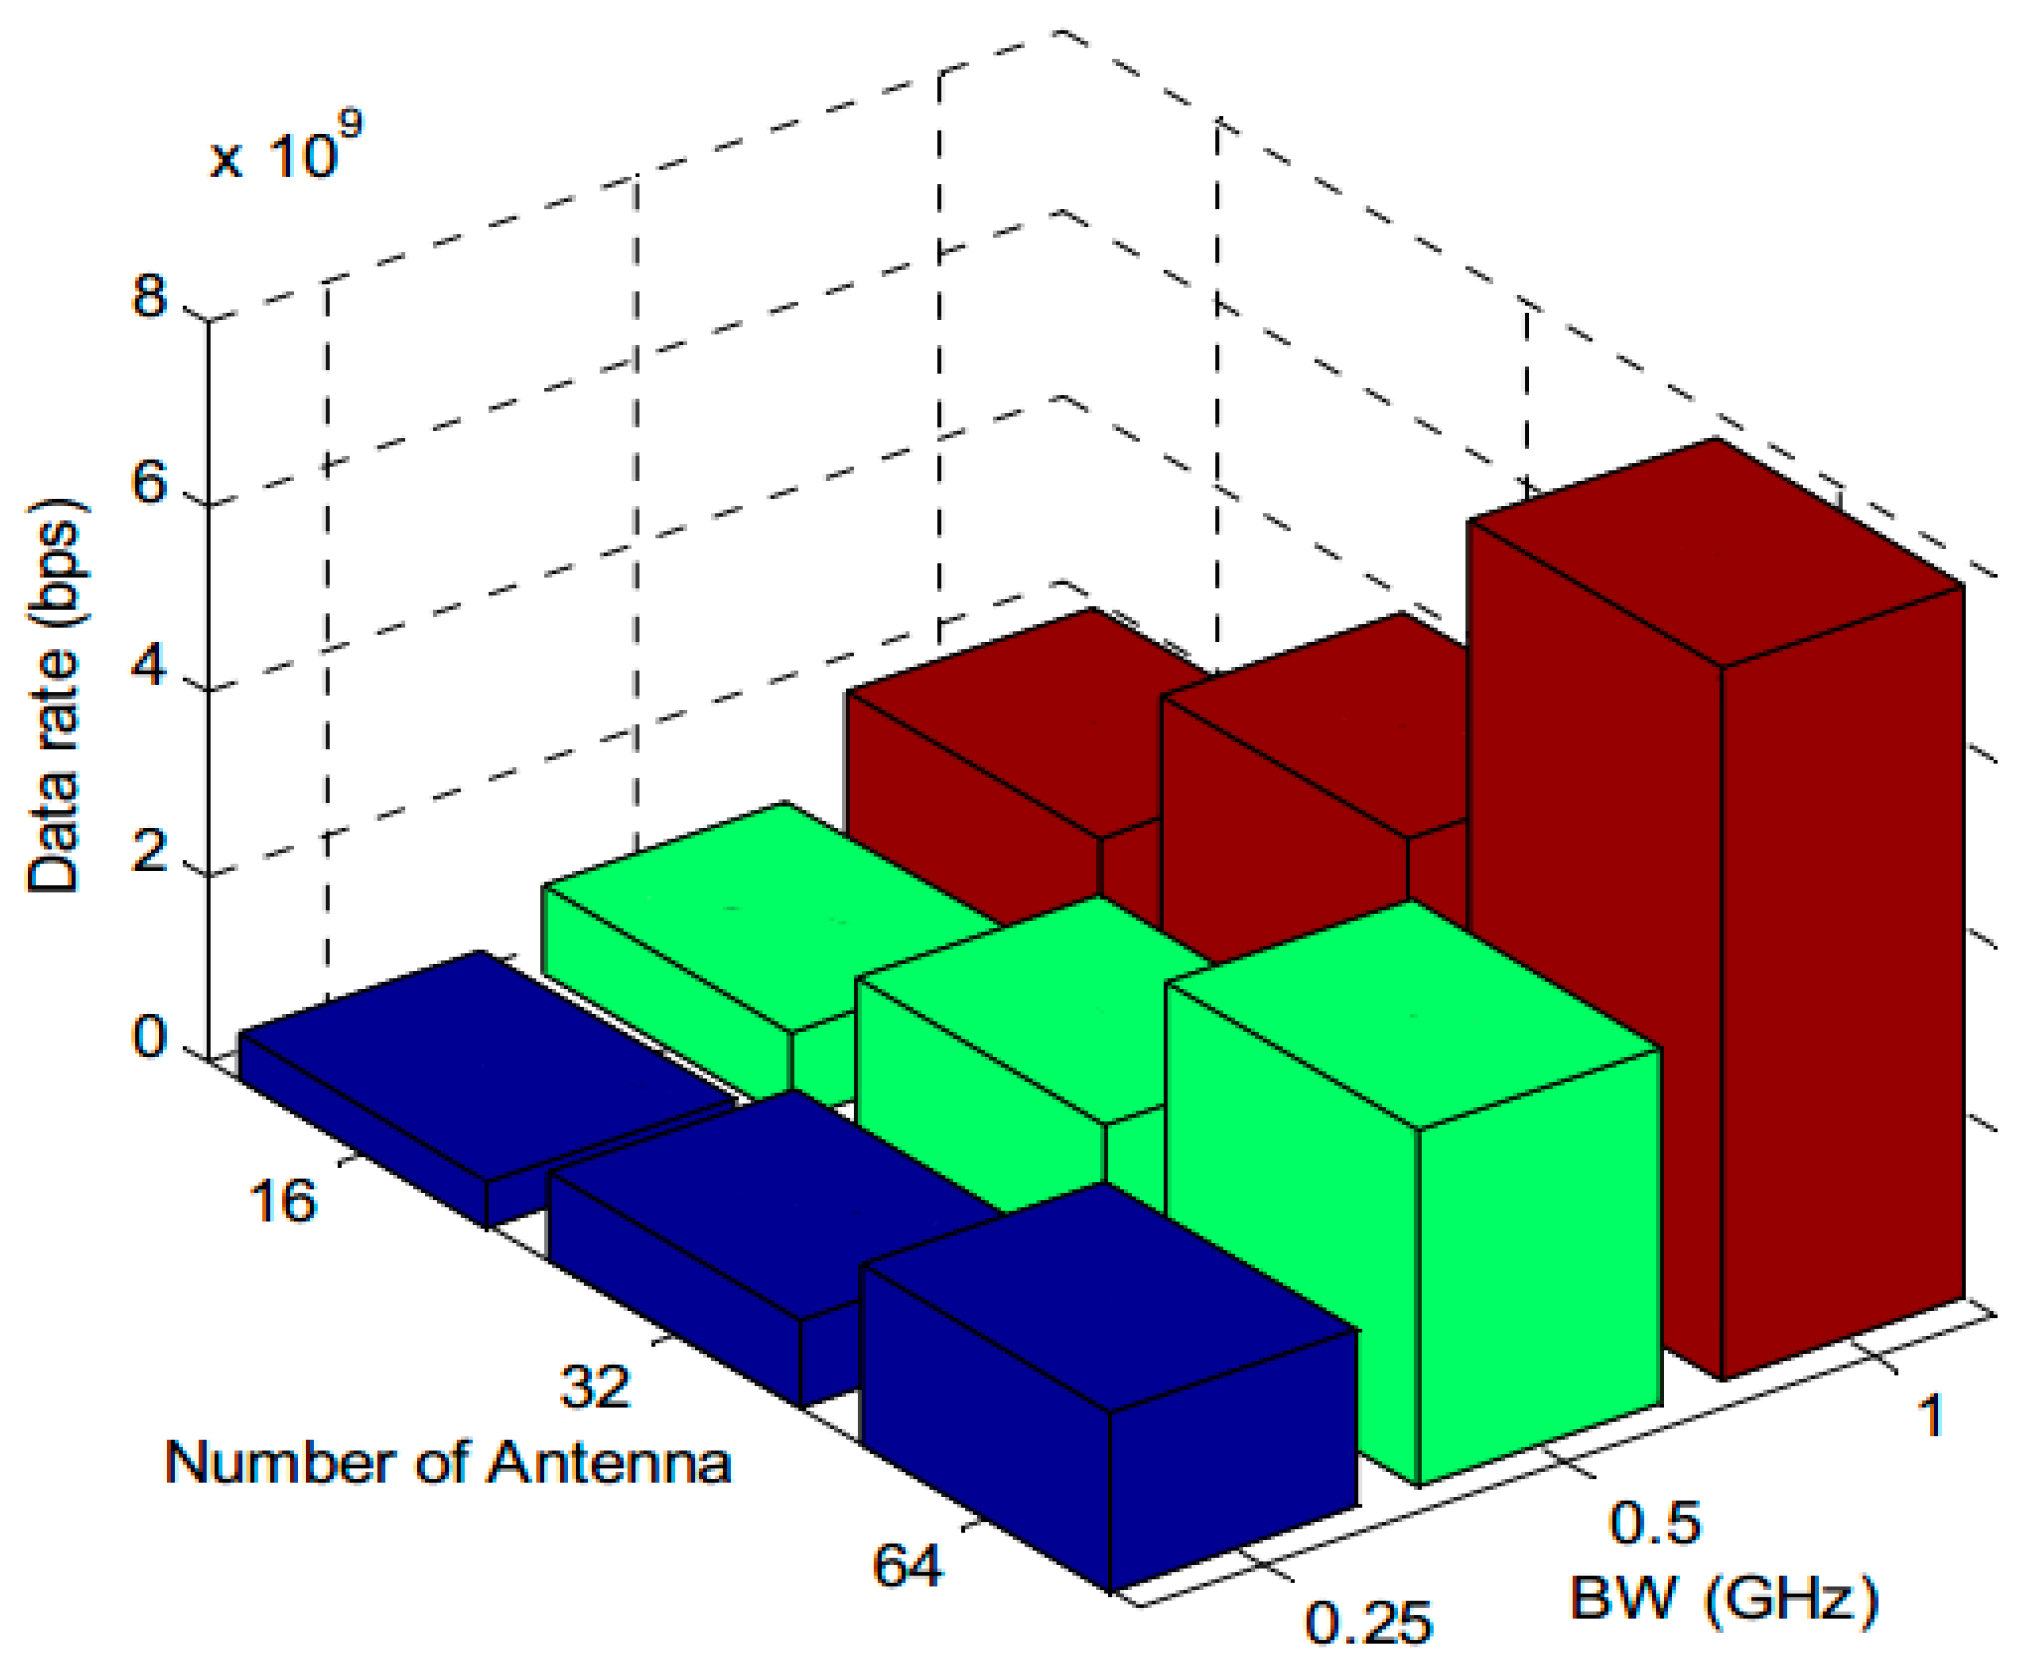
Achieving a balance between coverage and energy consumption in the BS switching-off/on approach for cellular green networks is important. The closed form for the cell coverage can be expressed as follows [39]:
C = Q ( a ) + exp ( 2 2 a b b 2 ) Q ( 2 a b b ) a = ( P min P r x ( r ) σ φ ) ,   b = ( 10 α log 10 ( exp ) σ φ ) ,
where σϕ is the standard deviation of the shadow fading component; and α is a path loss exponent component. In Equation (10), the functional representation of the cell coverage area is denoted by C = f ( a , b ) = f ( P min , P r x , α , σ φ ) , where the P min = f ( N o , B W , N f , S I N R , I M ) and the received power is P r x = f ( P t x , G , L , σ ) . The problem formulation is described as follows:
( p : ) maximize P t x , G , B W , S I N R , σ [ Q ( a ) + exp ( 2 2 a b b 2 ) Q ( 2 a b b ) ] ,
which is subject to the following constraints:
P t x min < P t x P t x max
G min G G max
B W min B W B W max
S I N R min S I N R S I N R max
σ min σ σ max .
Equation (11) is a nonlinear problem including a q-function and five input constraint parameters, wherein differential mathematics is used as a complex approach to find a solution. Hence, an optimization technique has been chosen that requires differentiation of an objective function. Furthermore, the technique generates multiple solutions during each iteration, unlike a numerical method that generates a single point (solution) at each iteration. The sequence of these points approaches the optimal solution.
PSO is preferred because of its capability to maximize the cell coverage area when studied under the Ptx, BW, G, SINR, and σ constraints. Moreover, the MCS, data rate, and EE were taken into consideration. The PSO approach are equipped with the following attributes: flexibility, adaptability to the problems, strong global search ability, and robust performance. PSO performance is comparable to that of genetic algorithms or the ant colony algorithm because it is faster and less complicated. PSO has also been successfully applied to a wide variety of problems. Moreover, PSO is simple to implement and is a very efficient global optimizer for continuous variable problems. See [40,41,42,43] for applications in which PSO has been successfully applied to the field of wireless communication networks.

3.2.3. Data Rate

Using Equation (17), the expected network aggregate data can be estimated:
C = N R B × N S C R B × N S y m b S C × m b i t s S y n b × C R T S l o t ,
where N R B represents the number of resource blocks (RBs); N S C R B represents the number of subcarriers per RB; N S y m b S C represents the number of modulation symbols per subcarrier; and m b i t s S y n b represents the number of bits per modulation symbol, which depends on the modulation scheme that is adaptively selected. CR is the code rate; and TSlot is the slot time.

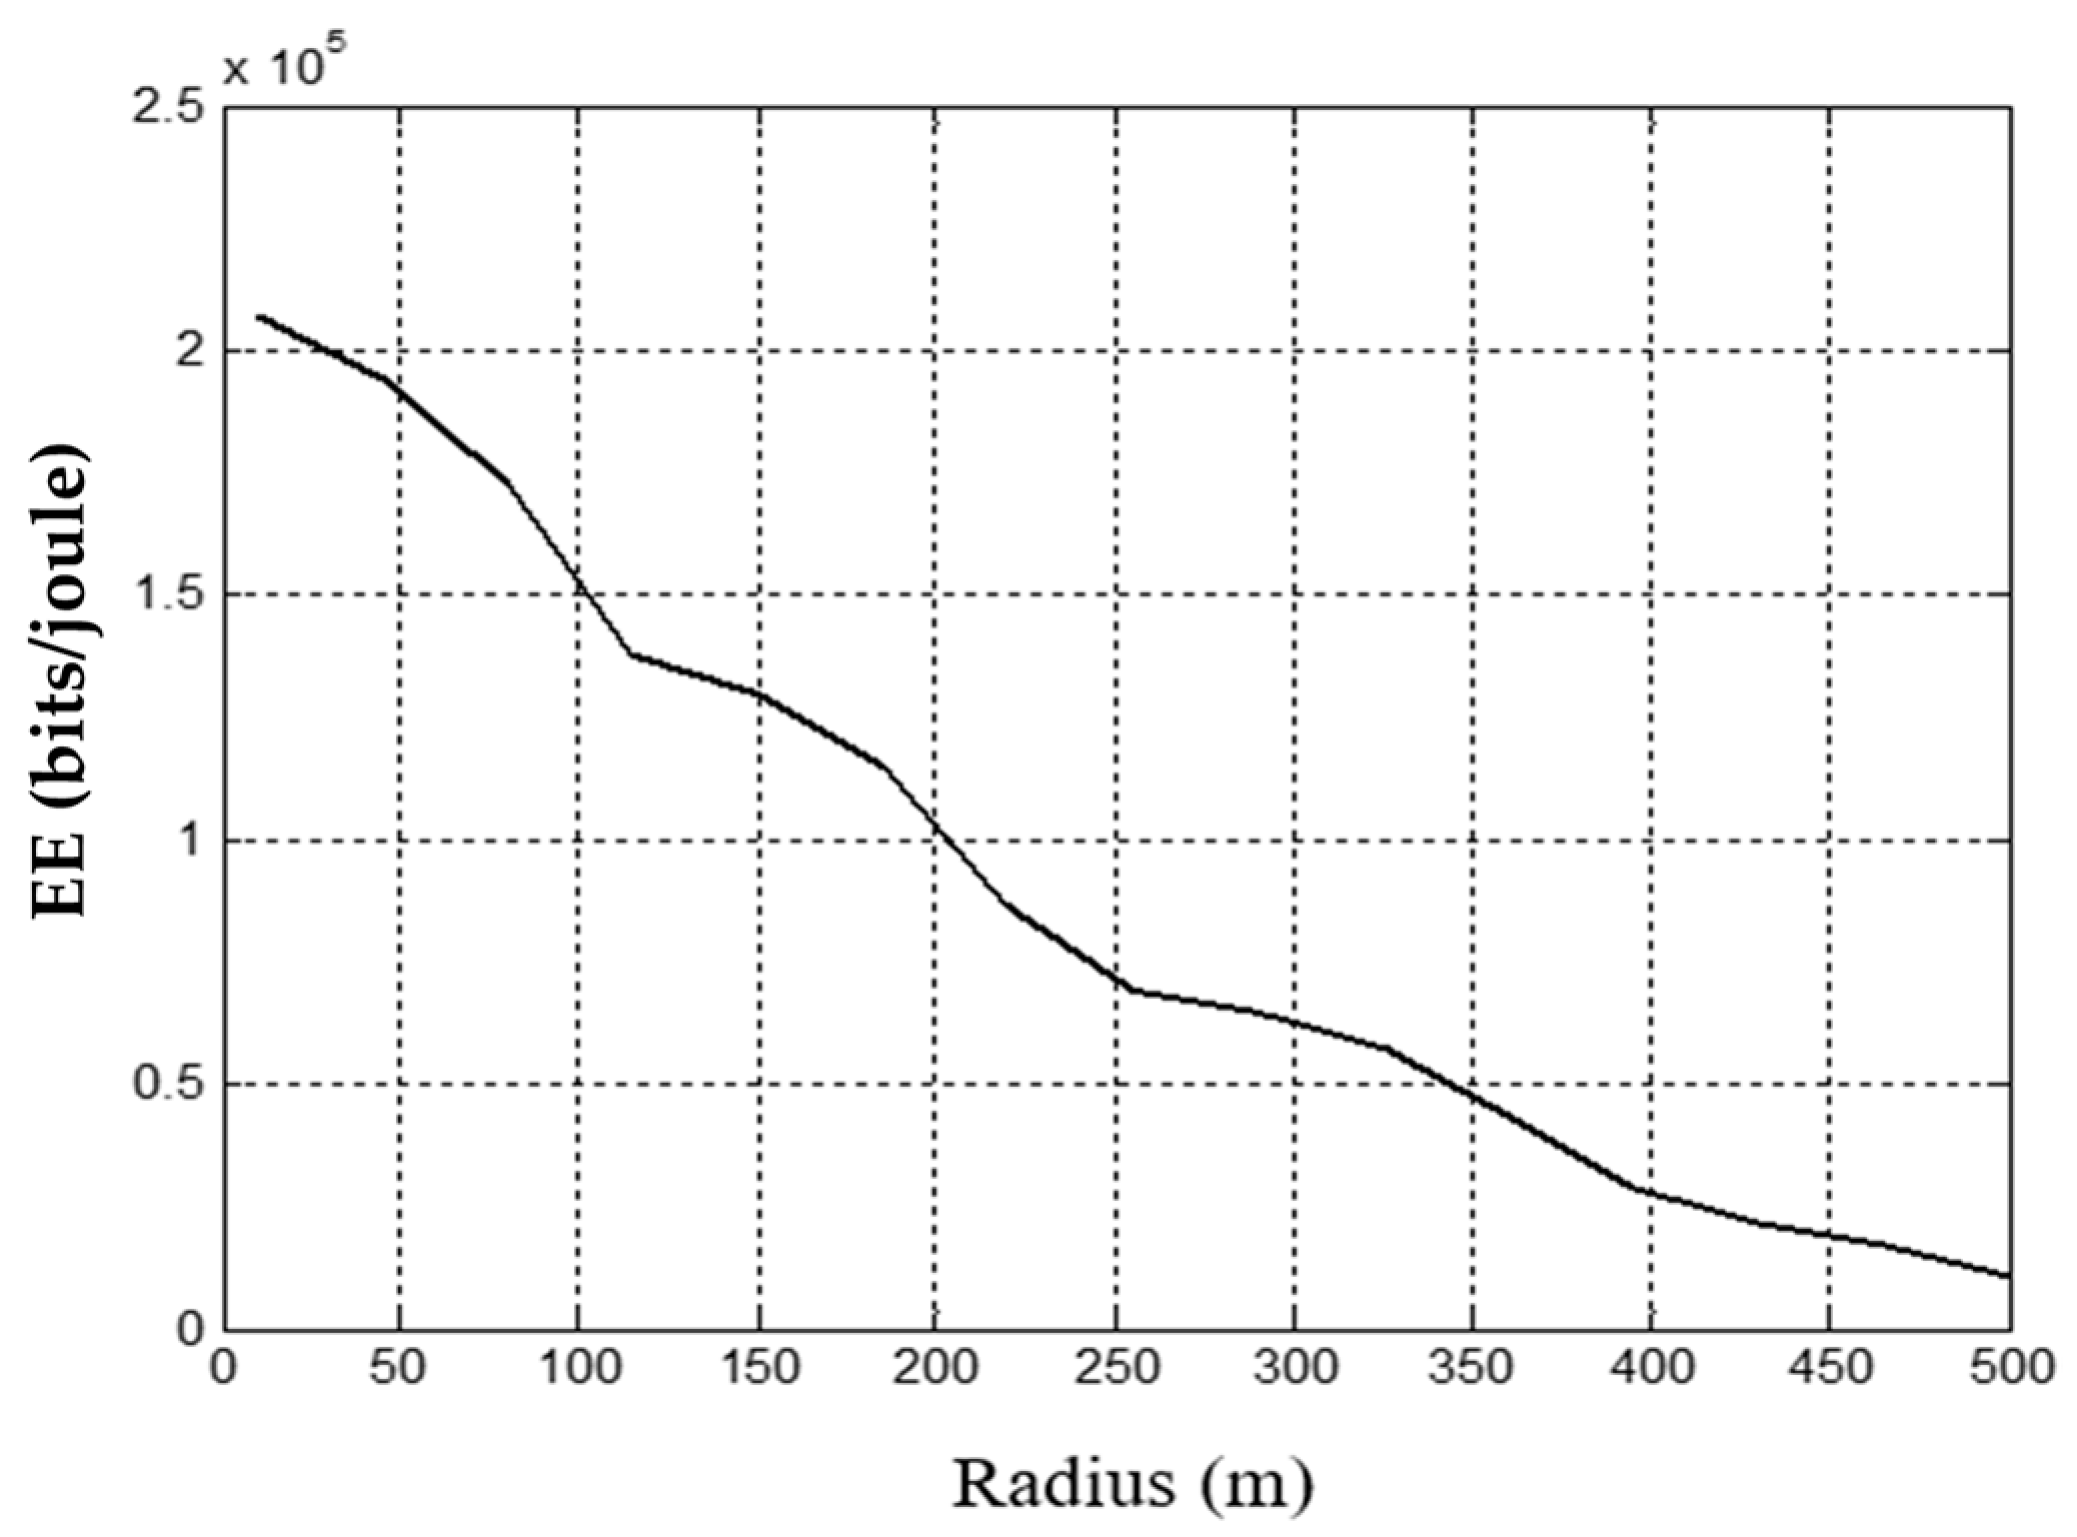
3.2.4. Energy Efficiency

The number of bits transmitted per joule of energy (b/j), called EE [44], is
E E = C P t o t B S ,
where P t o t B S is the total power consumed and can be calculated by the following equation [45]:
P t o t B S = N T R X ( P t x η P A + P R F + P B B ( 1 σ D C ) ( 1 σ M S ) ( 1 σ C o o l ) ) ,
where σ D C , σ M S and σ C o o l denote losses incurred by the DC–DC power supply, main supply, and cooling, respectively; P t x , P R F and P B B are the output power per transmit antenna, radio frequency, and baseband power, respectively; η P A denotes the power amplifier (PA) power efficiency; and NTRX is the number of transceiver, which can be computed as follows [45]:
NTRX = NCarr × NSect × NAnt,
where NCarr, NSect, and NAnt denote the number of carriers, sectors, and antennas, respectively.

4. Optimization Programming and Simulation Setup

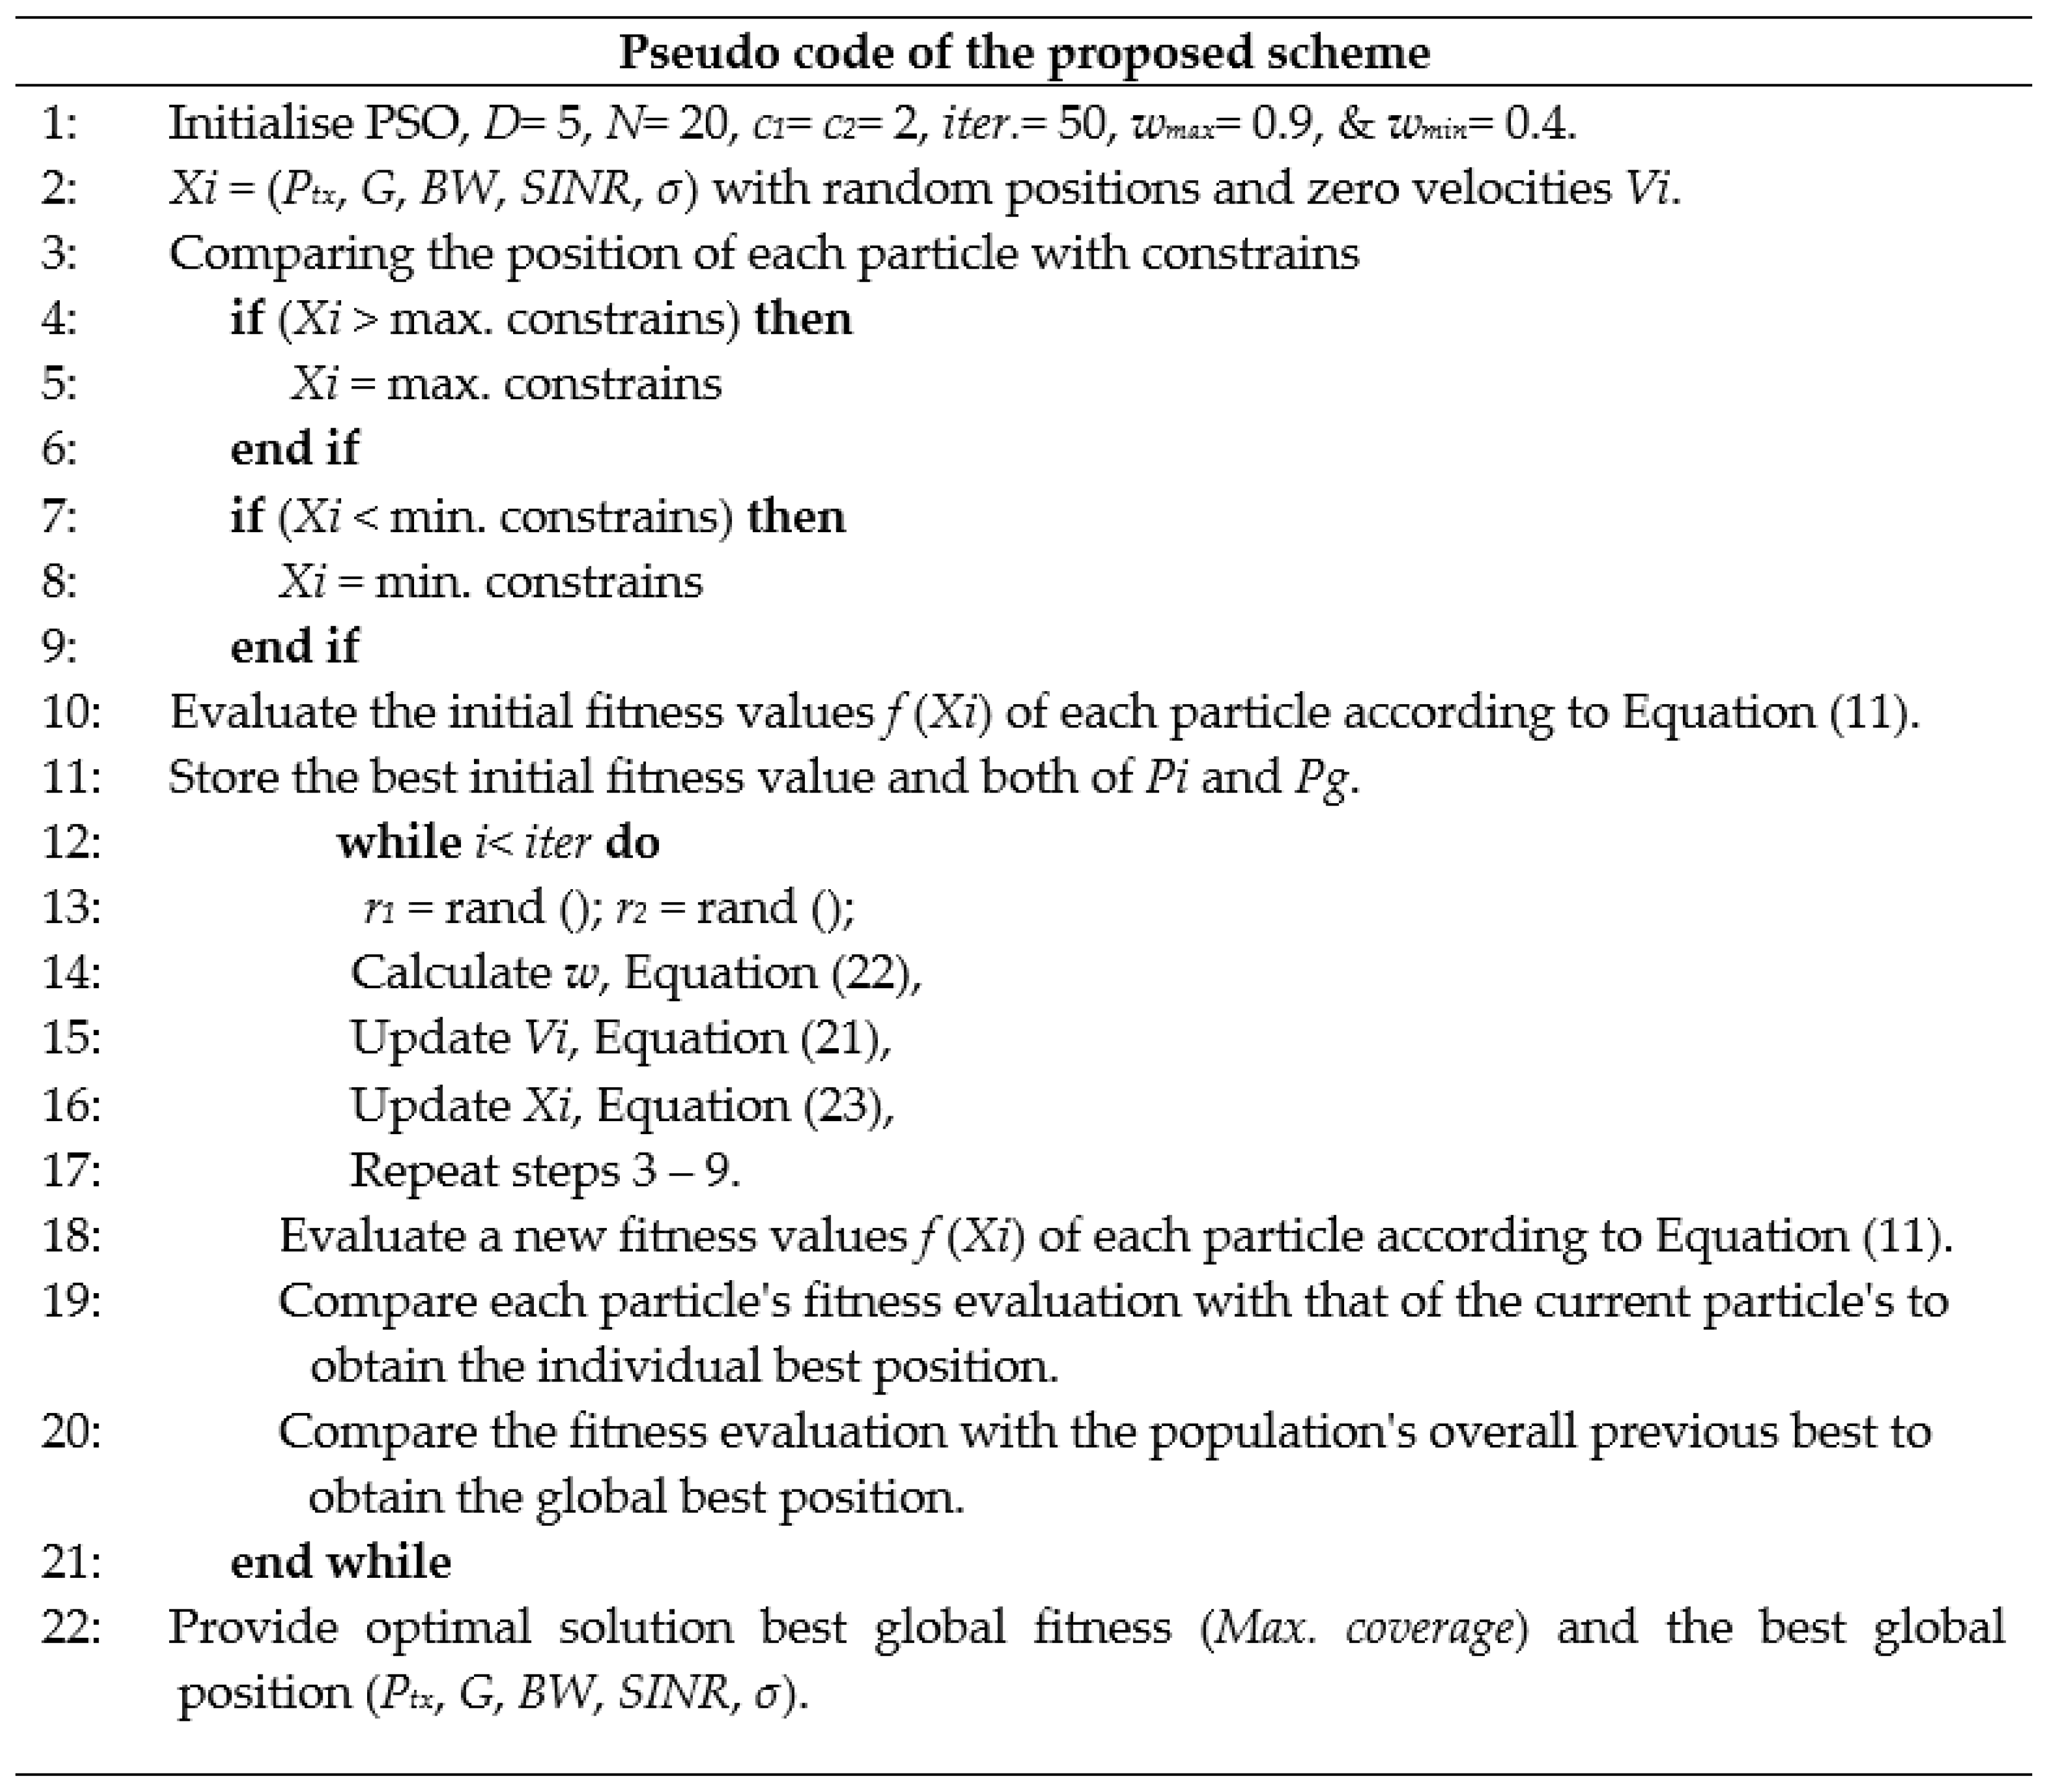
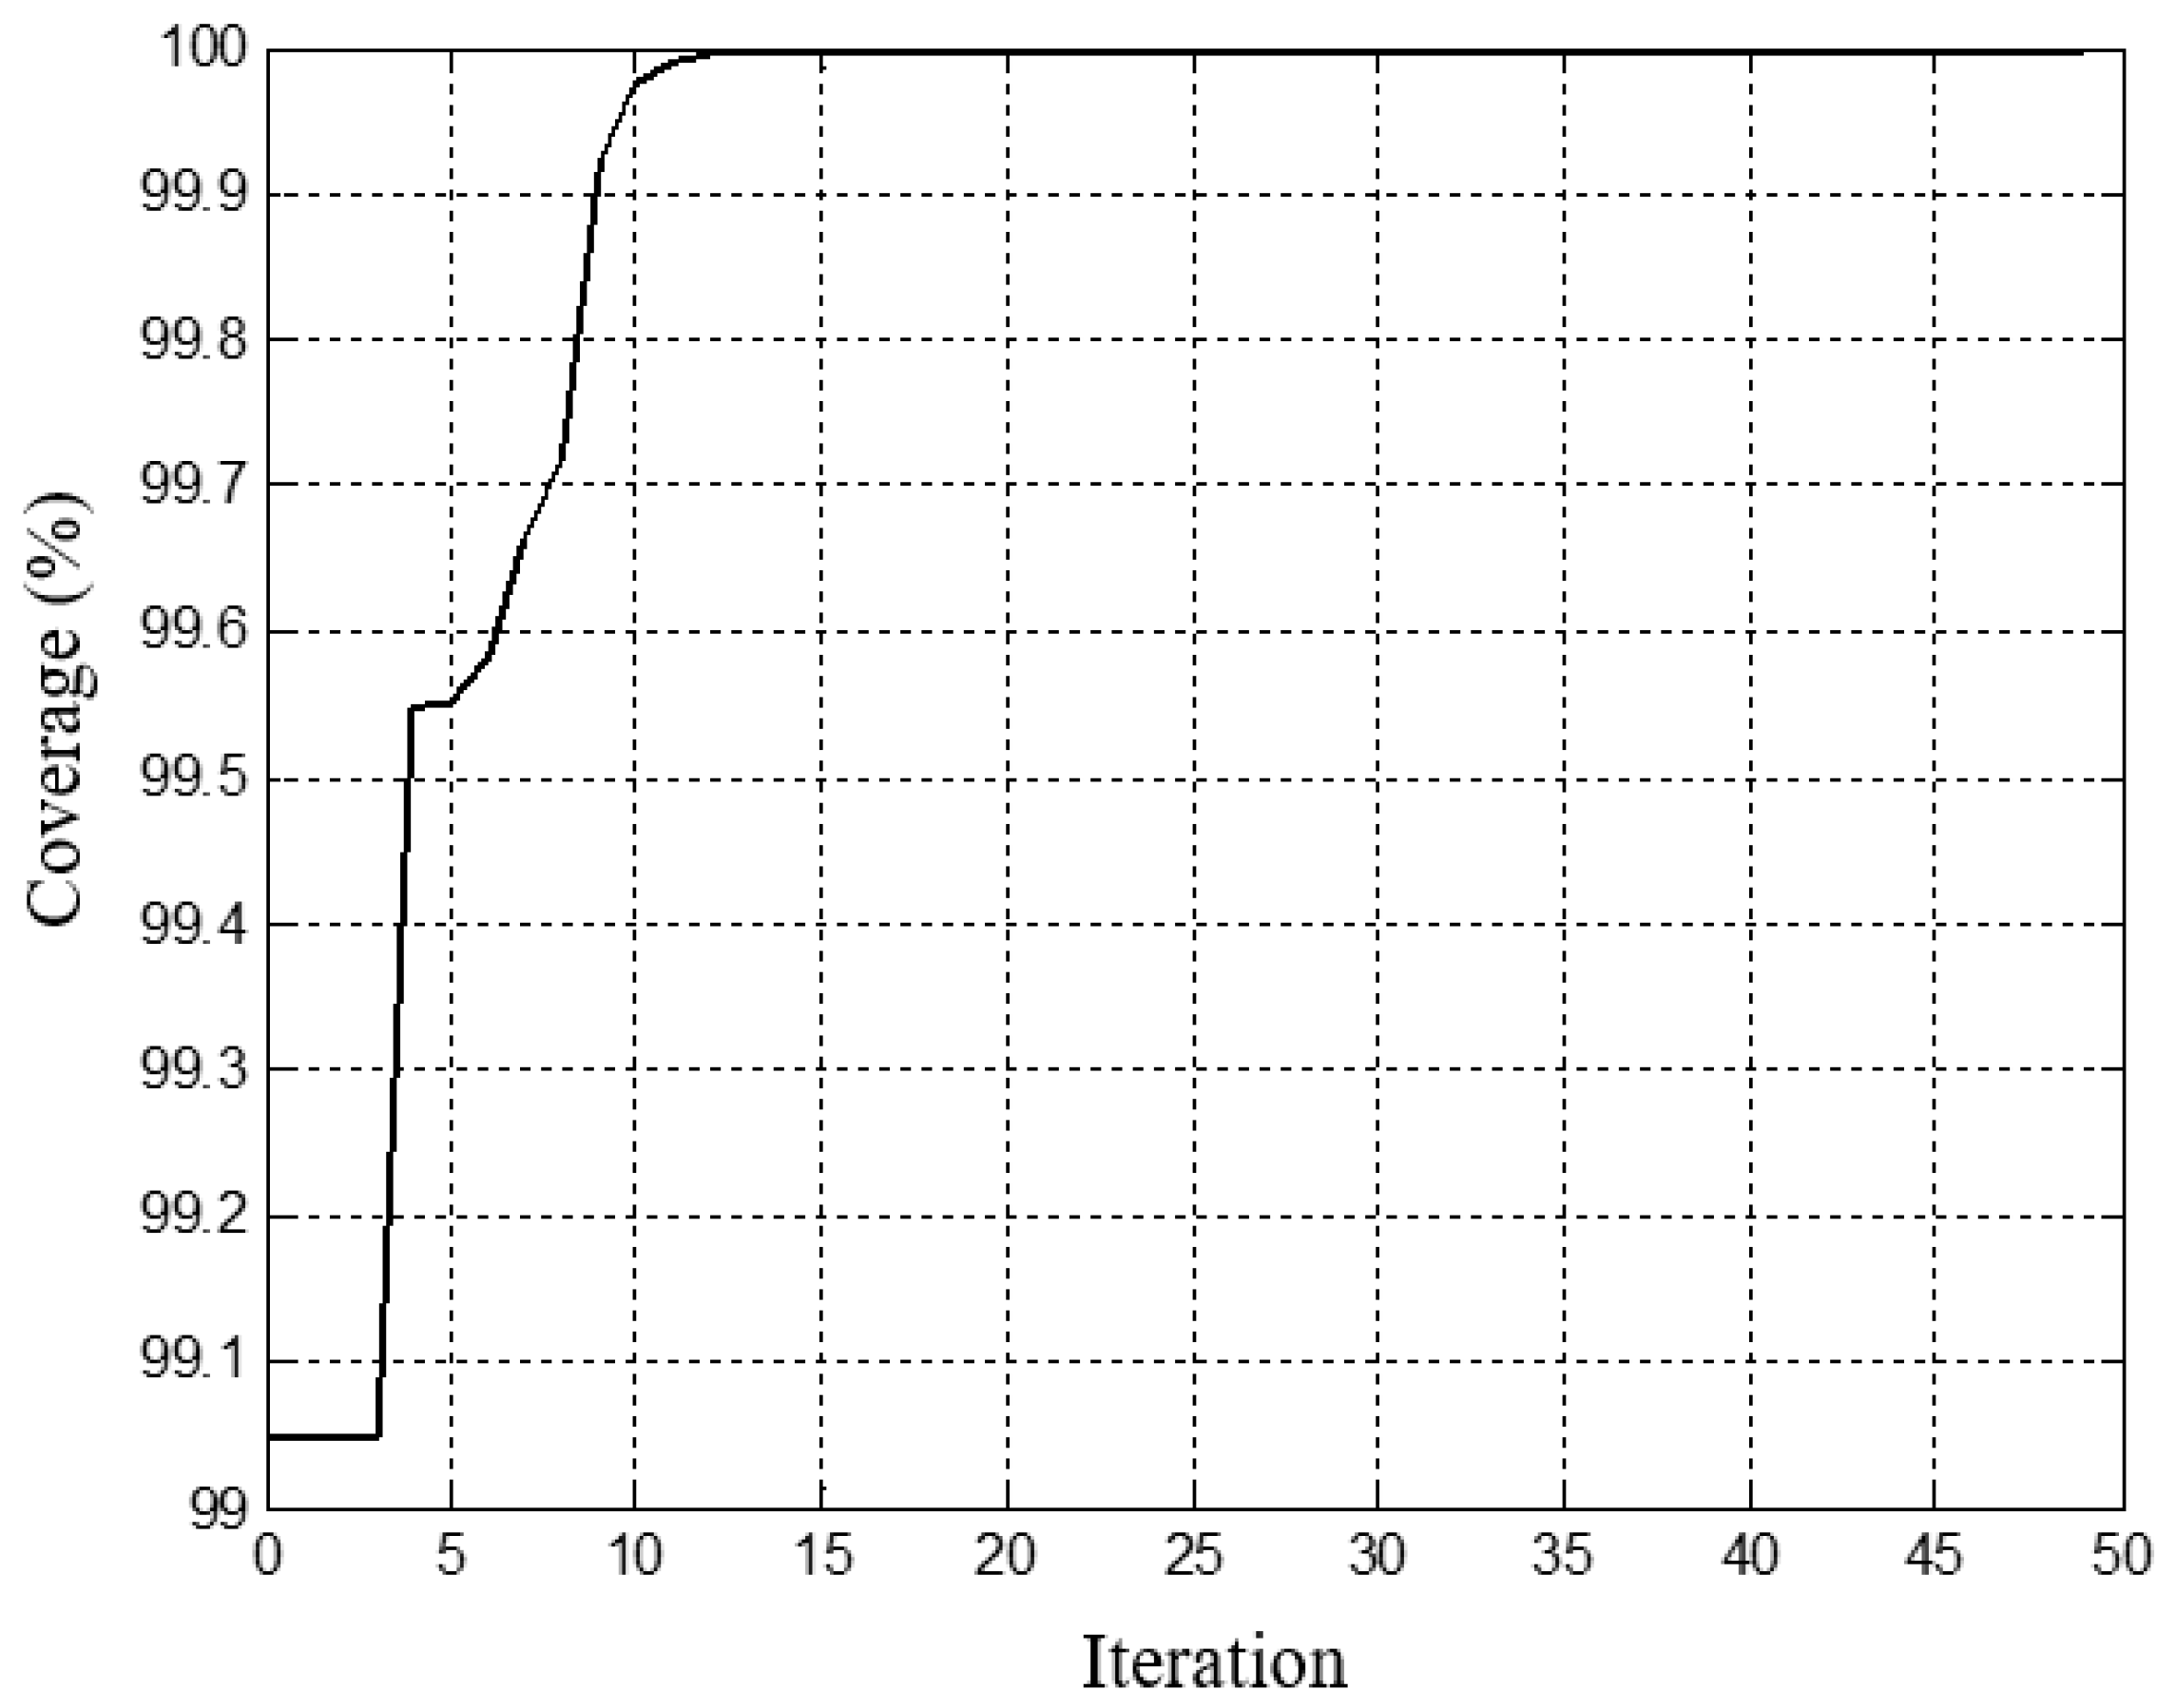
4.1. PSO Heuristic Algorithm

The initiation of the PSO is done using a group of randomly positioned particles whose ultimate goal is to locate the best point. The PSO are defined by four parameters: position array, denoted as Xi = (xi1, xi2, ..., xin); velocity array, Vi = (vi1, vi2, ..., vin); best previous position, Pi = (pi1, pi2, ..., pin); and the global best position, Pg = (pg1, pg2, ..., pgn) [46]. The velocity and position of each particle are updated as follows:
v n e w = w × v o l d + c 1 × r 1 ( p i n x i n ) + c 2 × r 2 ( p g n x i n ) ,
where w is the inertia weight; r1 and r2 are random numbers; c1 is the self-recognition component coefficient; c2 is the social component coefficient; and the choice of the values c1 = c2 = 2 is generally referred to as the learning factors. The following weighting function is usually utilized in Equation (21):
w = w max [ ( w max w min ) × i t e r ] i t e r max ,
where wmax is the initial weight; wmin is the final weight; iter is the current iteration number; and itermax is the maximum iteration number.
Next, the new position is determined using the previous position, and then the new velocity can be written as follows:
x i n _ n e w = x i n _ o l d + v n e w .

4.2. Pseudocode of the Proposed Scheme

The parameter configurations and the pseudocode of the PSO algorithm are presented in Figure 6.

4.3. Simulation Setup

The simulation parameters used in this study are given in Table 1. MATLAB software is used in this study. During a period of off-peak traffic load demand, 5G BSs are switched off, and LTE BSs will guarantee both the service and the coverage. The execution and implementation of PSO algorithm are aimed at maximizing the cell coverage area (LTE) during a switched-off session, under the constraints of Ptx, BW, G, SINR, and σ. More details of the simulation parameters are given in Table 1.

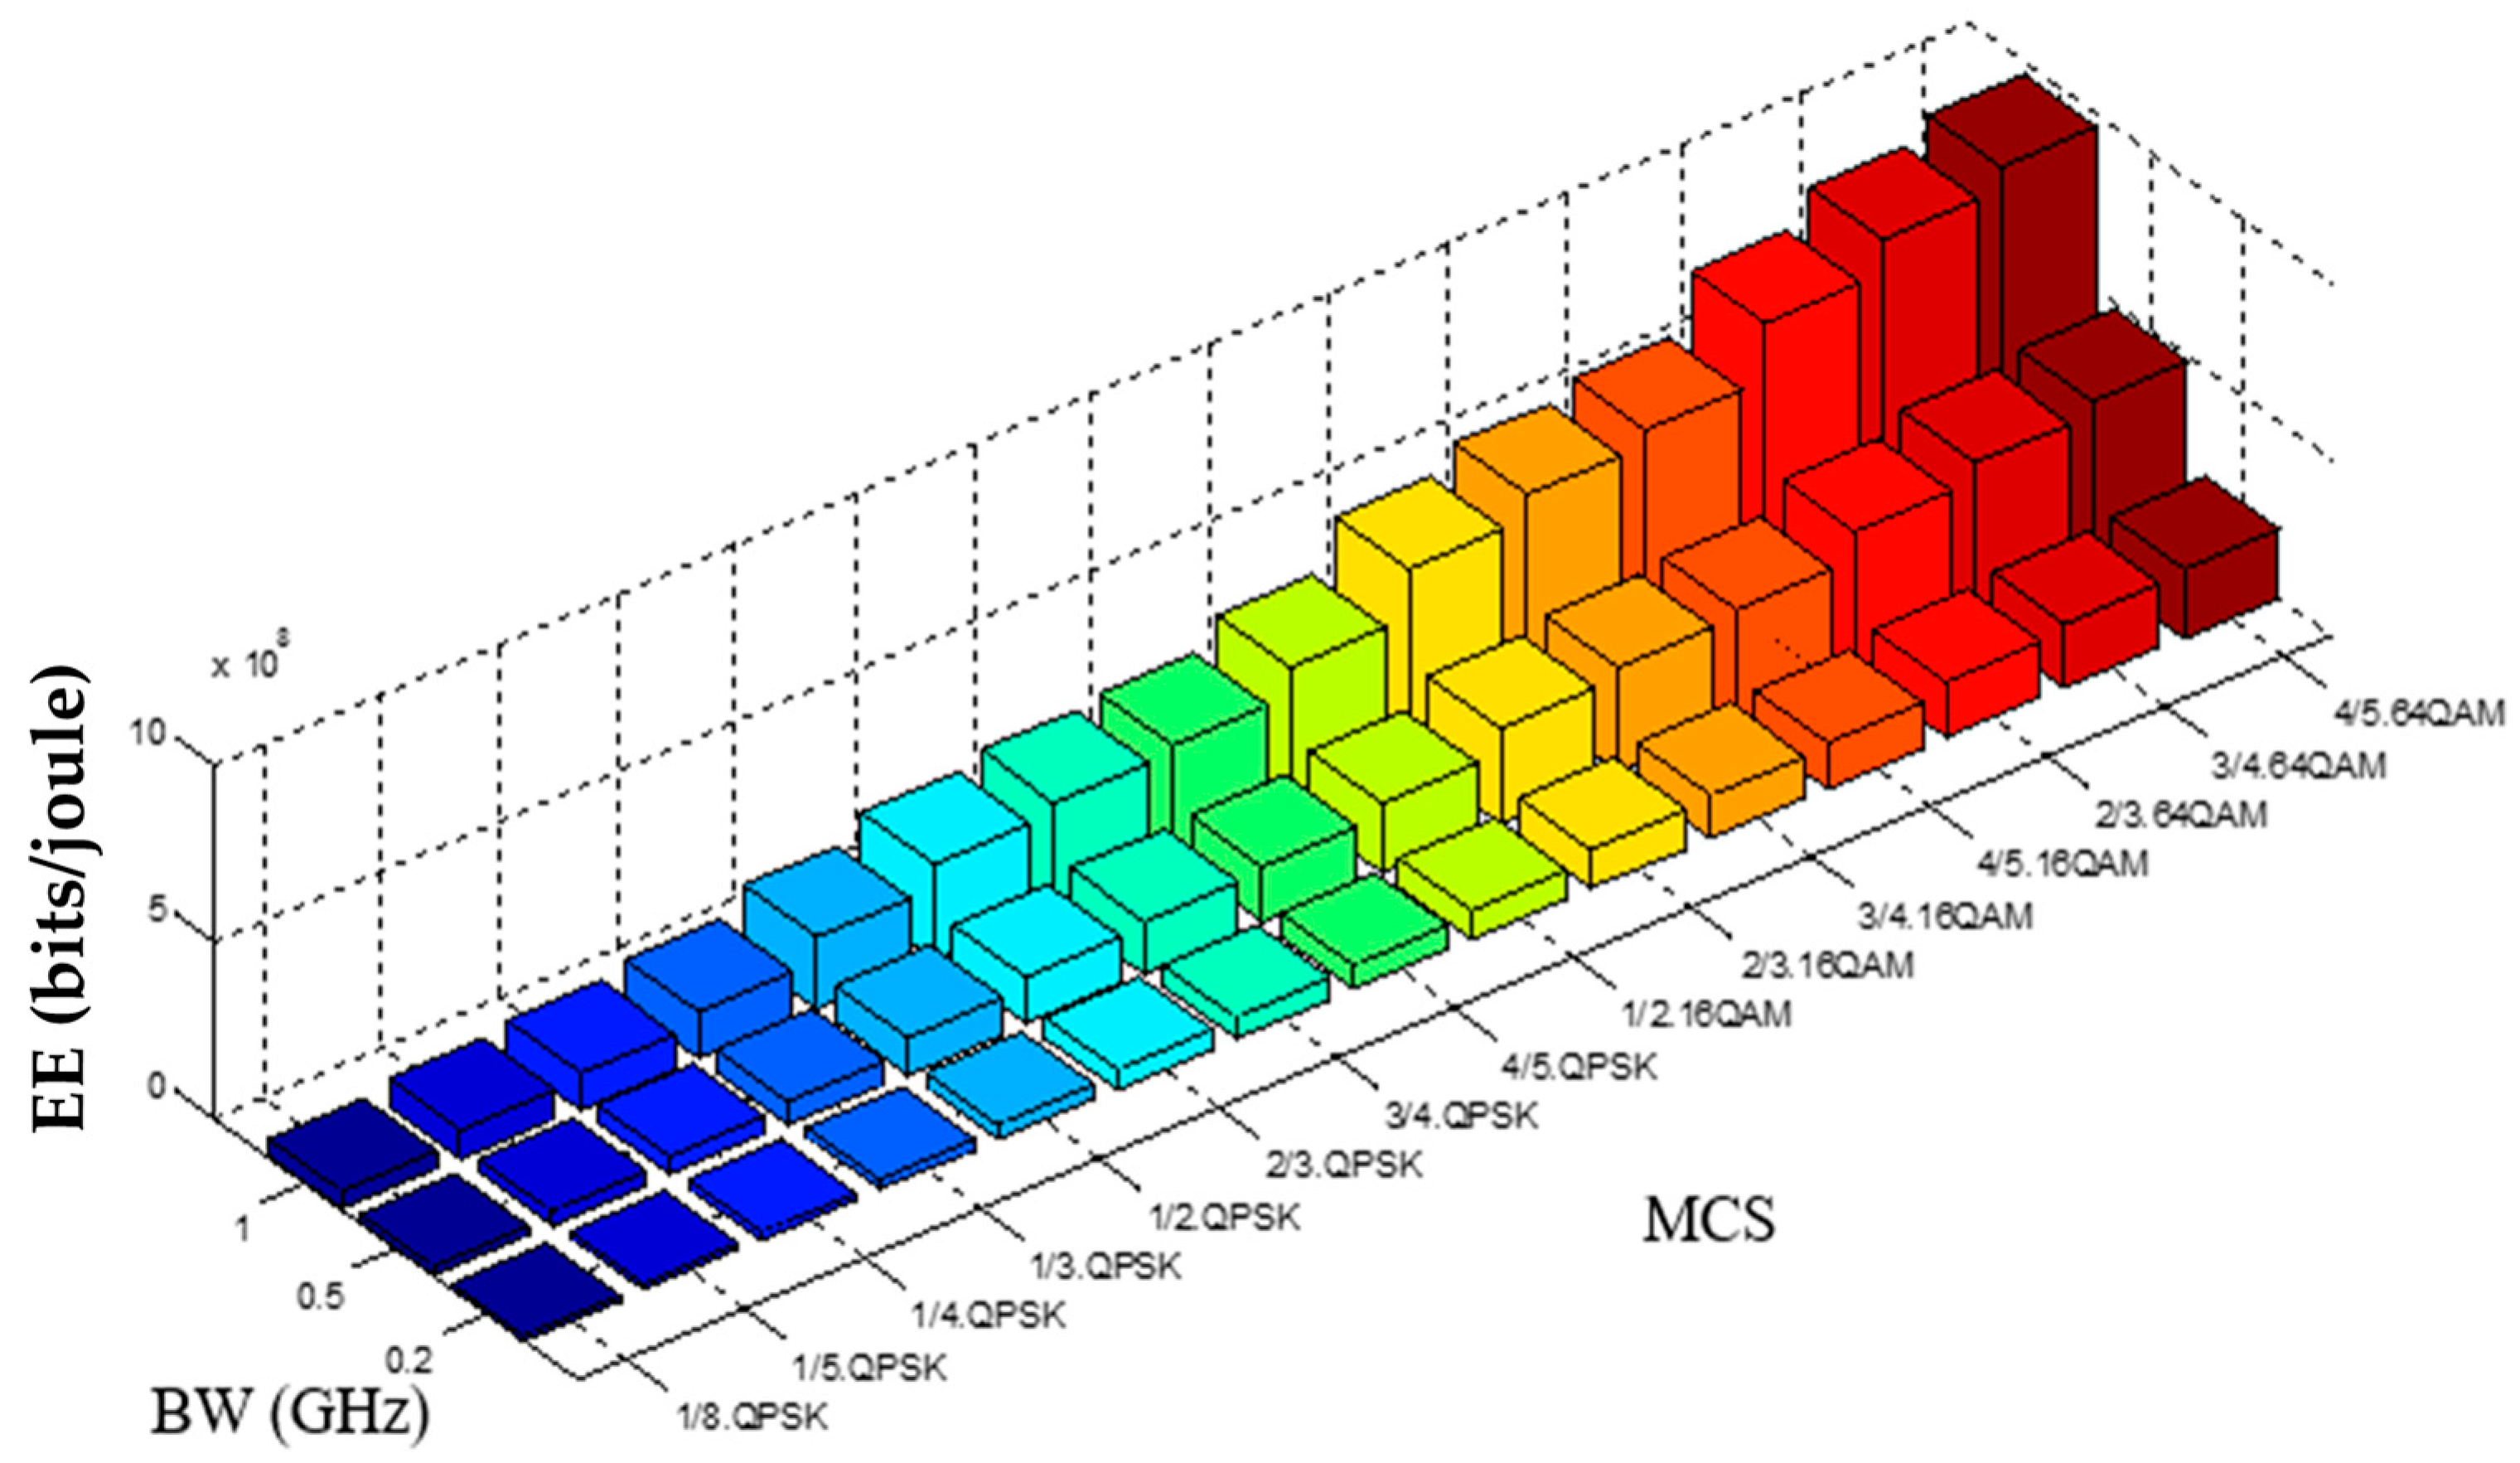
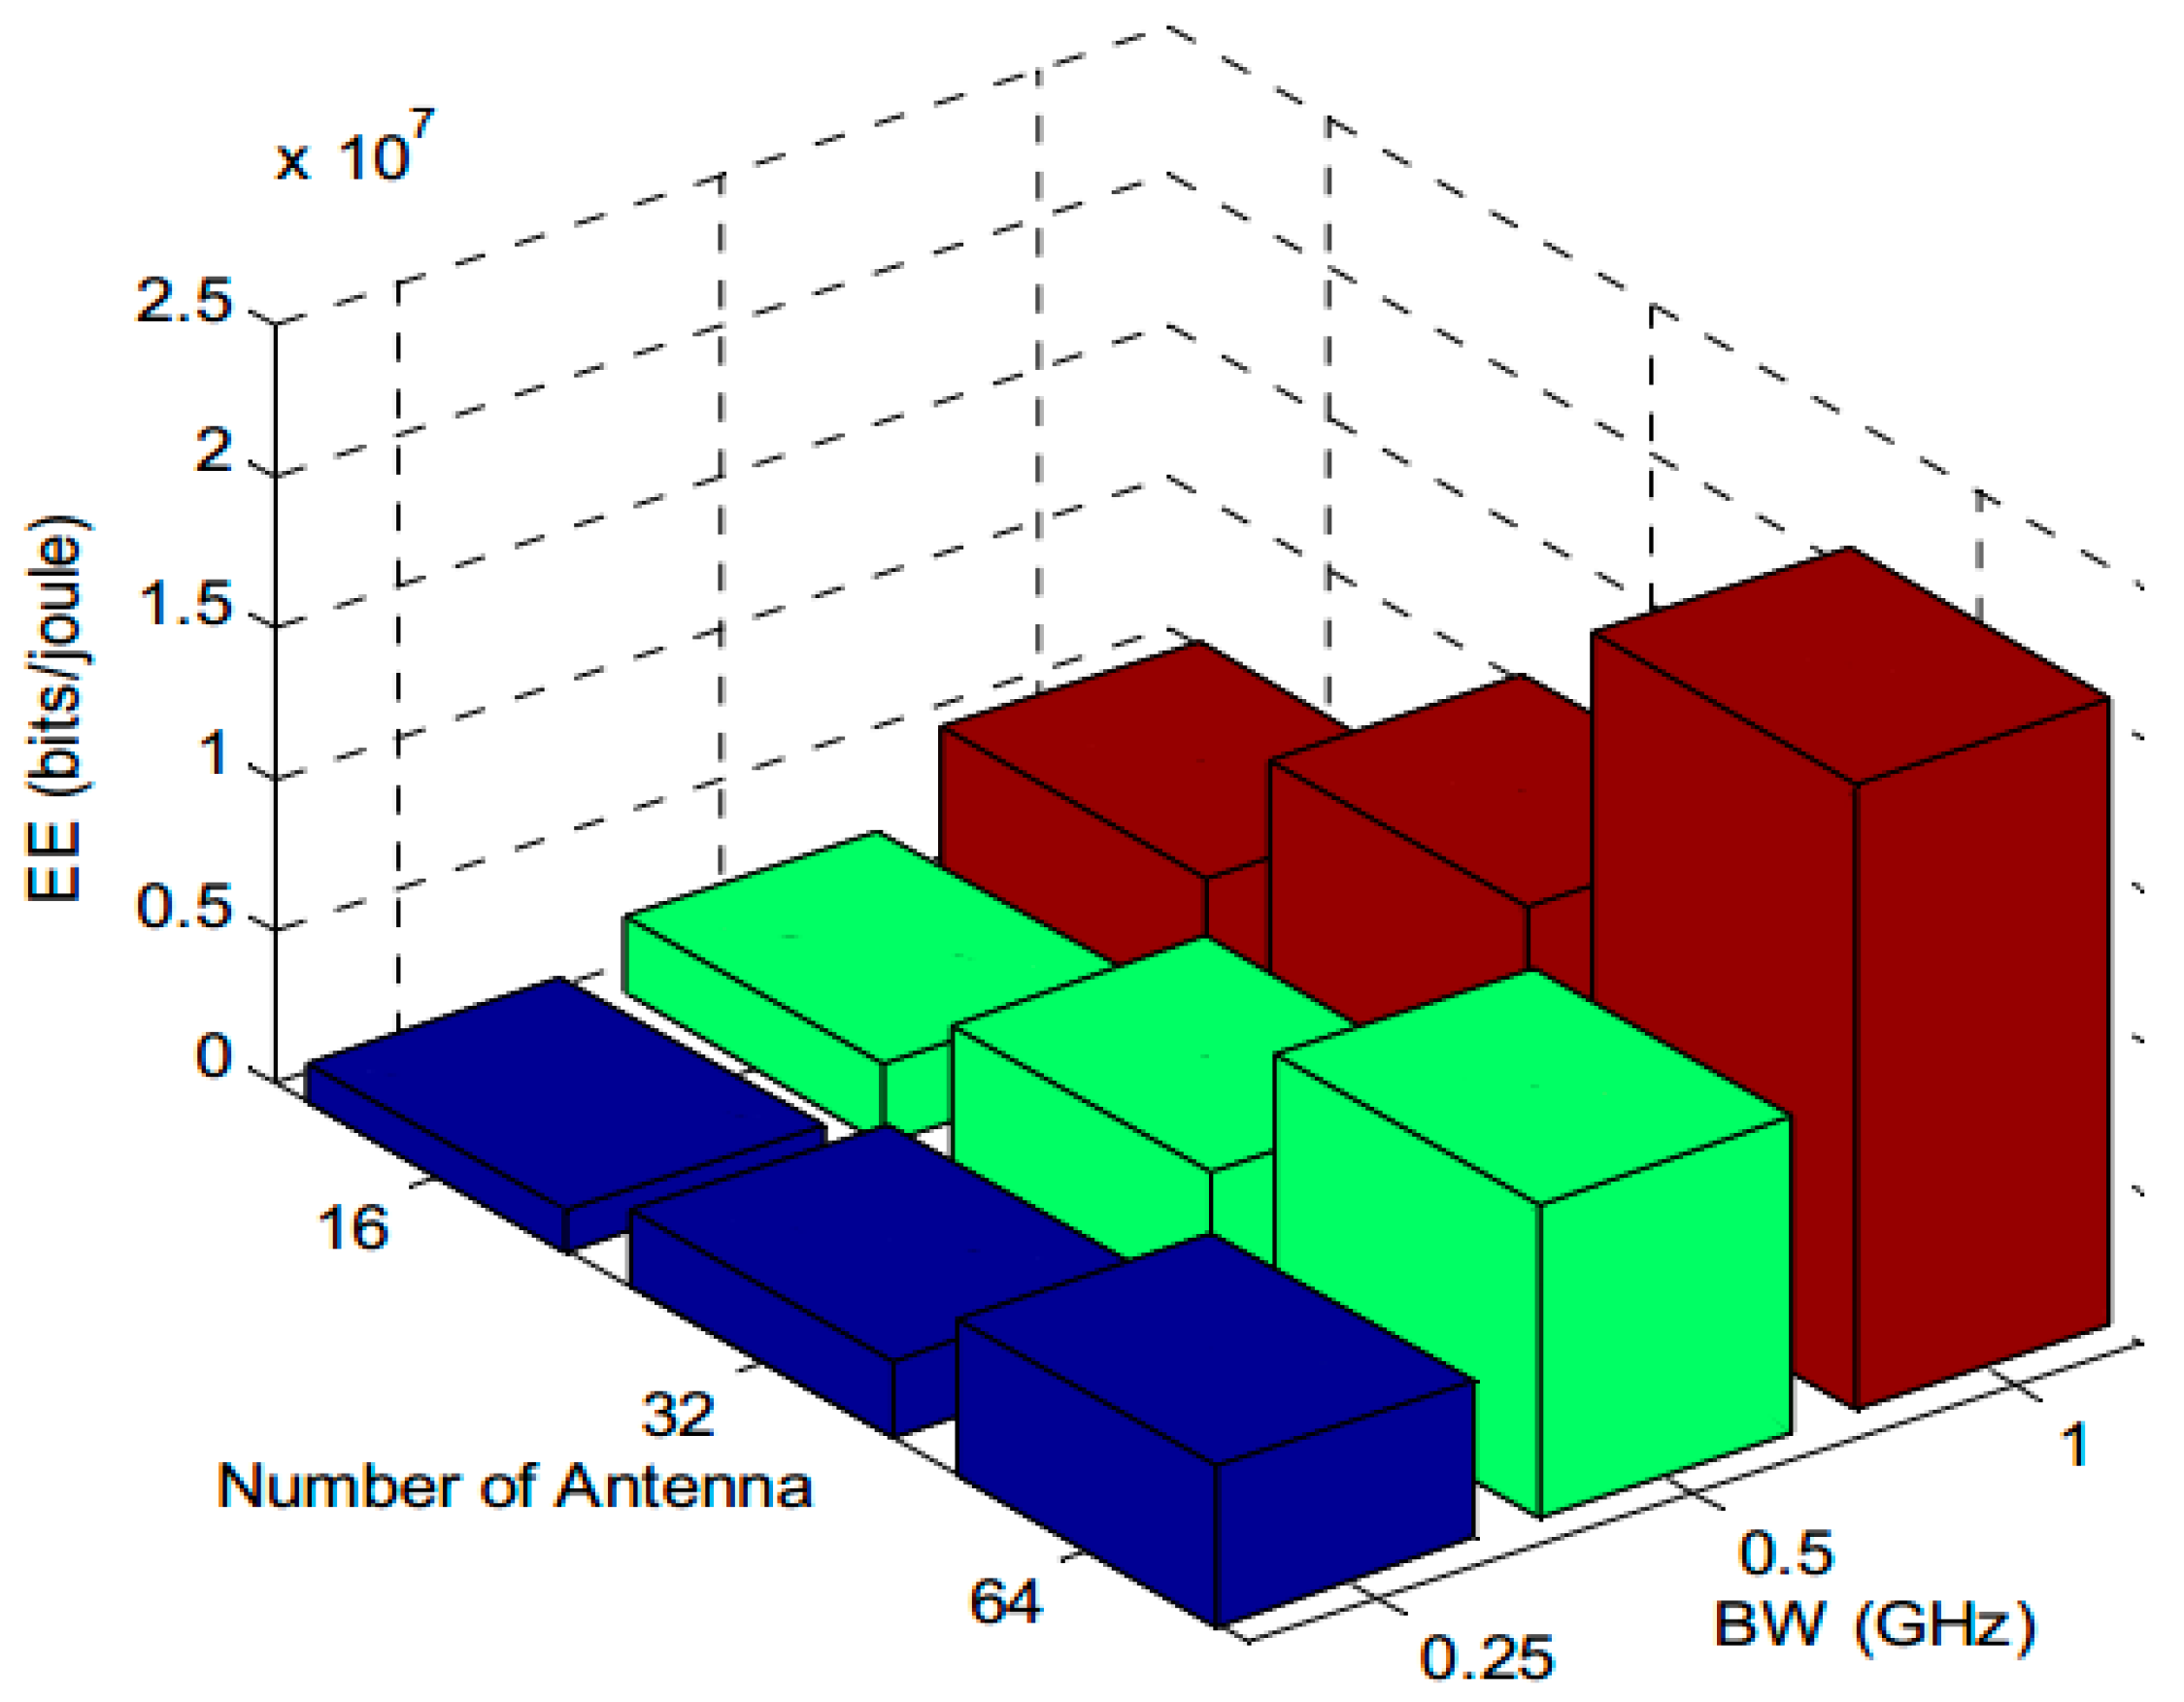
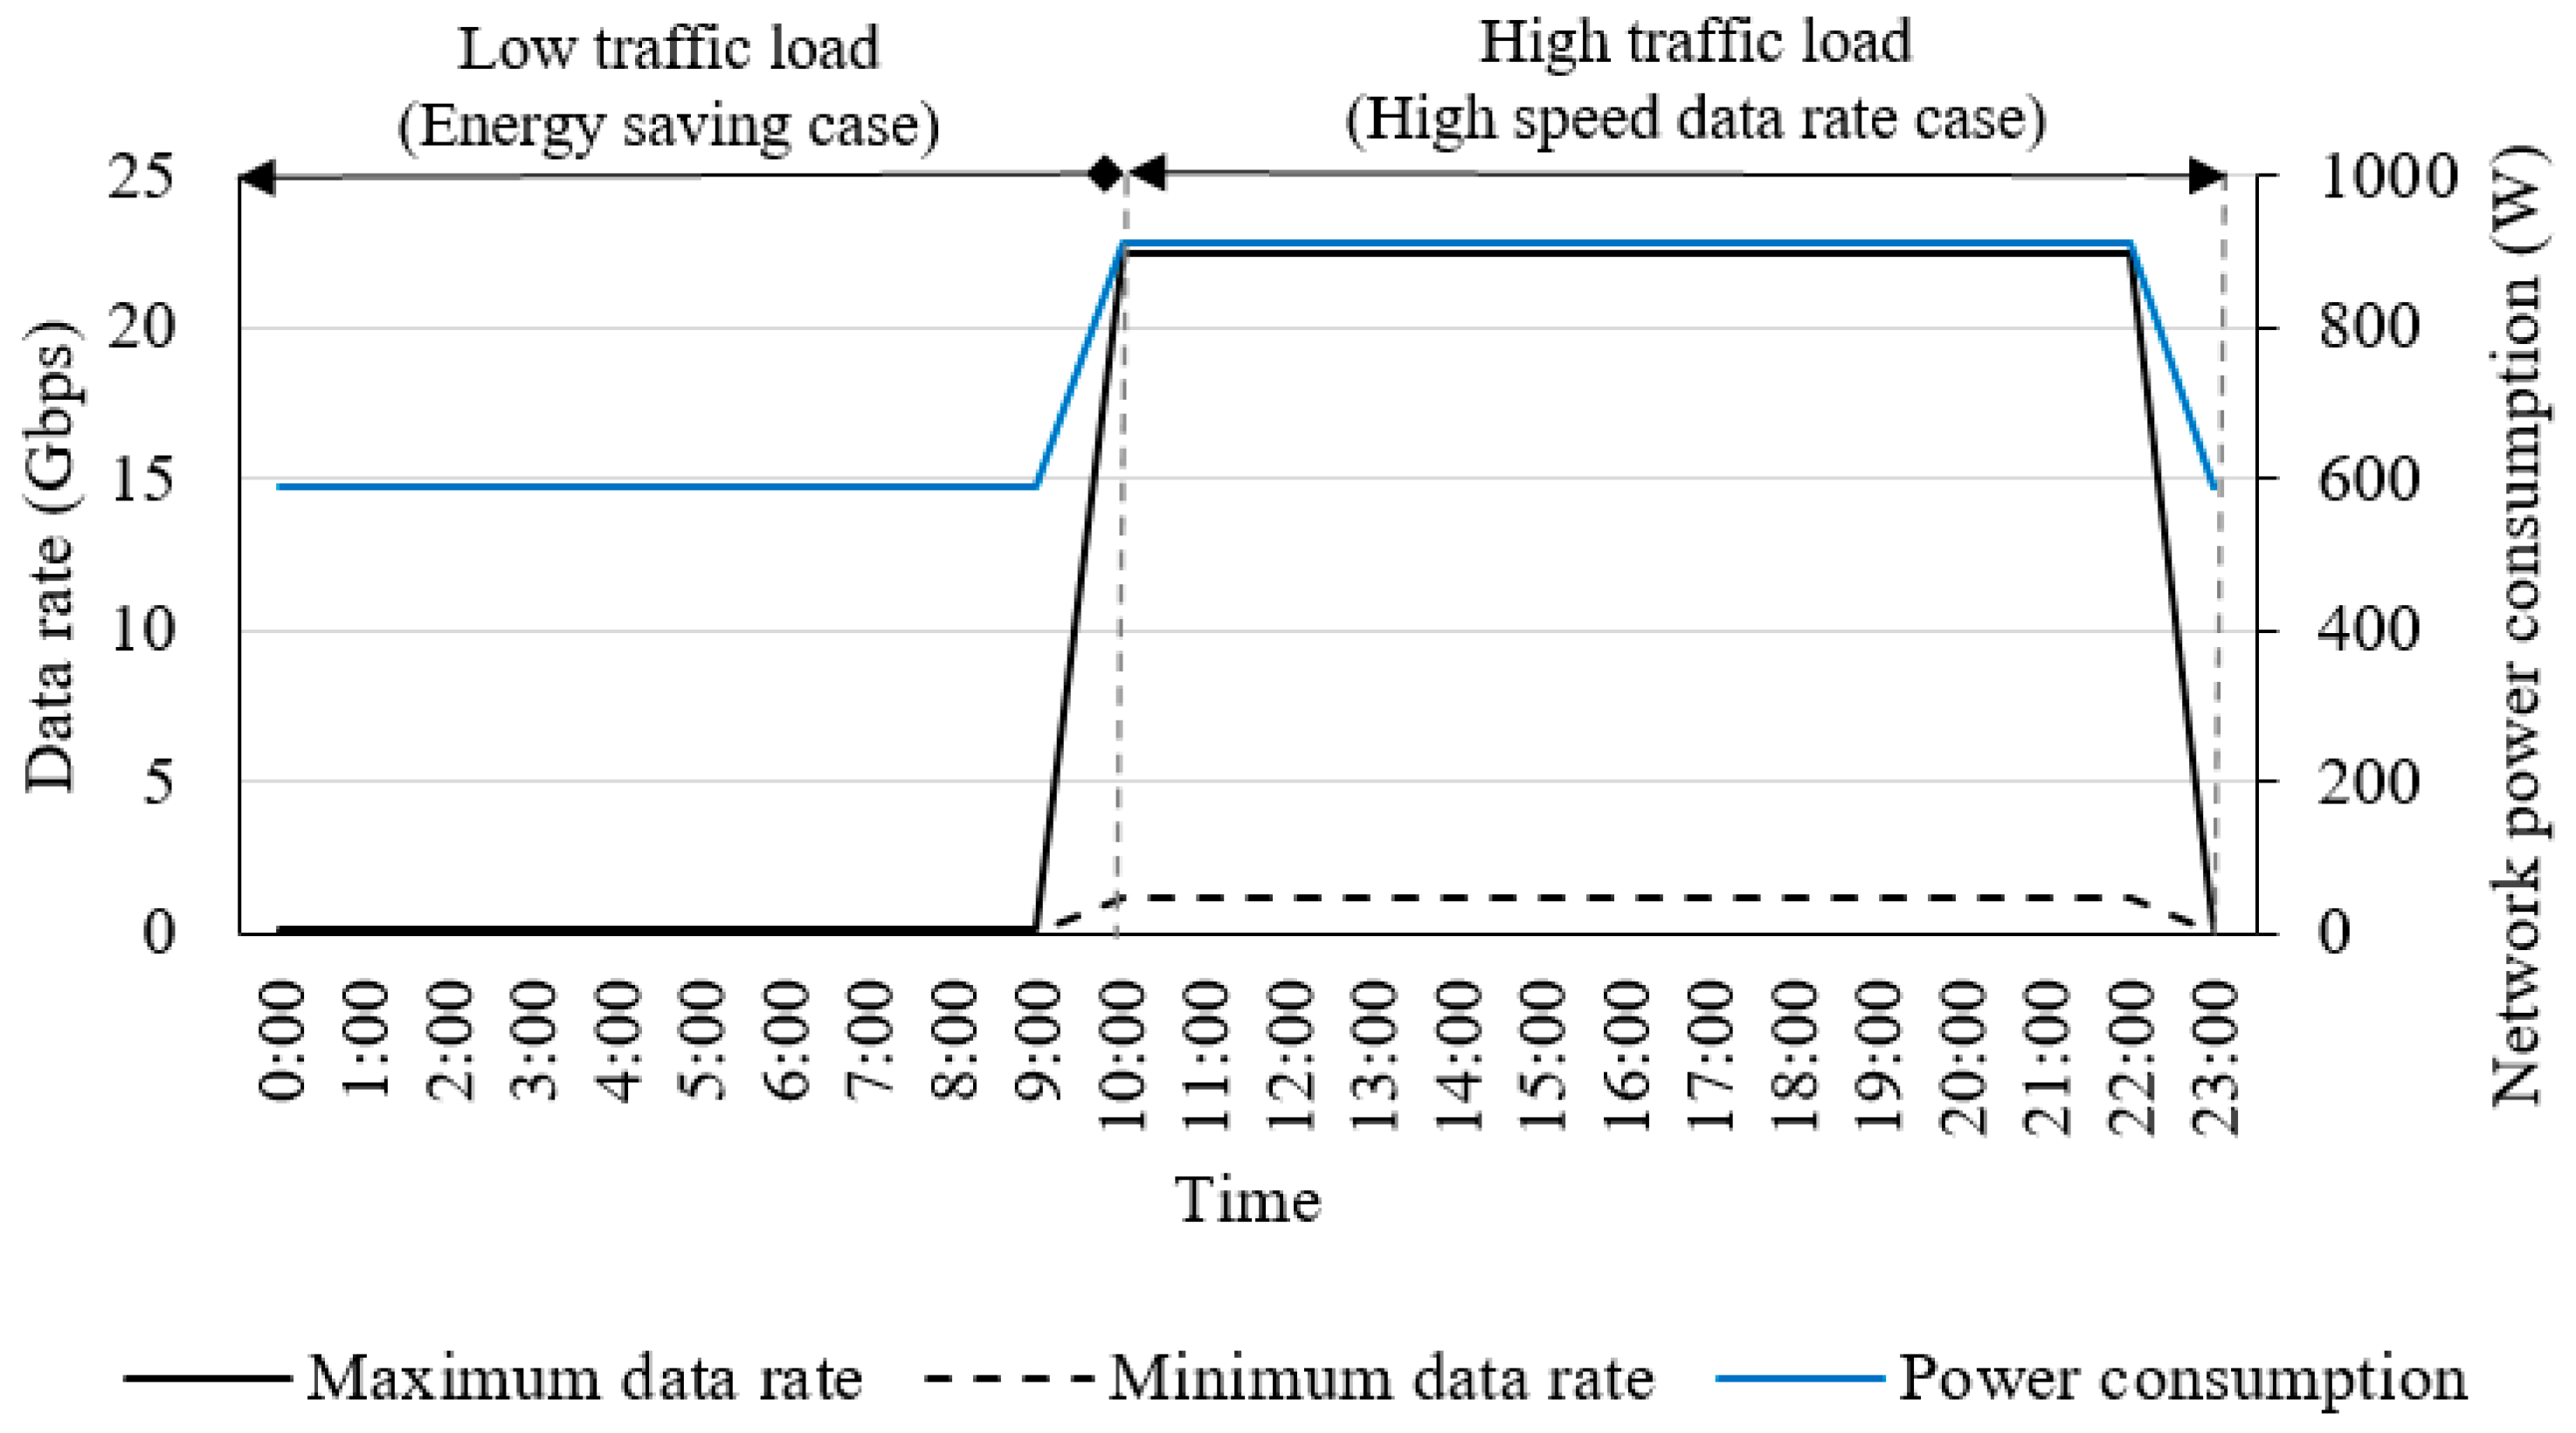
5. Results and Discussion

This section first discusses the performance evaluation of the LTE cell coverage area optimization issue during the period when 5G BSs are switched off based on the PSO under constraints, the transmission power of the BS, the total antenna gains, the flexible BW, and the propagation environment (SINR, path loss, and fading) according to the optimization problem formula given in Equation (11) and the setup parameters listed in Table 1. The second part of the discussion focuses on the data rate that will be delivered to the UEs during 5G BSs’ switching off and on, because the EE is a function of both the data rate and the total BS power consumption. The final part of this section evaluates the EE based on the proposed BSs switching-off/on model.
Figure 7 and Figure 8 describe the behavior of the LTE BSs coverage when the 5G BSs are switched off at low traffic load and the behavior of the constraints that affect the coverage, respectively.
Figure 7 shows that at the start, with random particle positions and zero velocities (at iterations equal to zero), the LTE cell coverage area was 99.05%, with Ptx = 43.08 dBm and G = 7.97 dB, at SINR = 1.49 dB and σ = 5.50 dB, as shown in Figure 6. From Figure 6, when the SINR decreased, both Ptx and G increased to maintain the maximum coverage area. The simulation results demonstrated that the optimum transmitting power Ptx and the antenna gain G that maintain maximum coverage at the edge (where the SINR was the lowest at −5.1 dB and where the shadowing is at 4.8 dB) are 43.1 dBm and 6.3 dB, respectively. In addition, the optimal BW is 10 MHz during the period that the 5G BSs are switched off; the optimal BW is proportional to Pmin, as given in Equation (11). However, for a high data rate, a BW greater than 10 MHz can be used. In this case, the full coverage is not secure because the Pmin required is high. It is plausible that big bandwidth has the possibility of improving the EE when compared to a small bandwidth within the same size coverage area based on the premise that big bandwidth can support more resource blocks, eventually leading to a higher data rate.
For the downlink (DL), i.e., from the BS to the UE, the BS typically selects the MCS based on the channel quality indicator (CQI) feedback characteristics of the UE receiver, i.e., the SINR via an adaptive link strategy. Based on assumptions made in [38], Figure 9 shows the relationship between the radius of the cell, Pmin, and the MCS. The received power level is obtained from the sensitivity calculation in Equation (9), and the values of SINR, IM, etc., are retrieved from Table 1.
When Pmin reduces, the MCS reduces simply because the demodulation error rate rises as a result of the rise in both the noise and interference. This analysis is of a cell radius of 500 m (edge of the LTE cell), denoting a cell experiencing a low-traffic case; the lowest modulation rate (QPSK) supports a cell radius of 500 m. For LTE with a 10 MHz BW, this case involves 50 resource blocks (RBs) with each RB including 12 subcarriers, each subcarrier having seven symbols for normal CP, and the time of the slot set to 0.5 ms. Hence, the total number of symbols per RB is 12 × 7 × 2 = 168 symbols per ms. Therefore, 8400 symbols per ms are identified in this case. When 1/8 QPSK is used (2 bits per symbol), the data rate will be 2.1 Mbps for a single chain, and with 2 × 2 MIMO (2T, 2R), the data rate will be twice that of a single chain, i.e., 4.2 Mbps, for the worst case of SINR. Figure 10 shows the data rate versus cell radii, with Ptx = 43.1 dBm and BW = 10 MHz.
For a 5G mm-wave small cell with a 500 MHz BW, 694 RBs are available. LTE technology comprises a RB having 12 subcarriers with 60 kHz subcarrier space. Then, each of the subcarrier has seven symbols for normal CP and six symbols for extended CP. Both the normal and extended CP have a slot time of 0.1 ms [47]. Mathematically, it is possible to estimate the number of symbols per RB as 12 × 7 × 10 = 840 symbols per ms, corresponding to 582,960 symbols per ms. On the other hand, if 1/8 QPSK is deployed for edge users (2 bits per symbol with a coding rate of 1/8), the data rate is 0.146 Gbps for a single chain. Therefore, with eight antenna sectors, the data rate is 8 times that of a single chain, for a total of 1.167 Gbps. In addition, with a high-order modulation 64QAM, the total data rate with 500 MHz BW and eight antennas is up to 22.4 Gbps. Figure 11 summarizes the data rate versus MCS and BW for eight antennas. Moreover, Figure 12 summarizes the data rate that can be achieved with various numbers of antennas for different BWs at the edge of 5G small cells.
Hence, in a high-traffic case, both the LTE and 5G cells are active and serve the users in the network. However, the priority goes to the 5G small cells that can provide the minimum data rate at the edge of the 5G cell of 1.167 Gbps at 1/8 QPSK with BW = 500 MHz and eight antennas used, as shown in Figure 9. By contrast, for the low-traffic case (energy saving case), the 5G BSs are switched off, and coverage is guaranteed by the LTE BSs; the maximum data rate at the edge of the LTE cell is 4.2 Mbps (R = 500 m) at 1/8 QPSK with BW = 10 MHz and two antennas used, as shown in Figure 8. However, the 4.2 Mbps data rate during the low traffic case (11 PM to 10 AM) is acceptable because the number of subscribers that are using the network for downloading data is so low during that time. Meanwhile, the voice calls are secured with full coverage by the LTE BSs. Figure 13 shows the EE performance for LTE BSs versus the cell radii.
From Figure 13, the EE at the edge of the LTE cell is 7.19 kb/j, which was computed based on Equation (18), i.e., a data rate of 4.2 Mbps at 1/8 QPSK with BW of 10 MHz and two antennas used, divided by the total power consumption of the 584.12 W.
For a 5G small cell, the EE at 1/8 QPSK with BW 500 MHz and eight antennas used is 25.06 Mb/j, as shown in Figure 14, where the data rate of 1.167 Gbps is divided by the total power consumption of 46.57 W. Moreover, Figure 15 shows EE versus the number of antennas for the different BWs at the edge of the 5G small cell.
Finally, the energy savings achieved by the proposed method is briefly discussed. The simulation layout involved seven 5G BSs and covered a smaller area than the LTE BS (as shown in Figure 3). The 5G BSs are active for only 13 h (10 a.m. to 11 p.m.) during peak time (as shown in Figure 2) and are in sleep mode at other times. The LTE BSs are active all the time; during high-traffic periods, they ensure the coverage and support of the 5G BSs, whereas during low-traffic periods, LTE BSs have two functions, data delivery and ensuring maximum coverage and radio service.
(i)
Without the switch-off, all BSs are active for 24 h:
E C o n s d a y = ( N B S a c t i v e × P o p B S ) × day   time = [ ( 1   LTE   BSs × P o p L T E ) + ( 7   5 G   BSs × P o p 5 G ) ] × 24   h = [ ( 1 × 584.2 ) + ( 7 × 46.57 ) ] × 24 = 21.84   kWh .
(ii)
With the proposed switch-off:
E C o n s d a y = 13 [ ( 1 × 584.2 ) LTE   BSs   ( on ) + ( 7 × 46.57 ) 5 G   BSs   ( on ) high   traffic ] + 11 [ ( 1 × 584.2 ) LTE   BSs   ( on ) + ( 7 × 0.9 ) 5 G   BSs   ( off ) low   traffic ] = 18.32   kWh .
The energy savings that can be achieved is 3.52 kWh per day in this case study, which meets the needs of mobile subscribers for high-speed data at peak time. Figure 16 summarizes the data rate versus network power consumption over time based on the network layout shown in Figure 1. However, the energy savings in this approach depends on the number of BSs that will be turned off. If a large number of BSs are turned off, then the energy savings will be substantial.

6. Conclusions

The current dense BSs placement that is driving the small coverage area concept has resulted in unpredictable traffic patterns for each BS, lending credence to the proposed BSs switching-on/off algorithm. The proposed strategies conserve energy by monitoring the traffic load of the network and deciding whether to switch certain BSs off or on. This study investigated the possibility of achieving a balance between network performance and energy savings in dual radio access cellular networks—LTE and 5G—by having the 5G-BSs switched off/on, reflecting the instantaneous traffic load situation, while guaranteeing service and coverage. The simulation results demonstrated that the proposed cooperation management approach can achieve an energy savings of up to 3.52 kW per day. However, the energy savings in this approach depends on the number of BSs that will be turned off. Future work will investigate the 5G BSs switching-off/on under an offloading mechanism, which is one of the crucial issues in the 5G network.

Author Contributions

As the first author, M.H.A. has conducted simulation, and wrote the main parts and the first draft of this paper. A.H.K. revised the first version of paper. J.H.K. wrote the introduction section. J.K. revised the final version of paper.

Funding

This work was supported by the Human Resources Development of the Korea Institute of Energy Technology Evaluation and Planning (KETEP) grant funded by the Korea government Ministry of Trade, industry and Energy (No. 20164030201340).

Conflicts of Interest

The author declare that they have no competing interests.

References

  1. MAlsharif, H.; Nordin, R.; Abdullah, N.F.; Kelechi, A.H. How to make key 5G wireless technologies environmental friendly: A review. Trans. Emerg. Telecommun. Technol. 2018, 29, e3254. [Google Scholar] [CrossRef]
  2. Ericsson Mobility Report 2018. November 2018. Available online: https://www.ericsson.com/assets/local/mobility-report/documents/2018/ericsson-mobility-report-november-2018.pdf (accessed on 8 March 2019).
  3. Yaqoob, I.; Hashem, I.A.T.; Ahmed, A.; Kazmi, S.A.; Hong, C.S. Internet of things forensics: Recent advances, taxonomy, requirements, and open challenges. Future Gener. Comput. Syst. 2019, 92, 265–275. [Google Scholar] [CrossRef]
  4. Sah, D.K.; Kumar, D.P.; Shivalingagowda, C.; Jayasree, P. 5G Applications and Architectures. In 5G Enabled Secure Wireless Networks; Springer: New York, NY, USA, 2019; pp. 45–68. [Google Scholar]
  5. Alsharif, M.H.; Nordin, R. Evolution towards fifth generation (5G) wireless networks: Current trends and challenges in the deployment of millimetre wave, massive MIMO, and small cells. Telecommun. Syst. 2017, 64, 617–637. [Google Scholar] [CrossRef]
  6. Abrol, A.; Jha, R.K.; Jain, S.; Kumar, P. Joint power allocation and relay selection strategy for 5G network: A step towards green communication. Telecommun. Syst. 2018, 68, 201–215. [Google Scholar] [CrossRef]
  7. Lloret, J.; Sendra, S.; Macias-Lopez, E. Advances in Green Communications and Networking. Mob. Netw. Appl. 2019, 1–4. [Google Scholar]
  8. Mowla, M.M.; Ahmad, I.; Habibi, D.; Phung, Q.V. A green communication model for 5G systems. IEEE Trans. Green Commun. Netwo. 2017, 1, 264–280. [Google Scholar] [CrossRef]
  9. Hasan, Z.; Boostanimehr, H.; Bhargava, V.K. Green cellular networks: A survey, some research issues and challenges. IEEE Commun. Surv. Tutor. 2011, 13, 524–540. [Google Scholar] [CrossRef]
  10. Ismail, M.; Zhuang, W.; Serpedin, E.; Qaraqe, K. A survey on green mobile networking: From the perspectives of network operators and mobile users. IEEE Commun. Surv. Tutor. 2015, 17, 1535–1556. [Google Scholar] [CrossRef]
  11. Alsamhi, S.; Ma, O.; Ansari, M.S.; Meng, Q. Greening internet of things for smart everythings with a green-environment life: A survey and future prospects. arXiv, 2018; arXiv:1805.00844. [Google Scholar]
  12. Alnoman, A.; Carvalho, G.H.; Anpalagan, A.; Woungang, I. Energy efficiency on fully cloudified mobile networks: Survey, challenges, and open issues. IEEE Commun. Surv. Tutor. 2018, 20, 1271–1291. [Google Scholar] [CrossRef]
  13. Andrae, A.; Edler, T. On global electricity usage of communication technology: Trends to 2030. Challenges 2015, 6, 117–157. [Google Scholar] [CrossRef]
  14. Malmodin, J.; Lundén, D. The energy and carbon footprint of the global ICT and E&M sectors 2010–2015. Sustainability 2018, 10, 3027. [Google Scholar] [CrossRef]
  15. Piovesan, N.; Gambin, A.F.; Miozzo, M.; Rossi, M.; Dini, P. Energy sustainable paradigms and methods for future mobile networks: A survey. Comput. Commun. 2018, 119, 101–117. [Google Scholar] [CrossRef] [Green Version]
  16. Oviroh, P.; Jen, T.-C. The energy cost analysis of hybrid systems and diesel generators in powering selected base transceiver station locations in Nigeria. Energies 2018, 11, 687. [Google Scholar] [CrossRef]
  17. Suarez, L.; Nuaymi, L.; Bonnin, J.-M. An overview and classification of research approaches in green wireless networks. EURASIP J. Wirel. Commun. Netw. 2012, 2012, 142. [Google Scholar] [CrossRef] [Green Version]
  18. Wu, J.; Zhang, Y.; Zukerman, M.; Yung, E. Energy-Efficient Base Stations Sleep Mode Techniques in Green Cellular Networks: A Survey. IEEE Commun. Surv. Tutor. 2015, 17, 803–826. [Google Scholar] [CrossRef]
  19. Li, G.Y.; Xu, Z.; Xiong, C.; Yang, C.; Zhang, S.; Chen, Y. Energy-efficient wireless communications: Tutorial, survey, and open issues. IEEE Wirel. Commun. 2011, 18, 28–35. [Google Scholar] [CrossRef]
  20. Feng, D.; Jiang, C.; Lim, G.; Cimini, L.J.; Feng, G.; Li, G.Y. A survey of energy-efficient wireless communications. IEEE Commun. Surv. Tutor. 2013, 15, 167–178. [Google Scholar] [CrossRef]
  21. Wang, X.; Vasilakos, A.V.; Chen, M.; Liu, Y.; Kwon, T.T. A survey of green mobile networks: Opportunities and challenges. Mob. Netw. Appl. 2012, 17, 4–20. [Google Scholar] [CrossRef]
  22. Alsharif, M.H.; Nordin, R.; Ismail, M. Survey of Green Radio Communications Networks: Techniques and Recent Advances. J. Comput. Netw. Commun. 2013, 2013, 453893. [Google Scholar] [CrossRef]
  23. Oh, E.; Krishnamachari, B.; Liu, X.; Niu, Z. Toward dynamic energy-efficient operation of cellular network infrastructure. IEEE Commun. Mag. 2011, 49, 56–61. [Google Scholar] [CrossRef]
  24. Oh, E.; Son, K.; Krishnamachari, B. Dynamic base station switching-on/off strategies for green cellular networks. IEEE Trans. Wirel. Commun. 2013, 12, 2126–2136. [Google Scholar] [CrossRef]
  25. Chiaraviglio, L.; Ciullo, D.; Meo, M.; Marsan, M.A.; Torino, I. Energy-aware UMTS access networks. In Proceedings of the IEEE W-GREEN, Lappland, Finland, 8–11 September 2008; pp. 1–8. [Google Scholar]
  26. Chiaraviglio, L.; Ciullo, D.; Meo, M.; Marsan, M.A. Energy-efficient management of UMTS access networks. In Proceedings of the 21st International Conference in Teletraffic Congress, Paris, France, 15–17 September 2009; pp. 1–8. [Google Scholar]
  27. Marsan, M.A.; Chiaraviglio, L.; Ciullo, D.; Meo, M. Optimal energy savings in cellular access networks. In Proceedings of the IEEE International Conference on Communications (ICC) Workshops, Dresden, Germany, 14–18 June 2009; pp. 1–5. [Google Scholar]
  28. Zhou, S.; Gong, J.; Yang, Z.; Niu, Z.; Yang, P. Green mobile access network with dynamic base station energy saving. In Proceedings of the ACM MobiCom, Beijing, China, 20–25 September 2009; Volume 2009, pp. 10–12. [Google Scholar]
  29. Gong, J.; Zhou, S.; Niu, Z.; Yang, P. Traffic-aware base station sleeping in dense cellular networks. In Proceedings of the 2010 18th International Workshop on Quality of Service (IWQoS), Beijing, China, 16–18 June 2010; pp. 1–2. [Google Scholar]
  30. Xiang, L.; Pantisano, F.; Verdone, R.; Ge, X.; Chen, M. Adaptive traffic load-balancing for green cellular networks. In Proceedings of the 2011 IEEE 22nd International Symposium on Personal Indoor and Mobile Radio Communications (PIMRC), Toronto, ON, Canada, 11–14 September 2011; pp. 41–45. [Google Scholar]
  31. Lorincz, J.; Capone, A.; Begusic, D. Impact of service rates and base station switching granularity on energy consumption of cellular networks. EURASIP J. Wirel. Commun. Netw. 2012, 2012, 342. [Google Scholar] [CrossRef] [Green Version]
  32. Bousia, A.; Antonopoulos, A.; Alonso, L.; Verikoukis, C. “Green” distance-aware base station sleeping algorithm in LTE-Advanced. In Proceedings of the IEEE International Conference on Communications (ICC), Ottawa, ON, Canada, 10–15 June 2012; pp. 1347–1351. [Google Scholar]
  33. Chen, T.; Yang, Y.; Zhang, H.; Kim, H.; Horneman, K. Network energy saving technologies for green wireless access networks. IEEE Wirel. Commun. 2011, 18, 30–38. [Google Scholar] [CrossRef]
  34. Sun, L.; Tian, H.; Zhang, P. Decision-making models for group vertical handover in vehicular communications. Telecommun. Syst. 2012, 50, 257–266. [Google Scholar] [CrossRef]
  35. Debus, W.; Axonn, L. RF Path Loss & Transmission Distance Calculations; Axonn, LLC: New York, NY, USA, 2006. [Google Scholar]
  36. Pi, Z.; Khan, F. An introduction to millimeter-wave mobile broadband systems. IEEE Commun. Mag. 2011, 49, 101–107. [Google Scholar] [CrossRef]
  37. Sulyman, A.I.; Nassar, A.; Samimi, M.K.; Maccartney, G.; Rappaport, T.S.; Alsanie, A. Radio propagation path loss models for 5G cellular networks in the 28 GHZ and 38 GHZ millimeter-wave bands. IEEE Commun. Mag. 2014, 52, 78–86. [Google Scholar] [CrossRef]
  38. Stefania, S.; Issam, T.; Matthew, B. LTE—The UMTS Long Term Evolution: From Theory to Practice; A John Wiley and Sons, Ltd.: New York, NY, USA, 2009; Volume 6, pp. 136–144. [Google Scholar]
  39. Goldsmith, A. Wireless Communications; Cambridge University Press: Cambridge, MA, USA, 2005. [Google Scholar]
  40. Bhattacharya, A.; De, A.; Biswas, A.; Roy, B.; Bhattacharjee, A.K. Application of Particle Swarm Optimization in Design of a Low-Profile Fractal Patch Antenna. In Advances in Computer, Communication and Control; Springer: New York, NY, USA, 2019; pp. 207–214. [Google Scholar]
  41. Tabibi, S.; Ghaffari, A. Energy-Efficient Routing Mechanism for Mobile Sink in Wireless Sensor Networks Using Particle Swarm Optimization Algorithm. Wirel. Pers. Commun. 2019, 104, 199–216. [Google Scholar] [CrossRef]
  42. Hildmann, H.; Atia, D.; Ruta, D.; Poon, K.; Isakovic, A. Nature-Inspired? Optimization in the Era of IoT: Particle Swarm Optimization (PSO) Applied to Indoor-Distributed Antenna Systems (I-DAS). In The IoT Physical Layer; Springer: New York, NY, USA, 2019; pp. 171–192. [Google Scholar]
  43. Kulkarni, R.V.; Venayagamoorthy, G.K. Particle swarm optimization in wireless-sensor networks: A brief survey. IEEE Trans. Syst. Man Cybern. Part C (Appl. Rev.) 2011, 41, 262–267. [Google Scholar] [CrossRef]
  44. Alsharif, M.H.; Nordin, R.; Ismail, M. Classification, Recent Advances and Research Challenges in Energy Efficient Cellular Networks. Wirel. Pers. Commun. 2014, 77, 1249–1269. [Google Scholar] [CrossRef]
  45. Anderson, C.R.; Rappaport, T.S. In-building wideband partition loss measurements at 2.5 and 60 GHz. IEEE Trans. Wirel. Commun. 2004, 3, 922–928. [Google Scholar] [CrossRef]
  46. Dehos, C.; Domenico, A.; Dussopt, L. Millimeter-wave access and backhauling: The solution to the exponential data traffic increase in 5G mobile communications systems? IEEE Commun. Mag. 2014, 52, 88–95. [Google Scholar] [CrossRef]
  47. Wang, H.; Pan, Z.; Chih, L.I. Perspectives on high frequency small cell with ultra dense deployment. In Proceedings of the IEEE International Conference on Communications in China (ICCC), Shanghai, China, 13–15 October 2014; pp. 502–506. [Google Scholar]
Figure 1. Expected growth of global mobile subscribers and data traffic [2]. (a) Expected growth of global mobile subscribers and (b) expected traffic growth and the percentage of each type of data.
Symmetry 11 00408 g001
Figure 2. Expected case electricity usage of wireless access networks.
Symmetry 11 00408 g002
Figure 3. Cellular network layout (R5G = 200 m; RLTE = 500 m).
Symmetry 11 00408 g003
Figure 4. Daily traffic load pattern of a BS.
Symmetry 11 00408 g004
Figure 5. The decision-making algorithm proposed for the BS switching-off/on process.
Symmetry 11 00408 g005
Figure 6. Pseudocode of the considered PSO algorithm.
Symmetry 11 00408 g006
Figure 7. Behavior of the fitness function with a change in the constraint parameters.
Symmetry 11 00408 g007
Figure 8. Behavior of the constraint parameters.
Symmetry 11 00408 g008
Figure 9. Cell radii versus receiver sensitivity power for different MCSs, with Ptx = 43.1 dBm and BW = 10 MHz.
Symmetry 11 00408 g009
Figure 10. Data rate versus macrocell radii, with Ptx = 43.1 dBm, BW = 10 MHz, and 2 × 2 MIMO.
Symmetry 11 00408 g010
Figure 11. 5G small cell data rate versus MCS and BW for eight antennas.
Symmetry 11 00408 g011
Figure 12. Data rate versus different BWs values for different numbers of antennas at the edge of 5G small cell.
Symmetry 11 00408 g012
Figure 13. Energy efficiency versus cell radii, with Ptx = 43.1 dBm and BW = 10 MHz.
Symmetry 11 00408 g013
Figure 14. 5G small cell EE versus MCS and BW at eight antennas.
Symmetry 11 00408 g014
Figure 15. Energy efficiency versus different BW values for different numbers of antennas.
Symmetry 11 00408 g015
Figure 16. Data rate versus power consumption over time.
Symmetry 11 00408 g016
Table 1. List of simulation parameters.
ItemParameterAcronymLTEUnit
Network parametersFrequencyf2.6GHz
BandwidthBW1.4–20MHz
Cell radiusR0.5km
Base station parametersTransmission power P t x min P t x max 10–40W
40–46dBm
Antenna heighthBS20m
Antenna gainGminGmax5–10dB
Number of antennasNAnt.2#
Number of sectorsNSect.3#
Number of carriersNCarr1#
Mobile station parametersThermal noise densityNo174dBm/Hz
Noise figureNf9dB
Implementation marginIM3dB
Antenna heighthUE1.5M
Propagation lossesMorphologyUurban
Propagation model3GPP UMa-NLOS
Avg. building heighthbl20m
Street widthWst20m
SINRSINRmin−5.1dB
SINRmax18.6
Shadow fading marginσ4–8dB
Exponent path lossα3.2#

