Article

Application of Fuzzy Analytical Network Process (ANP) and VIKOR for the Assessment of Green Agility Critical Success Factors in Dairy Companies

1
Azman Hashim International Business School, Universiti Teknologi Malaysia (UTM), Skudai 81310, Johor, Malaysia
2
Lithuanian Institute of Agrarian Economics, V. Kudirkos g. 18, 03105 Vilnius, Lithuania
*
Author to whom correspondence should be addressed.
Symmetry 2019, 11(2), 250; https://doi.org/10.3390/sym11020250
Submission received: 14 December 2018 / Revised: 9 February 2019 / Accepted: 12 February 2019 / Published: 16 February 2019

Abstract

:
Manufacturing companies are facing rapid and unanticipated changes in their business environment. Most of these companies need to find new strategies to remain competitive in the market. Therefore, the main purpose of this study is to integrate the Fuzzy Analytical Network Process (ANP) and VIKOR methods to evaluate the green agile factors and sub-factors in the dairy companies in Iran. To find the green agile factors and sub-factors, this study used the expert’s opinions and literature review. Data is collected from four dairy companies. The results of this study showed that the most important green agility factors are: trust-based relationship with suppliers, flexible production capacity, versatile workers, compliance with quality standards for a new product, and workers’ willingness to learn. In addition, the results indicated that the green agility organization is one of the strategies that help companies to stay in the market. To validate the results, this study used four methods, including TOPSIS, ARAS, EDAS, and MABAC. The necessity of a reaction to the increasing customer choices, environmental concerns, and competitiveness among manufacturers across the globe has engaged the industry to embrace innovative manufacturing strategies.

1. Introduction

In recent years, firms have been obliged to make changes to their business process because of market transformations and technology innovations. Cost, quality, timeliness, and even flexibility are progressively becoming order qualifiers, hence pushing firms to devise businesses gravitating around innovativeness, responsibility, and customer intimacy [1]. Golpîra et al. [2] believe that it is important for companies to obtain a balance between economic interests and environmental protection, especially because of altered consumers’ behavior toward green products and services.
Lee et al. [3] reported that green business accepts the environmental principles and respects the environment, which improves the quality of life for customers and protects existing resources. Green business operations involve reducing, reusing, recycling, reworking, returning, and remanufacturing [4]. Green marketing is focused on developing and marketing the products and services that can satisfy the customers’ needs while taking environmental sustainability into account [5]. In addition, firms can focus on developing new and clean products. If products are overpriced or produced with lower quality or fail to consider the environmental benefits, the customers will not be attracted to them, and this will affect the firm’s overall performance [6].
In recent years, environmental management issues have become more and more important to both public and private organizations [7]. Improvement of image, profitability, levels of emissions or customer satisfaction are several reasons for organizations to further consider environmental issues. The companies need to minimize adverse environmental impacts and waste of resources and raw materials during the procedure from the very beginning to the final stage and disposal of products [3]. Jovanović et al. [8] reported that organizations are in need of continuous change and development and require the implementation of various strategies. Agility is the normal evolution of flexibility over time which can help modern business organizations to remain in the competitive markets [9].
Implementation of agile methods can help companies to tailor the services and products to dynamic markets [10]. An agile organization is not only compatible with the business environment and ready for these anticipated changes but also qualified enough to sense the changes and respond to them in a quick and effective manner [11]. Nowadays, agility is a necessity for ensuring a competitive advantage and surviving. Customers demand the best products at a better price, less time, more customized, and in the desired value. This brings some problems for companies attempting to increase their market share. These companies are encountering a dynamic and unpredictable environment. Thus, agility and agility assessment of systems have been recognized as a necessary step for competing in a highly turbulent environment. Agile methods can help firms to have the best reaction to these challenges [12].
Agile manufacturing environment should be implemented in a consistent and systematic manner. Agile companies must be innovative, highly responsive, constantly experimenting in order to improve existing products and processes, and striving for less variability and greater capability [13]. Manufacturing practices for managing agility include enterprise integration, shared database, multimedia information network, product and process modeling, intelligent process control, virtual factory, design automation, super-computing, product data standards, paperless transactions via Electronic Data Interchange (EDI), high-speed information highway, etc. [14]. Ip et al. [15] suggested that the order of introduction of agility on shop floor should be adopting cellular layout followed by the reduction in a number of setups, paying attention to integrated quality, preventive maintenance, production control, inventory control, and finally improving relations with suppliers.
One of the goals of agile manufacturing is to produce customized products in a short time at low cost [16]. Another goal of all agile methods is to deliver products quickly and to adapt to changes in the process, product, and environment [17]. Jayatilleke and Lia [18] suggest that a wide variety of organizational settings have accepted the agile methods. Some methods are suitable for certain organizational environments while for a smaller organization, agile development is suitable.
Agile development designs new business models to enhance competitiveness and urges the need for a new organization model [19]. To win the competition in the global manufacturing environment, cooperation and collaboration among enterprises have played a key role in recent years [9]. Some factors affecting the environmental concerns include reduced response time to the customers, need to reach world-class score-cards, and coexistence with international competitors. These are the crucial factors in regards to the market needs [20].
Despite all these benefits, dairy companies all over the world suffered a dramatic decline in sale during the last decades. Iran, as the biggest dairy producer in the Middle East, producing 1.5 million tons of milk per year [21], is not an exception. The selected companies for this study (i.e., Kaleh, Haraz, Gela, and Saleh) are located in the same province (Mazandaran) and play an important role in the dairy market in Iran. They deliver their products to all parts of the country and also export them to countries, such as Afghanistan, Iraq, etc. These four companies employ several methods to introduce their products to the market, but nowadays they face problems to respond to the customers’ demand and attract them to their brands. These companies produce a variety of dairy products and distribute them in a competitive market. Thus, these companies need to identify factors, metrics, and measures of green agility in order to satisfy the demands of the market. Many researchers [22,23] have discussed certain green production practices, such as green manufacturing, raw material reduction, and environmental design. Through the process of green production, the quality and variety of products must be taken into consideration [24]. The previous research has discussed the factors that can improve the green agility in the companies. However, there is a lack of research regarding the investigation of these factors in Iranian dairy companies. Therefore, the current study tries to fill this gap by identifying the key factors and sub-factors and providing a method for their measurement. Moreover, a comparative analysis of the green agility levels of these companies is provided.

2. Literature Review

The main factors determined in the previous studies are investigated in this paper. They are divided into five main categories: Market and customer agility, Technology agility, Production agility, Management agility, and Workforce agility.

2.1. The Market and Customer

Aravindraj and Vinodh [25] refer to this factor as an agile manufacturing capability. The customers’ demand is increasing; thus, complex and dynamic actions are required to give appropriate services to customers. They expect to receive the products within a shorter period. Manufacturing organizations are attempting to be agile to produce a variety of products within a short period in a cost-effective manner. Heinonen and Strandvik [26] noted that providers see customers as targets to be activated and controlled, and the main concern for manufacturers is to differentiate themselves from their direct competitors. Peng et al. [27] believe that customers’ behavior is changing. These dramatic changes to the fundamental characteristics of markets and business environments have precipitated an interest in creating new models for organizations. Based on researchers’ opinion, markets need green agile products that can support the customers’ demand. Customers pay attention to products that are perfectly suited to the environment.

2.2. Technology

Ji Sun et al. [28] noted that in such a dynamic environment, companies face increasing competition, including severe competence gaps, which presents a fundamental threat to their competitiveness and mere existence. In general, technology appropriation is greatly dependent upon and shaped by the surrounding environment, including social and economic forces beyond managerial intent. Matikiti et al. [29] believe that considering the social nature of technology and environment—when technology implies the relationship between social actors, and environment represents opportunities and constraints that can potentially promote or thwart an individual’s goal attainments—we can understand that there is an interaction between technology and environment in reality. This is because how individuals use appropriate technology for their own goals is dependent on whether or not other social actors can create opportunities and/or remove constraints [27].
Mergel et al. [30] found that agile software development approaches involve creating, testing, and improving technology products incrementally in short, iterative sprints. The goal is to increase response to changes or mistakes discovered in the development processes. The overall project is broken down into small modules and short sprint cycles. Many of these agile principles have also made it into the agile development manifesto. Developing the technology approach also involves creating, testing, and improving technology products incrementally in short, iterative sprints. Based on Hausman and Johnston research [31], to gain a competitive advantage, it is crucial to develop innovations and technologies during the recession period. The literature on innovation notes that firms’ innovative capacity depends greatly on external competitive pressures. Dai et al. [32] believe that to compete and succeed in stable markets, there is a need for different resources and innovative strategies. The high-tech entrepreneurial ventures have responded to the economic crisis through investments in product innovation and expansion into international markets. However, low-tech industries have to face additional difficulties in managing R&D projects during a crisis, as they require greater internal organizational capabilities to fit to rapidly changing external environments. It is important to have innovation activities in the long term to endure competitive pressures. In addition, firms need to develop strong internal capabilities to support their strategic objectives and survive during economic downturn conditions [33]. To answer the customers’ demand, it is important to have facilities that can help us produce the products as soon as possible.

2.3. Production

Aqlan et al. [34] noted that dynamic changes in market demands and companies’ strategies require the flexible introduction of new products and implementation of continuous improvement to internal processes in order to cope with the changes. One of the improving changes is consolidating production lines, especially when demand decreases and companies’ strategies change.
Hasan et al. [35] believe that the traditional production layout is facing challenges as the product demands become smaller and shorter in lead-times. Lead times, set up times, work in process, quality, machine utilization, and employee job satisfaction are related to the production agility. Agile manufacturing is focused on these factors based on customers’ demand [36]. According to emerging economy firms’ (EEFs) opinion, to update the ideas about suppliers and move towards producing low-cost products, companies should focus on process development in a way to improve the products through moving from the state of mere imitation to innovation. They have gained momentum in many industries and have competed with developed firms not only within their own emerging markets but also within more developed ones. Successful EEFs are growing faster than their counterparts from developed markets and have been identified as global challenges [37]. This factor, which plays an important role in agile paradigms, affects key issues, such as modeling, producing, and delivering the products to customers.

2.4. Management

Famiyeh et al. [38] believe that Environment Management Practice (EMP) is a tool for an organization to manage the impacts of its activities on the environment. It provides a structured approach to planning and implementing environmental protection measures. EMP monitors environmental performance similar to the way a financial management system monitors expenditure and income, which enables an organization to regularly check its financial performance. Additionally, EMP integrates environmental management into a company’s daily operations, long-term planning, and other quality management systems. Rathi [39] found that EMP is also one of the tools an organization can use to implement environmental policy. It illustrates an extension of the core principles of total quality programs to manage the environment. In other words, EMP can be described as the systematic application of business management to environmental issues [40]. It is important to understand the organizations’ adoption behavior and identify the determinants of innovation by distinguishing the types of innovation. As adopting EMP involves implementing new or modified processes, techniques or systems to reduce environment damages, the adoption behavior can be considered as a technical innovation process [40].
Agile innovation management describes a set of project management and software development processes, adjusted procurement procedures combined with HR policies and organizational and managerial approaches in a way to support innovative digital service delivery in government. Innovation in government software development happens using an agile software development approach adopted from the private sector [30]. The firm’s structure affects the firm’s conduct, hence influencing its performance. Originally, most researchers took the approach of studying the structure of the industry and its direct links with the performance achieved [41]. It is important to test how political connections affect accounting quality, as stakeholders rely on corporate disclosure to improve their decision-making quality [42]. Managers make the decision about the company’s strategy and can integrate agility into their decision-making processes.

2.5. Workforce

Agility of the workforce is broader than its flexibility, and it addresses a more strategic level. Workforce agility adds issues, such as motivation, attitude, behavior, and abilities, to human factors [43]. The Pitafi et al. [44] indicated that the agility shows an employee’s ability of percipience and capability of responding to external changes, which requires the acquisition, interpretation, and utilization of relevant information. These information-processing procedures have an influence on employees in the workplace. Agility of employees reflects their ability to deal with environmental uncertainty through sensing and responding to external changes [45]. To build such agility, employees need to have sufficient sources of information and capabilities for processing such information. Specifically, agility contains the component of promptly sensing external changes, which requires employees to acquire a variety of information from multiple resources [44]. The workforce is one of the organizational parts in manufacturing without which no product can be produced. Therefore, this factor plays a key role in any company. Literature consists of studies conducted to find out agile factors. Table 1 shows the relevant factors and drivers.

3. Methods and Data

Data collection is important in any research since data leads to information. The more complete the information, the more correct and error-free results will be obtained. For this reason, the information about the factors and sub-factors are all collected from credible sources. 
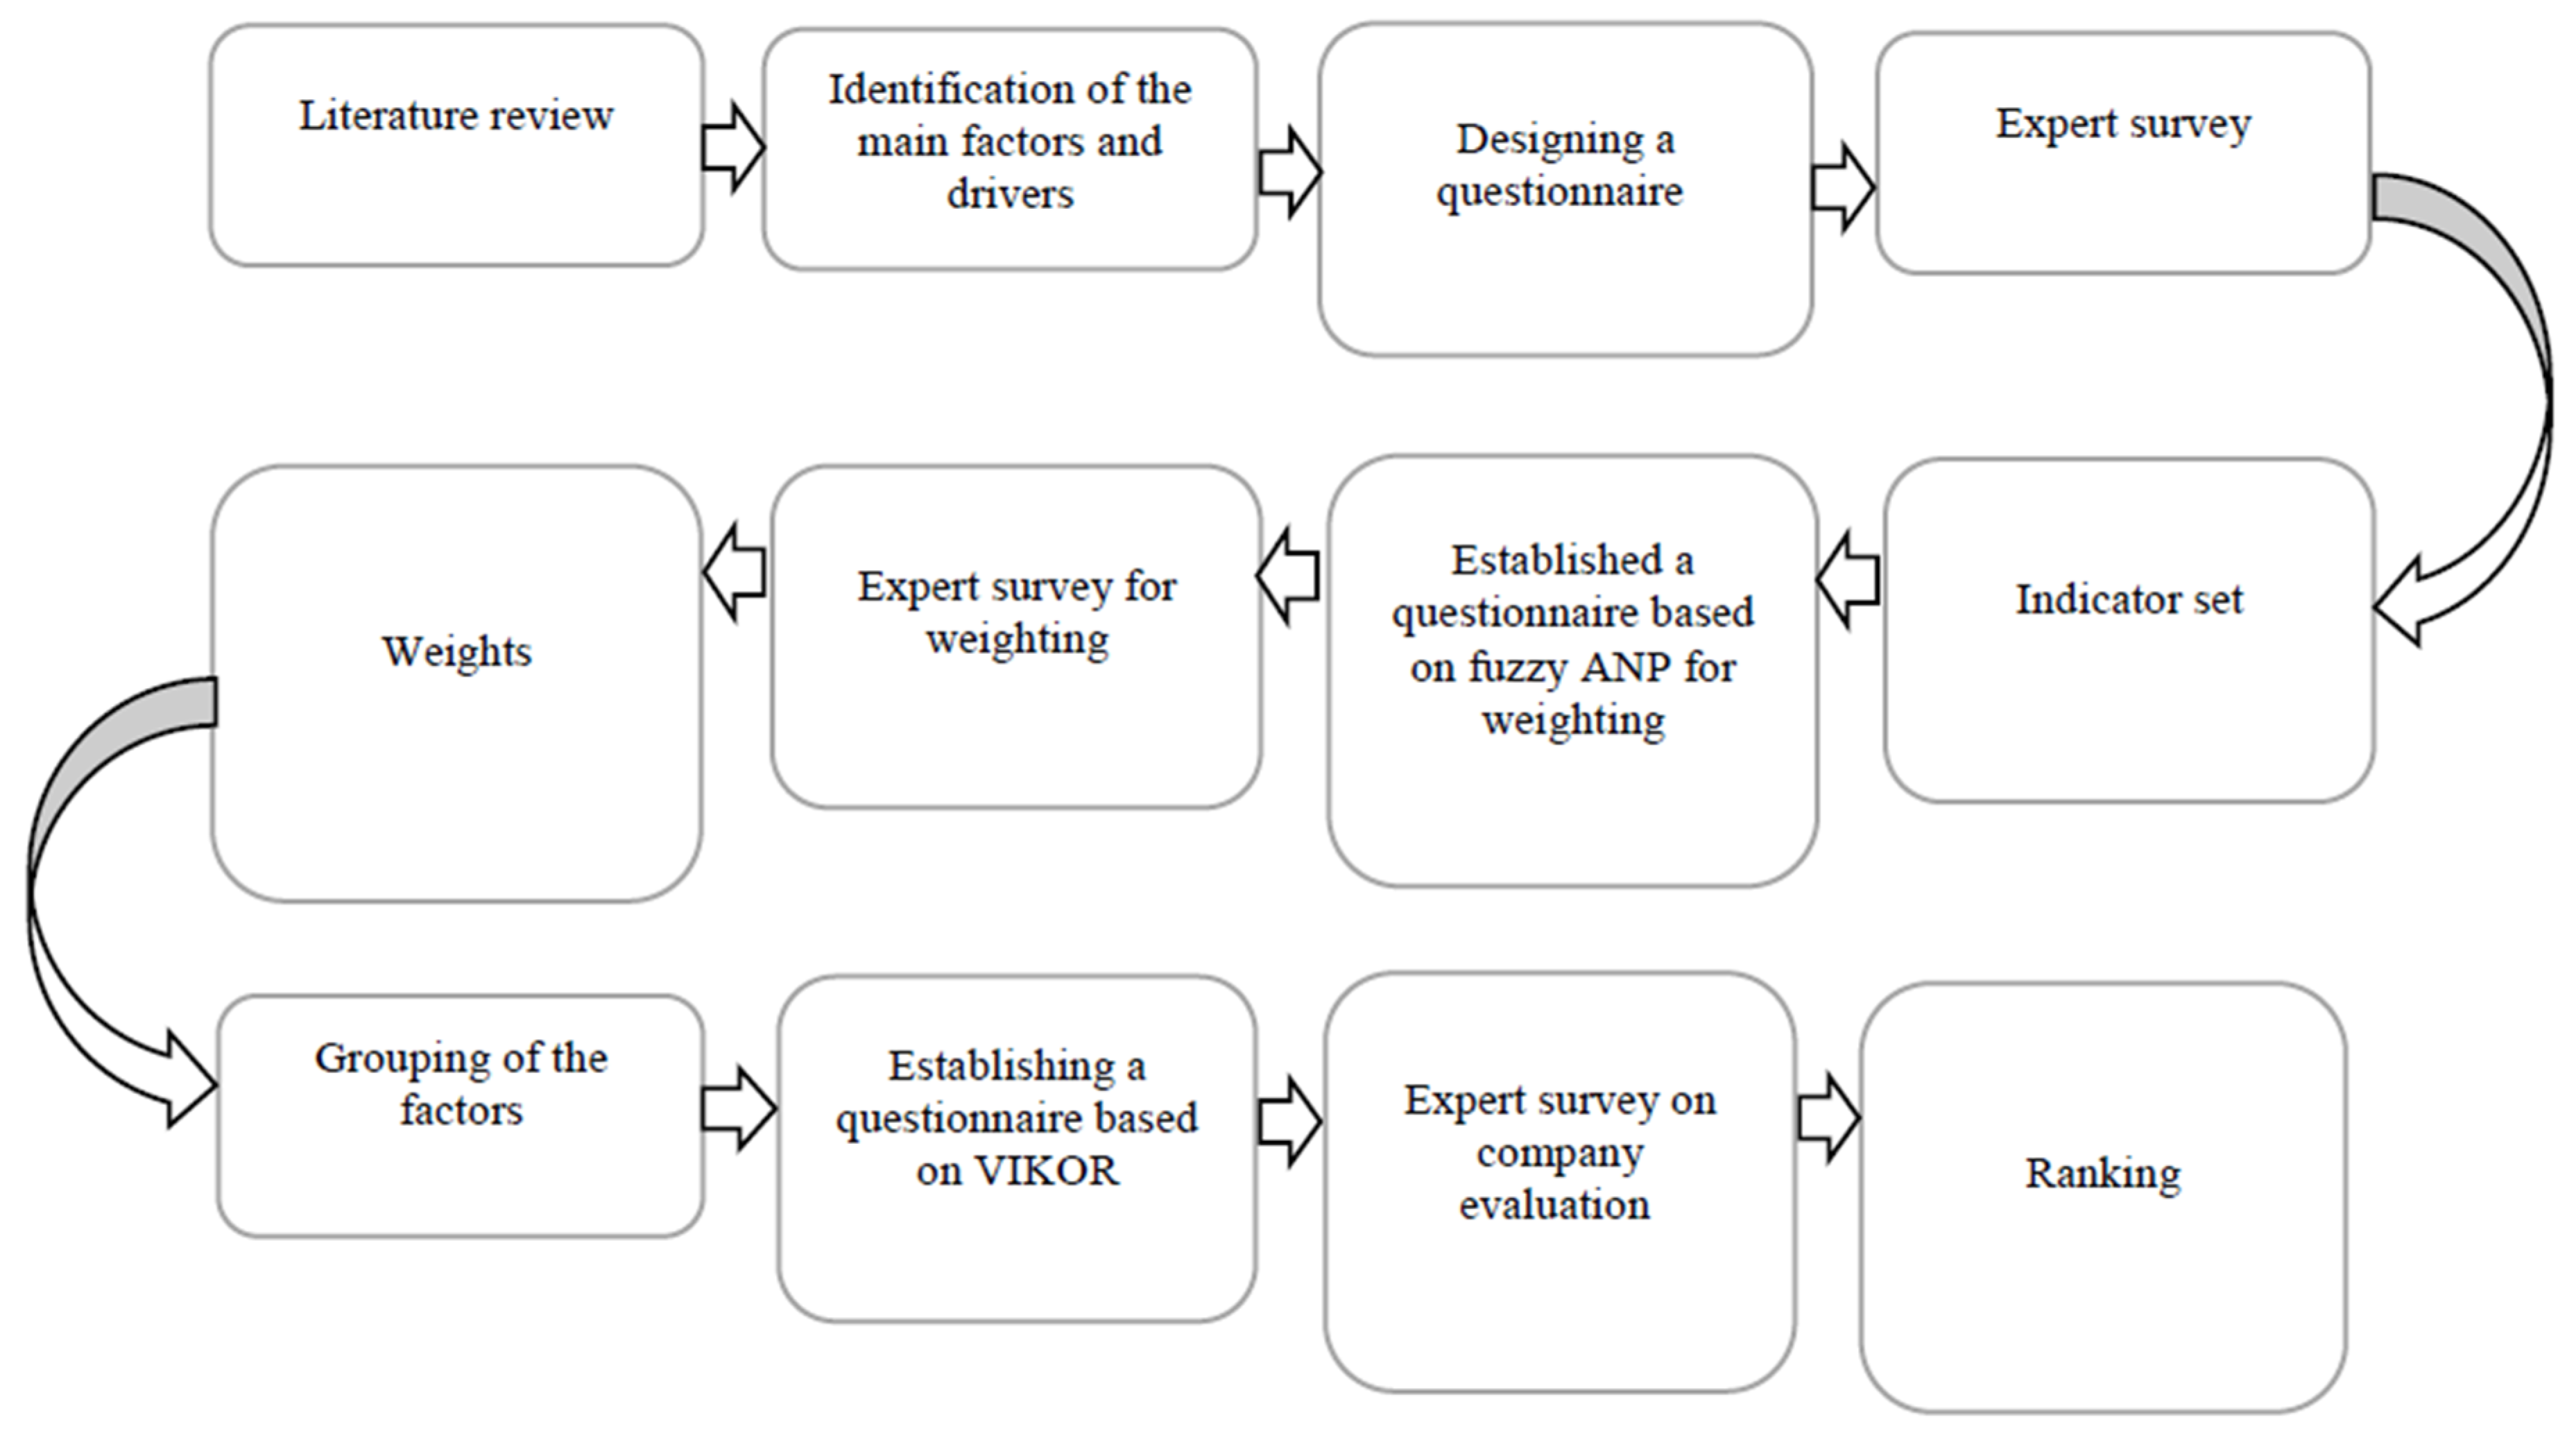
Figure 1 shows the process of methodology. The research model is developed based on 21 experts’ opinions. To collect the data from the selected companies, three separate questionnaires were prepared and filled by the participating specialists of the companies to detect the degree of factors’ importance. The first questionnaire was used to determine the sub-factors. The experts then ranked the sub-factors from one to nine (lowest to highest importance), as shown in Table 2. 17 sub-factors from 35 sub-factors were finally selected and assessed. In the second questionnaire, paired comparisons were made between factors and sub-factors since the research was to compare fuzzy criteria. Nine-hour fuzzy spectrum was used that was preferably the same, interstitial, less preferred, in between, very little, intermediate, very high priority, and very little in between. In the third questionnaire, the companies were evaluated based on the green agility and ranked by VIKOR. A spectrum of seven language variables, such as very weak, weak, weak to moderate, moderate, relatively good, good, and very good, was used for the evaluation of factors and sub-factors within the company. Table 2 and Table 3 show the equivalent fuzzy numbers, while Table 4 shows the experts’ opinions about the important factors.
In this paper, the Fuzzy Analytical Network Process (ANP) and VIKOR methods are used to find and evaluate the green agile factors and sub-factors. The ANP is a generalization of the Analytic Hierarchy Process (AHP), popularly known as AHP. AHP is a theory of prioritization that derives relative scales of absolute numbers known as ‘priorities’ from judgments expressed numerically on an absolute fundamental scale [74]. The ANP framework has three basic features, which are useful in multi-criteria decision-making problems: (1) modeling the system’s complexity, (2) measuring on a ratio scale, and (3) synthesizing. The local priorities in ANP are established in the same manner as they are in AHP using pairwise comparisons and judgments. However, the supermatrix approach, popularly known as the ANP approach, is becoming an attractive tool to understand more of the complex decision problem as it overcomes the limitation of the AHP’s linear hierarchy structure [75].
The aim of Fuzzy ANP is to capture the ‘fuzziness’ or the vagueness-type uncertainties in the evaluation of remedial countermeasures, particularly, at the initial phase of remediation planning. Due to the complexity and uncertainty involved, as well as the inherent subjective nature of human judgments, it is sometimes unrealistic and infeasible to acquire exact judgments in pairwise comparisons. It is more natural or easier to provide verbal judgments when giving a subjective assessment. Based on the concept of fuzzy logic and the VIKOR method, the proposed VIKOR method has been developed to provide a rational, systematic process to discover the best solution and a compromise solution that can be used to resolve a fuzzy multi-criteria decision-making problem. The proposed VIKOR allows decision-makers to specify the preferred solutions for a given decision problem in real organizational settings [76]. The calculations were carried out by MATLAB and Excel software.

3.1. Fuzzy ANP

Saaty [
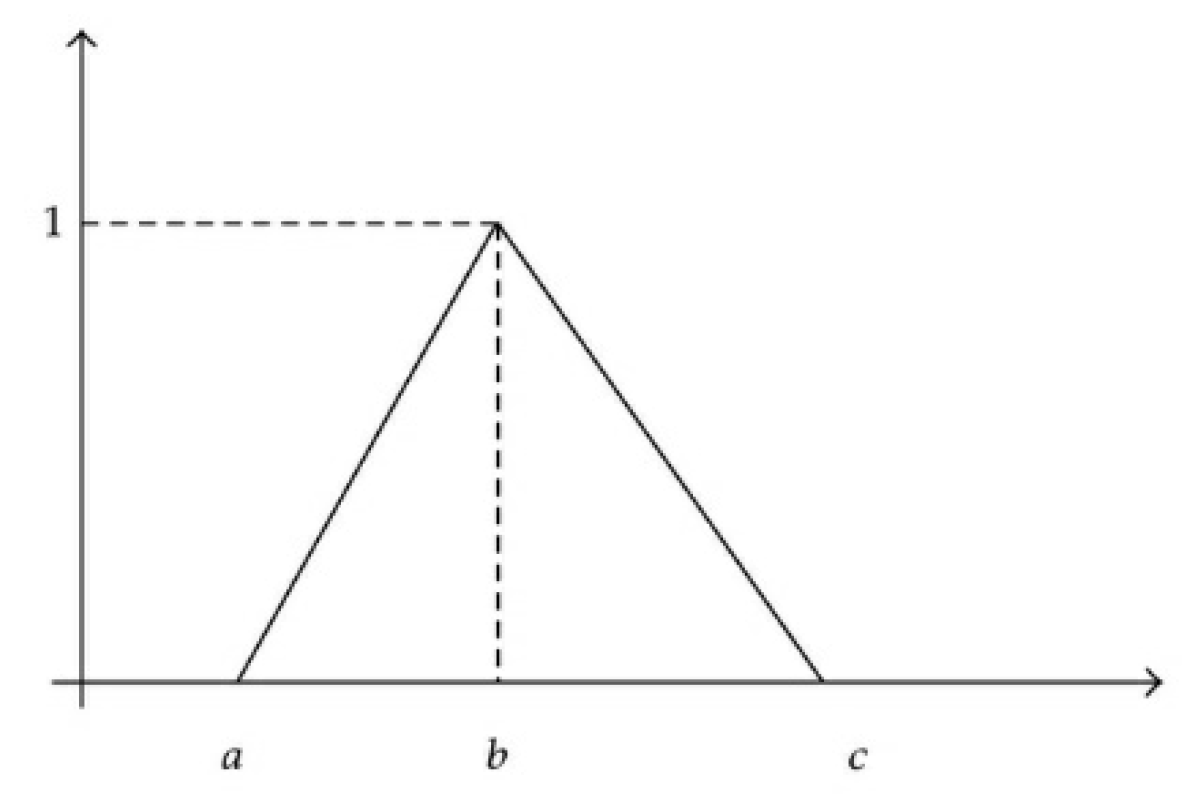
74] introduced the ANP technique in 1996. In this study, this technique was combined with the fuzzy approach. In this research, the triangular fuzzy numbers were used (see Figure 2). Table 4 shows the experts’ opinions. In the next paragraph, the Fuzzy ANP steps are shown. Table 5 and Table 6 show the super initial matrix and super normalized matrix.
The procedure for implementing the Fuzzy ANP method is as follows:
This method was employed to calculate the priority weights from fuzzy comparison matrices. Chang’s method [77] is relatively simpler than other kinds of the Fuzzy AHP method. The steps of Chang’s extent analysis method are provided below. Let X = {x1, x2, …, xn} be an object set and U = {u1, u2, …, um} be a goal set. According to the method of Chang’s extent analysis, each object is taken, and an extended analysis for each goal (gi) is performed [77]. Thus, m, extent analysis values for each object, can be obtained with the following signs:
M g i 1 ,   M g i 2 ,   ,   M g i m ,   i = 1 , 2 , , n ,
where M g i j ( j = 1 , 2 , , m ) are triangular fuzzy numbers.
Step 1: The value of fuzzy synthetic extent with respect to the i-th objective is defined as:
S i = j = 1 m M g i j [ i = 1 n j = 1 m M g i j ]
To obtain j = 1 m M g i j , the fuzzy addition operation of m extent analysis values for a particular matrix is performed as:
j = 1 m M g i j = ( j = 1 m l j , j = 1 m m j , j = 1 m u j )
To obtain [ i = 1 n j = 1 m M g i j ] 1 , the fuzzy addition operation of M g i j (j = 1, 2, …, m) values are processed as:
i = 1 n j = 1 m M g i j = ( i = 1 n l i , i = 1 n m i , i = 1 n u i )
and then the inverse of the vector in Eqution (7) is obtained as:
[ i = 1 n j = 1 m M g i j ] 1 = ( 1 i = 1 n u i , 1 i = 1 n m i , 1 i = 1 n l i )
Step 2: The degree of probability of M2 = (l2, m2, u2) ≥ M1 = (l1, m1, u1) is defined as:
V ( M 2 M 1 ) = sup y x [ min ( μ M 1 ( x ) , μ M 2 ( y ) ) ]
and can be equivalently expressed as follows:
V ( M 2 M 1 ) = h g t ( M 1 M 2 ) = μ M 2 ( d ) = { 1 if   m 2 m 1 0 if   l 1 u 2 l 1 u 2 ( m 2 u 2 ) ( m 1 l 1 ) otherwise
where d is the ordinate of the highest intersection point D. To compare M1 and M2, we need both the values of V (M) ≥ M2) and V (M2M1).
Step 3: For the degree probability of a convex fuzzy number to be greater than k convex fuzzy numbers, Mi (i = 1, 2, …, k) can be obtained as:
V   ( M     M 1 ,   M 2 ,   ,   M K )   = V   [ ( M     M 1 )   and   ( M     M 2 )   and     and   ( M     M K ) ]   =   min   V   ( M     M i ) , i = 1 , 2 , , k ,
Assume that d′ (Ai) = min V (SiSK) for k = 1 , 2 , , n , ki. Then, the weight vector is given by:
W′ = (d′(A1), d′(A2), …, d′(An))T
where Ai are n elements.
d ( A i ) = d ( A i ) i = 1 n d ( A i )
Step 4: The normalized weight vector elements are:
W = ( d ( A 1 ) , d ( A 2 ) , , d ( A n ) ) T
where W contains crisp numbers.

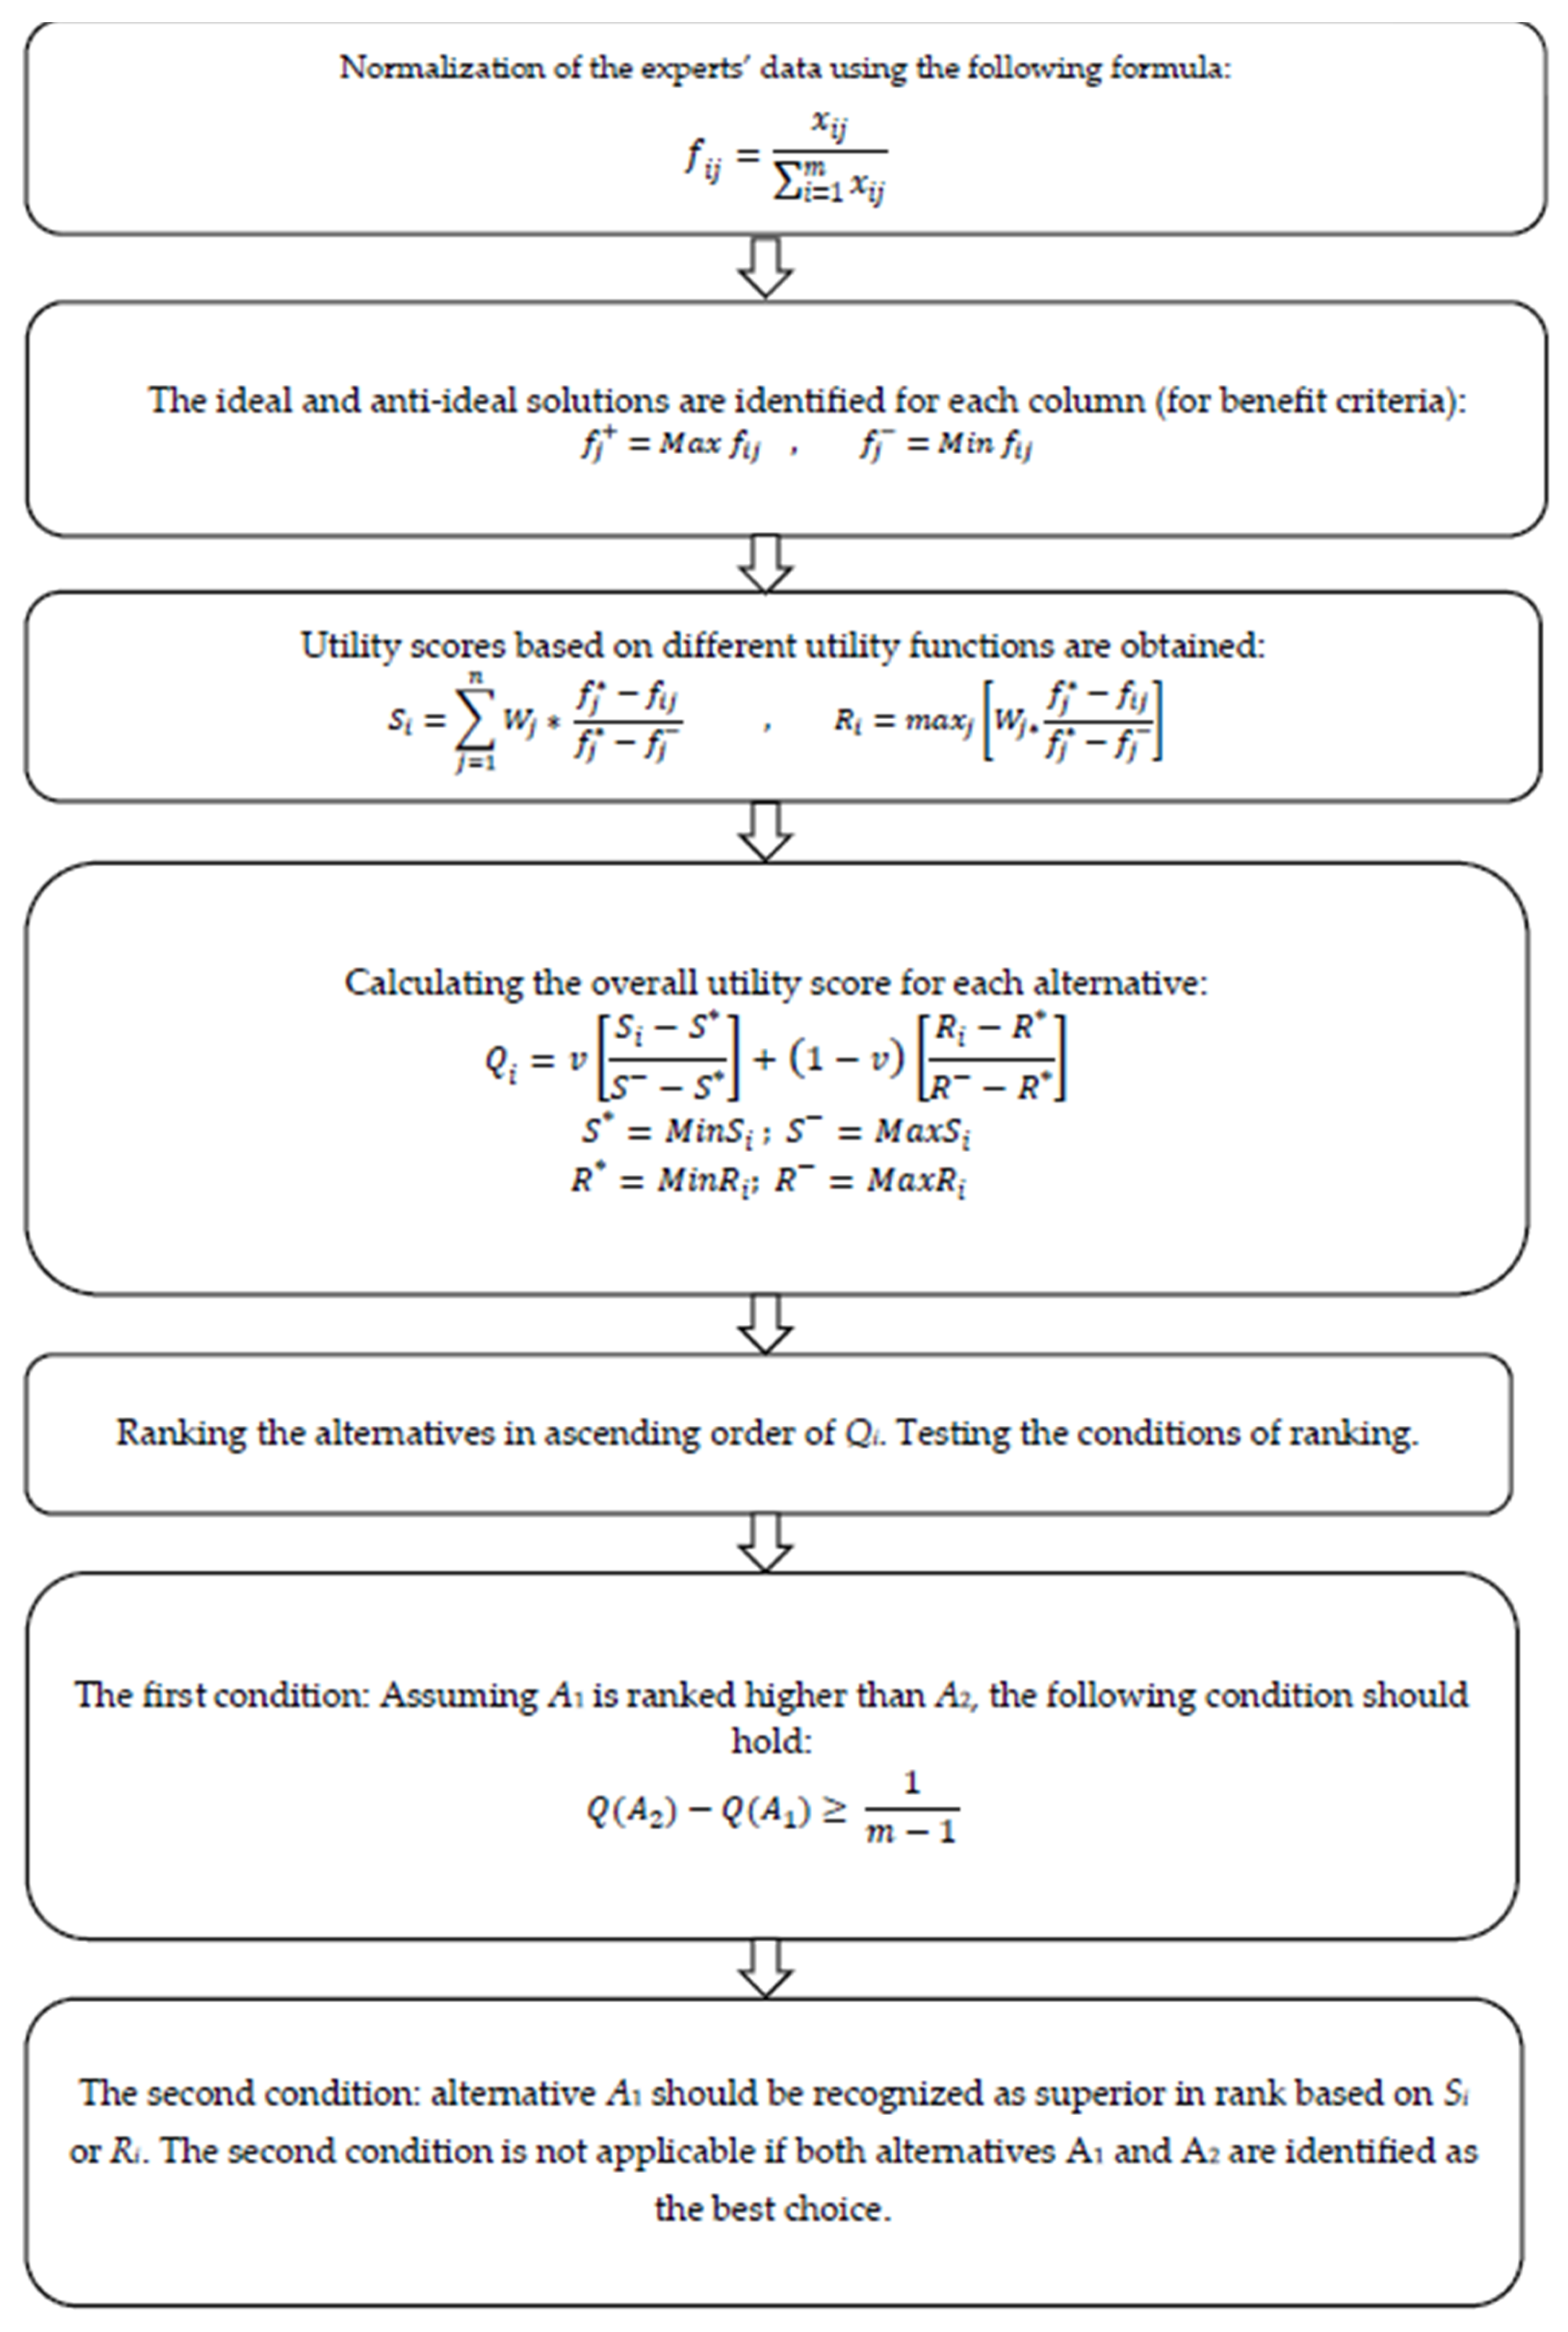
3.2. The VIKOR Method

In this method, at first, surveys are conducted on selected companies’ experts, and after examining the sub-factors in their company, they are informed about the desirability of sub-factors in their company. Figure 3 shows the steps involved.

4. Results

The analysis began with the weight setting. Table 4 shows the experts’ opinion about the importance of the selected factors. They prioritized the factors provided in the questionnaire on a scale from 0 to 10. Then, based on the Delphi method, we selected the factors that have got more than seven points on average. Thus, the 17 factors were included in the final list. In the next step, the factors need to be weighted using Fuzzy ANP (see Table 5 and Table 6).
After checking the consistency ratio (CR), the weights were transferred to the initial supermatrix (Table 5). However, to use the data, the supermatrix should be normalized. Table 6 shows the normalized supermatrix. The sub-factors’ weights are presented in Table 7. These weights show that sub-factors are important (to varying extent) in the decision process. These weights are then used for VIKOR-based decision-making.
Table 7 shows the ranking of sub-factors, which are calculated based on the experts’ opinions. Factors with a score of more than 7.0 were chosen. Overall, 17 factors were divided into five groups. For the first group, the workforce is the main factor, and new and existing employees’ enthusiasm toward learning and training, team working, multi-skilled, and flexible staff are the sub-factors. The second main factor is market and customer, and matching customer feedback on products, flexible business, customer satisfaction rate of the new product, and respond quickly to competitors are the sub-factors. Technology is the third main factor, including diversity of equipment, technology, and operational workstations, and level of the company’s information system excellence and integration of technology and information are its sub-factors. Experts chose management’s interest in full automation and management’s interest to deliver new models as the management’s main factors while promoting a culture of transformation and modernization are the sub-factors for management. Finally, for the last main factor production, flexible production capacity, relationship based on trust with suppliers, innovation in products, and regarding quality standards in the production of new products are selected.
The weights based on the Fuzzy ANP are presented in Table 5. Zero value indicates that there is no relationship between factors or sub-factors. This table is not normalized, and it is termed as the initial supermatrix. Table 6 presents the normalized supermatrix. To obtain the weight of the factors and sub-factors, this table should be solved to get the final weights. Therefore, the final weights are provided in Table 7.
Table 7 shows the obtained weights using the VIKOR method. The data illustrated in this table is employed as the raw data for ranking the companies based on green agility with the VIKOR method. The final factors’ weight is presented in Table 7. Afterward, the obtained results were applied to VIKOR in which six tables exist showing all of the steps explained with the VIKOR method.
Table 8 shows the experts’ opinions after the normalization process. Then, fj+ and fj for each column are shown in Table 9. The Si and Ri of each company are demonstrated in Table 10 and Table 11, respectively. In the VIKOR method, the amounts of S and R are of high importance, and their information is presented in Table 12. The Q amount is the final part of the VIKOR method, which shows the comparison between the companies as illustrated in Table 13.
Further, the TOPSIS [78], ARAS [79], EDAS [80], and MABAC [81] methods were applied in order to test the robustness of the results. Table 14 presents the results of the comparative analysis. As one can note, there are no differences in regards to the best performing company. However, the ranking of the other companies differs across the six approaches (Table 13 and Table 14).
Different Multiple Criteria Decision Making (MCDM) methods follow different principles of data aggregation and calculation of the final utility scores. The results of the ranking procedures based on different aggregation rules basically confirm the effectiveness of the approach proposed in this study. Thus, it can be applied for the multi-dimensional analysis of the performance of a dairy company.

5. Discussion

In the present era, flexibility in the business market is an important element of any organization in order to be well survived and preserved. If an organization fail to preserve itself with the outside environment, it will lose the competition with rivals and lose their place in the markets. Green agility in any organization is the most important issue and should be taken seriously. Many elements play an important role in each organization’s green agility, which we attempted to evaluate in this study. This paper investigated the factors affecting green agility in organizations and studied these factors in dairy companies, such as Kalleh, Doushe, Haraz, and Gela. We also reviewed the green agility of the four companies, compared them with each other, and ranked them based on their green agility. The model presented in this survey was formed by gathering data from several valid sources. The model was evaluated by the view of experts of the companies. After selecting a sub-factor, weighting was done using the Fuzzy ANP after the distribution of the pairwise comparison questionnaires among the experts.
Note that some previous studies, e.g., Papadopoulos [83], suggested that organizations have to adapt to business needs and leap from a traditional system to a green agile. They require improvements based on quality, control, customer perception of the final product, increased communication among team members, and better standards of employee satisfaction. Also, Tanner and Wheeling [84] reported that the effective factors for becoming an agile organization involve culture, customer involvement and commitment, stakeholders participation and sales, team structure and team logistics, project type and planning, and skill level and attitude of the team members.
The results of this study (Table 7) showed that the factors, multi-skilled and flexible employees, promoting the transformation culture and modernization, flexible production capacity, interest of new and existing employees in teaching and learning, product innovation, and relationship with suppliers based on trust and respect, are important to a movement towards green agility. Experts believe that when making a new product, considering the quality standards has the highest impact on the agility of organizations and companies. Multi-skilled and flexible employees are the most important assets of an organization. Employees who are more capable and multi-skilled have the ability to help the organization when needed [85].
An organization may require an employee to work in another part, and the multi-skilled employee will help the organization to meet its customers’ needs and compete with the rivals. Promoting the culture of change and modernity: culture transformation and modernization are important factors in an organization to be well adapted as quickly as possible with their outside environment. As organizations promote the culture of change and renewal, employees will know the meaning of premature change more easily and cooperate better in order to make necessary changes to their organization. Flexible production capacity: in the present era, customers’ needs are not completely consistent with the development of technology and up-to-date products. Customers are attracted to new products; thus, companies need to make their capacity flexible in order to meet the needs of previous clients, keep them, meet the needs of new customers, and to compete with their counterparts in the field of business without falling behind. The threat of falling behind and losing the business entirely to a competitor actually makes the company continue working hard [86].
The interest of existing and new employees in teaching and learning: motivation and satisfaction among employees of an organization will enhance the growth and excellence of creativity in organizations and can provide solutions to respond to competitors and the market. Discussion about employee training is one of the most important responsibilities of organizations to make their employees ready toward the threads and new opportunities in order to take the greatest advantage of their expertise and ability. Nowadays, products change and progress faster than we think. The longevity of the products has come down to such an extent that the organization has to think about what the next product will be at the beginning of launching a new product. The more a product helps the customers, the more it will be accepted by them.
Trust-based relationship with the suppliers: it is one of the most important factors in the green agility of an organization [87]. If an organization can establish a better relationship with its suppliers and rely on them in terms of preparing raw materials or making any change to the materials, it is able to respond to the market needs and be well adapted to changes that may occur in the market. The faster such adaptation occurs, the greener is the organization. Kalleh is one of the examples of such an organization. Concerning the quality standards to produce a new product: the quality is always the choice of the customer and is the sign of superiority of one company over the other. Paying attention to quality standards will enhance the quality of the products [88]. It will be easier for customers to choose the products, and with an improvement in quality, customers will choose the products more easily. Every organization needs to attempt to continuously improve the quality to have an advantage in competition with their peers.

6. Conclusions

The paper proposed a methodology for assessment of the green agility of the dairy companies. Taking the example of Iran, the results indicated that Kalleh Company was greener than the other companies because of product innovation and enthusiasm of employees to learn, which has made this company the best, as shown in Table 13. In addition to the competition in the domestic market, this company considers exporting its products outside the country borders. This shows the competency of the company in all areas of production, management, and staff. Each factor involves important sub-factors for making the selected dairy companies agile. The important sub-factors of agility are: agility in the workforce, multi-skilled and flexible employees, market dimensions and customers, the implementation of customer feedback on products in terms of the variety of machines in operation and workstation in technology dimension, agility management, promoting the culture of innovation and transformation, and trust-based relationship with the suppliers in production dimension.
This study has some limitations. First, the considered factors and expert assessments regarding their importance may vary across companies as experts might have ignored some factors. Second, expert ratings may be biased due to the goal of the study. Anyway, the results obtained are plausible given the trends prevailing in the market. Finally, data collection is highly cumbersome as the companies do not want to reveal their information due to competition. In this paper, a new method was proposed to measure the Iranian dairy company’s green agility. The factors were identified related to the company’s green agility. Some suggestions for further research in this field involve using Fuzzy MCDM to find the important factors in dairy companies’ supply chain based on green agility. The holistic paradigm and associated methodological tools [89,90,91,92] can decrease the environmental pressures and allow responding market demand quickly. Thus, this system can decrease environmental damage and increase performance with a high level of corporate social responsibility.

Author Contributions

Investigation, A.B.; Methodology, A.M.; Writing–original draft, S.R.A. and N.Z.; Writing–review and editing, T.B., G.C.F., and D.S.

Funding

This research is funded by the European Social Fund according to the activity “Improvement of researchers’ qualification by implementing world-class R&D projects” of Measure No. 09.3.3-LMT-K-712.

Acknowledgments

The authors would like to thank the Research Management Center (RMC) at Universiti Teknologi Malaysia (UTM) and Ministry of Higher Education, Malaysia for supporting and funding this research under the Fundamental Research Grant Scheme (FRGS) (Vote no. FRGS/1/2018/SS03/UTM/02/3).

Conflicts of Interest

The authors declare no conflict of interest.

References

  1. Zanetti, V.; Cavalieri, S.; Pezzotta, G. Additive manufacturing and pss: A solution life-cycle perspective. IFAC-PapersOnLine 2016, 49, 1573–1578. [Google Scholar] [CrossRef]
  2. Golpîra, H.; Najafi, E.; Zandieh, M.; Sadi-Nezhad, S. Robust bi-level optimization for green opportunistic supply chain network design problem against uncertainty and environmental risk. Comput. Ind. Eng. 2017, 107, 301–312. [Google Scholar] [CrossRef]
  3. Lee, J.W.; Kim, Y.M.; Kim, Y.E. Antecedents of adopting corporate environmental responsibility and green practices. J. Bus. Ethics 2018, 148, 397–409. [Google Scholar] [CrossRef]
  4. Rosário Cabrita, M.D.; Duarte, S.; Carvalho, H.; Cruz-Machado, V. Integration of lean, agile, resilient and green paradigms in a business model perspective: Theoretical foundations. IFAC-PapersOnLine 2016, 49, 1306–1311. [Google Scholar]
  5. Singh, P.; Pandey, K.K. Green marketing: Policies and practices for sustainable development. Integral Rev. 2012, 5, 22–30. [Google Scholar]
  6. Simão, L.; Lisboa, A. Green marketing and green brand—The toyota case. Procedia Manuf. 2017, 12, 183–194. [Google Scholar] [CrossRef]
  7. Han, H.; Lee, M.J.; Kim, W. Antecedents of green loyalty in the cruise industry: Sustainable development and environmental management. Bus. Strategy Environ. 2018, 27, 323–335. [Google Scholar] [CrossRef]
  8. Jovanović, M.; Mas, A.; Mesquida, A.-L.; Lalić, B. Transition of organizational roles in agile transformation process: A grounded theory approach. J. Syst. Softw. 2017, 133, 174–194. [Google Scholar] [CrossRef]
  9. Da Silva, G.L.; Rondina, G.; Figueiredo, P.C.; Prates, G.; Savi, A.F. How quality influences in agility, flexibility, responsiveness and resilience in supply chain management. Indep. J. Manag. Prod. 2018, 9, 340–353. [Google Scholar] [CrossRef]
  10. Ye, Y.; Lau, K.H. Designing a demand chain management framework under dynamic uncertainty: An exploratory study of the chinese fashion apparel industry. Asia Pac. J. Mark. Logist. 2018, 30, 198–234. [Google Scholar] [CrossRef]
  11. Rodrigues, N.; Oliveira, E.; Leitão, P. Decentralized and on-the-fly agent-based service reconfiguration in manufacturing systems. Comput. Ind. 2018, 101, 81–90. [Google Scholar] [CrossRef]
  12. Yusuf, Y.Y.; Adeleye, E.O.; Papadopoulos, T. Agile manufacturing practices: The role of big data and business analytics with multiple case studies au-gunasekaran, angappa. Int. J. Prod. Res. 2018, 56, 385–397. [Google Scholar]
  13. Sanders, J. Process management, innovation, and efficiency performance: The moderating effect of competitive intensity. Bus. Process Manag. J. 2014, 20, 35–358. [Google Scholar]
  14. Buiten, G.; Snijkers, G.; Saraiva, P.; Erikson, J.; Erikson, A.-G.; Born, A. Business data collection: Toward electronic data interchange. Experiences in portugal, canada, sweden, and the netherlands with edi. J. Off. Stat. 2018, 34, 419–443. [Google Scholar] [CrossRef]
  15. Ip, W.H.; Yung, K.L.; Wang, D. A branch and bound algorithm for sub-contractor selection in agile manufacturing environment. Int. J. Prod. Econ. 2004, 87, 195–205. [Google Scholar] [CrossRef]
  16. Rauch, E.; Spena, P.R.; Matt, D.T. Axiomatic design guidelines for the design of flexible and agile manufacturing and assembly systems for smes. Int. J. Interact. Des. Manuf. (Ijidem) 2018, 1–22. [Google Scholar] [CrossRef]
  17. Cooper, R.G.; Sommer, A.F. Agile–stage-gate for manufacturers: Changing the way new products are developed integrating agile project management methods into a stage-gate system offers both opportunities and challenges. Res. Technol. Manag. 2018, 61, 17–26. [Google Scholar] [CrossRef]
  18. Jayatilleke, S.; Lai, R. A systematic review of requirements change management. Inf. Softw. Technol. 2018, 93, 163–185. [Google Scholar] [CrossRef]
  19. Bouwman, H.; Heikkilä, J.; Heikkilä, M.; Leopold, C.; Haaker, T. Achieving agility using business model stress testing. Electron. Mark. 2018, 28, 149–162. [Google Scholar] [CrossRef]
  20. Agostinho, O.L. Proposal of organization framework model, using business processes and hierarchical patterns to provide agility and flexibility in competitiveness environments. Procedia Eng. 2015, 131, 401–409. [Google Scholar] [CrossRef]
  21. Rahnama, H.; Rajabpour, S. Factors for consumer choice of dairy products in iran. Appetite 2017, 111, 46–55. [Google Scholar] [CrossRef]
  22. Singh, A.; Philip, D.; Ramkumar, J.; Das, M. A simulation based approach to realize green factory from unit green manufacturing processes. J. Clean. Prod. 2018, 182, 67–81. [Google Scholar] [CrossRef]
  23. Li, T.; Liang, L.; Han, D. Research on the efficiency of green technology innovation in china‘s provincial high-end manufacturing industry based on the raga-pp-sfa model. Math. Probl. Eng. 2018, 2018, 13. [Google Scholar] [CrossRef]
  24. Mittal, V.K.; Sindhwani, R.; Kalsariya, V.; Salroo, F.; Sangwan, K.S.; Singh, P.L. Adoption of integrated lean-green-agile strategies for modern manufacturing systems. Procedia Cirp 2017, 61, 463–468. [Google Scholar] [CrossRef]
  25. Aravindraj, S.; Vinodh, S. Forty criteria based agility assessment using scoring approach in an indian relays manufacturing organization. J. Eng. Des. Technol. 2014, 12, 507–518. [Google Scholar] [CrossRef]
  26. Heinonen, K.; Strandvik, T. Reflections on customers’ primary role in markets. Eur. Manag. J. 2018, 36, 1–11. [Google Scholar] [CrossRef]
  27. Peng, Z.; Sun, Y.; Guo, X. Antecedents of employees’ extended use of enterprise systems: An integrative view of person, environment, and technology. Int. J. Inf. Manag. 2018, 39, 104–120. [Google Scholar] [CrossRef]
  28. Sun, J.; Marinova, D.; Zhao, D. Evaluation of the green technology innovation efficiency of china’s manufacturing industries: Dea window analysis with ideal window width au-lin, shoufu. Technol. Anal. Strateg. Manag. 2018, 30, 1166–1181. [Google Scholar]
  29. Matikiti, R.; Mpinganjira, M.; Roberts-Lombard, M. Application of the technology acceptance model and the technology–organisation–environment model to examine social media marketing use in the south african tourism industry. S. Afr. J. Inf. Manag. 2018, 20, 1–12. [Google Scholar] [CrossRef]
  30. Mergel, I.; Gong, Y.; Bertot, J. Agile Government: Systematic Literature Review and Future Research; Elsevier: Amsterdam, The Netherlands, 2018. [Google Scholar]
  31. Hausman, A.; Johnston, W.J. The role of innovation in driving the economy: Lessons from the global financial crisis. J. Bus. Res. 2014, 67, 2720–2726. [Google Scholar] [CrossRef]
  32. Dai, J.; Chan, H.K.; Yee, R.W.Y. Examining moderating effect of organizational culture on the relationship between market pressure and corporate environmental strategy. Ind. Mark. Manag. 2018, 74, 227–236. [Google Scholar] [CrossRef]
  33. Zouaghi, F.; Sánchez, M.; Martínez, M.G. Did the global financial crisis impact firms’ innovation performance? The role of internal and external knowledge capabilities in high and low tech industries. Technol. Forecast. Soc. Chang. 2018, 132, 92–104. [Google Scholar] [CrossRef]
  34. Aqlan, F.; Lam, S.S.; Ramakrishnan, S. An integrated simulation–optimization study for consolidating production lines in a configure-to-order production environment. Int. J. Prod. Econ. 2014, 148, 51–61. [Google Scholar] [CrossRef]
  35. Hasan, M.A.; Sarkis, J.; Shankar, R. Agility and production flow layouts: An analytical decision analysis. Comput. Ind. Eng. 2012, 62, 898–907. [Google Scholar] [CrossRef]
  36. Thilak, V.; Devadasan, S.; Sivaram, N. A literature review on the progression of agile manufacturing paradigm and its scope of application in pump industry. Sci. World J. 2015, 2015. [Google Scholar] [CrossRef]
  37. Bernat, S.; Karabag, S.F. Strategic alignment of technology: Organising for technology upgrading in emerging economy firms. Technol. Forecast. Soc. Chang. 2018. [Google Scholar] [CrossRef]
  38. Famiyeh, S.; Adaku, E.; Amoako-Gyampah, K.; Asante-Darko, D.; Amoatey, C.T. Environmental management practices, operational competitiveness and environmental performance: Empirical evidence from a developing country. J. Manuf. Technol. Manag. 2018, 29, 588–607. [Google Scholar] [CrossRef]
  39. Rathi, A. Development of environmental management program in environmental impact assessment reports and evaluation of its robustness: An indian case study. Impact Assess. Proj. Apprais. 2018, 1–16. [Google Scholar] [CrossRef]
  40. Ibrahim, I.B.; Jaafar, H.S.B. Factors of environment management practices adoptions. Procedia Soc. Behav. Sci. 2016, 224, 353–359. [Google Scholar] [CrossRef]
  41. Fernández, E.; Iglesias-Antelo, S.; López-López, V.; Rodríguez-Rey, M.; Fernandez-Jardon, C.M. Firm and industry effects on small, medium-sized and large firms’ performance. BRQ Bus. Res. Q. 2018. [Google Scholar] [CrossRef]
  42. Ding, R.; Li, J.; Wu, Z. Government affiliation, real earnings management, and firm performance: The case of privately held firms. J. Bus. Res. 2018, 83, 138–150. [Google Scholar] [CrossRef]
  43. Qin, R.; Nembhard, D.A. Workforce agility in operations management. Surv. Oper. Res. Manag. Sci. 2015, 20, 55–69. [Google Scholar] [CrossRef]
  44. Pitafi, A.H.; Liu, H.; Cai, Z. Investigating the relationship between workplace conflict and employee agility: The role of enterprise social media. Telemat. Inform. 2018, 35, 2157–2172. [Google Scholar] [CrossRef]
  45. Muduli, A. Workforce agility: Examining the role of organizational practices and psychological empowerment. Glob. Bus. Organ. Excell. 2017, 36, 46–56. [Google Scholar] [CrossRef]
  46. Elgammal, A.; Papazoglou, M.; Krämer, B.; Constantinescu, C. Design for customization: A new paradigm for product-service system development. Procedia Cirp 2017, 64, 345–350. [Google Scholar] [CrossRef]
  47. Ravichandran, T. Exploring the relationships between it competence, innovation capacity and organizational agility. J. Strateg. Inf. Syst. 2018, 27, 22–42. [Google Scholar] [CrossRef]
  48. Mourtzis, D.; Vlachou, E.; Zogopoulos, V.; Gupta, R.K.; Belkadi, F.; Debbache, A.; Bernard, A. Customer feedback gathering and management tools for product-service system design. Procedia Cirp 2018, 67, 577–582. [Google Scholar] [CrossRef]
  49. Pinna, C.; Galati, F.; Rossi, M.; Saidy, C.; Harik, R.; Terzi, S. Effect of product lifecycle management on new product development performances: Evidence from the food industry. Comput. Ind. 2018, 100, 184–195. [Google Scholar] [CrossRef]
  50. Morgan, T.; Obal, M.; Anokhin, S. Customer participation and new product performance: Towards the understanding of the mechanisms and key contingencies. Res. Policy 2018, 47, 498–510. [Google Scholar] [CrossRef]
  51. Lo, S.M.; Zhang, S.; Wang, Z.; Zhao, X. The impact of relationship quality and supplier development on green supply chain integration: A mediation and moderation analysis. J. Clean. Prod. 2018, 202, 524–535. [Google Scholar] [CrossRef]
  52. Dikert, K.; Paasivaara, M.; Lassenius, C. Challenges and success factors for large-scale agile transformations: A systematic literature review. J. Syst. Softw. 2016, 119, 87–108. [Google Scholar] [CrossRef]
  53. Meneses, Y.E.; Stratton, J.; Flores, R.A. Water reconditioning and reuse in the food processing industry: Current situation and challenges. Trends Food Sci. Technol. 2017, 61, 72–79. [Google Scholar] [CrossRef]
  54. Zraková, D.; Kubina, M.; Koman, G. Influence of information-communication system to reputation management of a company. Procedia Eng. 2017, 192, 1000–1005. [Google Scholar] [CrossRef]
  55. Carr, J.; Decreton, L.; Qin, W.; Rojas, B.; Rossochacki, T.; Yang, Y.W. Social media in product development. Food Qual. Prefer. 2015, 40, 354–364. [Google Scholar] [CrossRef]
  56. Chan, A.T.L.; Ngai, E.W.T.; Moon, K.K.L. The effects of strategic and manufacturing flexibilities and supply chain agility on firm performance in the fashion industry. Eur. J. Oper. Res. 2017, 259, 486–499. [Google Scholar] [CrossRef]
  57. Queiroz, M.; Tallon, P.P.; Sharma, R.; Coltman, T. The role of IT application orchestration capability in improving agility and performance. J. Strateg. Inf. Syst. 2018, 27, 4–21. [Google Scholar] [CrossRef] [Green Version]
  58. Rungi, A.; Del Prete, D. The smile curve at the firm level: Where value is added along supply chains. Econ. Lett. 2018, 164, 38–42. [Google Scholar] [CrossRef]
  59. Rasnacis, A.; Berzisa, S. Method for adaptation and implementation of agile project management methodology. Procedia Comput. Sci. 2017, 104, 43–50. [Google Scholar] [CrossRef]
  60. França, C.L.; Broman, G.; Robèrt, K.-H.; Basile, G.; Trygg, L. An approach to business model innovation and design for strategic sustainable development. J. Clean. Prod. 2017, 140, 155–166. [Google Scholar] [CrossRef]
  61. Liu, Y.; Tyagi, R.K. Outsourcing to convert fixed costs into variable costs: A competitive analysis. Int. J. Res. Mark. 2017, 34, 252–264. [Google Scholar] [CrossRef]
  62. Paschek, D.; Rennung, F.; Trusculescu, A.; Draghici, A. Corporate development with agile business process modeling as a key success factor. Procedia Comput. Sci. 2016, 100, 1168–1175. [Google Scholar] [CrossRef]
  63. Bondar, S.; Hsu, J.C.; Pfouga, A.; Stjepandić, J. Agile digitale transformation of enterprise architecture models in engineering collaboration. Procedia Manuf. 2017, 11, 1343–1350. [Google Scholar] [CrossRef]
  64. Klein, T.P.; Reinhart, G. Towards agile engineering of mechatronic systems in machinery and plant construction. Procedia Cirp 2016, 52, 68–73. [Google Scholar] [CrossRef]
  65. He, H.; Yu, Z. Product quality, incomplete contract and the product cycle. Int. Rev. Econ. Financ. 2018, 53, 160–167. [Google Scholar] [CrossRef]
  66. Garwood, D.A.; Poole, A.H. Project management as information management in interdisciplinary research:“Lots of different pieces working together”. Int. J. Inf. Manag. 2018, 41, 14–22. [Google Scholar] [CrossRef]
  67. Ball, O.; Robinson, S.; Bure, K.; Brindley, D.A.; Mccall, D. Bioprocessing automation in cell therapy manufacturing: Outcomes of special interest group automation workshop. Cytotherapy 2018, 20, 592–599. [Google Scholar] [CrossRef]
  68. Karpinsky, N.D.; Chancey, E.T.; Palmer, D.B.; Yamani, Y. Automation trust and attention allocation in multitasking workspace. Appl. Ergon. 2018, 70, 194–201. [Google Scholar] [CrossRef]
  69. Mossalam, A.; Arafa, M. Governance model for integrating organizational project management (opm) with corporate practices. HBRC J. 2017, 13, 302–314. [Google Scholar] [CrossRef]
  70. Khoshlahn, M.; Ardabili, F.S. The role of organizational agility and transformational leadership in service recovery prediction. Procedia-Soc. Behav. Sci. 2016, 230, 142–149. [Google Scholar] [CrossRef]
  71. Hilt, M.J.; Wagner, D.; Osterlehner, V.; Kampker, A. Agile predevelopment of production technologies for electric energy storage systems—A case study in the automotive industry. Procedia Cirp 2016, 50, 88–93. [Google Scholar] [CrossRef]
  72. Zan, J.; Hasenbein, J.J.; Morton, D.P.; Mehrotra, V. Staffing call centers under arrival-rate uncertainty with bayesian updates. Oper. Res. Lett. 2018, 46, 379–384. [Google Scholar] [CrossRef]
  73. Valipour Khatir, M.; Mohammadpour Omran, M.; Akbarzadeh, Z. Evaluating indicators of organizational agility by fuzzy multi criteria decision making: (iran power development organization). Q. Int. Innov. Enterp. 2015, 3, 1–18. [Google Scholar]
  74. Saaty, T.L. The Anp for Decision Making with Dependence and Feedback; RWS Publications: Pittsburgh, PA, USA, 1996. [Google Scholar]
  75. Saaty, T.L. Making and validating complex decisions with the ahp/anp. J. Syst. Sci. Syst. Eng. 2005, 14, 1–36. [Google Scholar] [CrossRef]
  76. Shemshadi, A.; Shirazi, H.; Toreihi, M.; Tarokh, M.J. A fuzzy vikor method for supplier selection based on entropy measure for objective weighting. Expert Syst. Appl. 2011, 38, 12160–12167. [Google Scholar] [CrossRef]
  77. Cheng, E.W.L.; Li, H.; Yu, L. The analytic network process (anp) approach to location selection: A shopping mall illustration. Constr. Innov. 2005, 5, 83–97. [Google Scholar] [CrossRef]
  78. García-Cascales, M.S.; Lamata, M.T. On rank reversal and topsis method. Math. Comput. Model. 2012, 56, 123–132. [Google Scholar] [CrossRef]
  79. Reza, S.; Majid, A. Ranking financial institutions based on of trust in online banking using aras and anp method. Int. Res. J. Appl. Basic Sci. 2013, 6, 415–423. [Google Scholar]
  80. Keshavarz Ghorabaee, M.; Amiri, M.; Zavadskas, E.K.; Turskis, Z.; Antucheviciene, J. A new multi-criteria model based on interval type-2 fuzzy sets and edas method for supplier evaluation and order allocation with environmental considerations. Comput. Ind. Eng. 2017, 112, 156–174. [Google Scholar] [CrossRef]
  81. Sun, R.; Hu, J.; Zhou, J.; Chen, X. A hesitant fuzzy linguistic projection-based mabac method for patients’ prioritization. Int. J. Fuzzy Syst. 2018, 20, 2144–2160. [Google Scholar] [CrossRef]
  82. Opricovic, S.; Tzeng, G.-H. Compromise solution by mcdm methods: A comparative analysis of vikor and topsis. Eur. J. Oper. Res. 2004, 156, 445–455. [Google Scholar] [CrossRef]
  83. Papadopoulos, G. Moving from traditional to agile software development methodologies also on large, distributed projects. Procedia-Soc. Behav. Sci. 2015, 175, 455–463. [Google Scholar] [CrossRef]
  84. Tanner, M.; von Willingh, U. Factors Leading to the Success and Failure of Agile Projects Implemented in Traditionally Waterfall Environments. Available online: http://www.toknowpress.net/ISBN/978-961-6914-09-3/papers/ML14-618.pdf (accessed on 14 February 2019).
  85. Ghobakhloo, M.; Azar, A. Business excellence via advanced manufacturing technology and lean-agile manufacturing. J. Manuf. Technol. Manag. 2018, 29, 2–24. [Google Scholar] [CrossRef]
  86. Rehman, A.U.; Alkhatani, M.; Umer, U. Multi Criteria Approach to Measure Leanness of a Manufacturing Organization. IEEE Access 2018, 6, 20987–20994. [Google Scholar] [CrossRef]
  87. Tilburgs, B.; Vernooij-Dassen, M.; Koopmans, R.; Weidema, M.; Perry, M.; Engels, Y. The importance of trust-based relations and a holistic approach in advance care planning with people with dementia in primary care: a qualitative study. BMC Geriatr. 2018, 18, 184. [Google Scholar] [CrossRef]
  88. Kusi-Sarpong, S.; Leonilde Varela, M.; Putnik, G.; Ávila, P.; Agyemang, J. Supplier evaluation and selection: A fuzzy novel multicriteria group decision-making approach. Int. J. Qual. Res. 2018, 12, 459–486. [Google Scholar]
  89. Song, M.L.; Peng, J.; Wang, J.L.; Dong, L. Better resource management: An improved resource and environmental efficiency evaluation approach that considers undesirable outputs. Resour. Conserv. Recycl. 2018, 128, 197–205. [Google Scholar] [CrossRef]
  90. Chen, J.D.; Cheng, S.L.; Nikic, V.; Song, M.L. Quo Vadis? Major Players in Global Coal Consumption and Emissions Reduction. Transform. Bus. Econ. 2018, 17, 112–132. [Google Scholar]
  91. Fang, S.T.; Ji, X.; Ji, X.H.; Wu, J. Sustainable urbanization performance evaluation and benchmarking: An efficiency perspective. Manag. Environ. Qual. 2018, 29, 240–254. [Google Scholar] [CrossRef]
  92. Wang, W.; Lu, N.; Zhang, C. Low-carbon technology innovation responding to climate change from the perspective of spatial spillover effects. Chin. J. Popul. Resour. Environ. 2018, 16, 120–130. [Google Scholar] [CrossRef]
Figure 1. Research framework.
Symmetry 11 00250 g001
Figure 2. Fuzzy triangular number.
Symmetry 11 00250 g002
Figure 3. The procedure of VIKOR method.
Symmetry 11 00250 g003
Table 1. A review of research on the green agile factors.
FactorsName of Sub-FactorsReference
Market and customerMatching customer feedback with productsElgammal et al. [46]
Flexible businessRavichandran [47]
Customer satisfaction rate of new productMourtzis et al. [48]
Fast production and introducing the new product on timePinna et al., Morgan et al., Lo et al. [49,50,51]
Respond quickly to competitorsDikert et al. [52]
TechnologyDiversity of equipment, technology, and operational workstationsMeneses et al. [53]
Level of company’s information excellenceZraková et al. [54]
Integration of technology and informationZraková et al. [54]
Network and information utilization rate for employeesRavichandran [47]
Applying the new communication mediaCarr et al. [55]
ProductionModular designElgammal et al. [46]
Flexible production capacityRavichandran, Chan et al., Queiroz et al. [47,56,57]
Relationship based on trust with suppliersElgammal et al., Ravichandran [46,47]
Decreasing non-added value costsRungi and Del Prete [58]
Focusing on the costs of the system and identifying the activities that can add valueRasnacis and Berzisa [59]
To invest in the latest techniques, models, and design methodFrança et al. [60]
Fixed manufacturing costs based on customer product pricingLiu et al. [61]
Short production development cyclePaschek et al., Bondar et al. [62,63]
Material transfer speedElgammal et al. [46]
Creativity in productsRavichandran [47]
Product quality throughout the product longevityElgammal et al., Rasnacis and Berzisa [46,59]
Resource optimizationElgammal et al. [46]
Cope with the changeKlein and Reinhart [64]
Regarding quality standards in the production of new productsHe and Yu [65]
ManagementHierarchy organizational chart bedsPitafi et al. [43]
Delegating managementGarwood and Poole [66]
Management’s interest in full automationKarpinsky et al., Mossalam and Arafa [67,68]
Management’s interest in delivering new modelsMossalam and Arafa [69]
Promoting a culture of transformation and modernizationKhoshlahn and Ardabili [70]
WorkforceNew and existing employees’ enthusiasm toward learning and trainingRathi et al. [38]
TeamworkRasnacis and Berzisa, Hilt et al. [59,71]
Institutionalizing staff design proposalsZan et al. [72]
Multi-skilled and flexible staffElgammal et al. [46]
Collaboration interfaceValipour Khatir et al. [73]
CreativityAqlan et al. [33]
Table 2. Linguistic variables for the Fuzzy ANP and the corresponding triangular fuzzy numbers.
Linguistic VariablesFuzzy NumberInverse Fuzzy Number
Same preferences(1,1,1)(1,1,1)
Intermediary(1,2,3)(1/3,1/2,1)
A little preferred(2,3,4)(1/4,1/3,1/2)
Intermediary(3,4,5)(1/5,1/4,1/3)
Equally Preferred(4,5,6)(1/6,1/5,1/4)
Intermediary(5,6,7)(1/7,1/6,1/5)
Preferred a lot(6,7,8)(1/8,1/7,1/6)
Intermediary(7,8,9)(1/9,1/8,1/7)
Completely Preferred(9,9,9)(1/9,1/9,1/9)
Table 3. Triangular fuzzy numbers for evaluation of the alternatives.
Linguistic VariableFuzzy Equivalent
Very weak(0,0,1)
Weak(0,1,3)
Weak to moderate(1,3,5)
Moderate(3,5,7)
Almost good(5,7,9)
Good(7,9,10)
Very good(9,10,10)
Table 4. Experts’ opinion on the importance of factors.
CodeFactorSub-FactorAverage
A1WorkforceNew and existing employees’ enthusiasm toward learning and training7.058
A2Teamwork7.025
A3Multi-skilled and flexible Staff7.05
B1Market and customerMatching customer feedback on products7.066
B2Flexible business7.116
B3Customer satisfaction rate of new product7.258
B4Respond quickly to competitors7
C1TechnologyDiversity of equipment, technology, and operational workstations7.15
C2Level of company’s information system excellence7.025
C3Integration of technology and information7.025
D1ManagementManagement’s interest in full automation7.025
D2Management’s interest to deliver new models7.225
D3Promoting a culture of transformation and modernization7.041
E1ProductionFlexible production capacity7.433
E2Relationship based on trust with suppliers7.308
E3Innovation in products7.55
E4Quality standards in the production of new products7.041
Table 5. Initial supermatrix.
-GoalWorkforceMarket and CustomerTechnologyManagementProductionA1A2A3B1B2B3B4C1C2C3D1D2D3E1E2E3E4
Goal00000000000000000000000
Workforce0.4700.580.230.140.0500000000000000000
Market and customer0.150.4900.290.170.0500000000000000000
Technology0.050.590.2300.130.0500000000000000000
Management0.250.560.260.1400.0500000000000000000
Production0.080.550.250.140.06000000000000000000
A100.25000000.90.10.070.140.210.580.130.730.140.120.270.610.140.150.330.39
A200.100000.800.20.560.170.190.070.090.420.480.660.260.080.090.570.160.18
A300.6500000.80.200.550.090.080.270.090.660.250.110.440.440.220.590.090.09
B1000.060000.080.270.6500.470.080.440.270.110.620.60.20.20.060.540.110.29
B2000.630000.080.270.650.0700.670.260.440.110.440.710.140.140.260.590.060.09
B3000.250000000.210.7100.080.560.130.310.540.350.110.260.580.050.11
B4000.070000.080.270.650.720.090.1900.590.30.120.460.320.220.110.510.050.32
C10000.65000.080.270.650.370.160.160.2300.130.880.230.640.140.050.590.170.2
C20000.08000.650.080.2700000.200.80.090.350.560.340.30.120.24
C30000.27000000.610.220.120.060.890.1100.670.090.230.10.120.310.48
D100000.2700.670.240.080.370.240.160.230.080.250.6700.830.170.311.140.10.09
D200000.6600.210.710.080.030.30.330.340.640.080.280.8800.130.230.610.050.12
D300000.0700.240.090.670.510.260.170.070.570.320.110.880.1300.60.220.050.12
E1000000.190.10.250.650.040.60.260.10.620.10.280.710.220.0800.240.120.64
E2000000.520.060.710.240.110.240.050.610.590.080.330.720.210.070.6100.10.29
E3000000.080.120.270.610.260.130.040.560.240.10.660.30.090.610.110.2500.65
E4000000.210.710.240.060.450.270.070.220.170.750.080.660.070.270.090.250.660
SUM12.21.320.790.50.194.524.224.264.934.172.774.146.174.386.458.324.634.053.577.262.534.27
Table 6. Normalized supermatrix.
-GoalWorkforceMarket and CustomerTechnologyManagementProductionA1A2A3B1B2B3B4C1C2C3D1D2D3E1E2E3E4
Goal00000000000000000000000
Workforce0.4700.250.130.090.0400000000000000000
Market and customer0.150.1500.160.110.0400000000000000000
Technology0.050.190.100.090.0400000000000000000
Management0.250.180.110.0800.0400000000000000000
Production0.080.170.110.080.04000000000000000000
A100.08000000.190.020.010.030.080.140.020.170.020.010.060.150.040.020.130.09
A200.0300000.1700.040.110.040.070.020.020.10.080.080.060.020.030.080.060.04
A300.200000.170.0400.110.020.030.070.010.150.040.010.10.110.060.080.040.02
B1000.020000.020.060.1200.120.030.110.040.030.10.070.040.050.020.080.040.07
B2000.270000.020.060.120.0200.240.060.070.030.070.090.030.040.070.080.030.02
B3000.110000000.040.1700.020.090.030.050.070.080.030.070.080.020.03
B4000.030000.020.060.120.150.020.0700.10.070.020.060.070.050.030.070.020.08
C10000.36000.020.060.120.080.040.060.0600.030.140.030.140.030.010.080.070.05
C20000.05000.140.020.0500000.0300.120.010.080.140.090.040.050.06
C30000.15000000.120.050.040.010.140.0300.080.020.060.030.020.120.11
D100000.1800.140.050.020.080.060.060.060.010.060.100.180.040.090.160.040.02
D200000.4400.050.150.020.010.070.120.080.10.020.040.1100.030.060.080.020.03
D300000.0500.050.020.120.10.060.060.020.090.070.020.110.0300.170.030.020.03
E1000000.160.020.050.120.010.150.090.020.10.020.040.090.050.0200.030.050.15
E2000000.440.010.150.040.020.060.020.150.10.020.050.090.050.020.1700.040.07
E3000000.070.030.060.110.050.030.020.140.040.020.10.040.020.150.030.0300.15
E4000000.180.150.050.010.090.070.020.050.030.170.010.080.020.070.030.040.260
SUM11111111111111111111111
Table 7. The weights of sub-factors.
FactorsCodeSub-FactorsWeight
Workforce A1Multi-skilled and flexible Staff0.068
WorkforceA2Teamwork0.0593
WorkforceA3New and existing employees’ enthusiasm toward learning and training0.0627
Market and customerB1Flexible Business0.0578
Market and customerB2Matching customer feedback on products0.0581
Market and customerB3Customer satisfaction rate of new product0.0453
Market and customerB4Respond quickly to competitors0.0579
TechnologyC1Level of company’s information excellence0.0572
TechnologyC2Diversity of equipment, technology, and operational workstations0.0497
TechnologyC3Integration of technology and information0.05
ManagementD1Promoting a culture of transformation and modernization0.0676
ManagementD2Management’s interest to deliver new models0.0575
ManagementD3Management’s interest in full automation0.0591
ProductionE1Quality standards in the production of new products0.0601
ProductionE2Innovation in products0.0619
ProductionE3Relationship based on trust with suppliers0.0606
ProductionE4Flexible production capacity0.0673
Table 8. Normalized expert assessments.
VariablesKallehGellaHarazSalehTotal
Multi-skilled and flexible Staff0.3290.1110.2310.3291
Teamwork0.3140.1510.220.3141
New and existing employees’ enthusiasm toward learning and training0.2890.1540.2030.3531
Flexible business0.3030.1850.2780.2331
Matching customer feedback on products0.2690.2510.2030.2771
Customer satisfaction rate of new product0.2660.1730.280.281
Respond quickly to competitors0.3270.1920.2310.251
Level of company’s information excellence0.3030.2840.1170.2971
Diversity of equipment, technology, and operational workstations0.2620.2440.2140.281
Integration of technology and information0.2970.2510.2050.2471
Promoting a culture of transformation and modernization0.2770.1540.2580.3111
Management’s interest to deliver new models0.2630.160.2770.31
Management’s interest in full automation0.2860.1570.2720.2861
Quality standards in the production of new products0.2670.270.2410.2231
Innovation in products0.3180.1950.2440.2441
Relationship based on trust with suppliers0.280.2380.1870.2951
Flexible production capacity0.2910.2320.2010.2771
Table 9. Fj+ and Fj for each column.
CriterionFj+Fj
Multi-skilled and flexible staff0.3290.111
Teamwork0.3140.151
New and existing employees’ enthusiasm toward learning and training0.3530.154
Flexible business0.3030.185
Matching customer feedback on products0.2770.203
Customer satisfaction rate of new product0.280.173
Respond quickly to competitors0.3270.192
Level of company’s information excellence0.3030.303
Diversity of equipment, technology, and operational workstations0.280.214
Integration of technology and information0.2970.205
Promoting a culture of transformation and modernization0.3110.154
Management’s interest to deliver new models0.30.16
Management’s interest in full automation0.2860.157
Quality standards in the production of new products0.270.223
Innovation in products0.3180.195
Relationship based on trust with suppliers0.2950.187
Flexible production capacity0.2910.201
Table 10. The values of Si.
CompanySi
Kalleh0.087
Gella0.75
Haraz0.621
Saleh0.204
Table 11. The values of Ri.
CompanyRi
Kalleh0.02
Gella0.067
Haraz0.067
Saleh0.067
Table 12. The ideal points S and R.
S+0.0878
S0.75
R+0.02
R0.067
Table 13. The final utility score Q.
CompanyQRank
Kalleh01
Saleh0.52
Haraz0.8953
Gella0.98394
Table 14. Comparative analysis based on different methods.
MethodCompanyUtility ScoreRanking
ARAS [79]Kalleh0.96241
Saleh0.93522
Doshe0.75003
Gella0.65764
EDAS [80]Kalleh11
Saleh0.9112
Doshe0.3083
Gella0.0394
MABAC [81]Kalleh0.38231
Saleh0.26602
Doshe–0.15143
Gella–0.28074
TOPSIS [78]Kalleh0.8539661
Saleh0.7813762
Doshe0.4427953
Gella0.2706834
VIKOR [82]Kalleh01
Saleh0.502
Doshe0.8953
Gella0.98394

