1. Introduction
With the extensive application of software in daily production and life, complexity increases dramatically. Complexity has become one of the elementary attributes of software systems, and runs through the whole life cycle of software analysis, design, development, testing, and maintenance. It is difficult to analyze the structure of a sophisticated software product and the relationships between its components, further increasing the difficulty of developing, maintaining, extending, and upgrading it. Researchers have studied a large number of open-source software systems and find that the complexity of the software system is one of the primary factors leading to software errors. Thus, exploring the internal rules of complex software systems and figuring out key nodes that lead to vital problems will play an important part in the software development progress [
1,
2,
3].
The complexity of software systems stems from manifold aspects [
4,
5]. First, subjects described by software systems are increasingly complicated. Moreover, diverse application fields lead to completely different internal structures and functional logic. Secondly, software systems themselves are progressively intricate. Systems generated by various platforms retain their particular architecture by virtue of the unique compilation mechanism of each platform. On the other hand, comprehension differences exist among developers towards the same software requirements. A variety of program languages, computation modes, and application modes can be selected for software implementation. Furthermore, the complexity of computer hardware results in a consideration of hardware resources during the development of software systems. Thirdly, the complexity of a software system is derived from continuous updating and upgrading, namely, the process of software evolution.
Software structural change is a common phenomenon. Measurement and control of software structure has always been the goal of software designers and developers. Therefore, how to effectively analyze and control the internal structure of software is pivotal to understanding and measuring the complexity of software as well as its evolution. Current software complexity metrics generally spotlight either program code line such as scale of code lines, blank lines, or analyzing cyclomatic, essential and code path quantity of software module data control flow diagrams. Prevailing approaches include McCabe, Halstead, C&K, and MOOD. McCabe transformed the control flow of a program into a directed graph and measured the complexity by counting the number of linearly independent directed loops. Different from McCabe, Halstead proposed a data flow-based method and evaluated software complexity through calculating the number of operators in a program. Accompanying the development of object-oriented technology, Chidanber and Kemerer put forward an inheritance tree-based way and estimated the complexity of an object-oriented software at a granularity of classes from six indicators containing number of weighted methods in class, depth of inheritance tree, number of subclasses, degree of coupling between objects, number of external function call in a class, and polymerization degree among methods inside a class. Brito introduced the MOOD approach, which measures the encapsulation, inheritance, coupling, and polymorphism of object-oriented software to reflect its complexity. The above traditional measurement methods describe the complexity of software from different aspects. All focus on analyzing the local structure and characteristics of functional individuals in the software system like classes, methods, etc., and lack a global measurement of software structure [
6,
7,
8,
9,
10].
The emergence of complex systems and complex networks [
10,
11,
12,
13], which emphasize a holistic approach to the system rather than focusing on local aspects, has provided a valuable perspective and a unique research dimension for understanding a software system. Unlike the traditional “reduction method” used in software development, the complex system theory emphasizes the global features of a system. Generally speaking, complex systems tend to give rise to new features that are not intentionally implemented by the system developer, and these features exist only at the system level. These emergent properties cannot be observed at the lower levels and in the local parts of a system. There are many real examples of this phenomenon in nature [
11], such as the social activities of ants and geese, which demonstrate abilities that one or several ants or geese cannot achieve on their own. The same is also true of software systems; while a single class or module can accomplish only a limited amount of functionality, all classes or modules interact cooperatively within the system to achieve the desired functionality of the user. Therefore, studying these emergent characteristics can provide valuable perspectives and different research dimensions for understanding software systems [
14,
15,
16,
17].
In 2002, Valverde et al. first introduced the complex network method to study the structure of software systems and found that the system structure of JDK 1.2 and Ubi Soft Pro Rally2002 both exhibited obvious “small world” and “scale-free” characteristics. Studies have been conducted into selected software systems written in Java and research carried out at the class level as well [
18,
19,
20,
21,
22,
23,
24,
25].
Open-source operating systems are obviously dynamic and interdependent. The development of an open-source operating system involves more uncertainty and complexity than other engineering projects. The internal structure of the system and its intricate interactions have gradually exceeded the comprehension of software developers. On the one hand, bug corrections and new function additions to the open-source project are in continuous iteration, so the version is in a state of constant change. On the other hand, open-source platforms emphasize software reuse, which is not restricted to internal projects [
24,
25,
26,
27,
28]. This reusing causes the dependencies between applications, and between applications and operating systems, to become more complex. Currently, mainstream open-source operating systems abstract installable software units into software packages. However, the system not only involves the stacking of software packages, but also the orderly combination of these packages. It is worth exploring further so as to describe and study the internal structure of open-source operating systems.
This paper takes open-source operating system software as the object of analysis and proposes a network model of the software package. We extract the dependencies of software packages and describe the internal structure of open-source operating systems by treating software packages as nodes and dependencies as edges. In brief, this paper makes three main contributions:
It constructs a software package dependency network for an open-source operating system, which sets the overall structure of the system.
This paper takes Ubuntu Kylin Linux [
29] as an example and analyzes the evolution of the software package dependency network through the dimensions of the scale, density, connectivity, cohesion, and heterogeneity of each distributed version.
This paper proposes a betweenness-based method in order to exploit the key nodes of an open-source operating system software package dependency network.
The remaining parts of this paper are structured as follows.
Section 2 describes the construction of the software package network.
Section 3 gives a detailed analysis of the software package dependency network evolution of Ubuntu Kylin Linux.
Section 4 proposes a betweenness-based method to mine the key node of the above networks. Finally, conclusions are given in
Section 5.
2. Software Package Dependency Network
2.1. Software Packages
At present, mainstream open-source operating systems abstract installable software units into software packages and provide a corresponding software package management and distribution system to manage various interdependent software packages, as well as assisting users to obtain, install, delete or update required software packages [
30,
31,
32,
33,
34,
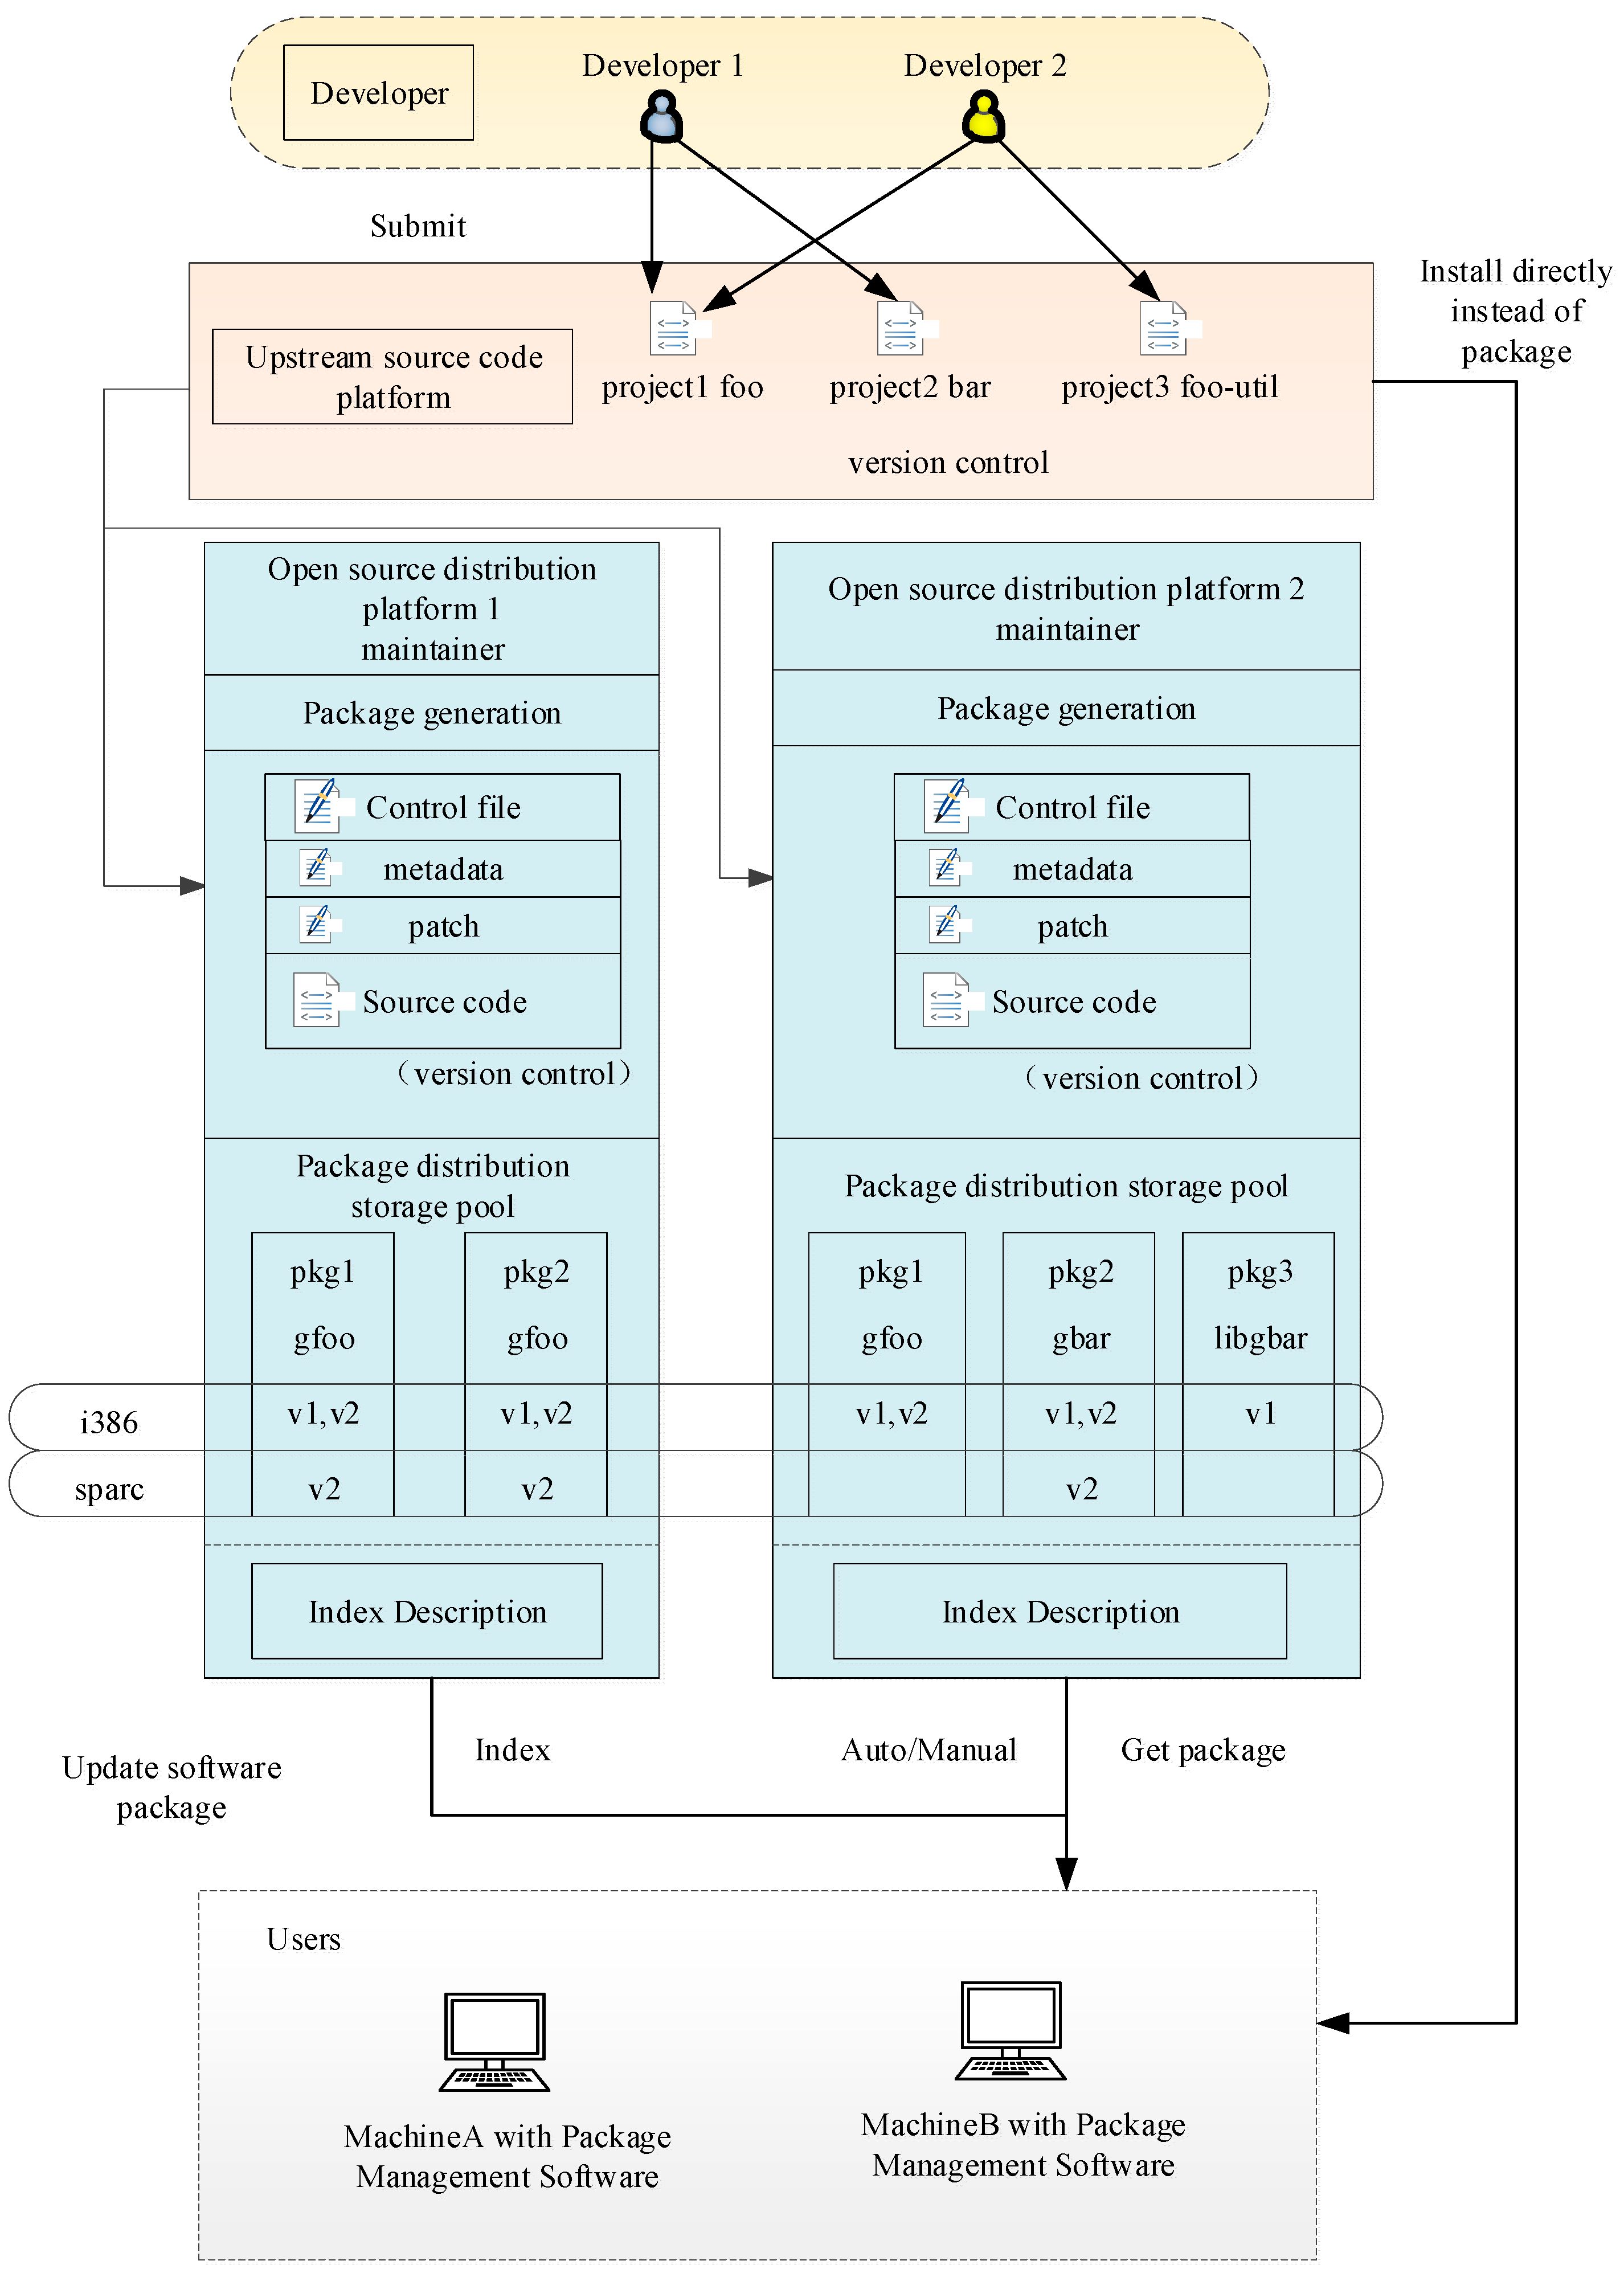
35]. A software package contains the program, data, and corresponding configuration files of the published software, along with some metadata that describes the name, version, dependency and other information about the software package that can be used by the software package management and distribution system. The software package acts as an independent module in the operating system platform to achieve a comprehensive function. Developers develop packages through a front-end text editor, and it is up to the operating system distributors to decide which packages can be integrated into the corresponding version of their operating system.
A complete software package management system includes the distribution and management of software packages. Software package distribution is maintained by means of open-source distribution platforms such as Debian and Gentoo. According to its specific characteristics, each platform imports/updates the source code of open-source projects by its maintainer. The resulting software packages are kept in the storage pool and marked according to their architecture and version number. The distribution part is the bridge that connects the open-source software project to the end users, providing the service of obtaining and downloading the software packages through the network. Package management involves parsing the package format and content on the client side, as well as implementing the specific installation, update and deletion of packages. When the package management software is dealing with the dependency of newly installed software packages, it can obtain the required software packages from the distribution storage pool with the help of the services provided by the distribution part, so as to realize the automation of client operation.
Figure 1 presents the management structure of open-source packages [
34,
35].
2.2. Dependency of Software Packages
The main body of a software package is a set of functions. As developed in an open-source environment, their source code can be reused and modified. Functions in the existing software package can either be called directly or modified as new functions. In software package systems, the former is defined as a dependency, while the latter is not defined or documented. Dependencies must be stated in the new package description file so that the software management system can automatically load its dependent packages when the new package is running. This dependency is the lifeblood of software package expansion.
One notable aspect of dependency is the dependency on a function library. As a vital component of the operating system, a function library is used to realize various specific functions. Function libraries exist on computers in the form of library files, and different operating systems have different ways of organizing these files. An operating system’s standard function libraries usually achieve relatively basic functions, which are developed and maintained by professional technicians. These function libraries can be repeatedly called up by other programs, and the operation of each application depends on a variety of elementary function libraries.
An operating system is a complex set of elements that interact, correlate, or depend on each other. In this paper, the dependencies of software packages can be regarded somewhat similarly to references in academic papers. More specifically, if package A relies on package B, this means that package A directly calls the functions in package B, and the operating system platform automatically loads package B when package A is running.
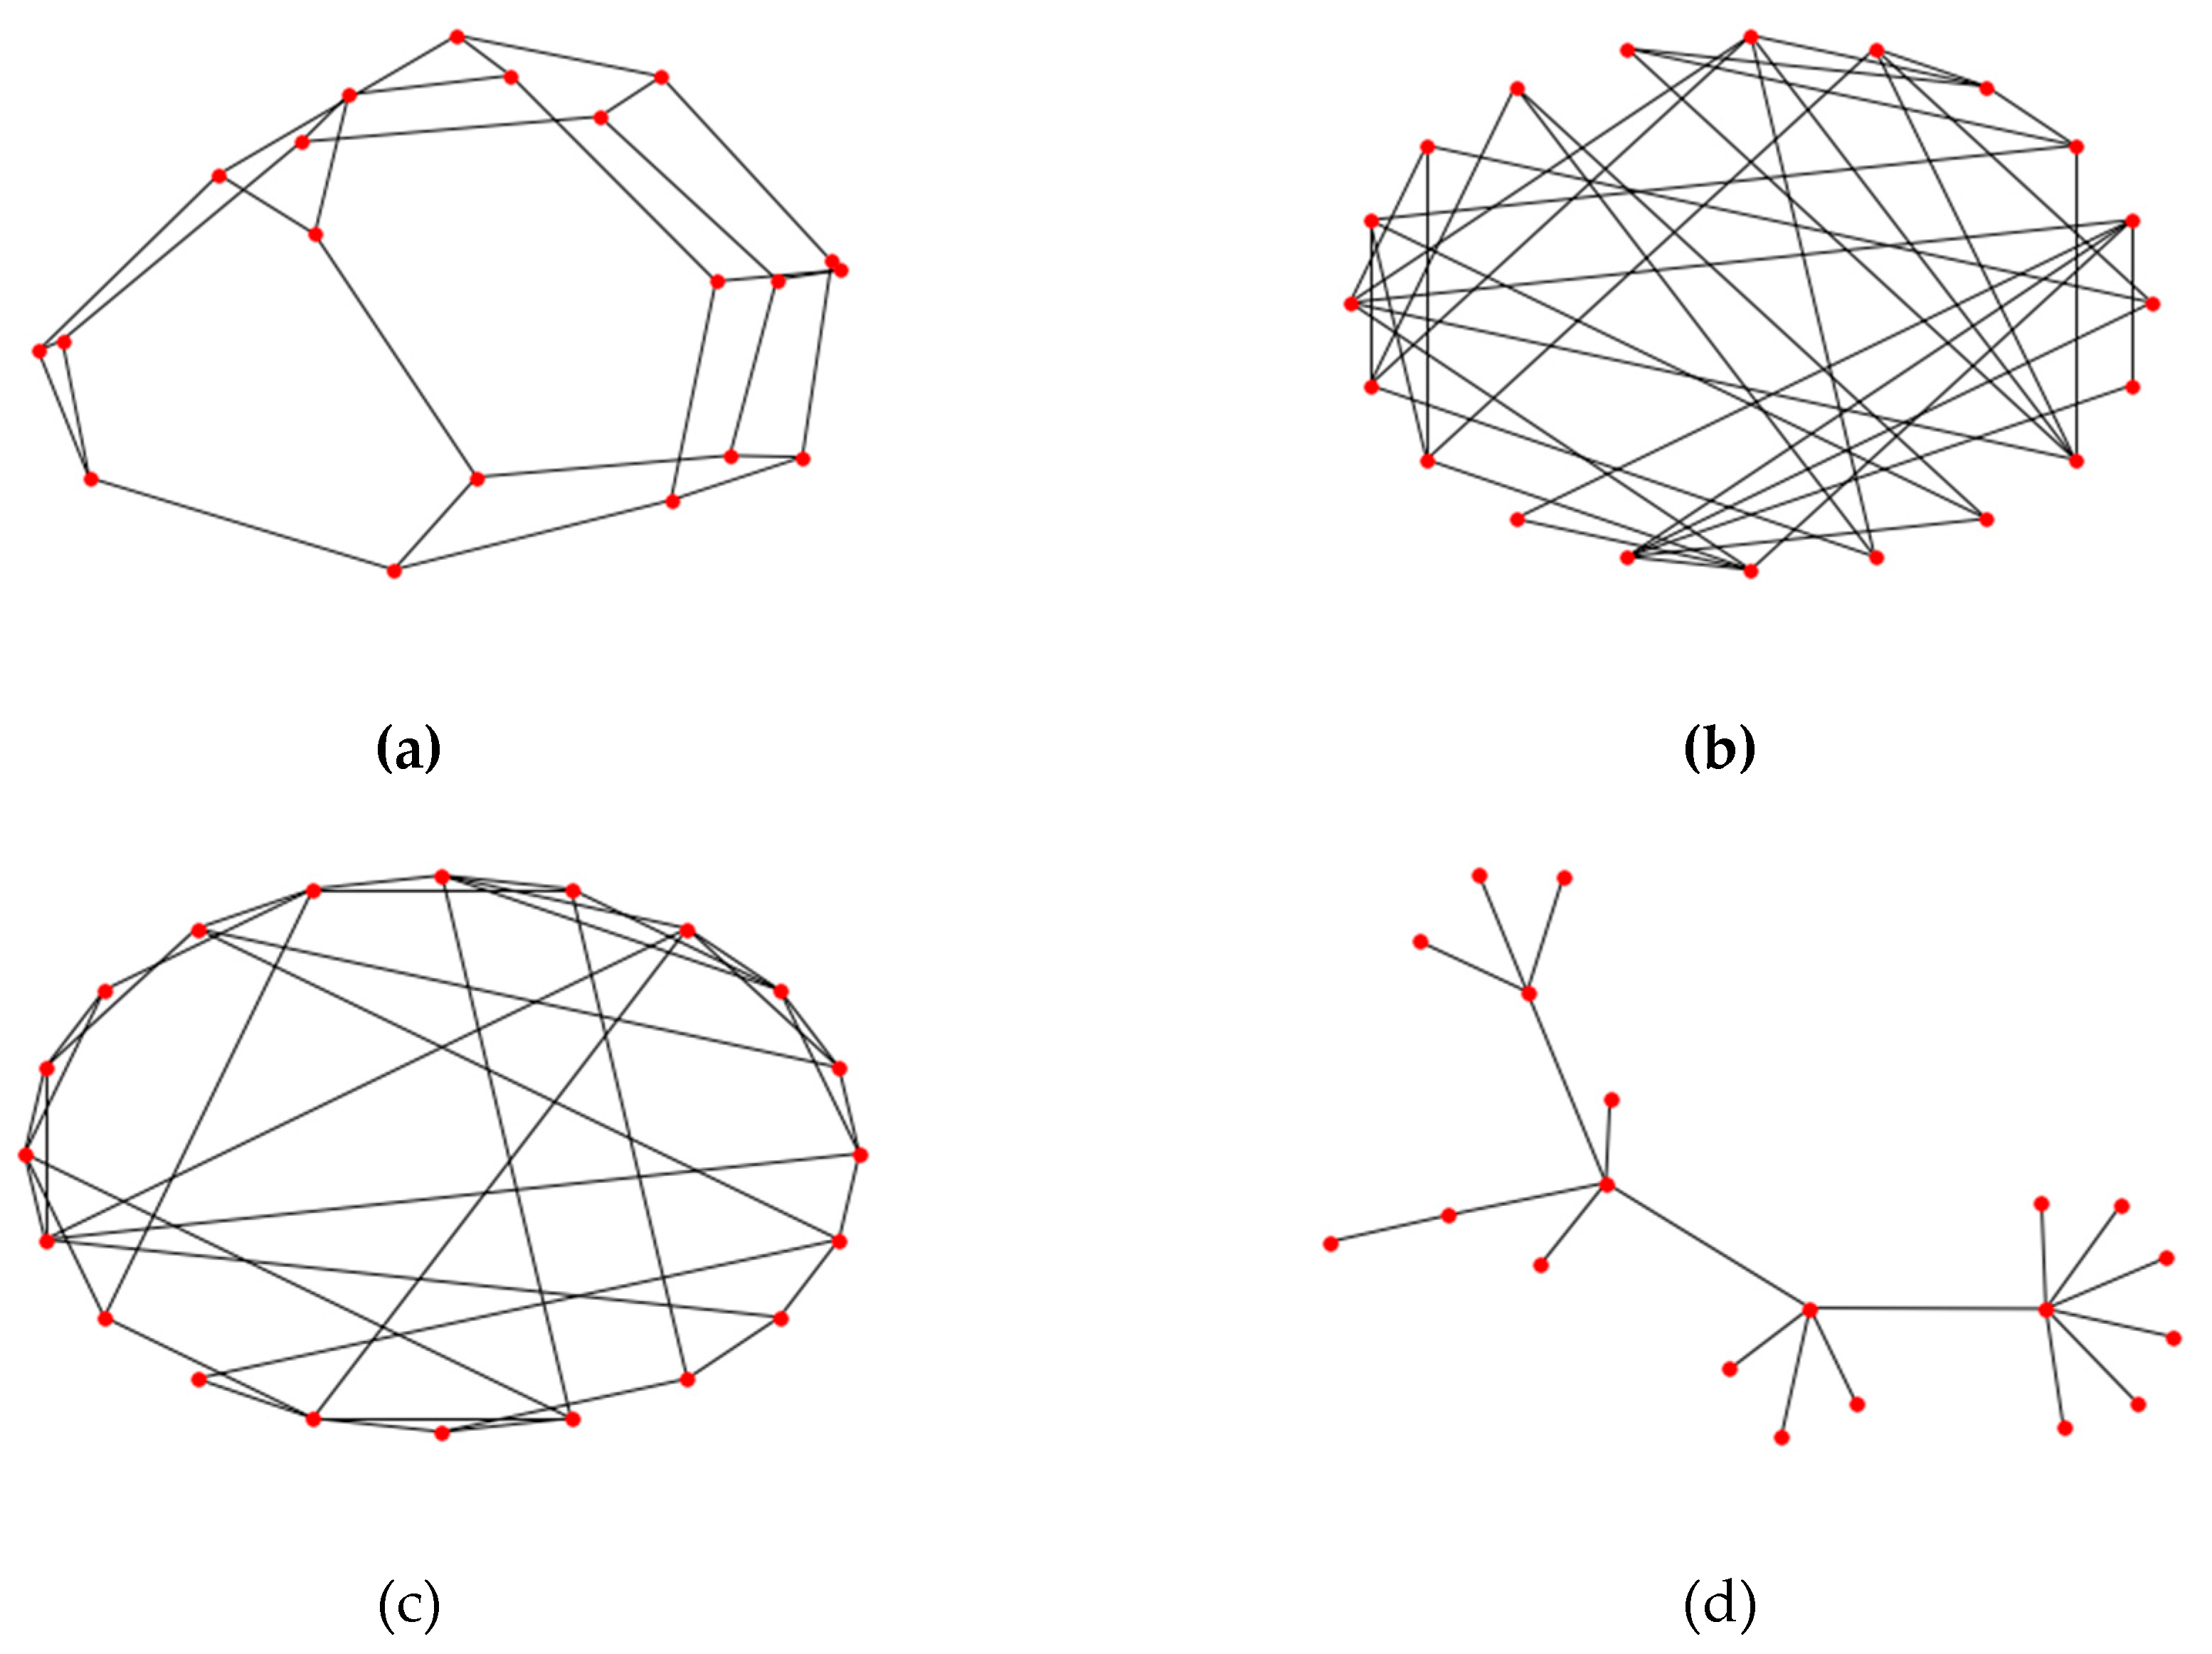
2.3. Complex Network
A complex network aims to express complicated social systems in the real world through mathematical concepts. Nodes in a complex network represent individuals in real life, while edges between nodes represent relationships between individuals. A comprehensive study of complex networks can help to understand their structural composition, evolutionary dynamics, and other characteristics, and provide a basis for other disciplines. A complex network is a kind of network that possesses one or all of the features of self-organization, small world, scale-free, and self-similarity. Degree distribution, cluster coefficient, and average path length are three basic static structural characteristics of complex networks. The number of edges connected to a node in a network is the degree of that node. Degree represents the influence of a node. The more edges that are connected to a node, the more relationships there are between the node and other nodes, and thus the higher importance it has in a network. Cluster coefficient is another important parameter of a complex network, which measures the collectivization level of a complex network. Path refers to the number of accessible edges between two nodes in the network, that is, two nodes can be connected through these edges. Average path distance reflects the overall structural characteristics of a complex network.
There are generally four models of complex network: regular network, random network, WS small-world network, and BA scale-free network. A regular network is the simplest form of complex network theory; all nodes have the same degree as well as higher average path length and cluster coefficient. As the beginning of the systematic study of complex network theory in mathematics, a random network is generated through two steps. First, set the size of the network, which means the number of nodes, to
. Then, connect any two nodes in the network with probability
. A random network with
edges is constructed. Degree distribution of a random network is a relatively representative Poisson distribution. Average degree will increase with a rise in
. However, clustering coefficient decreases with the increase of
, while average path distance is proportional to
, which is obviously different from regular networks. A WS small-world network, which describes a transition from a completely regular network to a completely random network, has typical features of short average path distance as well as a large clustering coefficient. A common property of many large networks is that the vertex degrees follow a scale-free power-law distribution, The BA model features two generic mechanisms: the networks expanding and the preferential attachment. Expanding of networks concentrates on the open property of a network that new nodes will be added all the time. Moreover, increasing the number of nodes results in a growth in network scale. Preferential attachment predicts a new node connection trend: they prefer to establish relationships with nodes that have more connections.
Figure 2 delineates the above four models under the same scale, in other words, with the same node number.
2.4. Construction of the Software Package Dependency Network
When considering the internal structure of open-source operating system software, software packages can be regarded as nodes of a network, while their relationship can be seen as the edge of the network. Thus, the internal structure of open-source operating system software can be characterized by a network of software packages. Edges in the network are directed owing to the directional property of dependency.
In our research, we define the software package dependency relationship as an unweighted and directed graph
.
represents the set of nodes
. Each node represents a software package.
represents the set of connected edges. An edge connects two dependent packages. When a vertex
depends on another vertex
, there is an edge connecting node
to node
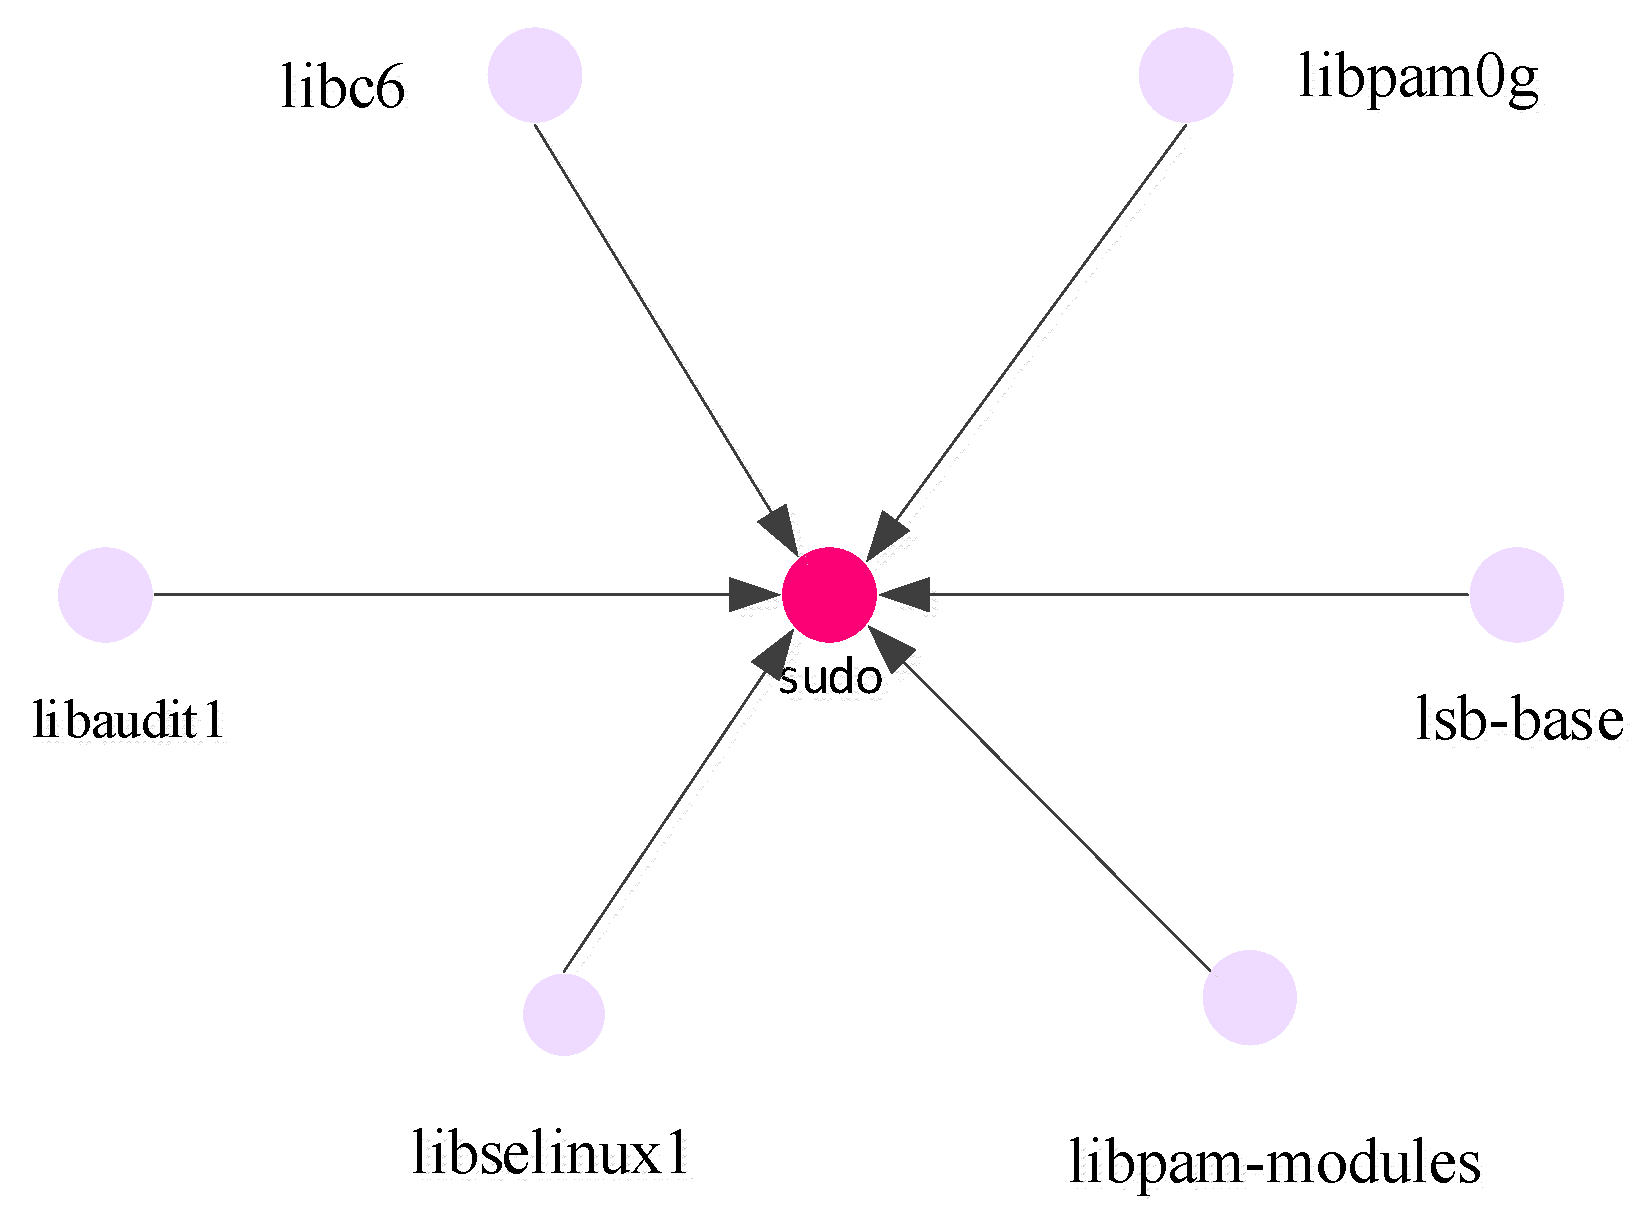
, in other words, this means that package j is derived from package i. The establishment of a dependency network is described below using the example of the Sudo software package. The dependency of the software package can be queried from the command line. The Sudo software package is dependent on the following packages:
| $ apt-cache depends sudo |
| sudo |
depends: libaudit1
depends: libc6
depends: libpam0g
depends: libselinux1
depends: libpam-modules
depends: lsb-base |
In this example, we only build the first-level dependency network, since there may be nested dependencies of other packages that Sudo is dependent on. Results are presented in
Figure 3.
The following algorithm is used to extract the overall software package dependency network.
| Algorithm 1. Package dependency extraction |
| 1. initialization phase |
for i = 1, 2, 3, …, n
Vi ← package names
2. find dependency relationship and construct the graph
for i = 1, 2, …,n
for j = 1, 2, …, i−1, i+1, …,n
scan the dependencies list of vi
add an edge when dependency exit between vi and vj
3. delete redundant edges
4. store the graph as a table
5. visualization |
3. Results and Analysis
In this paper, we took Ubuntu Kylin Linux operating system [
29], which is a Chinese official distribution of Ubuntu Linux maintained by our university, as the research object. Ubuntu Kylin Linux operating system released its first version, named 13.04, in 2013. Since then, two operating system versions have been released each year. The beta version with suffix ‘.04’ is released in the first half of the year, while the official operating system version, which has a version number that contains extension ‘.10’, is released in the second half. Our experiments are conducted on the grounds of Algorithm 1 and extracted software package dependency relationships from their head files. This paper regards the holistic structure of the operating system as the package dependency network. Abstracting packages as nodes and dependency relationships as edges, complex a operating system internal structure is transformed into a network model, namely, a graph. Thus, complexity metrics are turned into an investigation of topological structure features. Degree distribution, cluster coefficient, and average path length are three basic static structural characteristics of complex networks. By combining complex network theory with knowledge of software engineering, we will obtain a better understanding of the topological structure and dynamic characteristics [
36,
37,
38,
39].
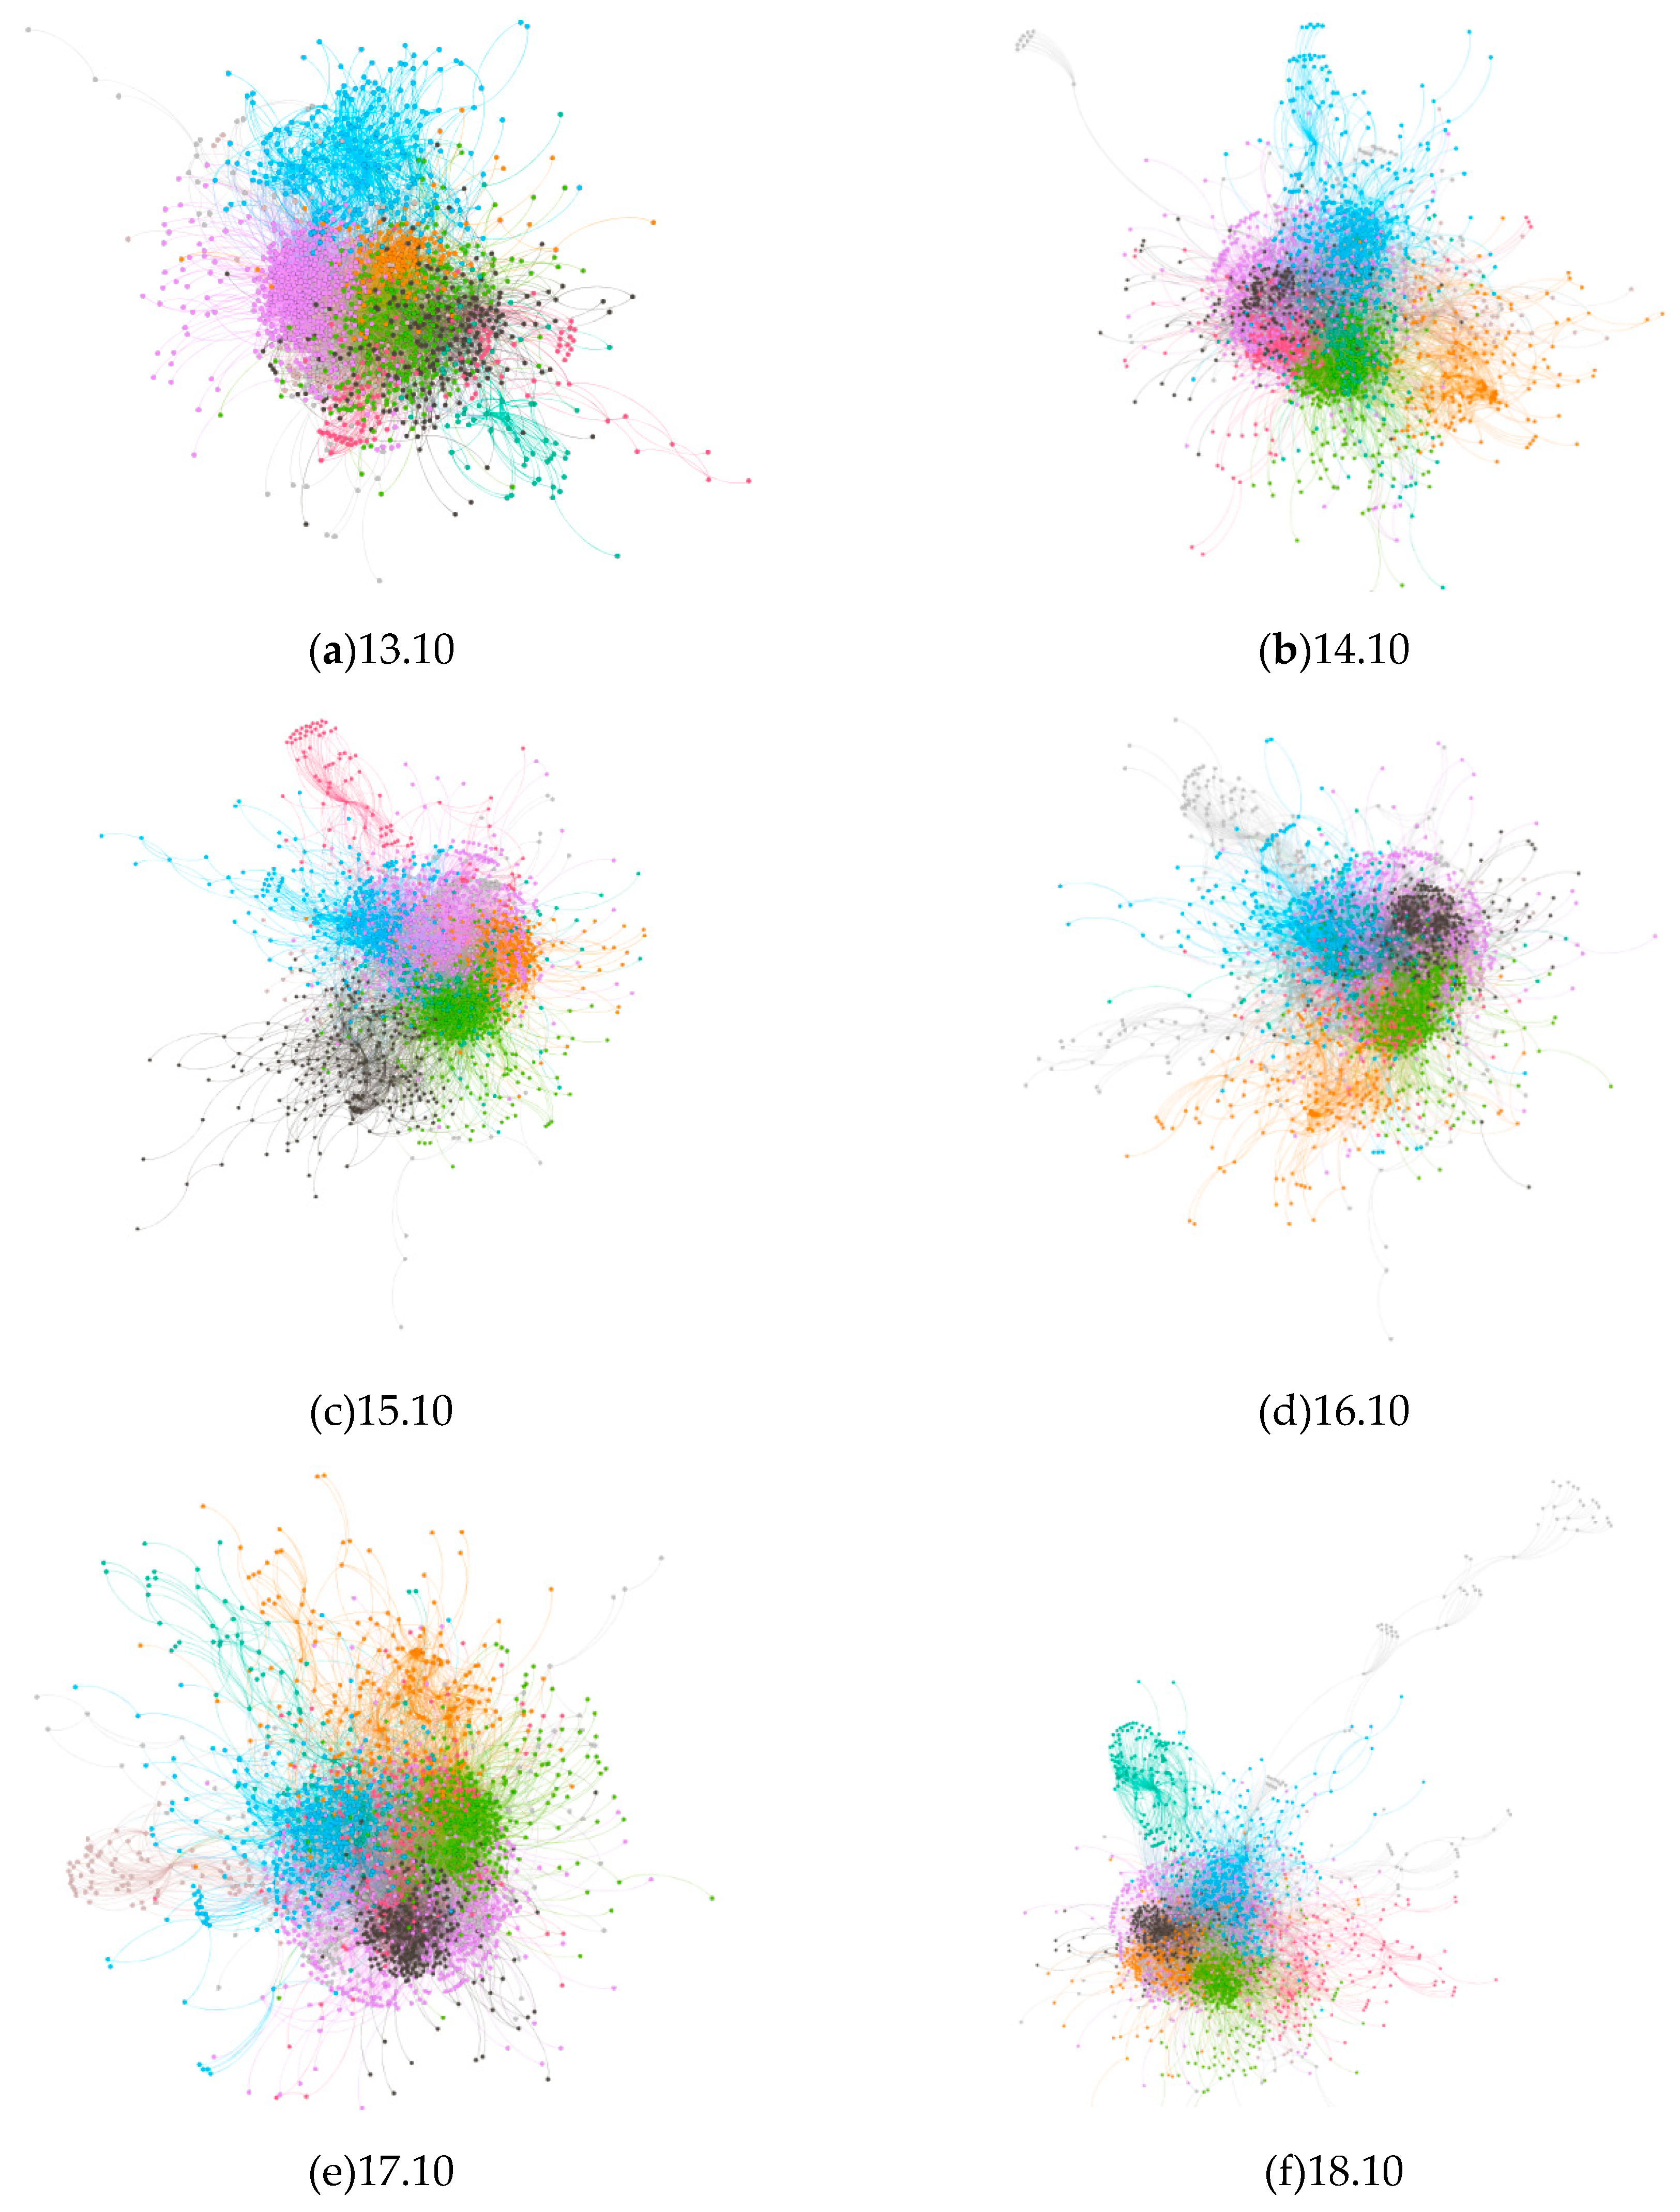
Our experiments portray the software package dependencies of six versions of the Ubuntu Kylin operating system, from the official versions of 13 to 18. With daily use of an operating system, the quantity and variety of installed software packages varies from user to user depending on their own habits. Therefore, six operating system versions tested in this experiment are all original versions of the system, in other words, the original version at the time of release.
Figure 4 presents the overall structure of the software package dependency network for six operating system versions. All networks are visualized by Gephi, which is an open-source visualization tool. The following networks are presented in modularity. Nodes inside a module have a close connection, while few connections exist between modules. In the following pictures, a different color indicates a unique module.
The change of software structure is a common phenomenon in the wake of software evolving. Kernel upgrade, desktop environment technology replacement, and the addition of new functions are the primary factors that lead to structural variation in operating systems.
Degree distribution, cluster coefficient, and average shortest path length are general preferences used in complex network theory to estimate structural characteristics of a network. For a comprehensive investigation of our network characteristics, we will discuss the above six networks in terms of network scale, density, connectivity, cohesion, and heterogeneity.
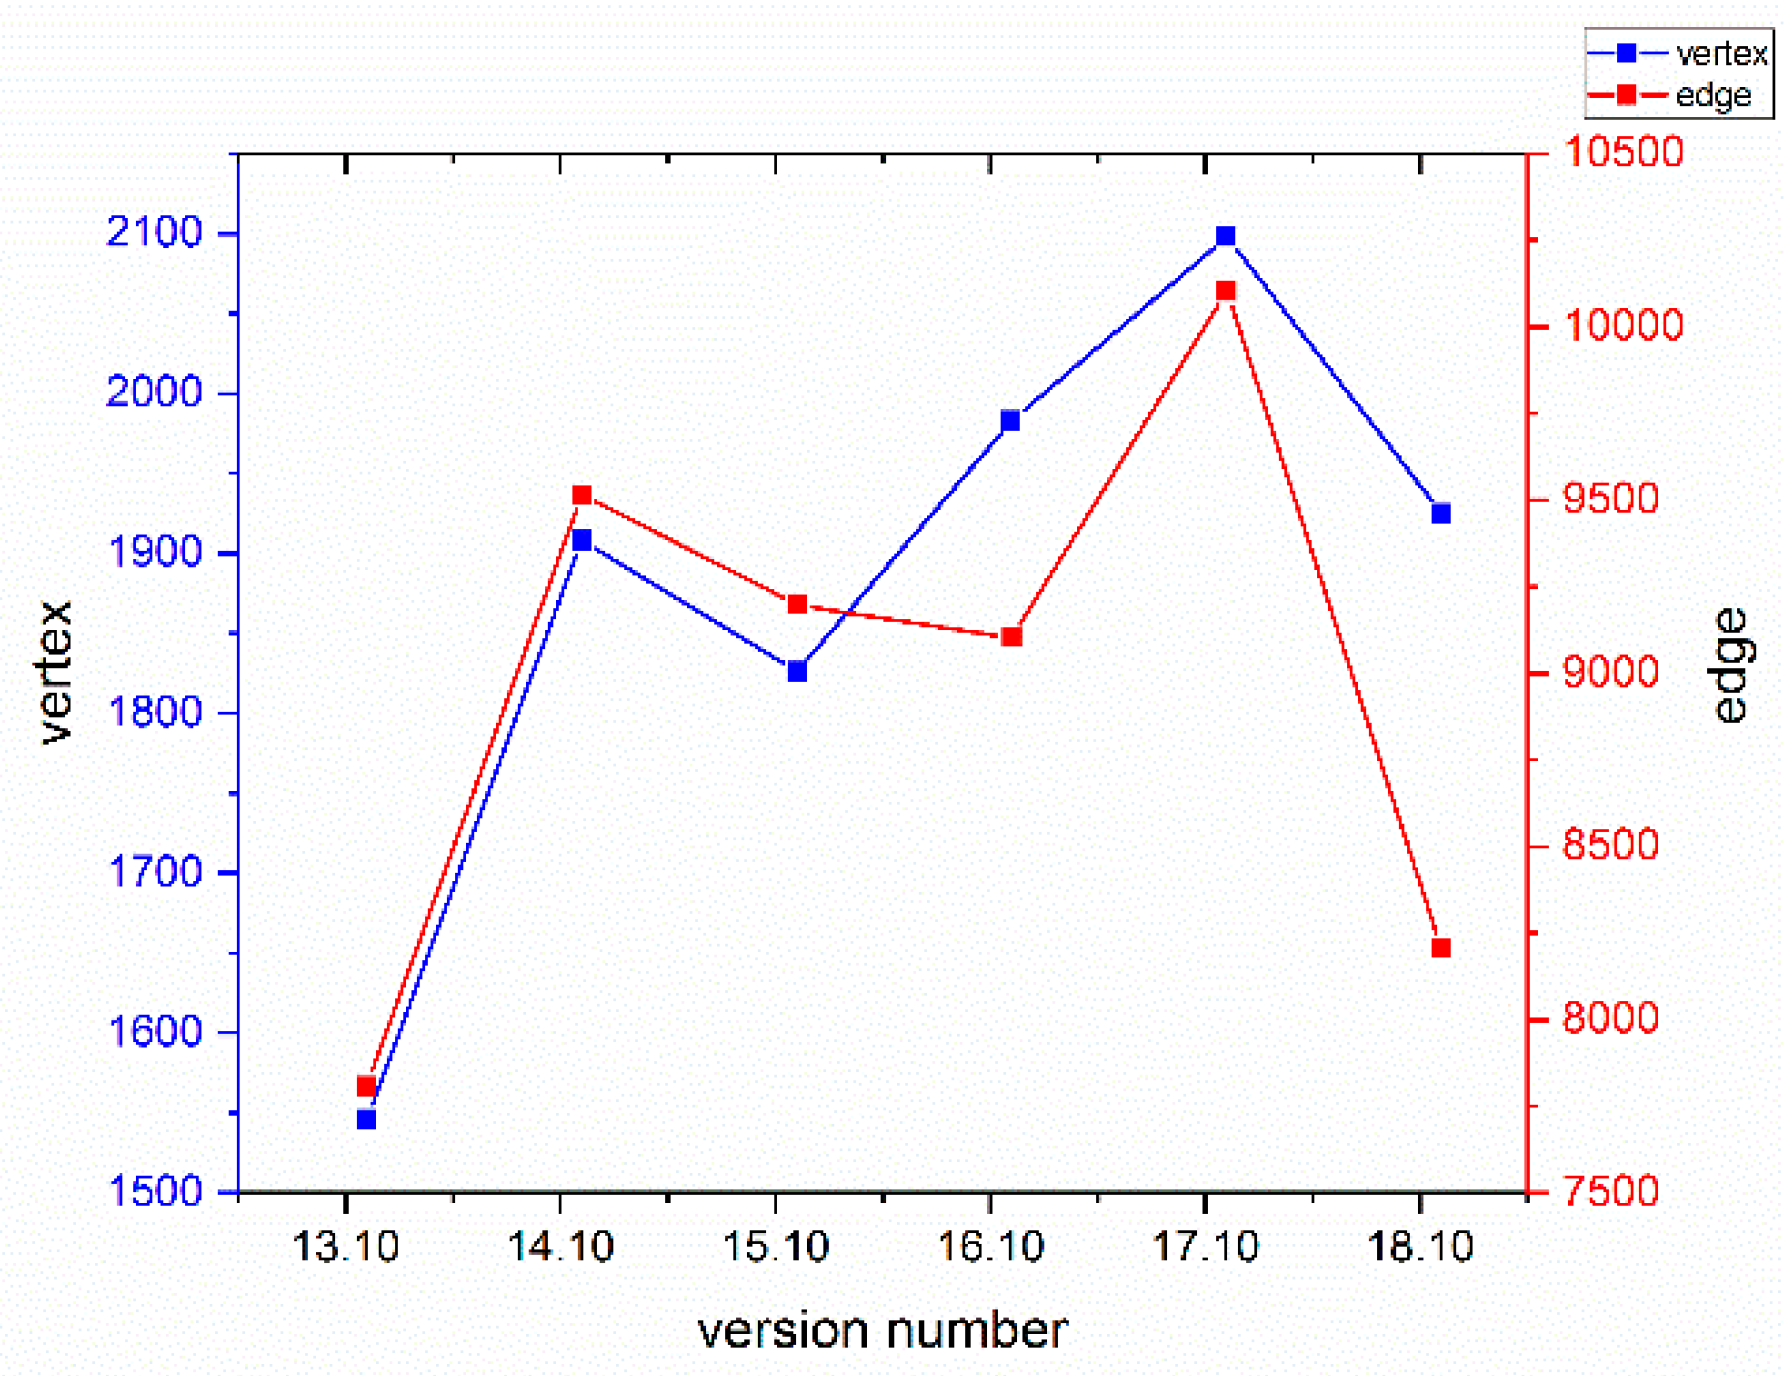
3.1. Network Scale
The scale of a network can usually be expressed in terms of the number of nodes in the network. The scale of an actual network is almost always changing. In fact, in the case of the Internet and online social networks, the number of nodes and edges have been increasing for quite a long time [
27,
28].
Figure 5 presents the trend of network scale variation during the version evolution of the Ubuntu Kylin operating system.
According to the definition of network construction, a node represents a software package. Any increase or decrease in the number of nodes stands for a corresponding change in the number of packages. Therefore, the growth of nodes means the emergence of new software packages. On one hand, this may mean an addition of new technology; on the other hand, it may indicate the enrichment and expansion of the peripheral applications. By contrast, a decrease in nodes indicates the replacement of technology or the obsolescence of software packages.
Figure 5 presents that both the number of nodes and edges show the same evolutionary trend. Their increase is positive correlation. However, growth rate of edges is larger since the same node can be connected to more different nodes according to the increment of nodes.
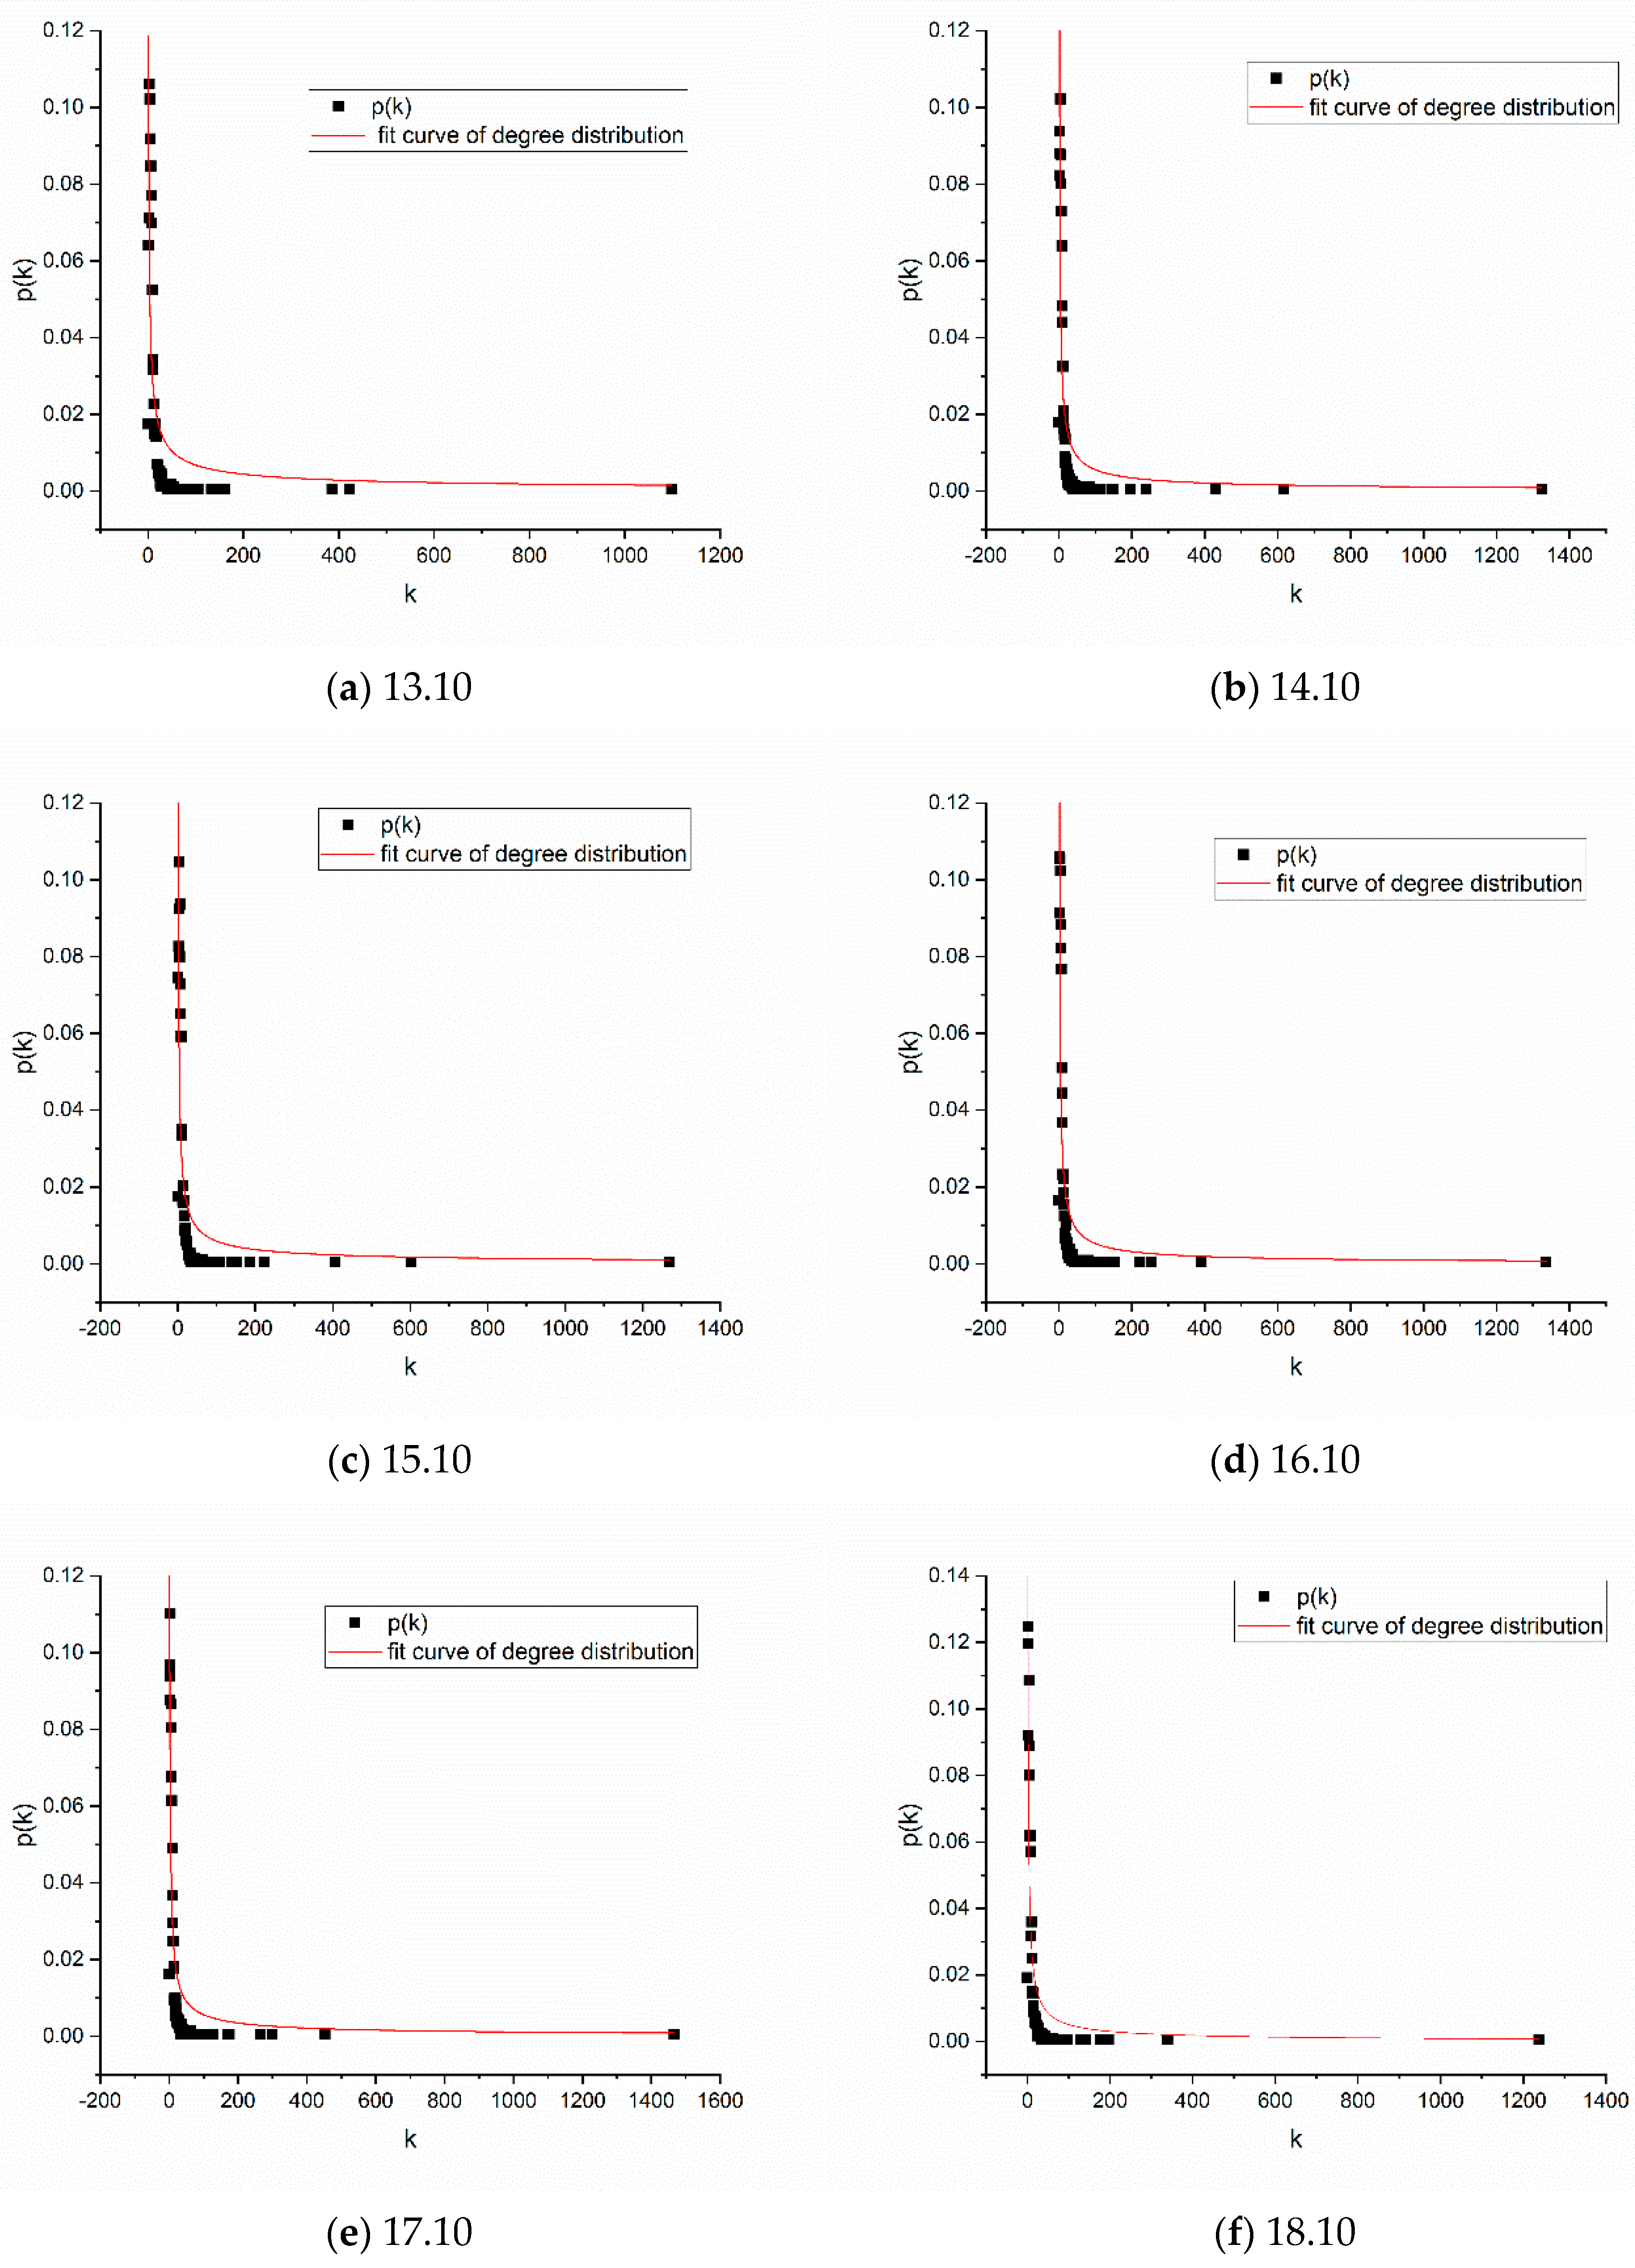
3.2. Network Degree and Its Distribution
The degree of connectivity of nodes in a software network determines the importance of the nodes in the network in a certain sense, reflecting the uneven degree of energy distribution. If a network is randomly connected, the importance of each node is roughly the same, and the energy distribution is uniform, such that the structural formula of the software can be considered “disordered.” On the contrary, if the network is asymmetric—that is, there are a small number of “core nodes” and a large number of “end nodes” (with small node degree) in the network—and there are also differences in the importance of nodes, resulting in an uneven distribution of energy, then the structural formula of the software can be considered “orderly” and “heterogeneous.”
Figure 6 presents the distribution of network node degrees across the six versions of the software package network.
As can be seen from the above figure, the node degree distribution of the six networks generally follows the power law distribution [
32], and the distribution of the system structure presents as uneven, showing that the whole structure is “orderly.” The node degree distribution curve of the six versions of the software networks displays the “long tail” feature; that is, most nodes in the network have only a small degree of connectivity, while a few nodes have a large degree of connectivity and become the central nodes.
The software package dependency network is a directed graph, and the input and output degrees of nodes represent different meanings. The reasons for this difference are linked to design rules and decisions made during development. In this paper, it is believed that the higher the in-degree of a node, the higher the level of its dependence on other nodes; by contrast, the higher the out-degree of a node, the higher the level of its reuse. This indirectly reflects the complexity of the operating system design.
3.3. Network Connectivity
Network connectivity is an indicator that measures whether network nodes are connected as a whole. For undirected networks, where there is a sequence of nodes
and edge connection exists between adjacent node pairs, there is a path between nodes
and
. Moreover, if a path exists between each pair of nodes in an undirected network, it is referred to as connected. The edges of a directed network have direction, and so does its path. If there is a node sequence
, where the adjacent node pairs have edges pointing from the former to the latter, it is said that there is a path from node
to node
. Obviously, there is a path from node
to node
, however there does not have to be a path from node
to node
. The connectivity of directed networks can be classified into two types: strong connectivity and weak connectivity. Strong connectivity means that between any pair of nodes
and
in the network, there is a path from node
to node
and from node
to node
. Weak connectivity means that when the direct edges as regarded as undirected edges, the undirected network is connected. Experiments have shown that the Ubuntu Kylin software package dependency network is not strongly connected.
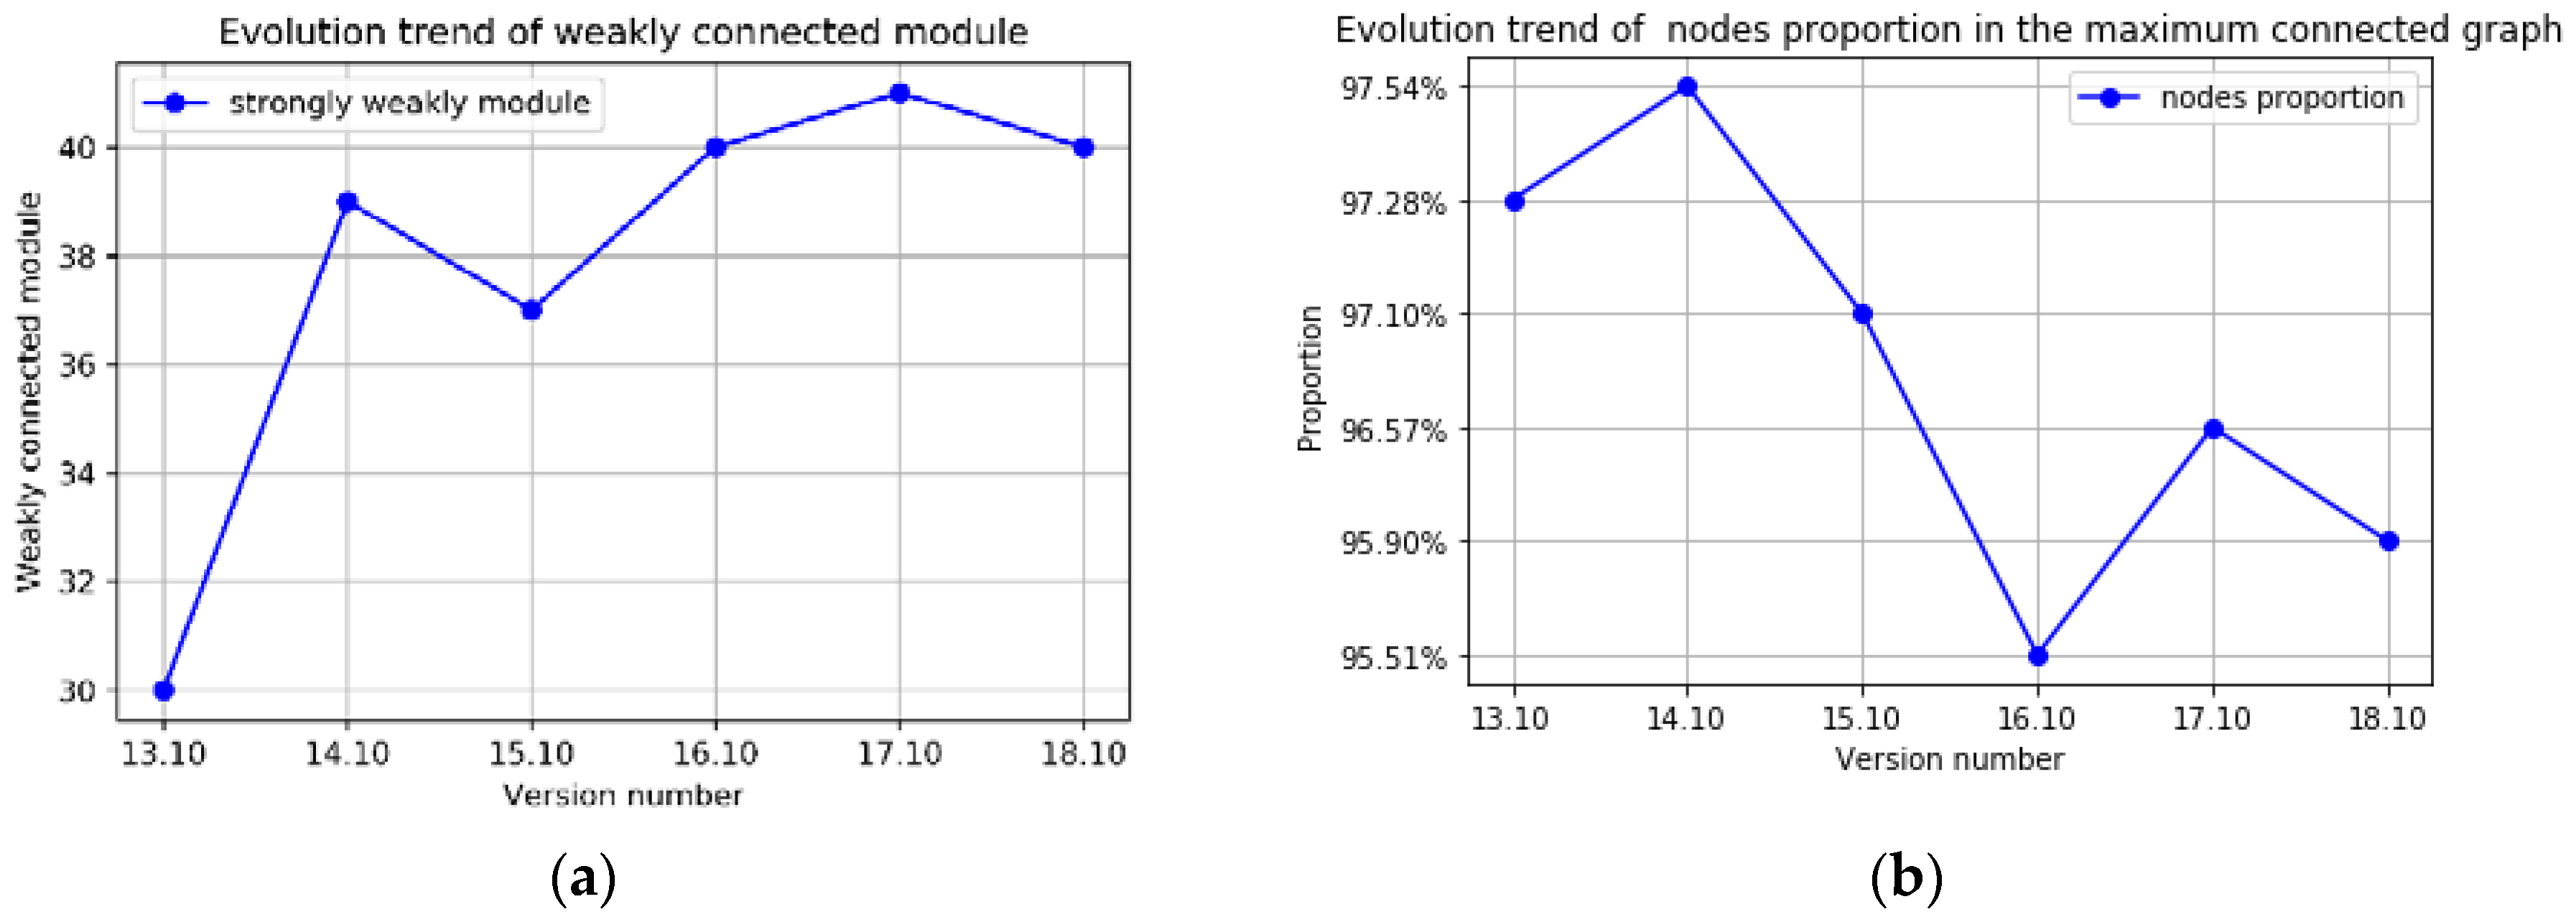
Figure 7 presents the number of strongly connected modules in each version of Ubuntu Kylin.
Next, we discuss the weakly connected property of the software package dependency network.
Figure 8 presents the number of weakly connected modules as well as the node portion of the maximum connected modules of the Ubuntu Kylin software package dependency network. It can be seen from
Figure 9 that the size of weakly connected modules from 13 to 18 versions is kept at 30 and above, while the node portion of the largest connected module is over 95%. This means that Ubuntu Kylin operating system package dependency network has good connectivity. Another phenomenon that each version of the connectivity reflects a relatively stable development trend can be observed in the figure. The node proportion of the maximum connected modules has been maintained at 95%, indicating that the package network is distinct from other networks, such as citation networks or dependency networks, and grows as a whole.
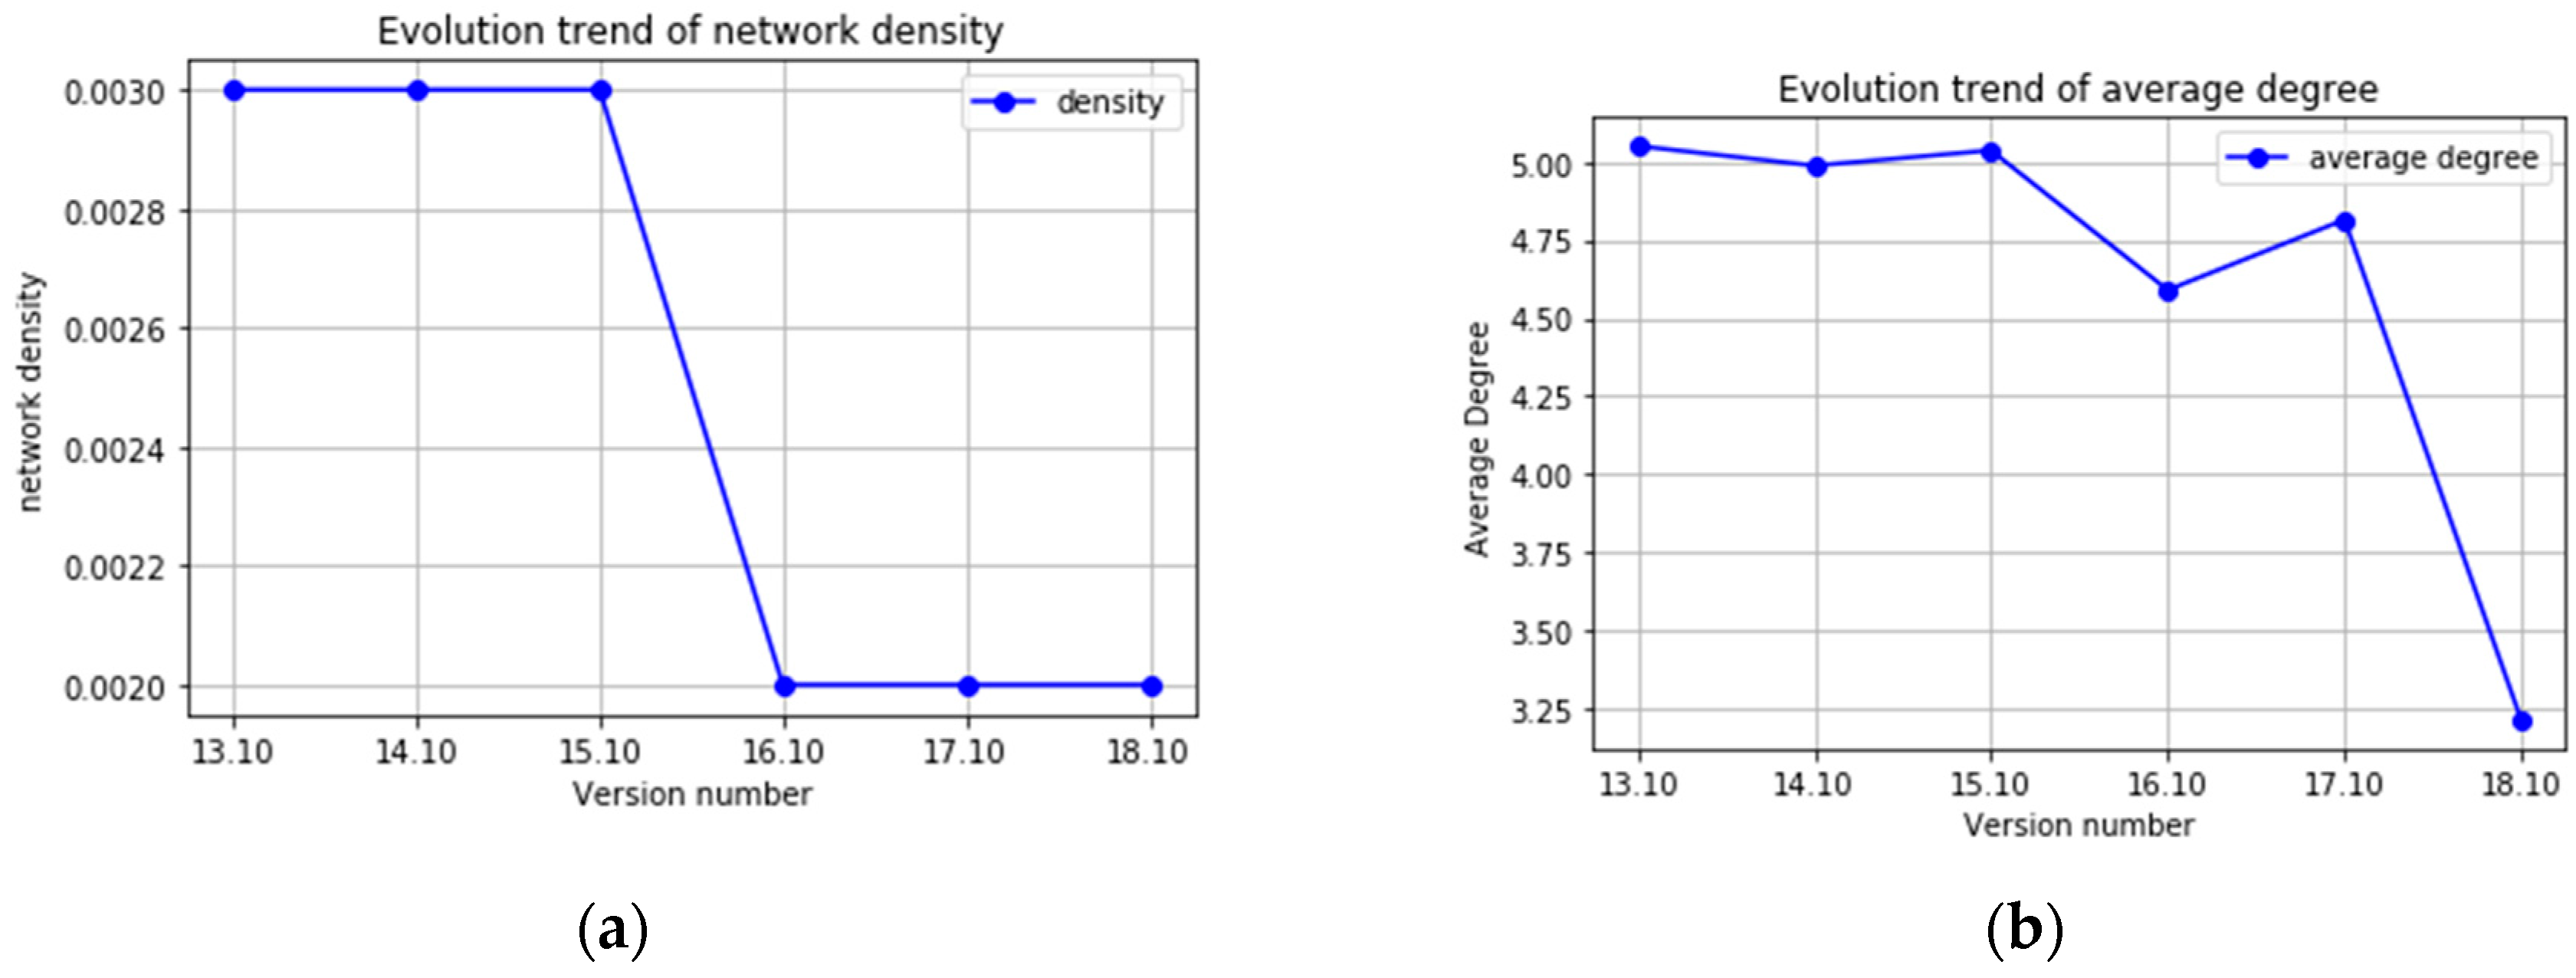
3.4. Network Density
The denseness of a network refers to the number of connected edges relative to the network size. Network density and average degree are two parameters that predominantly adopted for measuring network denseness. The former one measures the relative denseness of a network while the latter measures the absolute denseness of the network. The definition of the network density of a directed graph, which is marked with
, is presented in Equation (1). The average degree, marked with
, is defined in Equation (2). In the equation,
is the number of edges in the network, while
N is the number of nodes.
Figure 9 presents the graph density of each version of the software package dependency network. The experimental results demonstrate that the overall network density exhibits a downward trend and the network becomes sparse. The average density of the graph of the dependency network is 0.0025, while the average of the average degree is only 4.616, indicating that the software package dependency network is very sparse.
As the software version evolves, the degree of connection between software packages decreases, and so does the complexity of the internal structure. Increment of software scale, that is to say, the addition of new package, does not result in an increase in complexity. It indicates that the operating system version evolution only considers and design necessary features so as to avoid over-design.
3.5. Network Diameter
In the evolution of open-source operating systems, are software packages more closely associated or less? The average path length and network diameter can be used to assess the cohesion of a network. The shortest path between nodes
and
, marked as
, is defined as the smallest number of edges that can connect two nodes. The average path length of a network, marked as
, is the average distance between any two nodes. For directed networks, the formula for the average path length is defined in Equation (3) [
1]:
Many of the actual networks are large, but have a small average path length. This is called the “small world” phenomenon. Network diameter is defined in Equation (4); in other words, it is the maximum number of all shortest paths:
The average path length and diameter of each version of the software package dependency network are presented in
Figure 10. We study average path length to identify what level should be maintained in a software system so as to better realize the extensibility and maintainability of the software system and control the cost of software development. If the average shortest path of a network is too large, it may be because of a loose organization and a low degree of reuse. On the other hand, a small average shortest path indicates a high coupling degree between packages as well as an unclear system design responsibility. A small average is not conducive to software maintenance and modification.
3.6. Average Clustering Coefficient
The clustering coefficient, which originates from the social networking field, is a measure of the rate at which nodes in a network tend to cluster together. Nodes in real-world networks tend to create tightly knit groups with a relatively high density. Two versions of clustering coefficient exist in a network: the local clustering coefficient and its global alternative. The local clustering coefficient quantifies how close its neighbors are to being a clique. To wit, it calculates the proportion of neighbors directly adjacent between nodes to account for the maximum possible neighbors. Its global version, the average clustering coefficient, gives an indication of the overall clustering in a network. In our experiments, the local clustering coefficient is given as in Equation (5), where
refers to the actual connection number of a node and
is the degree of the node:
The average clustering coefficient is the average of the local clustering coefficients of all the vertices, which can be acquired through Equation (6):
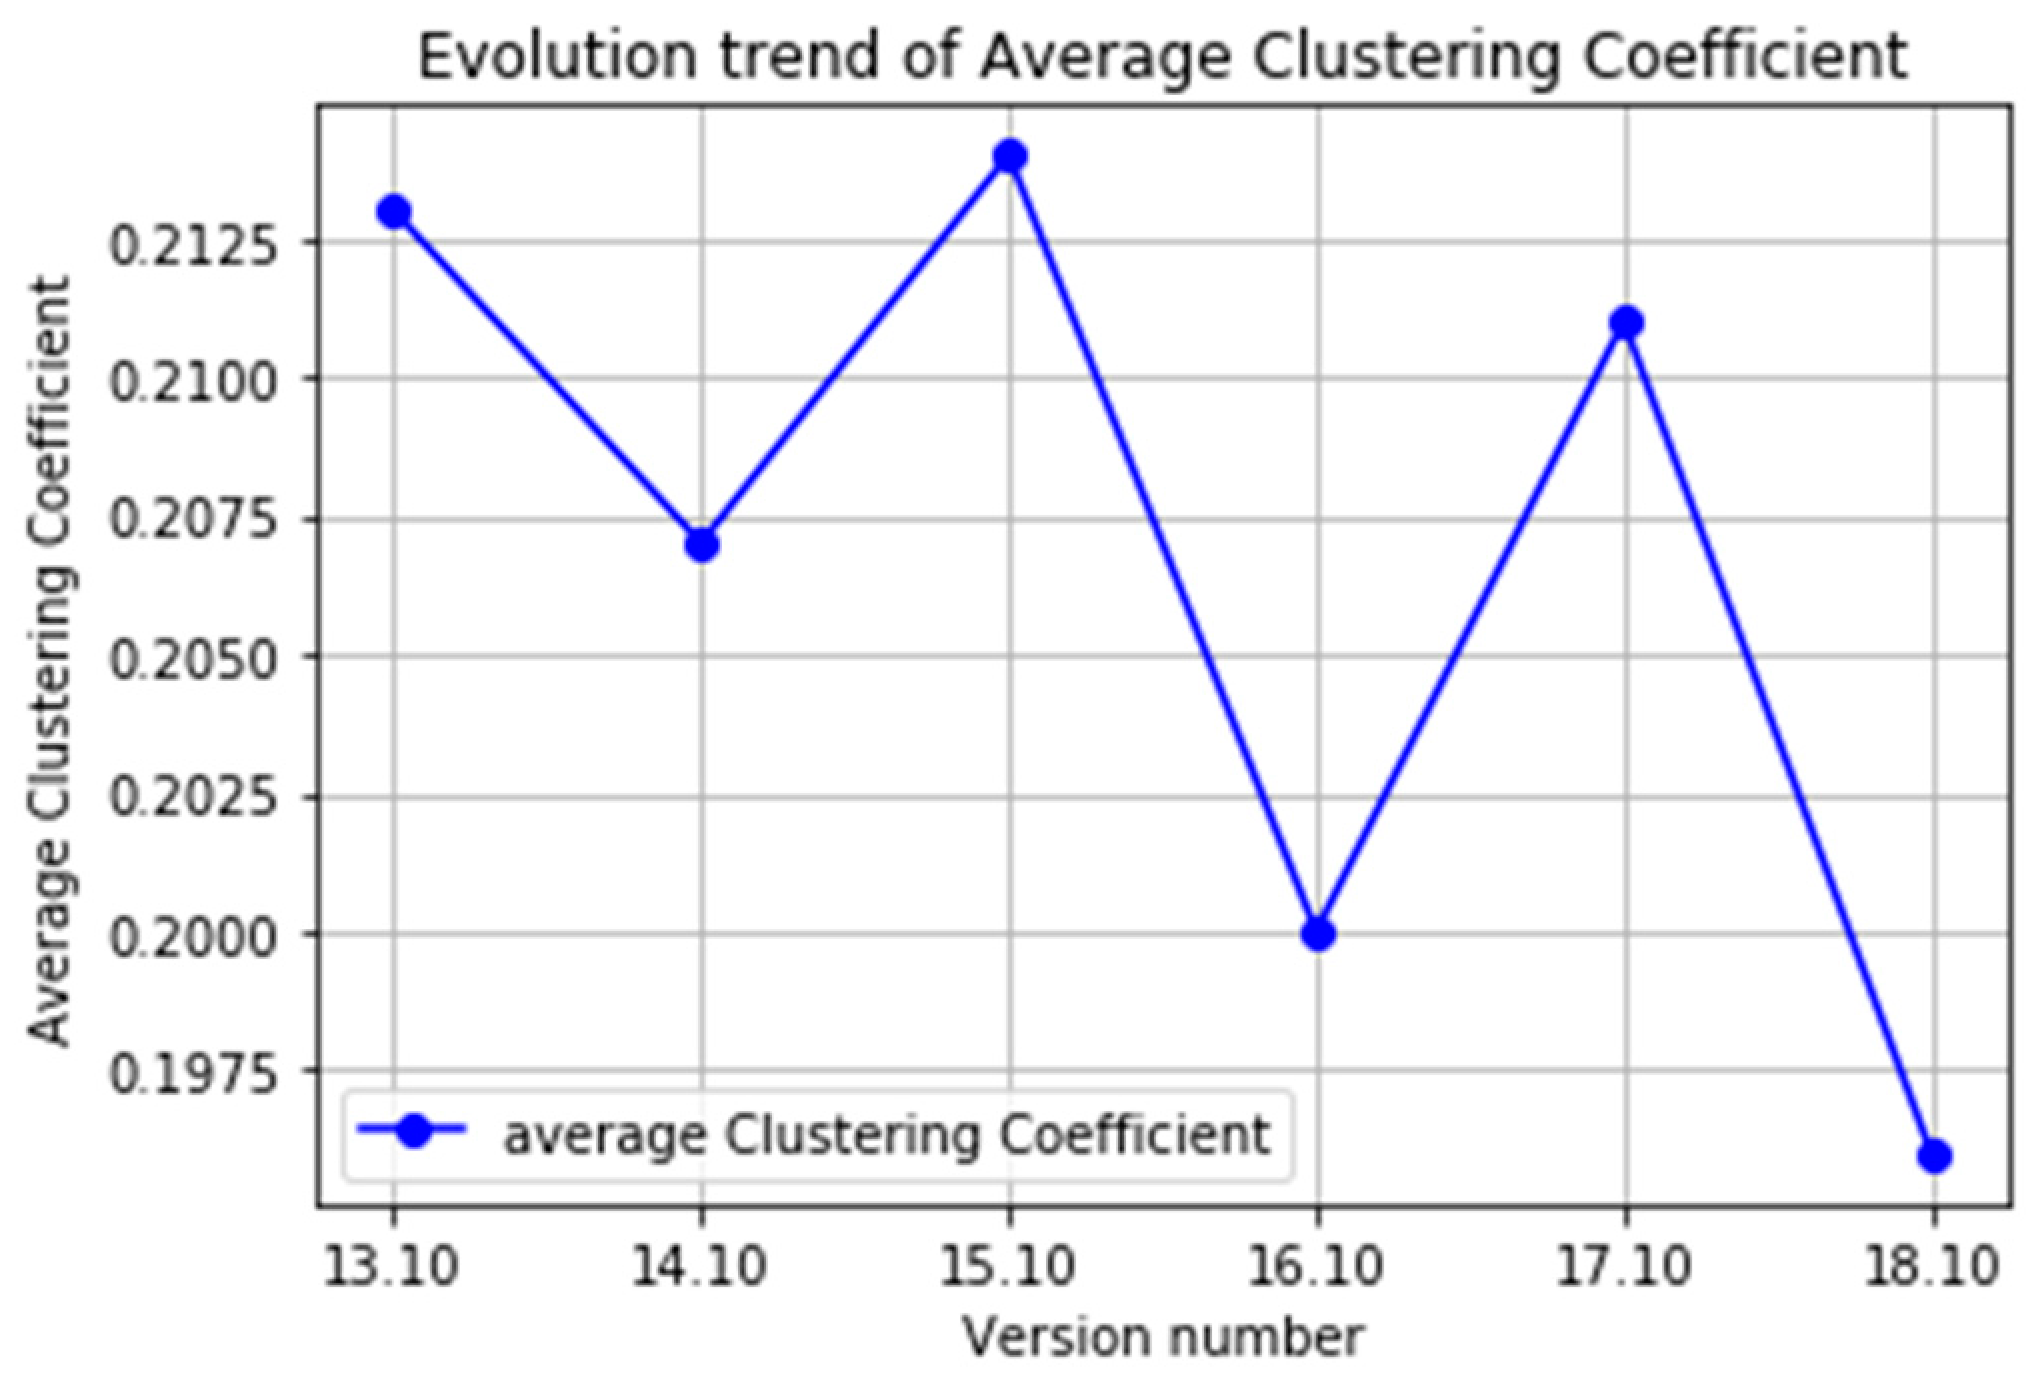
The average clustering coefficient describes the clustering of nodes in a network; in other words, how close the network is. The average clustering coefficient of the six operating system versions tested in this paper ranges from [0.196, 0.214], while that of a corresponding random graph is 0.003. That is, the average clustering coefficient of our operating system package dependency network is more than 65 times higher than that of a random network. This indicates that the dependency network is a high-clustering network, and that the packages in the network are closely related and cluster together. The average clustering coefficient distribution of each version of the software package dependency network is presented in
Figure 11.
Table 1 summarizes the descriptive statistics for the six versions of the software package dependency network [
30,
31].
It can be seen from the results of the above statistical analysis that, although the size of the network varies, the average shortest distance length of these networks is relatively small compared to their size. For example, in version 17.10, there are more than 2000 software packages, but the average shortest path length is less than 4; on the other hand, the average aggregation coefficient between nodes is much higher than that of a random network of the same size [
28]. This result suggests that these networks have “small world” characteristics. During the evolution of operating systems, the values of average path length are maintained at a steady level. This phenomenon indicates a proper coupling degree between packages. The degree of connection between software packages decreases, resulting in a reduction of the complexity of the internal structure. With the increase of software scale and the addition of new function packages, the complexity of software structure does not increase accordingly.
There are isolated nodes in all versions of the software dependency networks. These packages are simple and independent function software packages, such as rar software packages.
4. Analysis of Key Nodes in the Software Package Dependency Network
Mining the key nodes in the complex network and evaluating their importance can improve the overall performance and robustness of the system. In this paper, key nodes of the software package dependency network are defined as those software package nodes that can affect the stability of the entire network structure. The evaluation of key nodes in the network should be conducted via analysis of the local connection characteristics and the overall influence degree of the nodes. In this paper, node degree and betweenness centrality of the node are used to identify the key nodes of each version of the software package dependency network [
40,
41,
42,
43,
44,
45].
Table 2 presents the top 10 nodes with the highest out-degree for each version of the software package dependency network. As can be seen from the table, the software packages with high degrees of reuse in various versions of the operating system are relatively fixed; all of these are software libraries of the operating system or software packages providing graphical interfaces. C, C++, and Python are extensively used in writing package source code. Moreover, the increased out-degree of Perl packages in version 18.10 discloses a popularity increment of Perl language.
The in-degree of a node indicates the extent to which the node depends on other nodes; the higher the in-degree, the higher the extent of dependence on other nodes.
Table 3 specifies 10 nodes with the highest in-degree for each version of the software package dependency network. As can be observed in the table, most of the packages that rely heavily on other nodes are related to the desktop environment. The changes in the top 10 in-degree nodes also describe an evolution of the Ubuntu desktop environment, from GNOME to Unity to UKUI.
In-degree and out-degree are basic properties of nodes in a network, and can be wielded to explore key nodes from a connection point of view. In this paper, key nodes are analyzed from another perspective as well, namely in terms of the role of nodes in the network and the extent of their impact on the network. We utilize betweenness of a node to conduct the key node mining. Nodes in the network with heavy information load can be determined by using the index of betweenness: the more tasks on a node, the higher its betweenness value. If such a node loses its efficacy, this will have a significant negative impact on the whole software system. Thus, we can analyze the failure influence of a node on the whole system according to the betweenness value, providing guidance for system reconstruction and optimization. This kind of result is precisely what traditional software measurement methods cannot achieve.
For two nodes A and B in the network, there may be many shortest paths between them. The betweenness of one node in a network is considered to be high if many of the shortest paths between two nodes in the network go through it. Suppose
represents the number of shortest paths between vertex
and vertex
, while
represents the number of shortest paths passing through
. Accordingly, betweenness is defined as in Equation (7):
Table 4 lists the top 10 nodes with the highest betweenness for each version of the software package dependency network.
During the evolution of an operating system, the betweenness values of libgtk-3-0 and DPKG are always larger in each version. The greater the betweenness of a node, the greater the responsibility it has; in other words, the greater the impact of its failure on the system. Hence, the failure of the above software packages must be taken seriously. Otherwise, they are likely to cause large-scale system failure.
5. Conclusions
This paper studies the software package dependency network of open-source operating systems from the perspective of complex networks. Firstly, a directed software package dependency network model is proposed to describe the structure of the open-source operating system. Through research into the Ubuntu Kylin operating system, versions 13‒18, it is found that the open-source operating system software package dependency network has the characteristics of “small world” and “no scale” in terms of its structure. Moreover, the development of network structure is “orderly” in its evolutionary process. Network density decreases with the increase in scale, as does network cohesion. The network connectivity is very good, and the proportion of maximum connected slices exceeds 95%. The network has a small number of nodes with large degree values and a large number of nodes with small degree values. Finally, a measure of key nodes, namely betweenness centrality, is proposed to identify key nodes in the open-source operating system software package.
Software evolution, a process of software updating and changing, is one of the essential characteristics of software. By observing the structural characteristics during evolution, the quality of the new version of the software caused by different structural characteristics can be found out, as well as the rules of how they evolve. This information is useful for understanding the unfolding nature of software and provides a reference for software version upgrade so as to guarantee a proper iterative development and quality control. In addition, this study provides guidance for designing a software structure with higher fault tolerance and robustness, avoiding the premature end of the software life cycle.


