Article

Multi-Objective Parameter Optimization for Disc Milling Process of Titanium Alloy Blisk Channels

The Key Laboratory of Contemporary Design and Integrated Manufacturing Technology, Ministry of Education, Northwestern Polytechnical University, Xi’an 710072, China
*
Author to whom correspondence should be addressed.
Symmetry 2019, 11(2), 173; https://doi.org/10.3390/sym11020173
Submission received: 31 December 2018 / Revised: 24 January 2019 / Accepted: 24 January 2019 / Published: 1 February 2019

Abstract

:
The blisk has been widely used in modern high performance aero-engines of high thrust-weight ratio. Disc milling process provides a reliable way to improve the efficiency of the blisk milling. The process parameters of disc milling have crucial effects on the milling efficiency and physical property of blisk. In this paper, material removal rate, cutter life and thickness of residual stress layer are regarded as optimization targets the key process parameters such as spindle speed, cutting depth and feed speed are optimized. Based on the grey relational analysis, the multi-objective optimization problem is transformed into a single objective optimization problem. At the same time, the problem of non-symmetry influence of key process parameters on optimization targets can be solved. And the influence weight of material removal rate, cutter life and thickness of residual stress layer on the grey relational grade (GRG) are calculated according to principal component analysis. The second order prediction model of GRA is developed by response surface method. On the basis of verifying the accuracy of the model, the influence mechanism of the process parameters coupling on the gray correlation degree is analyzed the optimal process parameter combination is obtained as spindle speed with 81.92 rpm, cutting depth with 5.88 mm and feed rate with 66.0823 mm/min. The experimental research show that the optimal process parameter combination can effectively improve the material removal rate and cutter life and reduce the thickness of residual stress layer.

1. Introduction

The blisk is a new-style key component of aero-engines, which rotor blade is integrated with the wheel disc. Compared to traditional blades and disk systems, the blisk has more advantages, including the lower weight, simple structure, higher reliability, long-service life and excellent reliability [1,2,3]. Therefore, the blisk has been widely utilized for modern high performance aero-engines. The blisk is usually fabricated by titanium alloy or high temperature alloy [4,5]. At present, the main processing technology of blisk-tunnel is the Computerized Numerical Control (CNC) milling, such as side milling or insert milling. However, these methods have low efficiencies, severe tool-wear and high manufacturing costs. Recently, a new-type tool namely disc milling cutter is employed to machine aero-engine blisk-tunnels for its higher efficiency and reliability. The process parameters of disc milling have crucial effects on the mechanical performance and physical property of blisk. Meanwhile, the reasonable parameters combination will not only help to improve the physical performance of products also be beneficial to increase the mechanical properties. During the disc milling process, the main process parameters involve spindle speed, cutting depth and feed speed. And the performance evaluation indexes of disc milling process include material removal rate, cutter life and thickness of residual stress layer. Usually, the workpiece and fixture are changeless for disc milling process the optimization of the cutter structure or machine tool will be inadvisable. Nevertheless, it is feasible to optimize the process parameters for obtaining the better cutting effect.
For the past few years, many scholars have devoted themselves to study the machining process of titanium alloy blisk channels. According to the study of Z.Y. Xu et al. [6], a high efficiency electrochemical machining method was provided to produce three channels at one time. Three stainless steel tools move towards workpiece parts with space trajectories, which were optimized considering the shapes of channel profiles and the distribution of electrochemical machining lateral gap. Similarly, to improve the process stability and the efficiency of blisk cascade passages, electrochemical machining with a radial feeding electrode, a rational electrolyte flow mode for electrochemical machining called “Π shape flow mode” was discussed in the paper Zhengyang Xu et al. [7]. Because of its materials belonging to difficult-to-machine materials and complex structure, the manufacture of blisk is difficult. Cheng et al. [5] established the mathematical model of the geometric angle influencing the cutting effect modeled the main structures of tool. Then dynamic simulation analysis of the designed disk milling tool was carried out to optimize the structure of tool by comparing the change of stress, total deformation main cutting force. From the study of Qu et al. [8], progressive-pressure electrolyte flow was employed to improve efficiency and accuracy of radial electrochemical machining of blisk channels. Flow field simulation indicated that the progressive-pressure flow provided a high electrolyte flow rate in the inter-electrode gap allowed a high cathode feed rate without shortcut. Liu et al. [9] held the view that the key of electrical discharge machining for integral shrouded blisks is to search an interference-free and optimized electrode feeding path. In their paper, a new electrode feeding path searching method called tangent tracking was proposed. Based on the dynamic programming methodology, the electrode feeding path searching process was decomposed into a number of electrode attitude optimization subproblems. In multi-axis plunge milling, cutting parameters are usually determined conservatively as constants to prevent excessive cutting forces and unexpected tool breakage. To address this issue, Liang [10] and his collaborators proposed an original approach to schedule the feed rate in multi-axis plunge milling of open blisks based on material removal rate. When a cutter feeds in the tool axis direction, the contacting area of cutter bottom and uncut material varied with the feeding depth. A current technique challenge was to calculate the tool orientation and locations (called plunger paths) in four-axis rough plunging of open blisks, so that the residual raw material left on the blades after roughing was closed to the specified value [11]. Klocke et al. [12] presented a multi-criteria assessment approach to deal with turbine disc slotting process. Based on data gathered with an aero engine OEM, the assessment included economical, ecological, flexibility and productivity criteria. Meng et al. [13] proposed a new method to select an optimal barrel cutter in the interest of the high productivity in the CNC machining of blisk. The tool shaft diameter was optimized to improve tool rigidity and avoid the global interferences between the tool shaft and the adjacent blades. In order to enhance the machining quality, stability, consistency some mechanical properties of the blisk surface, Zhao et al. [14] designed a novel pneumatic flexible grinding head. Based on extended state observer, an adaptive sliding mode control was employed to estimate the system state variables. Meanwhile, according to their report [15], a powerful and composite processing method was proposed, the structure of disc milling head with high stiffness and high precision was designed, including mechanical transmission, electrical system, rotating control, locking device tool changer.
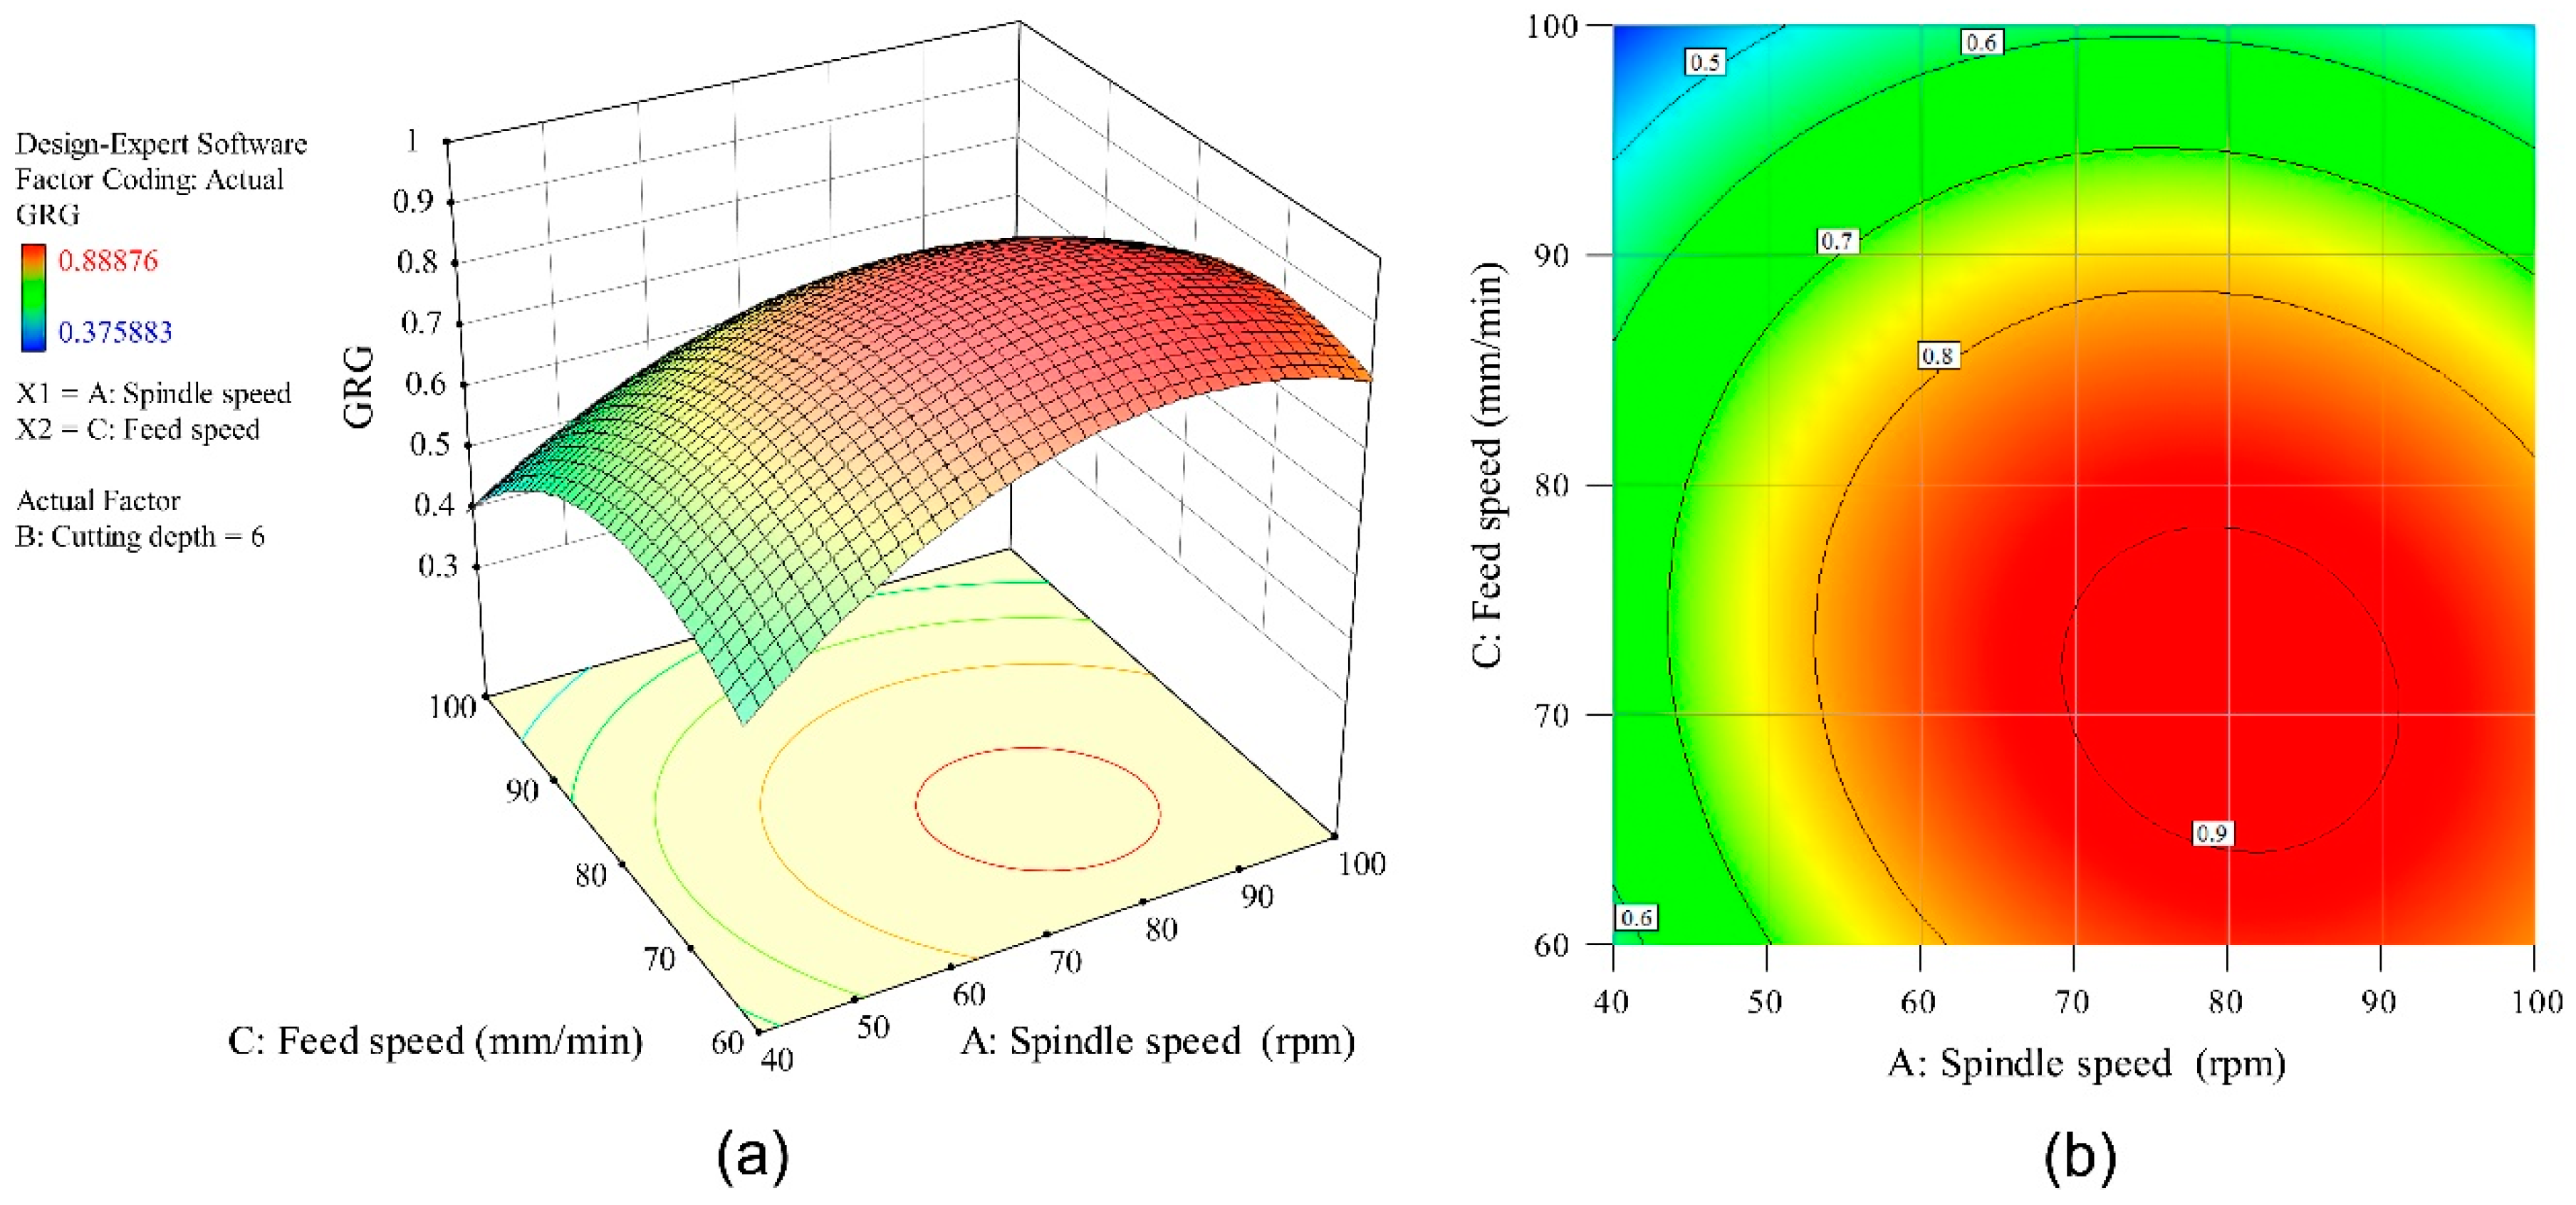
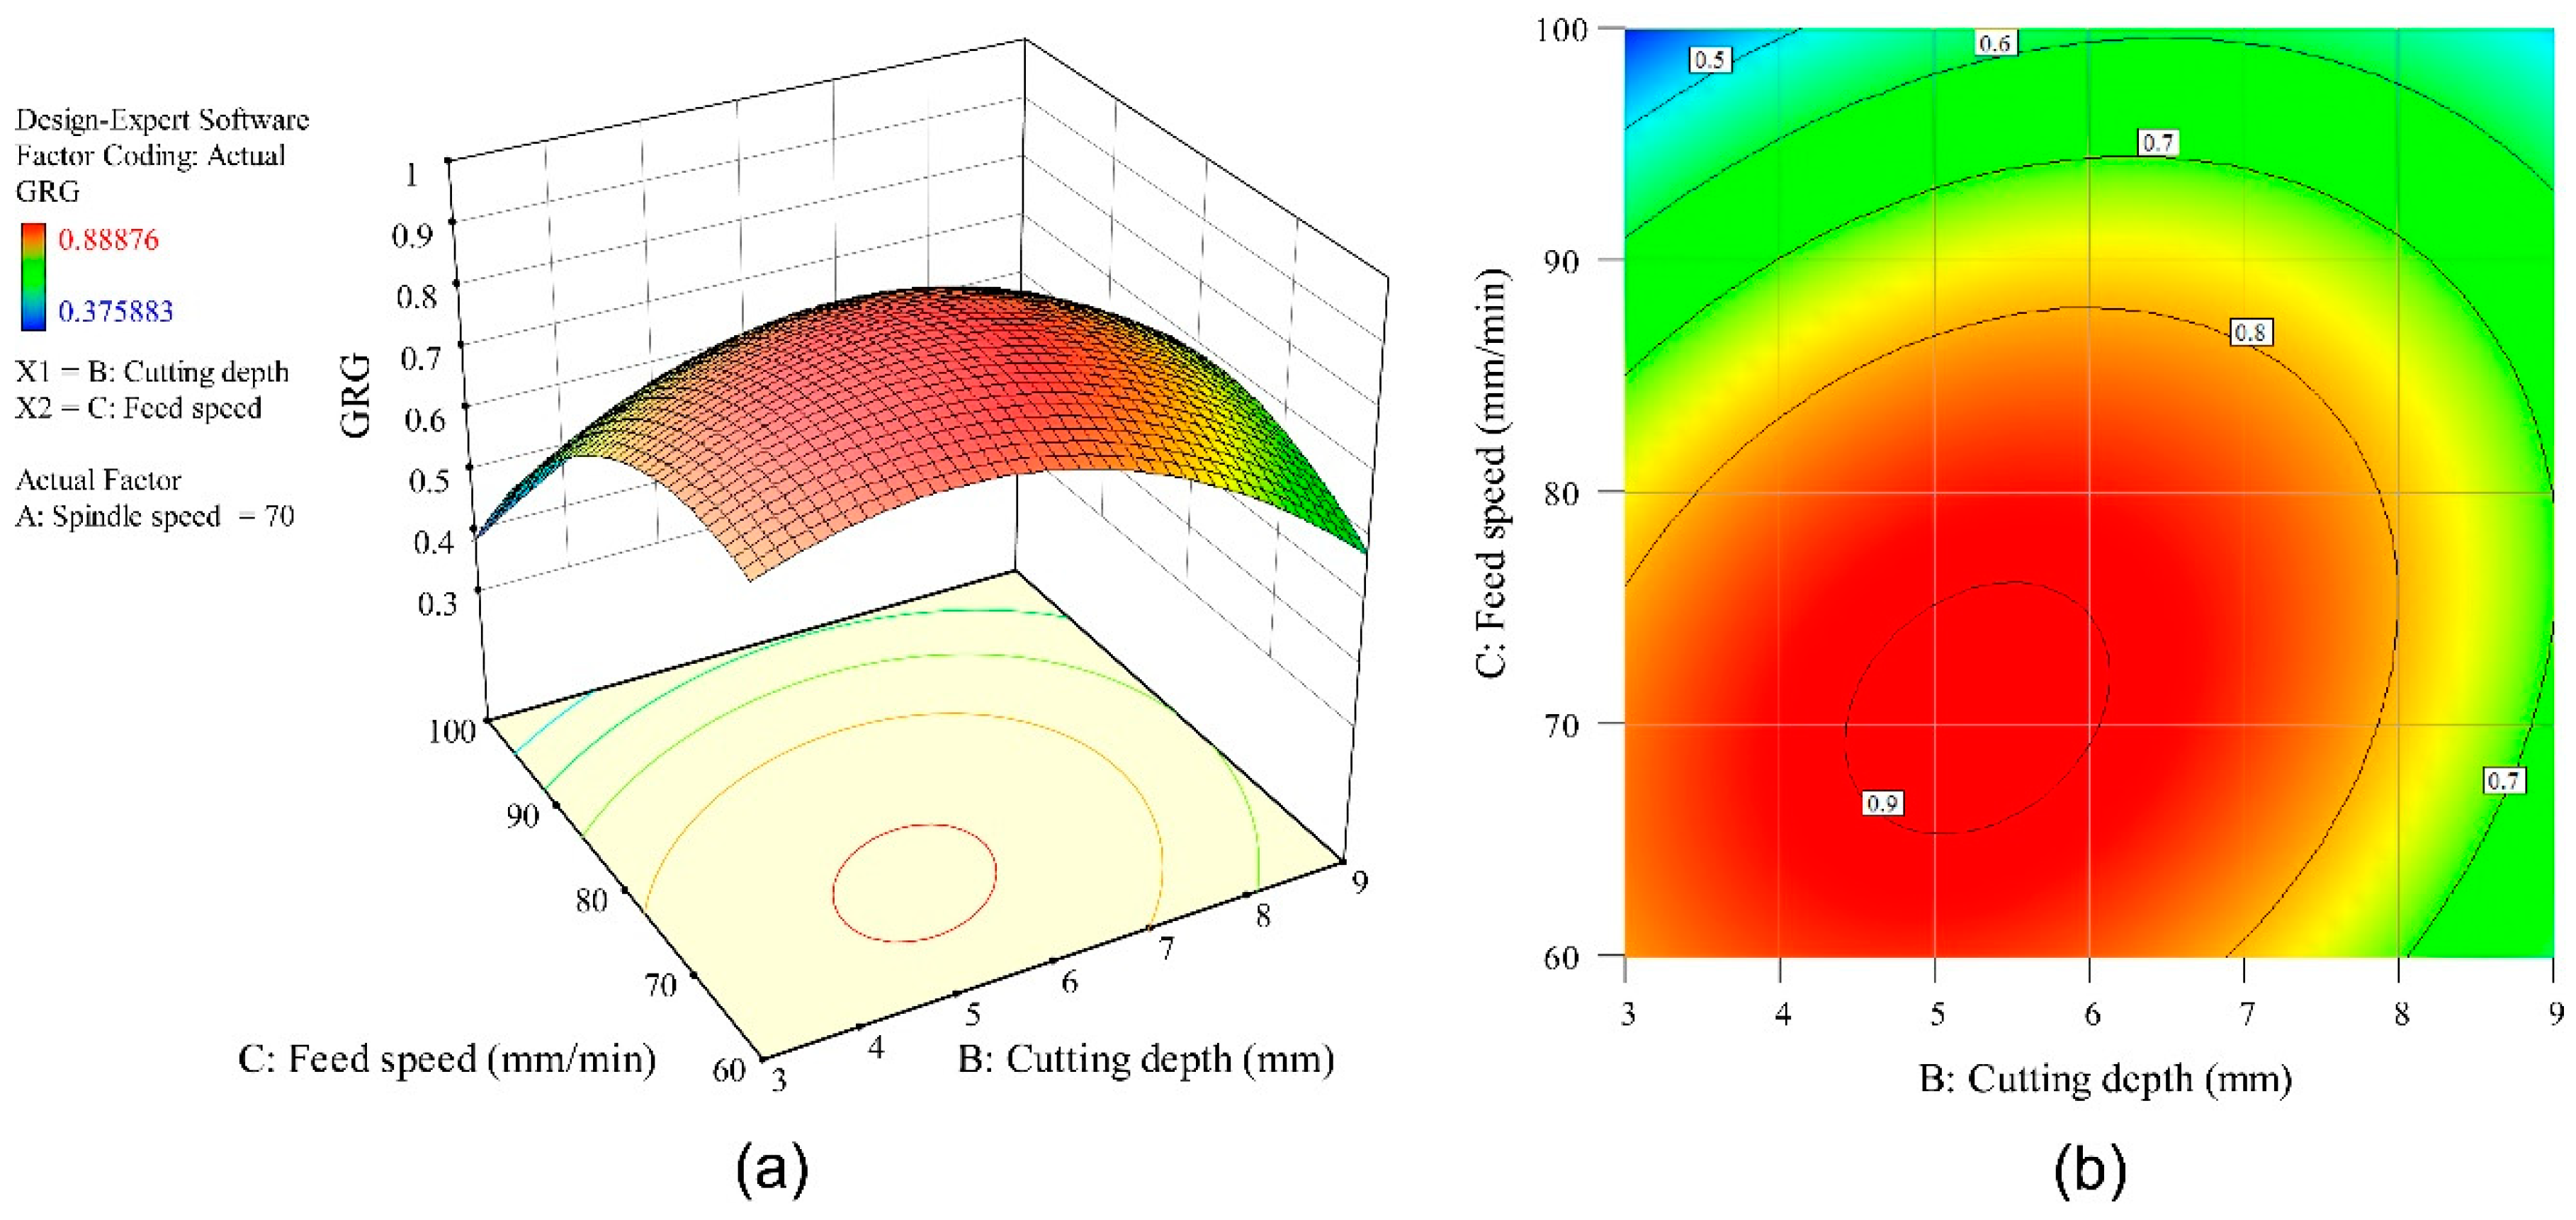
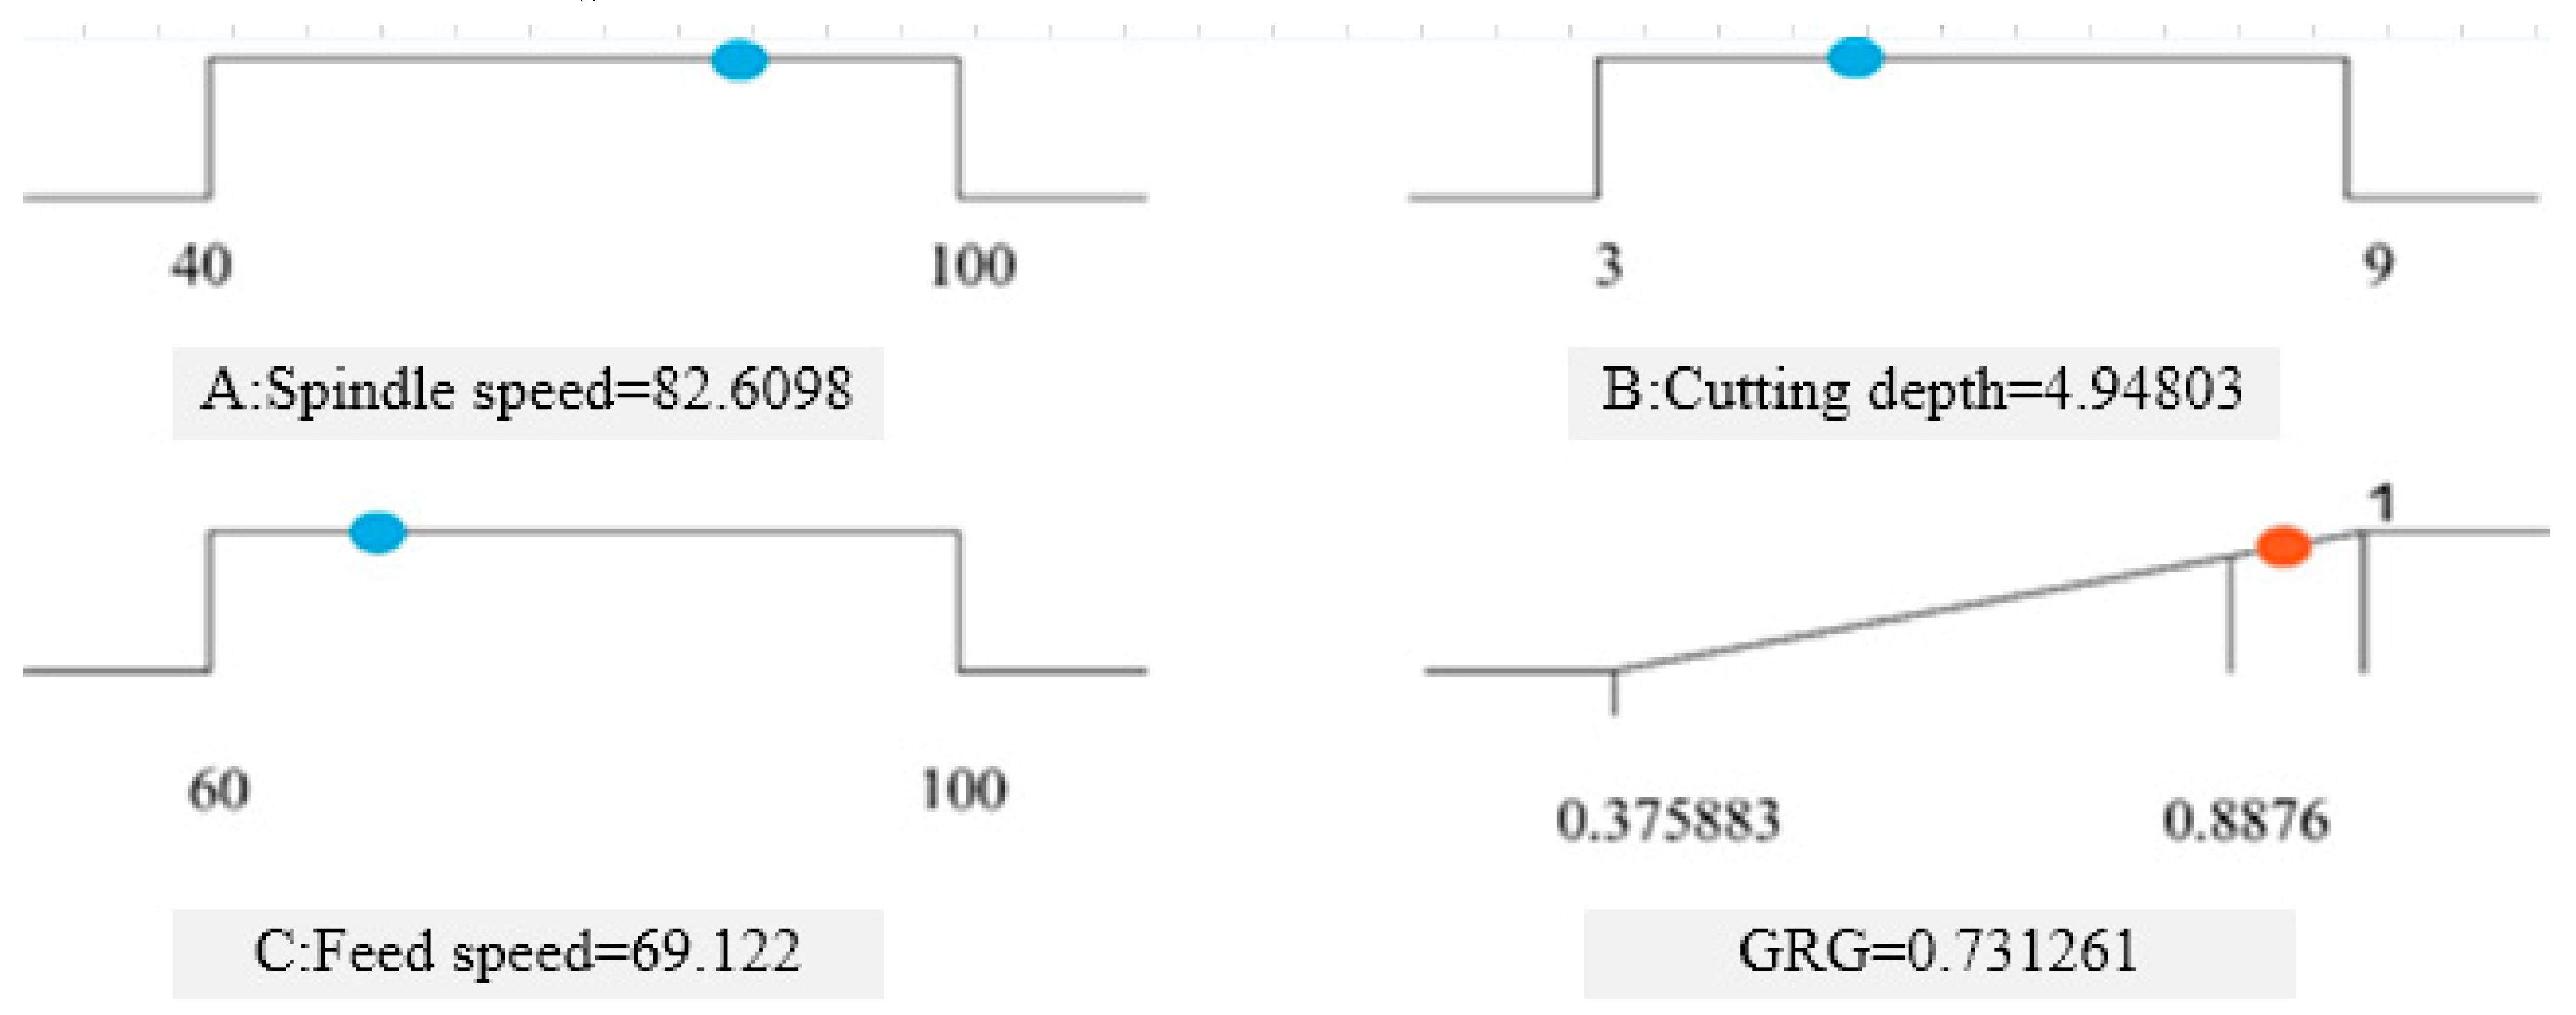
According to the above research, investigators focused on the disc milling process, such as cutting force modeling and performance control. And disc milling process parameters analysis has also attracted some scholars. The disc milling process of titanium alloy blisk channels is a multi-parameters and multi-response process. To investigate the disc milling process, a method coupling grey relational analysis and response surface technology is proposed in this paper. Finally, an optimal technical parameter combination was chosen to obtain the better processing efficiency and product quality.

2. Experiment Procedure

In the fabrication process of blisk, some prominent disadvantages such as low efficiency, low precision and high cost seriously hinder the development of aviation manufacturing. A high-efficiency and powerful compound milling process, namely, disc milling-plunge milling-side combined milling machining technology is provided to solve these problems. On this basis, the equipment which integrates the processes of disc milling, plunge milling and side milling into one machine has been developed, as shown in Figure 1. Firstly, the blisk channel is grooved using the disc milling process for the advantage of high cutting efficiency. The disc milling process can remove material as much as possible. Then, for the unreachable area (cutting interference area) in the disc milling process, the plunge milling process is applied to enlarging slot and forming surface. Finally, in order to complete the work of edge removal and burrs cleaning, the cylindrical milling cutter or a ball-end milling cutter is employed to side milling the blisk. During the machining process, the disc milling and plunge milling stages belong to highly efficient and powerful cutting operation process. Meanwhile, the side milling stage is a finish machining process. The disc milling process, as a significant process for blisk manufacturing processing, needs to be further researched in-depth. This paper will mainly focus on the modeling and analysis of the disc milling process with a view to obtaining the better working efficiency.

2.1. Experiment Design

In order to investigate the effect of various factors on assessment objectives, the main composition of process parameters and level should be determined firstly. In the blisk disc milling process, process parameters involving spindle speed, cutting depth and feed speed are selected as the independent variables. Meanwhile, material removal rate, cutter life and metamorphic thickness are tested separately as the dependent variables. According to the parameters of disc cutter and CNC milling machine tools, spindle speed, cutting depth and feed speed are generally constrained in the range of 30–120 rpm, 2–12 mm, 40–120 mm/min. In the ideal state, the higher the material removal rate, the longer the tool life and the thinner the residual stress layer are the objectives of the disc milling process. In the experiment, the variable range of each process parameter is set based on the engineering practice. Moreover, the orthogonal test including three factors and three levels is designed as shown in Table 1.

2.2. Material and Equipment

Due to the great mechanical properties like high strength and low thermal conductivity, the titanium alloy TC4 has been widely used to manufacture advanced blisk products. Hence, the TC4 is adopted as the experimental material in blisk disk milling process. Before the experiment starts, the TC4 material need to be heat-treated and forged at high temperature so that the sample is with a hardness of 33–35HV. And the sample dimensions are the length with 120 ± 0.1 mm, width with 60 ± 0.1 mm and height with 15 ± 0.1 mm. The main chemical compositions of TC4 are shown in Table 2.
In order to guarantee the success of experiment, the CNC Milling Machine QJK006 produced by the Northwestern Polytechnical University is employed to machine the titanium alloy blisk, as shown in Figure 2. In the experimental investigation, the integral staggered teeth three-sided disc cutter manufactured by Zhuzhou cemented carbide cutting tools, LTD is used to cut specimens. The material of the cutter is cemented carbide YG6 with a 94% of wolfram carbide (WC) and 4% of cobalt (Co). The size of the cutter is 200 mm in width and 20 mm in thickness. The hook angle and relief angle are 5° and 4°, respectively. And the tool cutting edge inclination of main cutting edge and tool minor cutting edge are 15° and 12°, respectively. The circular arc radius of tool nose is 1 mm.

2.3. Measurement Method

2.3.1. Material Removal Rate

The material removal rate is the volume of metal removed in a form of cutting per unit time. Meanwhile, it can be defined by the distance which milling cutter (or workpiece) moves in the direction of feeding in unit time. The schematic diagram for the material removal operation of disc milling process is provided in Figure 3. Therefore, the material removal rate of disc milling process can be given as
Q = v f × a p × a e 1000 ,
where Q denotes the material removal rate; vf is the feed speed; ae and ap are the cutting depth and the cutting thickness, respectively. In the experiment, the depth of disk milling cutter was 20 mm.

2.3.2. Cutter Life

In the experiment, the maximum wear value of the flank face was employed to evaluate the degree of tool wear. When the length of the milling reaches 60 mm, then the cutter would be placed under the surface quality measuring instrument to obtain the wear value of the flank face. When more than three cutter teeth have an abrasion loss more than 0.3 mm, the disc milling cutter would be considered as losing the cutting function. Then the test should be stopped. For the reason that the high cost of disc milling cutters and the limited number of cutters in the tests, the times of cutter sharpening was not considered when measuring the tool life.

2.3.3. Metamorphic Thickness

In the experiments, the thickness of residual stress layer is selected as the evaluation index for the metamorphic layers. The electrochemical etching method is used to measure the surface residual stress. At first, the milling surface is electrolytic corrosion stripped by electrolysis polishing machine, lasting about 15 sec. The thickness of each stripped layer is approximately 10~20 μm. After each layer is peeled, the milling surface of TC4 should be check the residual stress using the LXRD MG system. Repeat the above steps until the measured value of residual stress is 0.

3. Multi-Objective Optimization Method

For the disc milling process of titanium alloy blisk channels is a multi-parameters and multi-response process. This article presented an integrated solution uniting the grey relational analysis and the response surface method to optimize the disc milling process. Firstly, the grey relational analysis is a measurement method to determine the degree of approximation among the sequences with the help of grey relational grade (GRG). It can create discrete sequences for the correlation analysis of such sequences with processing uncertainty, multi-factors and discrete data [16,17]. Secondly, the response surface method is a collection of powerful mathematical and statistical methods for developing and optimizing models. The response surface method is successfully poured into the special cases where multiple input variables affect performance index or quality characteristics of the process [18,19,20].
In the first place, we choose to compute the S/N ratio of data sequence to improve efficiency and reliability the counting process. The S/N ratio is defined as the ratio of signal power to the noise power, often expressed in decibels. In the disc milling process, a large value of material removal rate and cutter life are expected; while the lower value of the metamorphic thickness, the preferable performance of products. Thus, the S/N ratio of the material removal rate and cutter life can be given as
η Q = 10 log 10 ( 1 N i = 1 N 1 Q i 2 ) ( i = 1 , 2 , , N ) ,
η T = 10 log 10 ( 1 N i = 1 N T i 2 ) ( i = 1 , 2 , , N ) ,
where Qi and Ti are the values of material removal rate and cutter life for the ith result in N tests, respectively; ηTS and ηVC are the corresponding S/N ratio value of the material removal rate and cutter life, respectively. And the S/N ratio of the metamorphic thickness can be described as
η H = 10 log 10 ( 1 N i = 1 N H i 2 ) ( i = 1 , 2 , , N ) ,
where Hi denotes the values of metamorphic thickness for the ith result in N tests; ηH is the corresponding S/N ratio value of the metamorphic thickness.
Thereafter, the multi-objective optimization process is displayed as follows:
Step 1: Grey relational generation. If the expectancy is larger-the-better or the smaller the better, then the normalized value of grey relation can be described as:
η H = 10 log 10 ( 1 N i = 1 N H i 2 ) ( i = 1 , 2 , , N ) ,
where x i ( k ) is the normalized value of the ith value in the kth data sequence; x i 0 ( k ) is the original result of the ith value in the kth data sequence; i = 1,2,…,m, m is the number of component in data sequence; k = 1,2,…,n, n is equal to the number of data sequence.
Step 2: Calculating the grey relational coefficient. Grey relational coefficient for all the sequences expresses the relationship between the ideal (best) and actual arrays. The grey relational coefficient can be defined as follows:
γ ( x 0 ( k ) , x i ( k ) ) = Δ min + ξ Δ max Δ 0 i ( k ) + ξ Δ max ,
where 0 < γ ( x 0 ( k ) , x i ( k ) ) 1 , is the reference sequence and x i ( k ) is the comparability sequence; ξ is the distinguishing coefficient, ξ [ 0 , 1 ] , usually ξ = 0.5 ; Δ 0 i ( k ) is the deviation sequence of x 0 ( k ) and x i ( k ) , that is Δ 0 i ( k ) = | x i ( k ) x 0 ( k ) | ; furthermore, Δ min = min i min k Δ 0 i ( k ) , Δ max = max i max k Δ 0 i ( k ) .
Step 3: Determination the weight value of response variables. In the article, we applied principal component analysis to calculate the contributions of each objective. The principal component analysis is widely used to reduce the dimensionality of a dataset, while preserving as much ‘variability’ (i.e., statistical information) as possible. At first, calculating the correlation coefficient matrix utilizing Formula (7).
R j l = [ C o v ( x i ( j ) , x i ( l ) ) σ x i ( j ) × σ x i ( l ) ] ,
where C o v ( x i ( j ) , x i ( l ) ) denotes the covariance between x i ( j ) and x i ( l ) , j , l = 1 , 2 , , n ; σ x i ( j ) and σ x i ( l ) are the standard deviation of x i ( j ) and x i ( l ) , respectively. Then calculating the eigenvalue and eigenvector by solving the characteristic Equation (8). The eigenvalue λ k can be obtained, k = 1 , 2 , , n . Then the value of λ k are sorted from largest to smallest, that is, λ 1 λ 2 λ n 0 . I is the unit matrix.
[ λ k I m R ] = 0 ,
Finally, the influence weight of each responses is calculated using formula (9). αk is the contribution rate of each component.
α k = λ k i = 1 n λ i ,
Step 4: Calculating the grey relational grade. The grey relational grade expresses the level of correlation between the reference and comparability sequences. Hence, the higher grey relational grade signifies that the corresponding parameter combination is more excellent than others. Therefore, the grey relational grade is a weighted sum of the Grey relational coefficients is calculated as follows:
γ ( x 0 , x i ) = k = 1 n β k γ ( x 0 ( k ) , x i ( k ) ) ( k = 1 ~ n ) ,
where γ ( x 0 , x i ) denotes the grey relational grade; βk is the weight value of the kth response variable which is ensured by using principal component analysis.
Step 5: Establishing the process model. The response surface analysis was employed to establish the quadratic model between the process parameters and the grey relational grade. Meanwhile, a series of experiments were performed to verify the effectiveness and predictive accuracy of established model.
Step 6: Optimizing the grey relational grade model. Recognize the optimal parameters combination for the grey relational grade from the desirability analysis.
Step 7: Conduct the verification experiment. Use the optimal parameters combination to carry out the experiment and the result would be applied to compare with the initial factor setting.

4. Results and Discusses

The testing data results including material removal rate (Q), cutter life (T) and metamorphic thickness (Hs) are gathered together as shown in the Table 3. In the table, nr denotes the spindle speed, ap denotes the cutting depth and vf denotes the feed speed. For material removal rate, the maximum and minimum values are 18.7 and 3.5 mm3/min, respectively. For cutter life, the maximum and minimum values are 21.7 and 9.1 min, respectively. At last, for the metamorphic thickness, the maximum and minimum values are 282.1 and 216.2 µm, respectively. The results of S/N ratio are also provided in Table 3. For material removal rate, the maximum and minimum S/N ratio values are 25.4368 and 10.8814, respectively. Then for cutter life, the maximum and minimum S/N ratio values are 26.7292 and 19.1808, respectively. For metamorphic thickness, the maximum and minimum S/N ratio values are −46.7092 and −49.1607, respectively.

4.1. Grey Relational Grade Results

Table 4 provides the results of principal component analysis for weight values. According to principal component analysis, the contribution rate of material removal rate is 55.58% which means the material removal rate has a significant influence on the disc milling process. The contribution rate of cutter life and metamorphic thickness are 36.71% and 7.71%, respectively. So the material removal rate is the first principal component, following by cutter life and metamorphic thickness. Thereafter, the deviation sequence Δ 0 i ( k ) , the deviation sequence of x 0 ( k ) and x i ( k ) , were calculated as shown in Table 5. With the help of Formula (5), the grey relational coefficient were obtained. Then the results of grey relational grade, as shown in Table 5, were calculated based on the Formula (6). According to the table, the maximum grey relational grade values is 0.8888 and minimum is 0.3759. The result reveals that the combination with spindle speed of 70 rpm, cutting depth of 6 mm and feed speed of 80 mm/min are the best parameters set. Meanwhile, spindle speed of 40 rpm, cutting depth of 6 mm and feed speed of 100 mm/min are the worst parameters combination.

4.2. Establishment of the Model

Material removal rate and tool life and residual stress layer are three significant performance indexes for the disc milling process. These three indexes will be combined to evaluate the disc milling process. For the uncertainty of the disc milling process, an ideal and accurate model describing the objective law between the disc milling process and technological parameters has not been established. Meanwhile, almost any type of function can be approximated by polynomial. To reduce the cost of computing, in practice, the second order polynomial regression is usually applied to simulate and analyze a complex system.
The response surface analysis method was applied to reveal the changing rule of the material removal rate, cutter life and metamorphic thickness of the disc milling process. In this paper, we used the second order polynomial regression to simulate and analyze the multi-factor and multi-response problem. Meanwhile, the backward elimination method was applied to exclude the unimportant projects and adjust the fitted the second order polynomial regression model. All the works were implemented on the Design Expert 10. The polynomial regression model about the effect of process parameters on grey relational grade are given as:
y G R G = f ( x 1 , x 2 , , x n ) = α 0 + i = 1 n α i x i + i = 1 n j = i + 1 n α i j x i x j + i = 0 n α i i x i 2 ,
where yGRG are grey relational grade model; xi is the ith milling process parameters, αi are the polynomial coefficients.
The study of disc milling process parameters optimization will be based on the polynomial regression model. According to the response surface analysis, the grey relational grade model was:
y G R G = f ( n , a p , v f ) = 2.7099 + 3.5407 × 10 2 n + 0.1219 a p + 5.4425 × 10 2 v f 6.7003 × 10 4 n a p 6.6645 × 10 5 n v f + 1.3617 × 10 4 a p v f 1.6633 × 10 5 n 2 1.6232 × 10 2 a p 2 4.0259 × 10 4 v f 2
To analyze the effect of each technology parameter on the grey relational grade, analysis of variance (ANOVA) was carried out based on the response surface design software. The results of ANOVA is displayed in Table 6. According to the ANOVA, the F value is a major technical index to reveal the influence degree of each independent variable on the response value. Generally speaking, a large F value means that the corresponding variable has a significant impact on the target. As shown in Table 6, the F value of created model is 215.11, much larger than the benchmark value F0.05 (9, 7) = 3.677, which implied the model was significant. Value of ‘Prob > F’ less than 0.05 indicates the corresponding model term is significant. In this case, A, B, C, AB, AC, BC, A^2, B^2, C^2 were all the significant model terms. Here, A, B, C denoted the spindle speed, cutting depth and feed speed, respectively. The F value of ‘Lack of Fit’ 3.94, implied the lack of fit terms were not significant comparing to the pure error. The ‘Prob > F’ value of ‘Lack of Fit’ 0.1093, more than 0.05 indicates the third or higher order model term is not significant. Therefore, the second order polynomial regression can be adequately used to simulate and analyze the multi-factor problem.
Meanwhile, the residual analysis was applied to analyze the reliability of developed model. According to the normal distribution diagram, the residuals scatter shows a linear distribution along a straight line indicating that the fitted model for grey relational grade was dependable, just as shown in Figure 4a. We can also see that the residuals scatter shows marked irregularity from residual operation diagram from Figure 4b. Figure 5 provides the comparison between the calculated and predicted value of the grey relational grade. The max error was less than 5% meaning that the developed model was reasonable for disc milling process. Accordingly, the developed second order polynomial regression model could be used to predict the grey relational grade.

4.3. Coupling Effect of Process Parameters

Although we can get the best choice of process parameters through the empirical model, the coupling effect between the parameters on the grey relational grade should not be ignored. The coupling effect of process parameters on the grey relational grade were analyzed based on the response surface design software Design Expert 10. Figure 6 shows the coupling effect of spindle speed and cutting depth on the grey relational grade. Both the response surface map and the contour lines map are provided in the picture. It can be seen that the grey relational grade value in this figure, on the whole, is not very high. Meanwhile, the highest value of response surface does not exceed 0.8. When both the spindle speed and cutting depth are low, the value of grey relational grade is the smallest. At this time, the entire disc milling process has the lowest efficiency that is, the material removal rate is the lowest. As the spindle speed increases, the grey relational grade increases at first and then decreases. Similarly, the grey relational grade increases at first and then decreases as the cutting depth increases. The whole disc milling process is smooth and stable, indicating that the optimal target value appears near the middle of each parameter range. In the picture, the ideal grey relational grade appears in the area of 70~90 rpm for spindle speed and 4~7 mm for cutting depth.
According to the Figure 7, it is obvious that the value grey relational grade are greatly affected by the feed speed changing. The ideal grey relational grade appears in the area of 70~90 rpm for spindle speed and 65~85 mm/min for feed speed. Comparing to Figure 6, the grey relational grade have a higher value for the reason that the response surface has a large range of high-value color regions in picture 7. Meanwhile, the highest value of response surface locates nearby the 0.88876. When both the spindle speed and cutting depth are low, the value of grey relational grade is the smallest. The value of grey relational grade decreases sharply as the feed rate increases. In contrast, the grey correlation is not very sensitive to the changing of spindle speed.
Figure 8 shows the response surface map and the contour lines map for the coupling effect of cutting depth and feed speed on the grey relational grade. Throughout the whole picture, the grey relational grade have a high value. When the cutting depth is low, the grey relational grade decreases sharply with the increase of the feed speed. However, when the cutting depth is high, the grey relational grade is not very sensitive to the changing of feed speed. When the value of feed speed is relatively high, the grey relational grade always keep the low value with the increase of the cutting depth. The highest value of grey relational grade locates in the area of 4.5~6 mm for cutting depth and 65~75 mm/min for feed speed. Meanwhile, the lowest value of response surface locates nearby the 0.375883.

4.4. Predicting the Optimal GRG

To find the maximum grey relational grade value between 0.375883 and 1, the optimization module of Design-Expert software was utilized to analyze the grey relational grade values. The best parameter combination and excellent desirability value would be regarded as the optimum condition for the objective. The desirability values for the objective is displayed in Figure 9. And the big dot from each ramp denotes the level of the parameters setting. According to the response surface analysis results, 28 sets of optimal solutions were derived for the grey relational grade. Ultimately, the optimal parameter combination was chosen as spindle speed with 82.6098 rpm, cutting depth with 4.94803 mm and feed speed with 69.122 mm/min, as shown in Figure 9. Meanwhile, the desirability value 0.897 made clear that the target values and the responses had a relative high degree of tightness. In addition, the predicted grey relational grade value was 0.935502 which exceeded all the 17 sets of initial experiments.

4.5. Experiment Verification

Although the optimal parameter combination had been provided by the response surface method, the authors must also carry out a confirmation test to validate the effectiveness and reliability of developed results. As the grey relational grade value 0.8888 is the largest one in the test terms. In order to evaluate the optimization results, the 7th experiment item, spindle speed of 70 rpm, cutting depth of 6 mm and feed speed of 80 mm/min, was selected as the initial process condition setting. And then the optimized parameters combination was applied to carry out the comparison experiment. As shown in Table 7, material removal rate and cutter life is 20.5 mm3/min and 22.7min, which is 2.3 mm3/min and 3.1 min increased compared with the values before optimization, respectively. Meanwhile, the thickness of residual stress layer is 218.4µm, which is 12.5 µm decreased compared with the value before optimization. At last, the value of GRG was increased from 0.8888 to 0.9313 for the verification test, which is 0.0425 increased compared with the value before optimization. The comparison results showed that the method, grey relational analysis coupled with response surface methodology, can be applied to establish model and optimize the disc milling process of titanium alloy blisk channels. The calculated optimal parameter combination can ameliorate the disc milling process.

5. Conclusions

The disk milling process of the titanium alloy blisk channels is a multi-input process with multiple objectives. The material removal rate (Q) is the volume of metal removed in a form of cutting per unit time. The cutter life (T) refers to the cutting time that a new tool has experienced from the beginning of cutting to end. The thickness of residual stress layer (Hs) refers to the thickness of residual stress at the junction of surface metal and matrix material when the surface structure of metal material changes shape and structure during cutting. In this study, a procedure integrating the GRA, principal component analysis and RSM is employed to predict the optimal process parameters combination for improving the material removal rate and cutter life and reduce the thickness of residual stress layer. The findings can be concluded as follows:
(1)
In the disc milling process, the key process parameters affecting the blisk processing quality are spindle speed, cutting depth and feed speed. According to the principal component analysis, the material removal rate had a most significant influence in the milling process.
(3)
In the milling process, the coupling mechanism between process parameters is also studied. The process parameters, such as spindle speed, cutting depth and feed speed, are coupled with each other to determine the grey relational grade (GRG).
(3)
The optimal process parameter combination is obtained as spindle speed with 82.61 rpm, cutting depth with 4.95 mm and feed rate with 69.12 mm/min.
The theoretical and experimental research showed that the optimal process parameter combination can effectively improve the material removal rate and cutter life and reduce the thickness of residual stress layer. The optimization results can be applied to the disc milling process of titanium alloy blisk channels. On the one hand, the reasonable parameter combination can improve the machining efficiency and prolong the tool life. On the other hand, the rational technology parameter can effectively reduce the processing cost of the blisk.

Author Contributions

Z.-S.L. presented the conception of this article and collected the corresponding data. Then he carried out the experimental work and participated in the acquisition of data. Finally, Z.-S.L. completed the rough draft for the manuscript. Y.-Y.S. reviewed this article and put forward some constructive suggestions for the paper. All the authors read and approved the final manuscript.

Funding

This research was funded by [National Numerical Control Major Projects Foundation of China] grant number [2013ZX04001081].

Conflicts of Interest

The authors declare no conflict of interest.

References

  1. Honisch, P.; Kuhhorn, A.; Beirow, B. Experimental and numerical analyses of radial turbine blisks with regard to mistuning. In Proceedings of the ASME Turbo Expo 2011, Vancouver, BC, Canada, 6–10 June 2011; Volume 6, Parts A and B. pp. 971–980. [Google Scholar]
  2. Calleja, A.; Fernandez, A.; Campa, F.J.; Lamikiz, A.; de Lacalle, L.N.L. Reliable manufacturing process in turbine blisks and compressors. Procedia Eng. 2013, 63, 60–66. [Google Scholar] [CrossRef]
  3. Klocke, F.; Schmitt, R.; Zeis, M.; Heidemanns, L.; Kerkhoff, J.; Heinen, D.; Klink, A.J.P.C. Technological and economical assessment of alternative process chains for blisk manufacture. Procedia CIRP 2015, 35, 67–72. [Google Scholar] [CrossRef]
  4. Denkena, B.; Boess, V.; Nespor, D.; Floeter, F.; Rust, F. Engine blade regeneration: A literature review on common technologies in terms of machining. Int. J. Adv. Manuf. Tech. 2015, 81, 917–924. [Google Scholar] [CrossRef]
  5. Cheng, Y.N.; Yang, J.L.; Chen, T.Q.; Xu, M. Design and wear analysis of tool for high-efficiency disk milling roughing of aero-engine blisk channels. Int. J. Adv. Manuf. Tech. 2018, 96, 1305–1317. [Google Scholar] [CrossRef]
  6. Xu, Z.Y.; Xu, Q.; Zhu, D.; Gong, T. A high efficiency electrochemical machining method of blisk channels. CIRP Ann.-Manuf. Technol. 2013, 62, 187–190. [Google Scholar] [CrossRef]
  7. Xu, Z.Y.; Sun, L.Y.; Hu, Y.; Zhang, J.C. Flow field design and experimental investigation of electrochemical machining on blisk cascade passage. Int. J. Adv. Manuf. Tech. 2014, 71, 459–469. [Google Scholar] [CrossRef]
  8. Qu, N.S.; Hu, Y.; Zhu, D.; Xu, Z.Y. Electrochemical machining of blisk channels with progressive-pressure electrolyte flow. Mater. Manuf. Process. 2014, 29, 572–578. [Google Scholar] [CrossRef]
  9. Liu, X.; Kang, X.; Zhao, W.; Liang, W. Electrode feeding path searching for 5-axis edm of integral shrouded blisks. Proc. CIRP 2013, 6, 107–111. [Google Scholar] [CrossRef]
  10. Liang, Y.S.; Zhang, D.H.; Ren, J.X.; Xu, Y.Y. Feedrate scheduling for multi-axis plunge milling of open blisks. Proc. Inst. Mech. Eng. B J. Eng. Manuf. 2015, 229, 1525–1534. [Google Scholar] [CrossRef]
  11. Liang, Y.S.; Zhang, D.H.; Chen, Z.Z.C.; Ren, J.X.; Li, X.Y. Tool orientation optimization and location determination for four-axis plunge milling of open blisks. Int. J. Adv. Manuf. Tech. 2014, 70, 2249–2261. [Google Scholar] [CrossRef]
  12. Klocke, F.; Bergs, T.; Doebbeler, B.; Binder, M.; Seimann, M. Multi-criteria assessment of machining processes for turbine disc slotting. J. Manuf. Mater. Process. 2018, 2, 32. [Google Scholar] [CrossRef]
  13. Meng, F.J.; Chen, Z.T.; Xu, R.F.; Li, X. Optimal barrel cutter selection for the cnc machining of blisk. Comput. Aided Des. 2014, 53, 36–45. [Google Scholar] [CrossRef]
  14. Zhao, P.B.; Shi, Y.Y. Posture adaptive control of the flexible grinding head for blisk manufacturing. Int. J. Adv. Manuf. Tech. 2014, 70, 1989–2001. [Google Scholar] [CrossRef]
  15. Zhao, P.B.; Huang, J.; Shi, Y.Y. Structure design and rotation control of the disc milling head in blisk manufacturing. Int. J. Adv. Manuf. Tech. 2017, 88, 2121–2133. [Google Scholar] [CrossRef]
  16. Rajesh, R.; Ravi, V. Supplier selection in resilient supply chains: A grey relational analysis approach. J. Clean. Prod. 2015, 86, 343–359. [Google Scholar] [CrossRef]
  17. Manikandan, N.; Kumanan, S.; Sathiyanarayanan, C. Multiple performance optimization of electrochemical drilling of inconel 625 using taguchi based grey relational analysis. Eng. Sci. Technol. Int. J. 2016, 20, 662–671. [Google Scholar] [CrossRef]
  18. Campatelli, G.; Lorenzini, L.; Scippa, A. Optimization of process parameters using a response surface method for minimizing power consumption in the milling of carbon steel. J. Clean. Prod. 2014, 66, 309–316. [Google Scholar] [CrossRef]
  19. Hajmohammad, M.H.; Esfe, M.H. Multi-objective optimization of cost and thermal performance of double walled carbon nanotubes/water nanofluids by nsga-ii using response surface method. Appl. Ther. Eng. 2016, 112, 1648–1657. [Google Scholar]
  20. Babu, M.N.; Muthukrishnan, N. Investigation on surface roughness in abrasive water-jet machining by the response surface method. Adv. Manuf. Process. 2014, 29, 1422–1428. [Google Scholar] [CrossRef]
Figure 1. Schematic diagram of Efficient and Powerful CNC Milling Machine.
Symmetry 11 00173 g001
Figure 2. The disc milling process for the titanium alloy blisk channels. (a) Disc milling process utilizing QJK006; (b) Workpiece before processing; (c) Machined workpiece with the channel.
Symmetry 11 00173 g002
Figure 3. Schematic diagram for the material removal operation of the disc milling process.
Symmetry 11 00173 g003
Figure 4. Residual analysis results. (a) Residuals normal plot of grey relational grade model; (b) Residual versus run plot of grey relational grade model.
Symmetry 11 00173 g004
Figure 5. Predicted versus actual plot of grey relational grade model.
Symmetry 11 00173 g005
Figure 6. Coupling effect of spindle speed and cutting depth on the grey relational grade. (a) The response surface map; (b) The contour lines map.
Symmetry 11 00173 g006
Figure 7. Coupling effect of spindle speed and feed speed on the grey relational grade. (a) The response surface map; (b) The contour lines map.
Symmetry 11 00173 g007
Figure 8. Coupling effect of cutting depth and feed speed on the grey relational grade. (a) The response surface map; (b) The contour lines map.
Symmetry 11 00173 g008
Figure 9. Ramp function graph of desirability and the optimized result for grey relational grade (GRG).
Symmetry 11 00173 g009
Table 1. Level of process parameters.
Level of Experimental Parameters
Experimental ParametersSymbolUnitsLevel 1Level 2Level 3CategoryConstraint
Spindle speednrrpm4070100Independent30–120
Cutting depthapmm369Independent2–12
Feed speedvfmm/min6080100Independent40–120
Material removal rateQmm3/min---DependentMax
Cutter lifeTmin---DependentMax
Metamorphic thicknessHsµm---DependentMin
Table 2. Main chemical compositions of TC4.
ComponentAlVFeCOHN
Content5.5~6.753.5~4.5≤0.3≤0.1≤0.2≤0.015≤0.05
Table 3. Experiment and measurement results.
No.Process ParameterQ (mm3/min)S/NT (min)S/NHs (µm)S/N
nrapvf
1403808.118.169712.722.0761243.4−47.7264
2409805.614.963816.424.2969216.5−46.7092
37068018.725.436819.225.666239.2−47.5752
410066016.424.296920.526.2351265.1−48.4682
57031004.613.255211.321.0616246.7−47.8434
610061009.819.824510.320.2567272.3−48.701
77068018.225.201419.625.8451230.9−47.2685
810038014.323.106718.825.4832226.8−47.1129
97068018.325.24918.725.4368238.6−47.5534
107068018.125.153619.425.756238.3−47.5425
1110098013.422.54219.119.1808251.6−48.0142
1270910010.620.506111.421.1381287.1−49.1607
137096011.621.289214.723.3463258.3−48.2425
147036012.521.938221.726.7292228.4−47.1739
154061003.510.88149.819.8245224.8−47.0359
167068018.525.343418.925.5292235.5−47.4398
17406604.913.803919.525.8007221.8−46.9192
Table 4. Principal component analysis for weight values.
Principal ComponentEigenvalueContribution (%)
Material removal rate (Q)1.667455.58
Cutter life (T)1.101336.71
Metamorphic thickness (Hs)0.23137.71
Total 100
Table 5. Grey relational analysis results.
Deviation Sequence Δ0iGrey Relational Coefficient
No.QTHs THsGRG
10.49930.61640.41490.50040.44790.54650.4846
20.71950.322200.410.608110.5282
300.14080.353310.78020.5860.8874
40.07830.06550.71750.86460.88420.41070.8368
50.83690.75080.46260.3740.39970.51940.3947
60.38560.85750.81250.56460.36830.3810.4784
70.01620.11710.22810.96870.81020.68670.8888
80.16010.16510.16470.75750.75180.75230.755
90.01290.17120.34440.97480.74490.59220.8609
100.01950.12890.33990.96250.7950.59530.8727
110.198910.53230.71540.33330.48430.5573
120.33880.740710.59610.4030.33330.505
130.2850.44820.62540.6370.52730.44430.5819
140.240400.18960.675310.72510.7984
1510.91470.13330.33330.35340.78950.3759
160.00640.1590.2980.98730.75880.62650.8756
170.79920.1230.08570.38480.80260.85370.5743
Table 6. ANOVA results for response surface quadratic model of grey relational analysis.
SourceSS 1DF 2MS 3F ValueProb > F
Model0.5790.064215.11<0.0001
A0.05510.055186.25<0.0001
B8.47E−0318.47E−0328.570.0011
C0.1310.13454.06<0.0001
AB0.01510.01549.090.0002
AC6.40E−0316.40E−0321.580.0024
BC0.02710.02790.11<0.0001
A20.09410.094318.43<0.0001
B20.0910.09303.26<0.0001
C20.1110.11368.48<0.0001
Residual2.07E−0372.96E−04
Lack of Fit1.55E−0335.17E−043.940.1093
Pure Error5.25E−0441.31E−04
Cor Total0.5816
1 SS: Sum of Squares; 2 DF: Degrees of Freedom; 3 MS: Mean Square.
Table 7. Comparison between the initial and optimal settings.
OptionSpindle Speed (nr)Cutting Depth (ap)Feed Speed (vf)Experiment ResultsGRG
QTHs
Initial7068018.219.6230.90.8888
Optimal81.925.8866.0820.522.7218.40.9313
Improvement +2.3+3.1−12.5+0.0425

