Article

Parameter Optimization for Computer Numerical Controlled Machining Using Fuzzy and Game Theory

1
College of Mechanical and Control Engineering, Guilin University of Technology, Guilin 541004, Guangxi, China
2
Department of Information Management, Yu Da University, Miaoli County 36143, Taiwan
3
Department of Industrial Engineering and Management, Yuan Ze University, Taoyuan City 32003, Taiwan
*
Author to whom correspondence should be addressed.
Symmetry 2019, 11(12), 1450; https://doi.org/10.3390/sym11121450
Submission received: 20 October 2019 / Revised: 18 November 2019 / Accepted: 21 November 2019 / Published: 25 November 2019
(This article belongs to the Special Issue Selected Papers from IIKII 2019 conferences in Symmetry)

Abstract

:
Under the strict restrictions of international environmental regulations, how to reduce environmental hazards at the production stage has become an important issue in the practice of automated production. The precision computerized numerical-controlled (CNC) cutting process was chosen as an example of this, while tool wear and cutting noise were chosen as the research objectives of CNC cutting quality. The effects of quality optimizing were verified using the depth of cut, cutting speed, feed rate, and tool nose runoff as control parameters and actual cutting on a CNC lathe was performed. Further, the relationships between Fuzzy theory and control parameters as well as quality objectives were used to define semantic rules to perform fuzzy quantification. The quantified output value was introduced into game theory to carry out the multi-quality bargaining game. Through the statistics of strategic probability, the strategy with the highest total probability was selected to obtain the optimum plan of multi-quality and multi-strategy. Under the multi-quality optimum parameter combination, the tool wear and cutting noise, compared to the parameter combination recommended by the cutting manual, was reduced by 23% and 1%, respectively. This research can indeed ameliorate the multi-quality cutting problem. The results of the research provided the technicians with a set of all-purpose economic prospective parameter analysis methods in the manufacturing process to enhance the international competitiveness of the automated CNC industry.

1. Introduction

Under strict international environmental regulations, although there are various cutting conditions related to environmental protection quality, tool wear and cutting noise are always considered preferentially as because of their green environmental protection quality in the practice of machining of cutting. There are often sophisticated nonlinear relationships in the problem of parameter optimization in multi-quality precision CNC production. The industry often selects appropriate machining parameters that rely on the program of the numerically controlled machine tool or the technicians’ experience, but the results are not necessarily optimal and are not guaranteed to be optimal under multi-quality (more than two target qualities). Most of the cutting parameter optimization literature obviously does not meet the needs of the industry as it either considers only a single quality (only one target quality) or has overly costly research.
According to the research on cutting parameters, using Analytic Hierarchy Process (AHP) to combine the innovative thinking model of Teoriya Resheniya Izobretatelskikh Zadatch (TRIZ) and the concept of green production reduces the impact on the environment [1]. The optimal turning parameters obtained by using fuzzy semantic quantification can indeed be used as a method of analyzing parameters for practical cutting operations under environmental and cost considerations [2]. Considering the problem of cutting noise, Lan, Chuang, and Chen analyzed the combination of the optimal factor level with the Taguchi method [3]. However, the research only explored the noise target and thus was research of a single quality. Zhang et al. analyzed the influence of cutting parameters on noise with the variance. The cutting cost model was proposed after the analysis results showed that the cutting depth was the main factor affecting the cutting noise. However, the results of the study also applied only to a single quality material [4]. Hossein and Kops’s research showed that the cutting temperature increases under larger cutting depth and higher cutting speed, which in turn shortens the tool life. However, the research took time to carry out the cutting work and belonged solely to the research of a single quality and not a multi-quality research [5]. The research of Schultheiss et al. which pointed out that reducing the tool wear can shorten the time of the production cycle and reduce energy consumption, was also a single quality research and not a multi-quality research [6]. Weng obtained the optimal cutting parameters by using fuzzy quantification. The parameters can reach 10% of the level prior the whole experiment under the Technique for Order Preference by Similarity to Ideal Solution (TOPSIS) arrangement. This proved that the experiment is unnecessary in reaching this level and can result in cost and labor savings. While this research obtained optimized combinations of multi-quality parameters, it did not take into account the conflict of quality objectives [7]. Li et al. established a multi-quality optimization model scheme by applying game theory to machining cutting parameters. The research showed that game theory was suitable for multi-quality optimization design, but failed to obtain the best combination [8]. Zhou et al. reduced and optimized the carbon footprint of the cutting process through game theory, but multi-quality was not taken into account [9]. Tian et al. considered the tool wear conditions and optimized the cutting parameters through game theory. The research discussed the conditions of tool wear, which was also a single-quality optimization research [10]. The above-mentioned local or abroad researches on cutting parameters are either discussions of only a single quality or optimization plans with specific conditions. Not only is there no further explanation and analysis of the conflict between the production qualities, but there is a need to be achieved through the actual operation of the cutting equipment, which is a waste of material resources, time, and labor and has an influence on the surrounding environment. Different control parameters are required when the processing conditions (materials, equipment, and tools) are different, which troubles the CNC industry. Therefore, developing a set of general production optimal mechanisms with green innovation by analyzing the inference method of green product design without equipment operation will be positive for the competitiveness and development of the precision CNC turning industry.
Based on the shortcomings of the above-mentioned researches, this research integrate fuzzy theory and game theory. Through the method of semantic quantification, a set all-purpose prediction models provides the fuzzy value of each goal for the selection of cutting parameters without actual cutting by the machine. The research also resolves the conflict problem between production qualities and control parameters by using game theory. The best quality strategy was obtained through statistic to help improve the understanding of engineering science by technicians as a consideration in the design or manufacture of future products. Through the result of this research, a set of optimal, all-purpose economic prospective parameter analysis methods could be provided to the technicians to enhance the overall competitiveness of the automated CNC cutting industry.

2. Research Background

2.1. Tool Wear

From Taylor’s tool life formula, the wear of high-speed steel tools refers to the use time in the upper limit of the low wear rate area, which was used to record the characteristics of High Speed Steel (HSS) tools and to obtain Formula (1) after rearrangement [11]. The relationship between feed rate and cutting speed must be properly matched during cutting. For instance, friction phenomenon instead of cutting might occur with overly slow speed. However, unexpected high-speed might break the cutting edge or roughen the transient surface.
T V 1 / n f 1 / m d 1 / l = C
  • T: tool function.
  • V: cutting speed.
  • f: feed rate.
  • D: diameter of milling cutter.
  • n, m: constant of tool material properties (acquired by experiment or experience).
  • l: cutting length.
  • C′: cutting speed of tool life in 1 minute (supplied by tool manufacturer).
(1)
According to the formula, a larger depth of cut and higher cutting speed lead to less tool wear.
(2)
From expert experience, higher cutting speed and feed rate lead to less tool wear.
(3)
According to the formula, lower cutting speed and feed rate lead to less tool wear.

2.2. Cutting Noise

All the noise values produced by the measurement experiment, including the noise values produced by motor idling and cutting experiments, were substituted in the formula, since their differences are lower than three Decibels, as shown in Formula (2) [12].
L P C = 10 log [ 10 L P B 10 10 L P A 10 ]
  • LPB: the measured value of motor running with no cutting.
  • LPA: the measured value of motor running with cutting.
(1)
Smaller depth of cut, less noise.
(2)
Slower cutting speed, less noise.
(3)
Improving the pressure of the tool, less noise.

2.3. Fuzzy Theory

In 1965, Professor Zadeh of the University of California, Berkeley proposed fuzzy theory, which is a kind of fuzzy concept quantification based on fuzzy sets. It is mainly focused on making a correct judgment without going through complicated calculation processes of the fuzzy message of the human brain or incomplete information [13]. The language ‘IF…THEN…’ is used in fuzzy theory to represent the fuzzy relationship. A language represents a qualitative conditional sentence and an uncertain rule, which is quantified by fuzzy mathematical tools. Fuzzy logic control was used to convert the input language to a fuzzy set. The fuzzy logic control architecture included the fuzzification interface, interface engine, defuzzification interface, and the fuzzy rule-based system, as shown in Figure 1 [14].

2.4. Game Theory

Game theory was proposed in 1928 [15,16] before being promoted by the economist John Nash. Von Neumann and Oskar Morgenstern co-authored The Theory of Games and Economic Behavior in 1944, which analyzed game theory and economic behavior in detail and explained zero-sum games, the league, and the cooperative game, which further laid the theoretical foundation of game theory. Shapley contributed significantly to the development of core theory in game theory through the development of a prisoner’s dilemma game [17]. Nash proved the Nash equilibrium existence theorem in 1953, which set a milestone for the current non-cooperative game theory.
Game theory is a state of confrontation for two or more contestants in a rational situation, with the pursuit of their own interests as the greatest goal. The conflict and cooperative relationship between rational contestants, using mathematical model simulation, has been widely used in various types of study.

2.4.1. Elements of a Game

The setting of contestants is rational in a game; however, the result could be quite the contrary or could have a Pareto principle, which is just in line with the current economic development trend since the smart contestant sits first in the best strategy of others to greater their own payoff function. Therefore, the result of the game is not necessarily rational or efficient but is closer to the economic situation. The main elements of the game are:
  • Player: The actor who makes decisions with the greatest goal of pursuing his own interest.
  • Nature: If not a contestant, the action taken is determined by a well-known probability.
  • Action set: A collection of all possible actions taken by a contestant.
  • Payoff Function: The remuneration that a contestant receives when the results of a game are shown, which is generally affected by all participants.

2.4.2. Information Structure

The information structure was divided into four types by Rasmusen, which are perfect information, complete information, certain information, and symmetric information [18]. Within a game with perfect information, each information set is a single node, which means that the players are clear about at which decision point the decision is made. If not, the game is called an imperfect information game. A game in which the players sit aware of the following three situations is called a complete information game. If not, the game is called an incomplete information game.
  • The identities of the players.
  • The moves could be taken by all players.
  • The utility function of all players.
Within a game with certain information, players will not act naturally after acting. If not, the game is called an uncertain information game. In a game with symmetric information, the information a player gets at the move node or at the end is the same with other players. If not, the game is called an asymmetric information game. Based on the player’s simultaneous move (static game) or sequential move (dynamic game), and prior information (strategy and playoff) a player has or does not have, the game is divided into four types, as shown in Table 1.

2.4.3. Bargaining Games

The largest difference between bargaining game theory and decision theory is that the problems faced by a group of decision makers in a given situation can solve many economic problems. Therefore, game theory, which is widely used by economic, political, and financial experts, not only has the rigor of a mathematical model, but also simplifies the complex interaction phenomena in a real environment, and provides the strategic behavior analysis method for decision makers. In 1950, Nash assumed that a group of axioms would only get a solution to a set of bargaining models based on a non-cooperative game, which was divided into four parts [19,20].
1. Pareto efficiency
The outcome of the contestants’ bargaining is beneficial to both parties; in other words, there is no other bargaining outcome that can increase the interests of all participants at the same time.
2. Independence of the irrelevant alternatives
Add things that do not matter in the game, and the outcome of the bargain is not affected.
3. Symmetry
If there is symmetry in the contestants’ negotiation questions, the two contestants will receive an equal result.
4. Invariance under strategically equivalent representations
The utility function after the monotonic transformation still indicates that the participants have the same preference, and the monotonic transformed utility function does not affect the bargaining result.
Nash’s suggestion, as shown in Formula (3), proved that the bargaining solution exists and is unique if these four axioms are satisfied.
max ( S 1 d 1 ) s 1 s 2 ( S 2 d 2 )
  • d 1 , d 2 : the payoff that both players can get when there is no agreement of the bargain.
  • S 1 , S 2 : the payoff that both players can get when there is a agreement of the bargain.
Only if the result of the bargain is better than the one before the bargain can the players be motivated to bargain, so that ( d 1 , d 2 ) ( s 1 , s 2 ) .
Bargaining game theory has been used universally in economics, international relationships, calculator science, military strategy, and other disciplines. Some general topics that had used bargaining game theory are about the efficiency and rationality of solving supplier selection problems [21], the demand-response resource allocation between distribution networks [22], the reduction of environmental risks to enterprises in production processes [23], the solutions to the upload transmission power optimization problems in the multilateral bargaining model [24], and more.

3. Research Design

Precision CNC cutting was taken as an example in this research, while tool wear and cutting noise were selected as the green production quality of CNC cutting. The depth of cut, cutting speed, feed rate, and tool nose runoff were taken as control parameters. Fuzzy theory was used to define the semantic rules of the relationship of control parameters and production quality to carry out the fuzzy quantification. The quantified output values were introduced into game theory to resolve the conflict among the two production qualities and four control parameters. The strategy probability statistics of the game result and the strategy option with the highest sum of probability as the best strategy of that production quality were taken.

3.1. Fuzzy Rules Establishment

In the selection of the fuzzy membership function, different membership functions, based on each rule, were compared by entering the three factors: Cutting speed, cutting depth, and feed rate. The minimum membership function was calculated by the intersection, and the maximum value of the union was selected as the output part of the set to calculate the value of the center of gravity of the largest area in order to obtain the fuzzy value. The triangular membership function was used as the fuzzy pattern and the defuzzification was calculated by the center of gravity. Tool wear and cutting noise were chosen as the production qualities in this research. According to the literature, relevant cutting experience level range, and the suggestion of cutting parameters from tool manuals, was determined as low, medium, or high. The cutting characteristics of the target were obtained by using semantic quantification and were divided into five levels: Greatest, large, moderate, small, and minimal.

3.1.1. Tool Wear

Tool wear is a vital factor affecting cutting quality in precision machining. Changing the cutting tool before the end of the tool’s life may result in higher production cost, lower production efficiency, and many disposals of tool inserts, which cause environmental pollution. Therefore, this study established fuzzy rules using cutting speed, cutting depth, and feed rate to minimize the tool wear, as shown in Table 2.

3.1.2. Cutting Noise

The noise during the cutting process is mainly caused by the vibration phenomenon, which not only interferes with the entire cutting process, but also seriously influences the quality of the work piece. The noise might even influence the mood of the technicians during work, which has a certain negative impact on production quality. In order to reduce the vibration frequency, it is necessary to reduce the cutting speed, depth of cutting, and feed rate of the tool, which in turn reduces productivity. Therefore, the fuzzy rules were established with cutting speed, depth of cutting, and feed rate as the factors based on the semantic considerations, as shown in Table 3.

3.2. Variability of the Input and Output Domains

The operation had three inputs and one output. The input target was the control factor, and the output target was the default result. The input domain of the variables was in the interval [0,5] and was divided into five equal parts. The output domain of the variables was in the interval [0,40] and was divided into 40 equal parts.
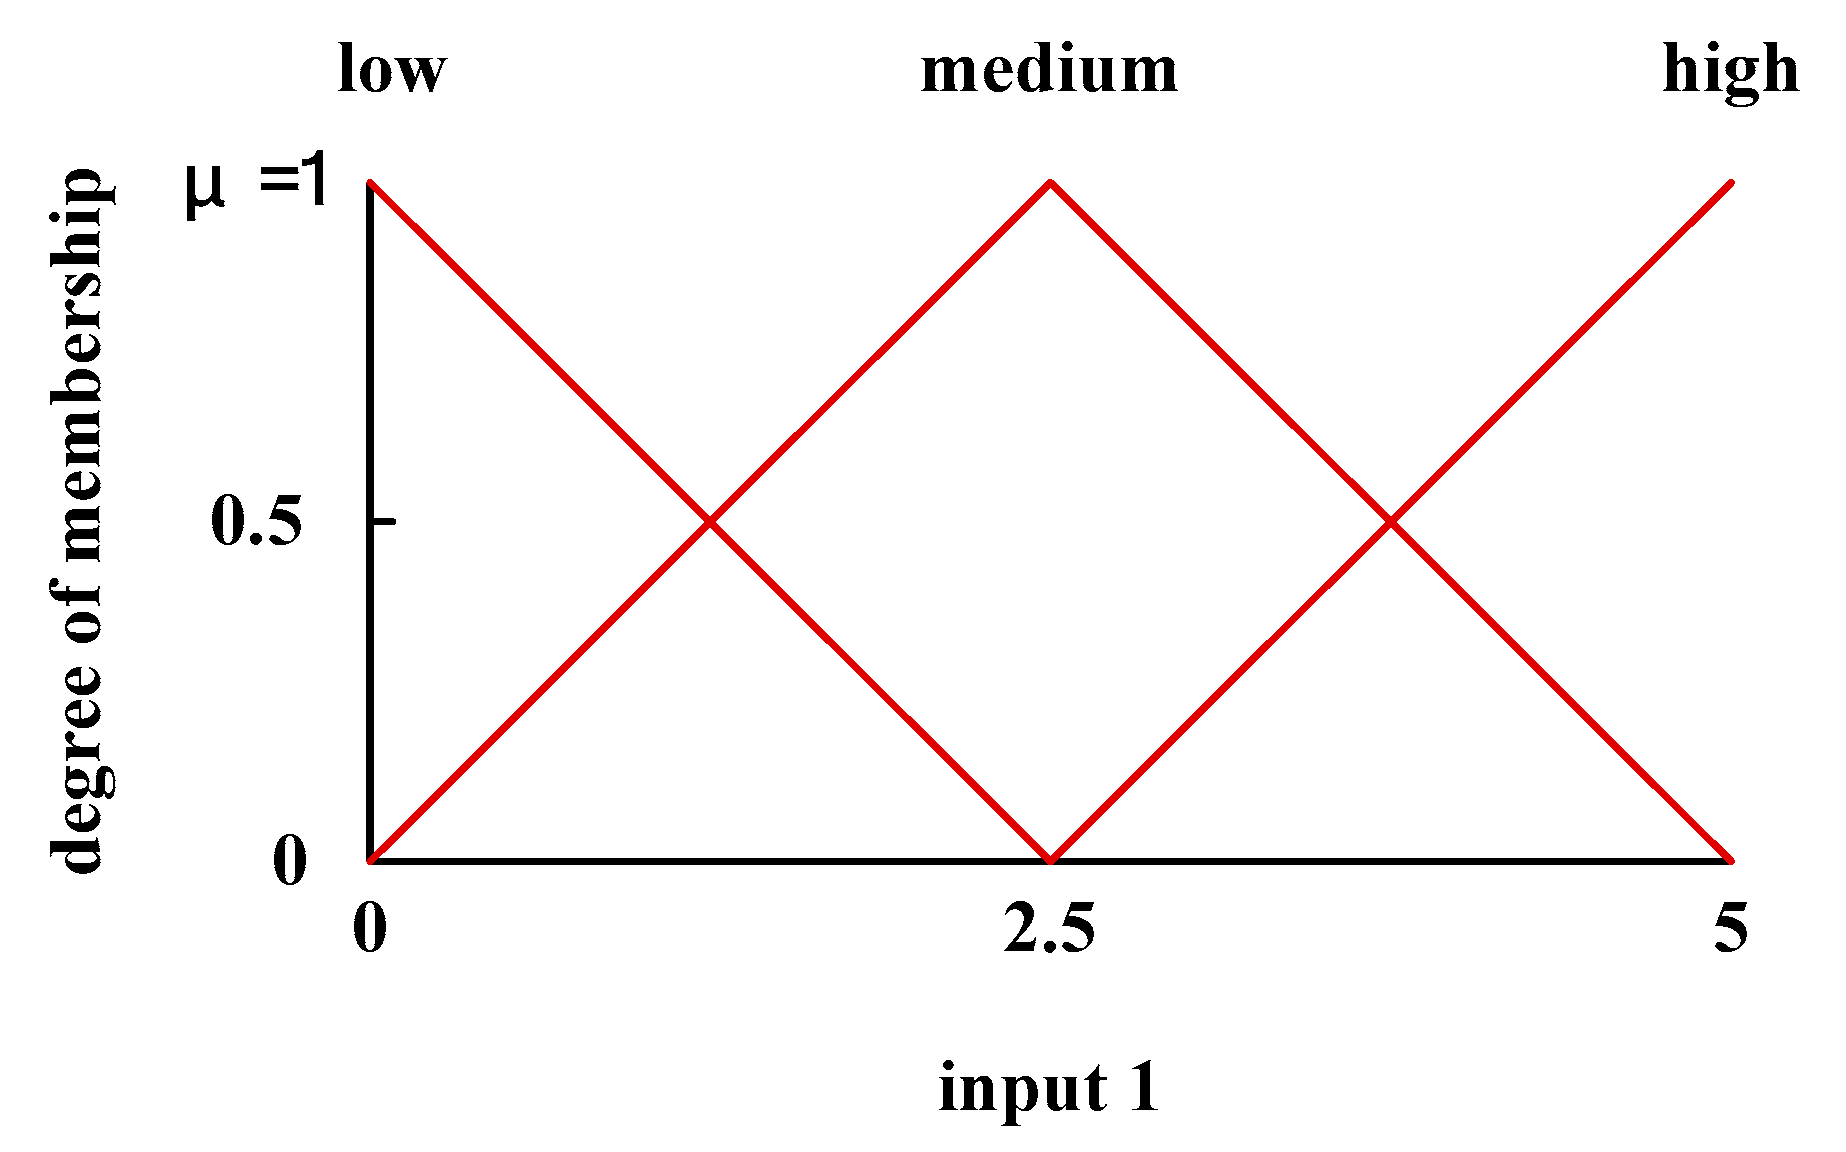
1. Input target (1): The degree of membership of cutting speed as the control factor (Figure 2).
Fuzzy terms: The degree of membership presented in Figure 2 is listed in Table 4.
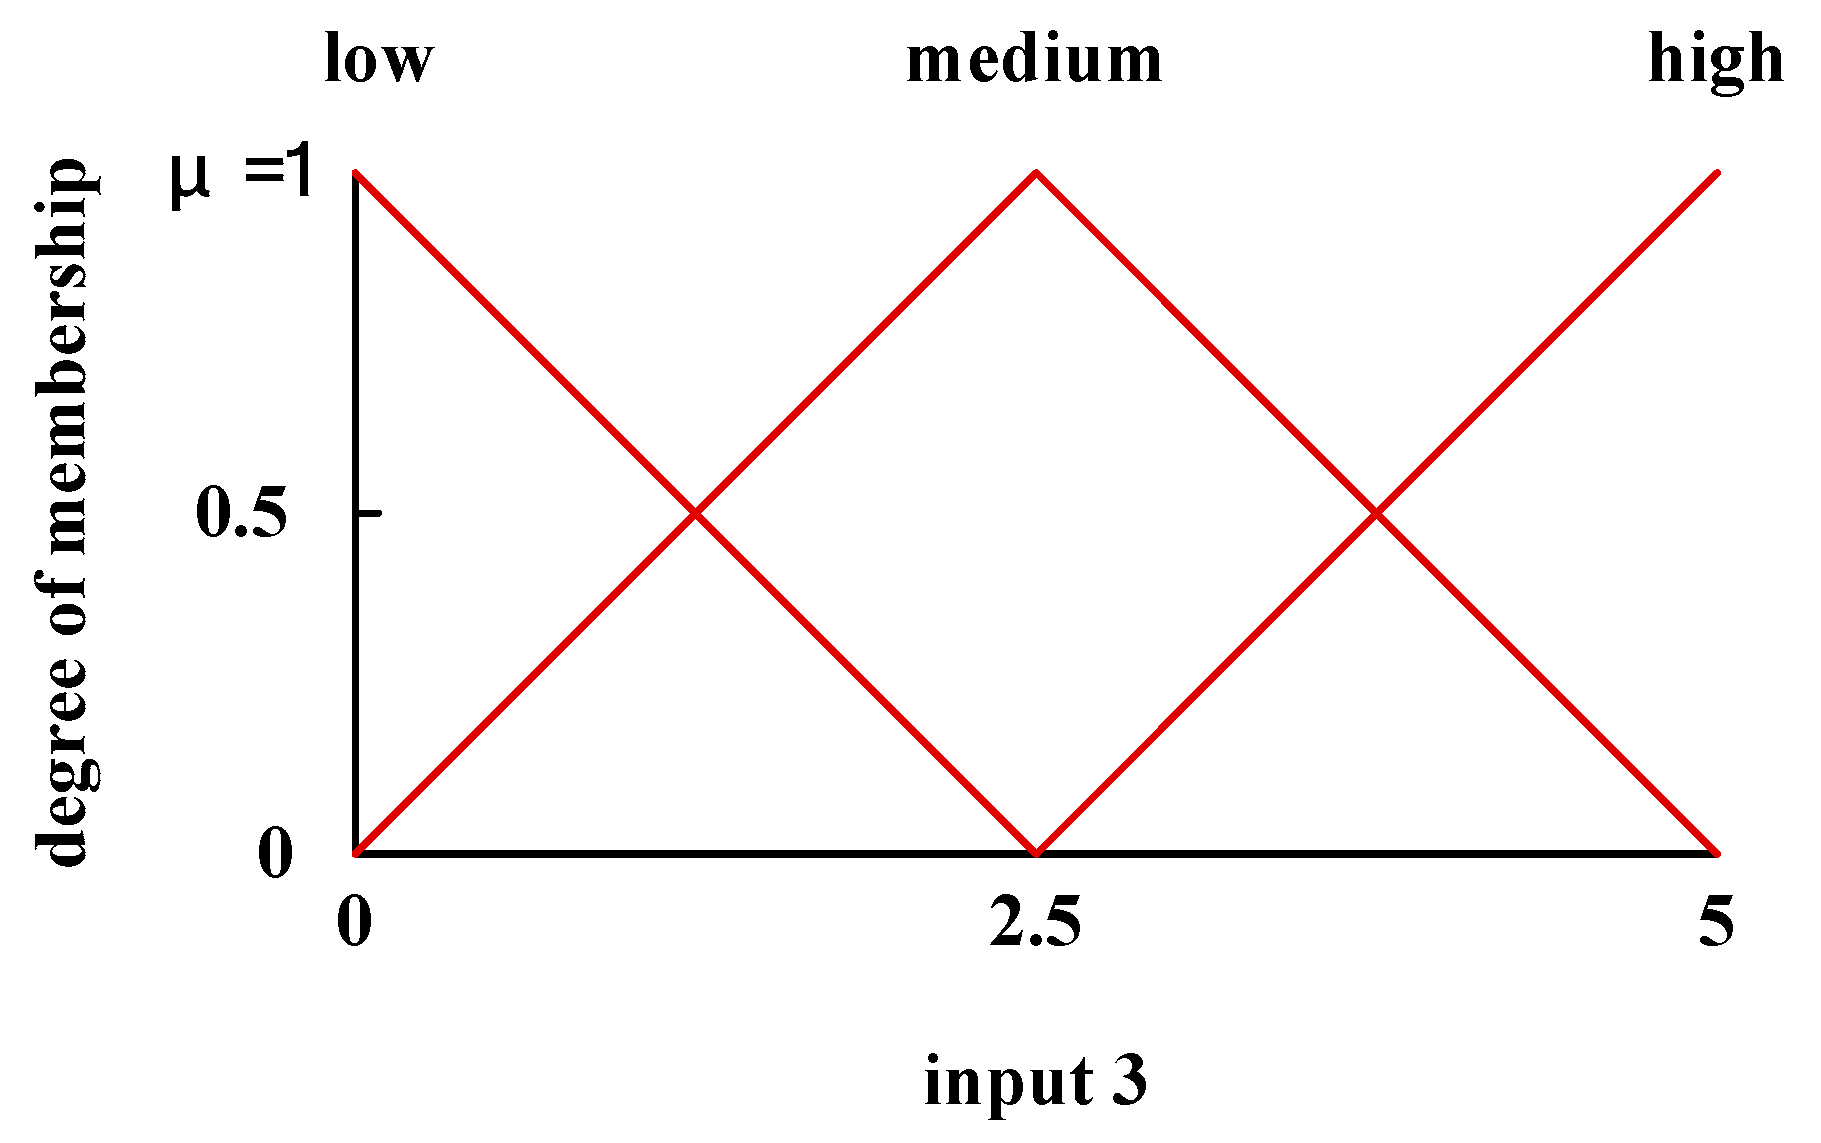
2. Input target (2): The degree of membership of cutting depth as the control factor (Figure 3).
Fuzzy terms: The degree of membership presented in Figure 3 is listed in Table 5.
3. Input target (3): The degree of membership of feed rate as the control factor (Figure 4).
Fuzzy terms: The degree of membership presented in Figure 4 is listed in Table 6.
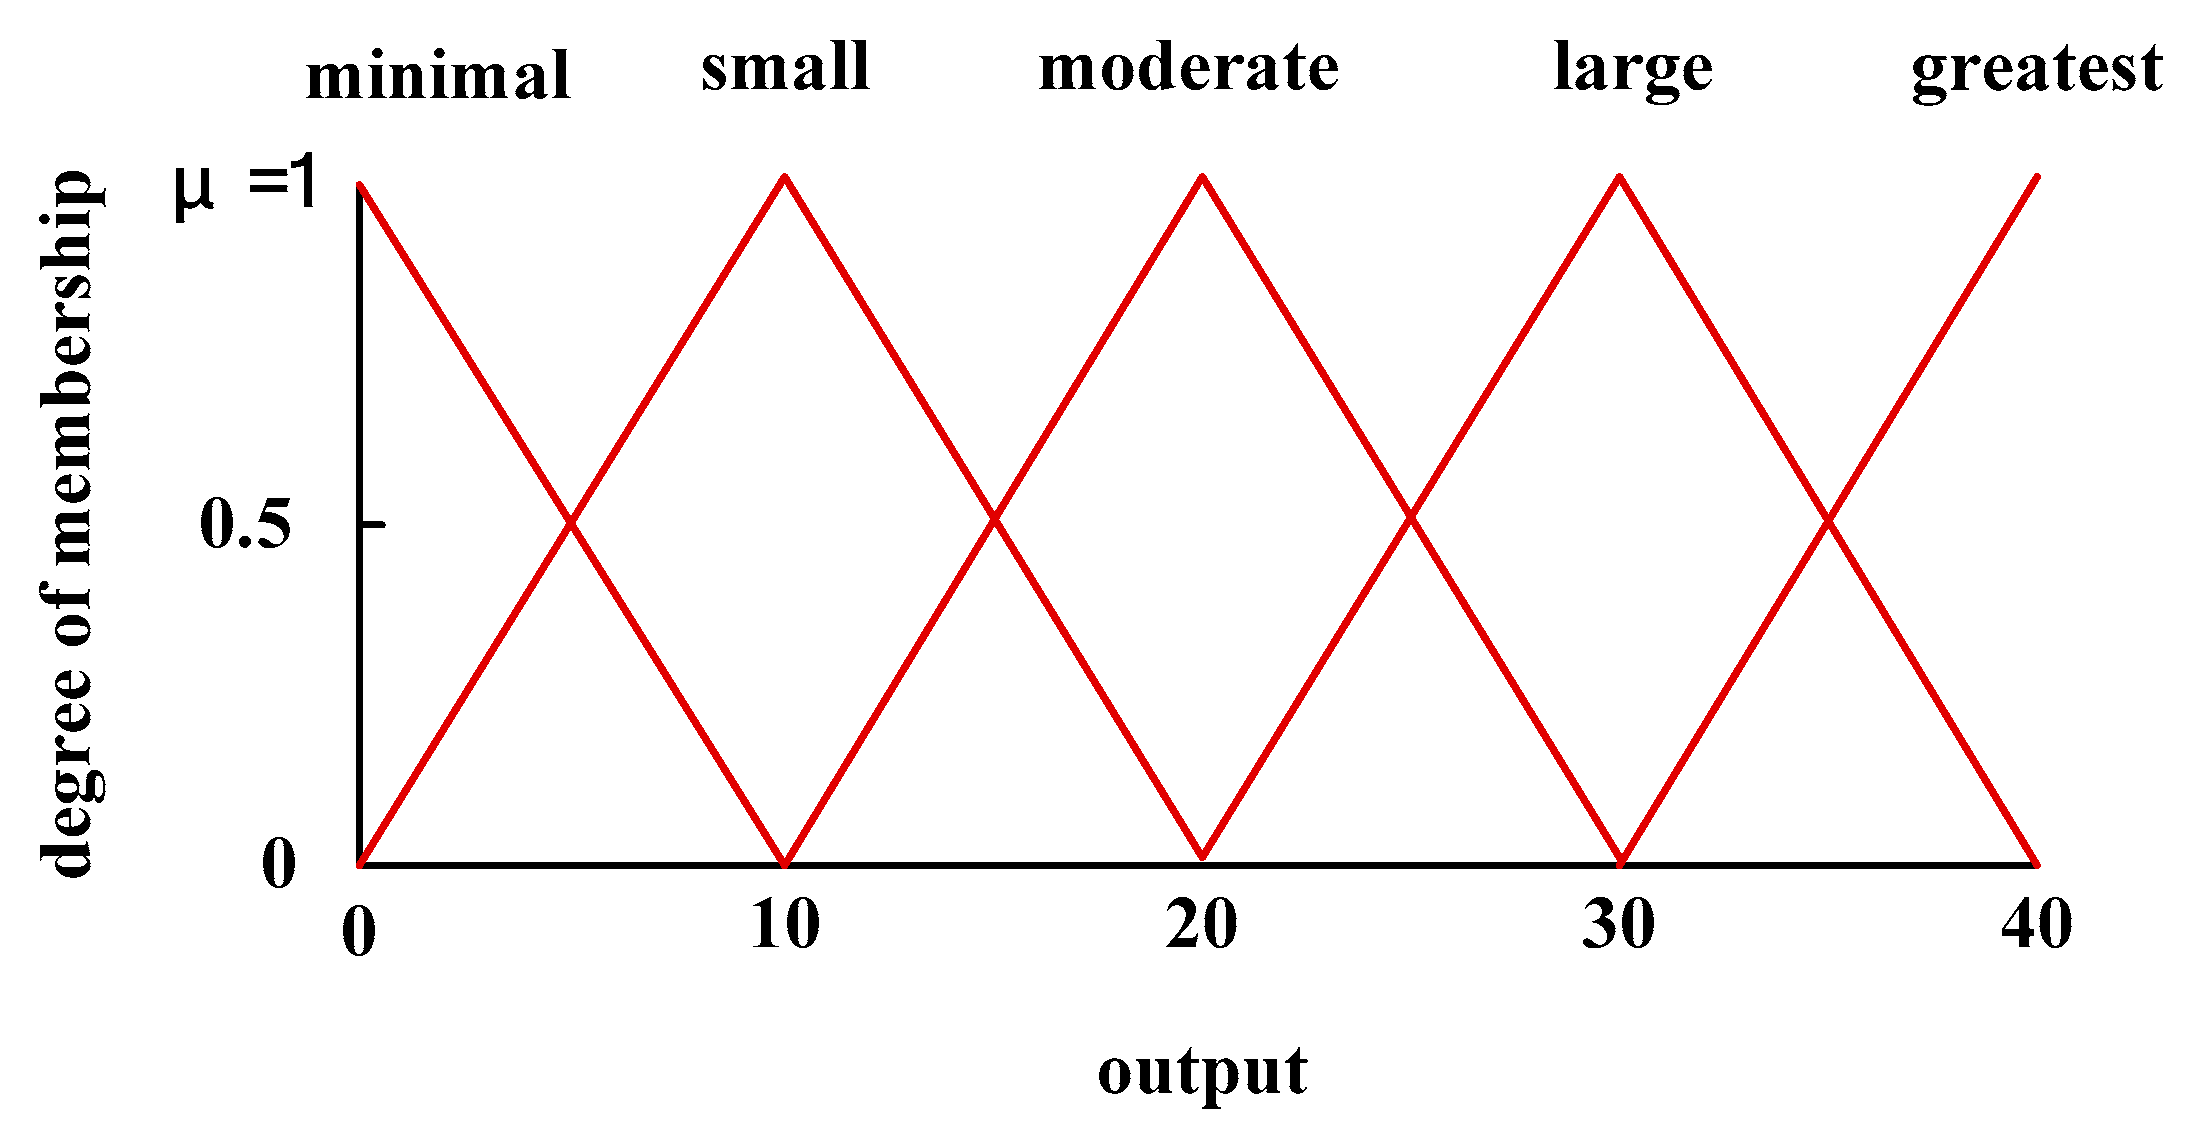
4. Output target: Membership functions of the output variable (Figure 5).
Fuzzy terms: The degree of membership presented in Figure 5 is detailed in Table 7.

3.3. Combination of Rules and Fuzzy Operation

According to the level range (low, medium, and high), the corresponding membership functions were the highest point of each fuzzy area, and the membership functions of input targets were determined by way of the intersection. The fuzzy operations of each target-preset result are shown below.
1. When the fuzzy region denotes “minimal” tool wear:
A v e r a g e   v a l u e = 1 × 0.84 + 2 × 0.68 + 3 × 0.52 + 4 × 0.36 + 5 × 0.2 + 6 × 0.04 1 + 0.84 + 0.68 + 0.52 + 0.36 + 0.2 + 0.04 = 1.1769
2. When the fuzzy region denotes “small” tool wear:
A v e r a g e   v a l u e = 5 × 0.04 + 6 × 0.2 + 7 × 0.36 + 8 × 0.52 + 9 × 0.84 + 10 × 1 + 11 × 0.68 + 12 × 0.52 + 13 × 0.36 + 14 × 0.2 + 15 × 0.04 0.04 + 0.2 + 0.36 + 0.52 + 0.84 + 1 + 0.68 + 0.52 + 0.36 + 0.2 + 0.04 = 9.966
3. When the fuzzy region denotes “moderate” tool wear:
A v e r a g e   v a l u e = 14 × 0.04 + 15 × 0.2 + 16 × 0.36 + 17 × 0.52 + 18 × 0.68 + 19 × 0.84 + 20 × 1 + 21 × 0.84 + 22 × 0.68 + 23 × 0.52 + 24 × 0.36 + 25 × 0.2 + 26 × 0.04 0.04 + 0.2 + 0.36 + 0.52 + 0.68 + 0.84 + 1 + 0.84 + 0.68 + 0.52 + 0.36 + 0.2 + 0.04 = 20
4. When the fuzzy region denotes “large” tool wear:
A v e r a g e   v a l u e = 26 × 0.04 + 27 × 0.2 + 28 × 0.36 + 29 × 0.52 + 30 × 0.68 + 31 × 0.84 + 32 × 1 + 33 × 0.84 + 34 × 0.68 + 35 × 0.52 + 36 × 0.36 + 37 × 0.2 + 38 × 0.04 0.04 + 0.2 + 0.36 + 0.52 + 0.68 + 0.84 + 1 + 0.84 + 0.68 + 0.52 + 0.36 + 0.2 + 0.04 = 32
5. When the fuzzy region denotes “greatest” tool wear
A v e r a g e   v a l u e = 34 × 0.04 + 35 × 0.2 + 36 × 0.36 + 37 × 0.52 + 38 × 0.68 + 39 × 0.84 + 40 × 1 0.04 + 0.2 + 0.36 + 0.52 + 0.68 + 0.84 + 1 = 38.23

3.4. Optimal Strategies of Games

A bargaining game for the two production qualities that are often considered in precision machining of cutting, tool wear, and cutting noise was conducted, and an innovative optimal mechanism was development afterward. The conflict among two production qualities and four control parameters was resolved through the perfect Bayesian equilibrium of game theory with one production quality as one individual player. The main strategy was chosen according to different production qualities. The probability value of strategies generated by the game was calculated to select the one with the highest sum of probability as the optimal strategy of each production quality. The optimal strategy chosen was also used to obtain the optimal plan of multi-quality and multi-strategy.

3.4.1. Establishment of the Game Model

1. Player (target)
Tool wear and cutting noise were set as players. The experimental data of the qualities are shown in Table 8 and Table 9. Player A is referred to as the tool wear (the smaller, the better) and player B as the cutting noise (the smaller, the better) in the following.
2. Strategic planning (control parameter)
(1)
Cutting speed
(2)
Depth of cut
(3)
Feed rate
(4)
Tool nose runoff

3.4.2. Target of Bargaining Games

The overall optimal improvement strategy was prioritized to obtain important control parameters considered preferentially by each production quality and was used to improve the turning process to obtain the best multi-quality and multi-strategy optimization. In order to take both the production qualities into account to develop a multi-quality and multi-strategy optimization, the numbers of the appearance of each strategy of the production qualities were counted. Four main strategies were selected, and the output values of their corresponding semantic rules after quantification were imported into game theory. The initial payoff matrix (Z1) was constructed under consideration of the strategies of the two production qualities, as shown in Table 10.

3.4.3. Mixed Strategies Game

In the initial payoff matrix initially established, the payoff value of all strategic combinations were filled in the corresponding spaces, resulting in the two-player multi-strategy game payoff matrix Z2, as shown in Table 11. Matrix Z2 was analyzed to establish whether the dominant strategy (one player’s strategies are always better than the other player’s strategies) existed. If positive, the matrix must first be simplified, as shown in Table 12. Finally, the probability values generated by all the games were statistically analyzed with their strategy probability, and the strategy with the highest probability sum was chosen to be the optimal strategy of that production quality. The optimal strategy of each production quality and its adoption probability are listed in Table 13 to obtain the optimal multi-quality and multi-strategy strategies.

4. Experimental Verification

4.1. Experimental Condition

As a precision turning experiment, medium-carbon steel S45C with ∅45 mm × 250 mm, 100 mm clamping length, and a disposable tool were, respectively, used as the research targets and the cutting tool. The cutting blade was model NX2525, manufactured by Mitsubishi, and the tool holder was model WTJNR2020K16, manufactured by Toshiba. With the control parameter range recommended by the blade manufacturer, the cutting speed was between 150–300 m per minute, the cutting depth was 1–4.5 mm, and the feed rate was 0.17–0.45 mm per revolution, the experiment setting was listed in below.
  • Cutting depth: 0.5 mm, 1 mm, and 1.5 mm.
  • Cutting speed: The highest CNC lathe rotational speed of the tool was 3000 rpm, the diameter of the medium-carbon steel S45C used in the turning experiment was ∅45 mm, and its highest cutting speed was 339.292 m per minute. The cutting speed was set as 250 m per minute, 200 m per minute, and 150 m per minute, according to the recommendations given by the disposable blade.
  • Feed rate: The feed rate of the precision turning experiment was 0.02 mm per revolution, 0.06 mm per revolution, and 0.1 mm per revolution.
The cutting parameters, according to the above, are shown in Table 14.

4.2. Result of Single Target Production Quality Verification

The median of the experimental results was used for comparative analysis. The median of the tool wear was 4.38 μm−2, as shown in Table 15. The median of the cutting noise was 82.83 dB, as shown in Table 16. According to the median and the comparative analysis of the two production qualities, the data obtained in this research was better than the median, which showed that the innovative strategies of both production qualities were optimized, as shown in Table 17.

4.3. Multi-Quality Optimal Strategy

4.3.1. Establish Initial Payoff Matrix Z2

Four preferred groups of the strategy were chosen through the experimental combination and fuzzy quantified. The output values were input into matrix Z2, as shown in Table 18. The parameters of the matrix were defined as follows.
Player (target)
  • A: Tool wear
  • B: Cutting noise
Strategy planning
  • A-1: Cutting speed is “low”, cutting depth is “high”, and feed rate is “high”. (Rule9)
  • A-2: Cutting speed is “medium”, cutting depth is “medium”, and feed rate is “low”. (Rule13)
  • A-3: Cutting speed is “medium”, cutting depth is “high”, and feed rate is “low”. (Rule16)
  • A-4: Cutting speed is “medium”, cutting depth is “high”, and feed rate is “high”. (Rule18)
  • B-1: Cutting speed is “low”, cutting depth is “high”, and feed rate is “high”. (Rule9)
  • B-2: Cutting speed is “medium”, cutting depth is “medium”, and feed rate is “low”. (Rule13)
  • B-3: Cutting speed is “medium”, cutting depth is “high”, and feed rate is “low”. (Rule16)
  • B-4: Cutting speed is “medium”, cutting depth is “high”, and feed rate is “high”. (Rule18)

4.3.2. Mixed Strategy as the Problem Solver

Since the initial payoff matrix Z2 cannot obtain the equilibrium solution or the approximate equilibrium solution, the cycle repeated continuously in some strategy combinations and a mixed strategy was needed for problem solving. As shown in the simplified payoff matrix Z3 (Table 19), two strategies remained, respectively, in both production quality A and B. However, the values of the strategies were output after fuzzy quantification, the differences of the values couldn’t be distinguished clearly. To solve the problem, the strategy values were restored to the corresponding experimental values, as shown in Table 20. The optimal strategy combination was A1 and B1, as shown in Table 20. The optimal strategy of the two production qualities and its adoption probability are shown in Table 21.

4.3.3. Analysis of the Results of Multi-Quality Optimization

The conflict between production qualities and control parameters was aimed to be solved through the game matrix with the green production issue, which was internationally concerned and was selected as the research target. Multi-quality optimization was obtained through game theory. The optimal strategies of tool wear and cutting noise were, respectively, increasing the cutting depth and decreasing the cutting speed. The optimization obtained was further compared to the median commonly used in the industry, as shown in Table 22. The results of the comparison show that the improvement of the multi-quality cutting problem can indeed be achieved even without the operation of the equipment, and further develop a set of universal green innovative production optimization mechanism, which can provide technical personnel with a set of all-purpose economic prospective parameter analysis methods to stimulate alternative, innovative considerations of the industry.

5. Conclusions

Nowadays, the industrial production design is getting more and more complicated, and with the increasingly demanding machining requirements, the setting of cutting parameters must be extremely strict to prevent changes to some parameters that could influence other production qualities. The most difficult breakthrough of CNC turning was the difficulty in setting the turning parameter. Due to the considerations of cost and time, the quality characteristics were judged by expert experience with a trial and error method, which might cause the doubts of improper use of quality measurement indicators.
Coupled with the environmental awareness and international regulation in recent years, reducing environmental harm in the product design stage avoids being labeled as a high pollution industry and prevents being forced to move or even close down factories. It is necessary for the automated CNC turning industry to use an easy-to-use quality-improving analysis program. In view of the inability of the operators to optimize the turning quality, fuzzy theory was used in the research to define the semantic rule of the relationship between control parameters and production qualities for fuzzy quantification. The output value after quantification was input into game theory to resolve the conflict between control parameters and production qualities for carrying out the game of multi-quality. With the statistic of the strategy probability, the strategy with the highest sum of probability was selected to obtain the multi-quality and multi-strategy optimization.
The results show that, within the parameter combination of multi-quality optimization, compared with the parameter combination recommended in the cutting manual, the tool wear reduced by 23% and the cutting noise reduced by 1%. The cutting problem of multi-quality is indeed improved by the research. In order to enhance the international competitiveness of the automated CNC cutting industry, the method used in the research can further be promoted and applied to the process or other industries.

Author Contributions

Conceptualization, T.-S.L.; Formal Analysis, K.-C.C., T.-S.L., L.-P.Z. and X.-J.D.; Investigation, L.-P.Z., Y.-M.C. and X.-J.D.; Methodology, K.-C.C. and T.-S.L.; Project administration, K.-C.C.; Software, K.-C.C., L.-P.Z. and Y.-M.C.; Validation, K.-C.C. and X.-J.D.; Visualization, Y.-M.C.; Writing-Original Draft, T.-S.L., L.-P.Z. and X.-J.D; Writing-Review & Editing, K.-C.C. and Y.-M.C.

Funding

This research received no external funding.

Acknowledgments

The authors would like to thank for the comments from many reviewers to improve this work.

Conflicts of Interest

The authors declare no conflicts of interest.

References

  1. Lan, T.S.; Chuang, K.C.; Chen, Y.M. Automated Green Innovation for CNC Machining Design. J. Adv. Mech. Eng. 2018, 10, 1–11. [Google Scholar]
  2. Lan, T.S.; Chuang, K.C.; Chen, Y.M. Optimization of Machining Parameters Using Fuzzy Taguchi Method for Reducing Tool Wear. J. Appl. Sci. 2018, 8, 1011. [Google Scholar] [CrossRef]
  3. Lan, T.S.; Chuang, K.C.; Chen, Y.M. Optimal Production Parameters under Considerations of Noise Using Fuzzy Taguchi Method. In Proceedings of the 4th IEEE International Conference on Applied System Innovation, Chiba, Japan, 13–17 April 2018; pp. 354–357. [Google Scholar]
  4. Zhang, L.; Zhang, B.; Hong, B.; Huang, H.H. Optimization of Cutting Parameters for Minimizing Environmental Impact: Considering Energy Efficiency, Noise Emission and Economic Dimension. J. Precis. Eng. Manuf. 2018, 19, 613–624. [Google Scholar] [CrossRef]
  5. Hossein, K.A.E.; Kops, N. Investigation on the use of cutting temperature and tool wear in the turning of mild steel bars. J. Mech. Eng. Sci. 2017, 11, 3038–3045. [Google Scholar] [CrossRef]
  6. Schultheiss, F.; Zhou, J.; Gröntoft, E.; Ståhl, J.E. Sustainable machining through increasing the cutting tool utilization. J. Clean. Prod. 2013, 59, 298–307. [Google Scholar] [CrossRef]
  7. Weng, Y.Z. Multi-Objective Optimization of CNC Turning Parameters Using Fuzzy Analysis. Master’s Thesis, Tatung University, Taipei City, Taiwan, 2007. [Google Scholar]
  8. Li, Y.; Wang, H.P.; Wang, F.Y. Multi-objective Design of Process Parameter Based On Game Theory. J. Appl. Mech. Mater. 2011, 121–126, 964–967. [Google Scholar] [CrossRef]
  9. Zhou, G.; Lu, Q.; Xiao, Z.; Zhou, C.; Tian, C. Cutting parameter optimization for machining operations considering carbon emissions. J. Clean. Prod. 2019, 208, 937–950. [Google Scholar] [CrossRef]
  10. Tian, C.; Zhou, G.; Zhang, J.; Zhang, C. Optimization of cutting parameters considering tool wear conditions in low-carbon manufacturing environment. J. Clean. Prod. 2019, 226, 706–719. [Google Scholar] [CrossRef]
  11. Hung, L.T. Cutting Tool Science (Revised Edition); Chuan-Hwa Book Co., Ltd.: Taipei City, Taiwan, 2016. [Google Scholar]
  12. Chiu, M.C.; Lan, T.S. Noise control Theory and engineering design; Wu-Nan Book Inc.: Taipei City, Taiwan, 2014. [Google Scholar]
  13. Zadeh, L.A. Fuzzy sets. Inf. Control. 1965, 8, 338–353. [Google Scholar] [CrossRef]
  14. Chiu, T.Y. Micro-environment Control by Using Fuzzy Theory. Master’s Thesis, National Chung Hsing University, Taichung City, Taiwan, 2015. [Google Scholar]
  15. Chen, S.Y. A Comparative Study of Allocation of Projects Benefit with Cooperative Game Theory. Master’s Thesis, National UNITED University, Miaoli County, Taiwan, 2015. [Google Scholar]
  16. Lan, C.H. Construction of Deduction Fuzzy Optimization System for Multiple-quality Production Using TRIZ and Game Theory. Master’s Thesis, Yu Da University, Miaoli County, Taiwan, 2008. [Google Scholar]
  17. Shapley, L.S. A Value for n-Person Games. Contributions to the Theory of Games Volume II; Kuhn, H.W., Tucker, A.W., Eds.; Princeton University Press: Princeton, NJ, USA, 1953. [Google Scholar]
  18. Gao, Y.; Li, Z.; Wang, F.; Wang, F.; Tan, R.R.; Bi, J.; Jia, X. A game theory approach for corporate environmental risk mitigation. J. Resour. Conserv. Recycl. 2018, 130, 240–247. [Google Scholar] [CrossRef]
  19. Nash, J. The Bargaining Problem. J. Econom. 1950, 18, 155–162. [Google Scholar] [CrossRef]
  20. Rubinstein, A. Perfect Equilibrium in a Bargaining Model. J. Econom. 1982, 50, 97–109. [Google Scholar] [CrossRef]
  21. Liu, T.; Deng, Y.; Chan, F. Evidential Supplier Selection Based on DEMATEL and Game Theory. J. Fuzzy Syst. 2018, 20, 1321–1333. [Google Scholar] [CrossRef]
  22. Marzband, M.; Javadi, M.; Pourmousavi, S.A.; Lightbody, G. An advanced retail electricity market for active distribution systems and home microgrid interoperability based on game theory. J. Electr. Power Syst. Res. 2018, 157, 187–199. [Google Scholar] [CrossRef]
  23. Rasmusen, E. Games and Information: An Introduction to Game Theory; Blackwell Publishers: Hoboken, NJ, USA, 1989. [Google Scholar]
  24. Tsiropoulou, E.E.; Kapoukakis, A.; Papavassiliou, S.J. Energy-efficient subcarrier allocation in SC-FDMA wireless networks based on multilateral model of bargaining. In Proceedings of the 2013 IFIP Networking Conference, Brooklyn, NY, USA, 22–24 May 2013. [Google Scholar]
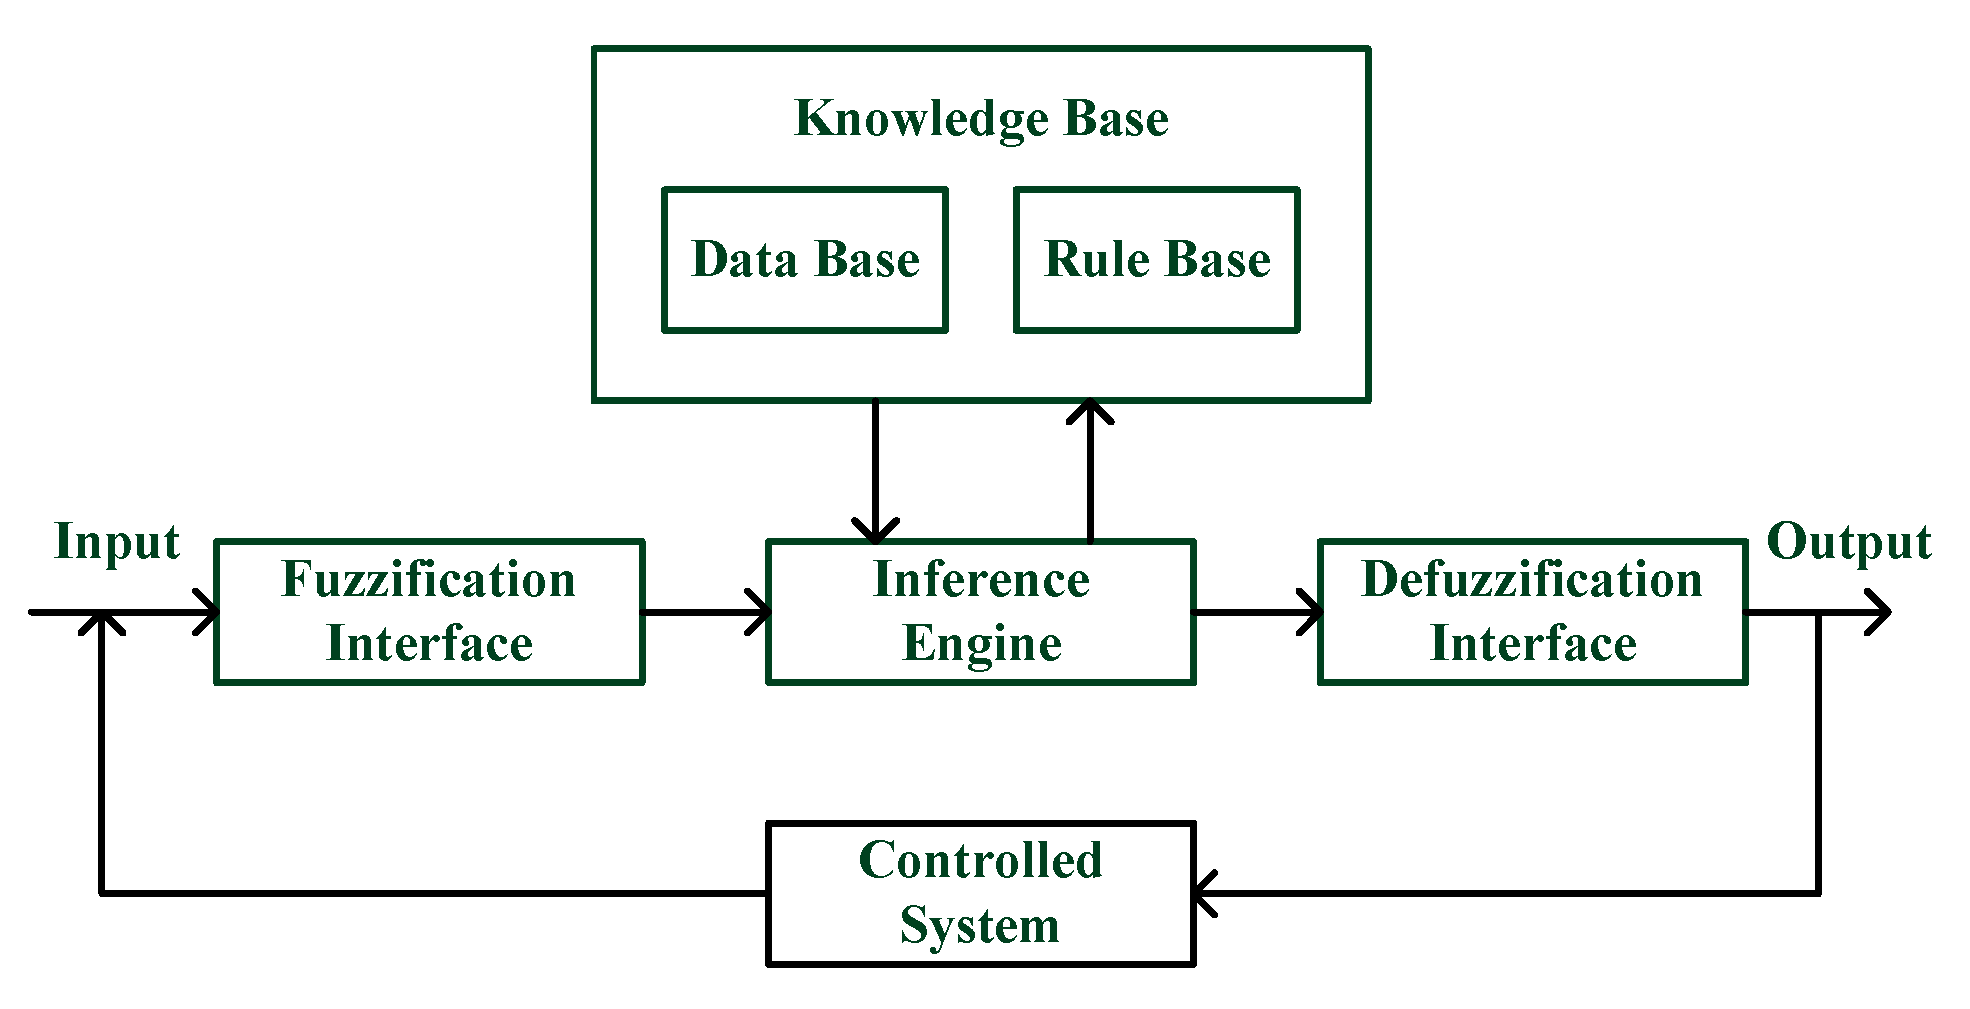
Figure 1. Architecture of fuzzy logic control.
Symmetry 11 01450 g001
Figure 2. Degree of membership of the cutting speed.
Symmetry 11 01450 g002
Figure 3. Degree of membership of the cutting depth.
Symmetry 11 01450 g003
Figure 4. Degree of membership of the feed rate.
Symmetry 11 01450 g004
Figure 5. Degree of membership of output variables.
Symmetry 11 01450 g005
Table 1. Four main types of game.
Perfect InformationImperfect Information
StaticNash EquilibriumBayesian Nash Equilibrium
DynamicSub-dame Perfect Nash EquilibriumPerfect Bayesian Nash Equilibrium
Table 2. Tool wear fuzzy rule table.
ParameterCutting SpeedCutting DepthFeed RateTool Wear Rate
Rule
1lowlowlowhigh
2lowlowmoderatemaximum
3lowlowhighhigh
4lowmoderatelowmoderate
5lowmoderatemoderatehigh
6lowmoderatehighhigh
7lowhighlowminimum
8lowhighmoderateminimum
9lowhighhighlow
10moderatelowlowmaximum
11moderatelowmoderatemaximum
12moderatelowhighmaximum
13moderatemoderatelowmoderate
14moderatemoderatemoderatemoderate
15moderatemoderatehighhigh
16moderatehighlowlow
17moderatehighmoderateminimum
18moderatehighhighlow
19highlowlowhigh
20highlowmoderatemaximum
21highlowhighmaximum
22highmoderatelowmoderate
23highmoderatemoderatelow
24highmoderatehighlow
25highhighlowlow
26highhighmoderateminimum
27highhighhighlow
Table 3. Cutting noise fuzzy rule table.
ParameterCutting SpeedCutting DepthFeed RateCutting Noise
Rule
1lowlowlowminimum
2lowlowmoderateminimum
3lowlowhighlow
4lowmoderatelowminimum
5lowmoderatemoderatelow
6lowmoderatehighmoderate
7lowhighlowlow
8lowhighmoderatelow
9lowhighhighlow
10moderatelowlowmoderate
11moderatelowmoderatemoderate
12moderatelowhighmoderate
13moderatemoderatelowlow
14moderatemoderatemoderatehigh
15moderatemoderatehighhigh
16moderatehighlowmoderate
17moderatehighmoderatemoderate
18moderatehighhighmoderate
19highlowlowmaximum
20highlowmoderatemaximum
21highlowhighmaximum
22highmoderatelowmaximum
23highmoderatemoderatemaximum
24highmoderatehighmaximum
25highhighlowmaximum
26highhighmoderatemaximum
27highhighhighmaximum
Table 4. Input membership values of cutting speed.
Fuzzy Term01.252.53.755
Low10.5000
Medium00.510.50
High0000.51
Table 5. Input membership values of cutting depth.
Fuzzy Term01.252.53.755
Low10.5000
Medium00.510.50
High0000.51
Table 6. Input membership values of feed rate.
Fuzzy Term01.252.53.755
Low10.5000
Medium00.510.50
High0000.51
Table 7. Output membership values.
No.MinimalSmallModerateLargeGreatest
010000
10.840000
20.680000
30.520000
40.360000
50.20.04000
60.040.2000
700.36000
800.52000
900.84000
1001000
1100.68000
1200.52000
1300.36000
1400.20.0400
1500.040.200
16000.3600
17000.5200
18000.6800
19000.8400
2000100
21000.8400
22000.6800
23000.5200
24000.3600
25000.200
26000.040.040
270000.20
280000.360
290000.520
300000.680
310000.840
3200010
330000.840
340000.680.04
350000.520.2
360000.360.36
370000.20.52
380000.040.68
3900000.84
4000001
Table 8. Test data of tool wear.
Cutting Speed
(m/min)
Depth of Cut
(mm)
Feed Rate
(mm/rev)
Tool Nose Runoff
(mm)
Tool Wear
(μm−2)
22224.38
32214.13
32223.87
12214.21
23222.97
12234.13
22114.38
22214.04
21334.13
12134.55
13323.38
Table 9. Test data of cutting noise.
Cutting Speed
(m/min)
Depth of Cut
(mm)
Feed Rate
(mm/rev)
Tool Nose Runoff
(mm)
Cutting Noise
(dB)
222282.83
122281.73
322285.97
212282.61
232282.91
221282.55
223282.93
222182.79
222382.81
111181.5
133281.94
Table 10. Initial payoff matrix Z1.
B
B-1B-2B-3B-4
AA-1
A-2
A-3
A-4
Table 11. Payoff matrix Z2.
B
B-1B-2B-3B-4
AA-1(Pa1,Pb1)(Pa2,Pb2)(Pa3,Pb3)(Pa4,Pb4)
A-2(Pa5,Pb5)(Pa6,Pb6)(Pa7,Pb7)(Pa8,Pb8)
A-3(Pa9,Pb9)(Pa10,Pb10)(Pa11,Pb11)(Pa12,Pb12)
A-4(Pa13,Pb13)(Pa14,Pb14)(Pa15,Pb15)(Pa16,Pb16)
Pa: the payoff value of quality A under different situation; Pb: the payoff value of quality B under different situation.
Table 12. Simplified payoff matrix Z3.
B
B-1B-2
AA-1(Pa1,Pb1)(Pa2,Pb2)
A-2(Pa3,Pb3)(Pa4,Pb4)
Table 13. Optimal multi-quality and multi-strategy strategies.
PlayerOptimal StrategyAdoption Probability (%)
Tool wear (S)
Cutting noise (Z)
Table 14. Cutting parameters.
Control ParameterLevel 1Level 2Level 3
A: Depth of cut (mm)0.511.5
B: Cutting speed (m/min)150200250
C: Feed rate (mm/rev)0.020.060.1
D: Tool nose runoff (mm)−0.1±0.030.1
Table 15. Median values of tool wear.
Cutting Speed
(m/min)
Depth of Cut
(mm)
Feed Rate
(mm/rev)
Tool Nose Runoff
(mm)
Tool Wear
(μm−2)
20010.06±0.034.38
Table 16. Median values of cutting noise.
Cutting Speed
(m/min)
Depth of Cut
(mm)
Feed Rate
(mm/rev)
Tool Nose Runoff
(mm)
Cutting Noise
(dB)
20010.06±0.0382.83
Table 17. Data of single quality optimization.
Tool WearCutting Speed
(m/min)
Depth of Cut
(mm)
Feed Rate
(mm/rev)
Tool Nose Runoff
(mm)
(μm−2)
Cutting speed25010.06±0.033.87
Depth of cut2001.50.06±0.032.97
Feed rate20010.02±0.034.55
Median20010.06±0.034.38
Cutting NoiseCutting Speed
(m/min)
Depth of Cut
(mm)
Feed Rate
(mm/rev)
Tool Nose Runoff
(mm)
(dB)
Cutting speed15010.06±0.0381.73
Depth of cut2000.50.06±0.0382.61
Feed rate20010.02±0.0382.55
Median20010.06±0.0382.83
Table 18. Multi-quality payoff matrix Z2.
B
B-1B-2B-3B-4
AA-1(9.966,9.966)(9.966,9.966)(9.966,20)(9.966,20)
A-2(20,9.966)(20,9.966)(20,20)(20,20)
A-3(9.966,9.966)(9.966,9.966)(9.966,20)(9.966,20)
A-4(1.769,9.966)(1.769,9.966)(1.769,20)(1.769,20)
Table 19. Simplified multi-quality payoff matrix Z3.
B
B-1B-2
AA-1(9.966,9.966)(9.966,9.966)
A-3(9.966,9.966)(9.966,9.966)
Table 20. Restored data of simplified payoff matrix Z3.
B
B-1B-2
AA-1(3.38,81.94)(3.38,82.55)
A-3(4.38,81.94)(4.38,82.55)
Table 21. Multi-quality optimization.
PlayerOptimal StrategyAdoption Probability (%)
Tool wear (S)Increasing the cutting depth100
Cutting noise (Z)Reducing the cutting speed100
Table 22. Comparison of multi-quality optimization and median data.
Cutting Speed
(m/min)
Depth of Cut
(mm)
Feed Rate
(mm/rev)
Tool Nose Runoff
(mm)
Comparison
Multi-Quality Optimization1501.50.1±0.03Tool wear3.38 (μm−2)
Cutting noise81.94 (dB)
Median20010.06±0.03Tool wear4.38 (μm−2)
Cutting noise82.83 (dB)