Chiroptical Symmetry Analysis of Trianglimines: A Case Study

 , ,
, ,  and
and
Abstract
1. Introduction
2. Materials and Methods
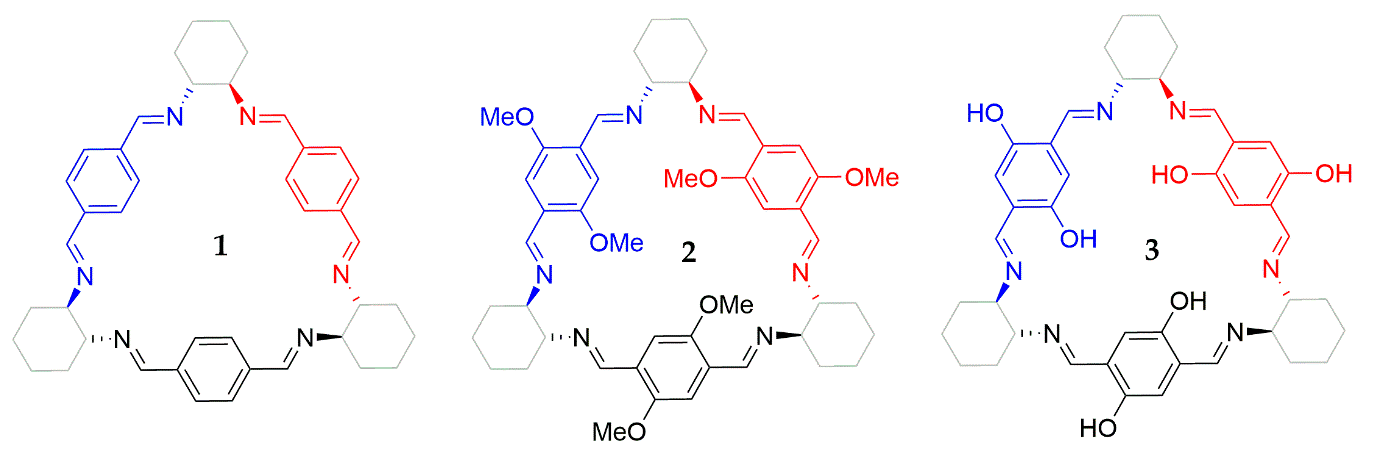
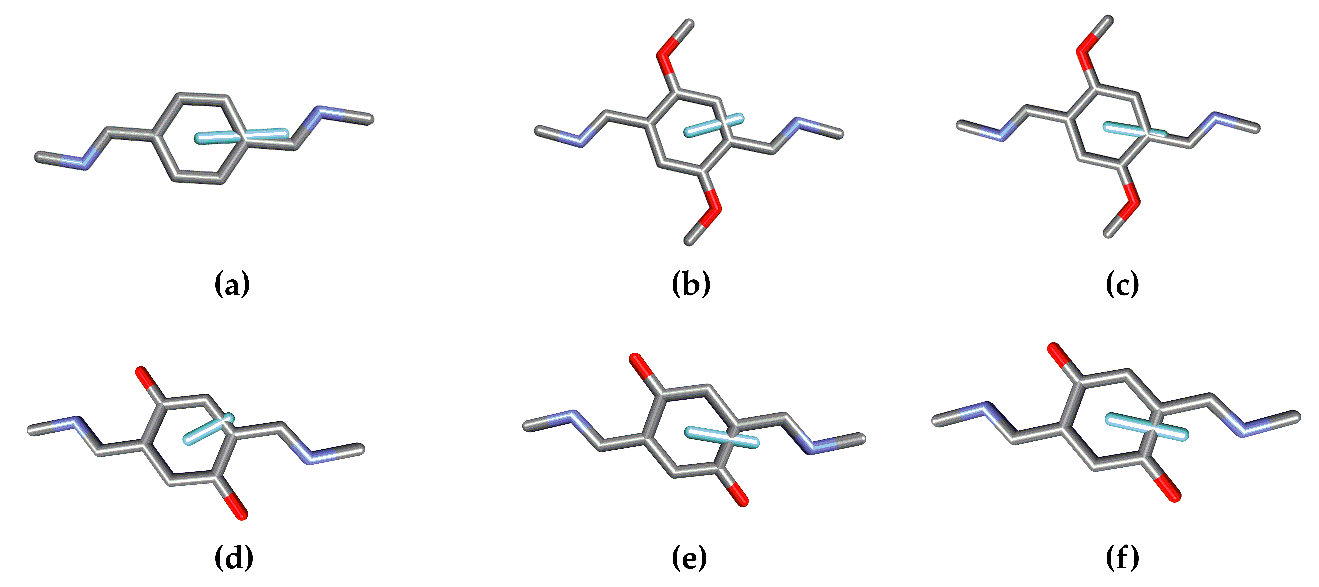
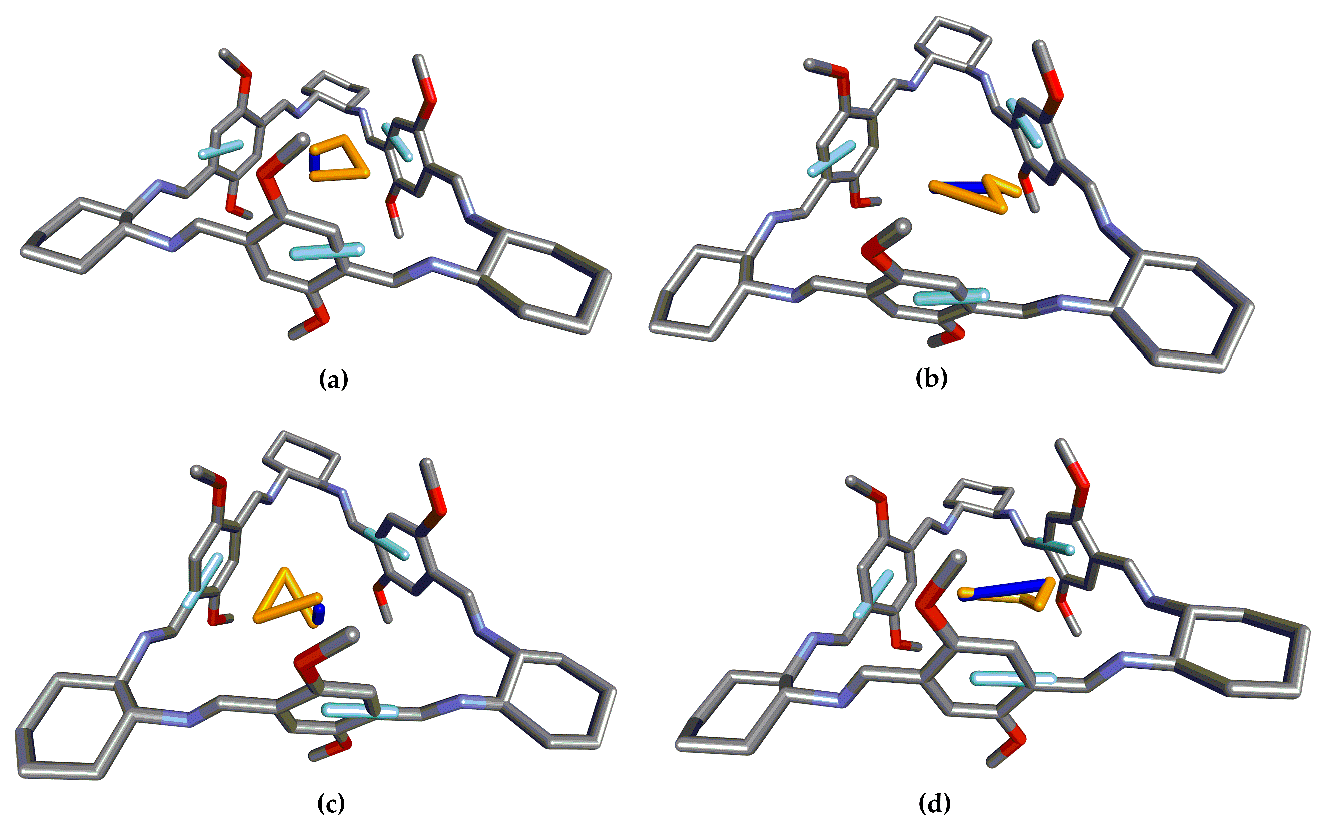
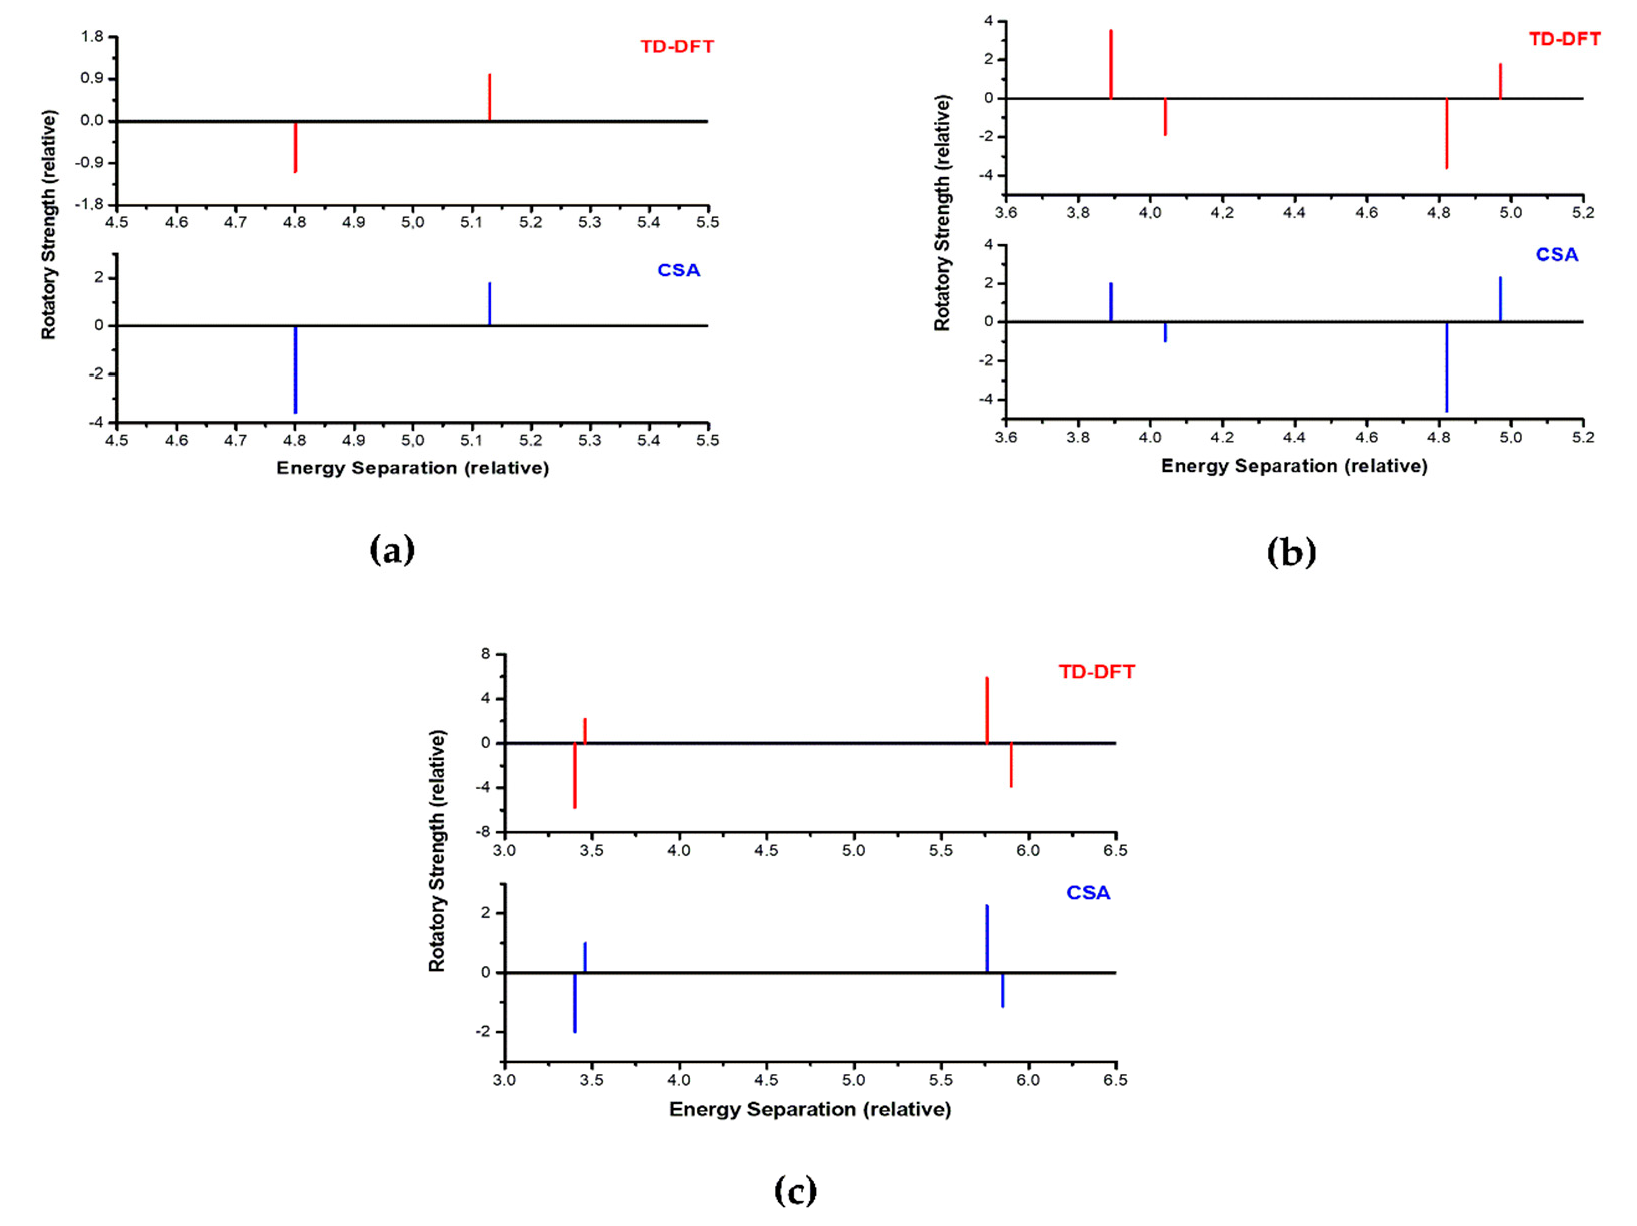
3. Results
3.1. Structure 1
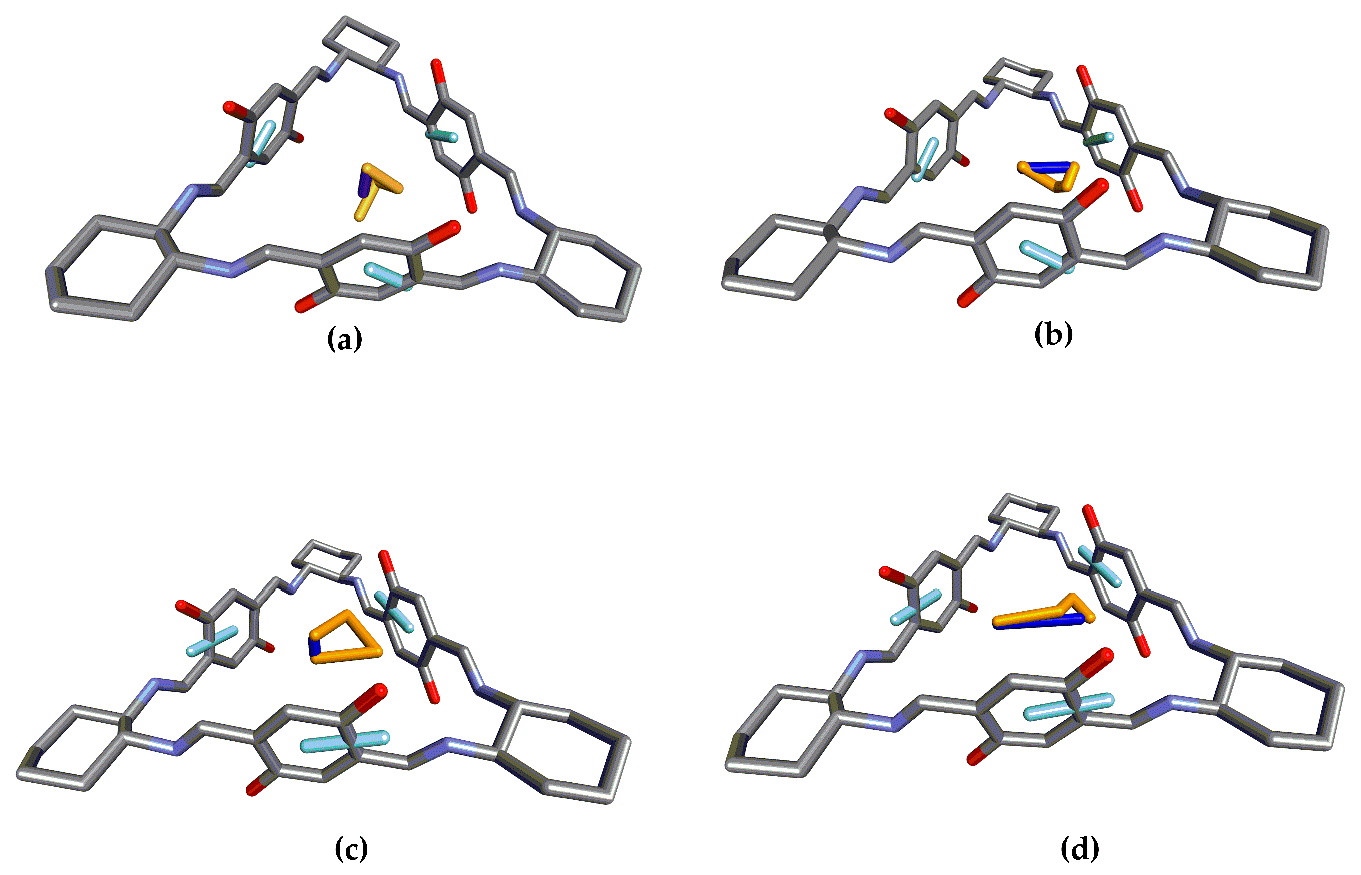
3.2. Structure 2
3.3. Structure 3
4. Discussion
5. Conclusions
Supplementary Materials
Author Contributions
Funding
Acknowledgments
Conflicts of Interest
References
- Barron, L.D. Molecular Light Scattering and Optical Activity; Cambridge University Press: New York, NY, USA, 2004. [Google Scholar]
- Cheng, J.; Le Saux, G.; Gao, J.; Buffeteau, T.; Battie, Y.; Barois, P.; Ponsinet, V.; Delville, M.-H.; Ersen, O.; Pouget, E.; et al. GoldHelix: Gold Nanoparticles Forming 3D Helical Superstructures with Controlled Morphology and Strong Chiroptical Property. ACS Nano 2017, 11, 3806–3818. [Google Scholar] [CrossRef] [PubMed]
- Navakouski, M.; Zhylitskaya, H.; Chmielewski, P.J.; Lis, T.; Cybińska, J.; Stępień, M. Stereocontrolled Synthesis of Chiral Heteroaromatic Propellers with Small Optical Bandgaps. Angew. Chem. Int. Ed. 2019, 58, 4929–4933. [Google Scholar] [CrossRef] [PubMed]
- Berova, N. Wiley InterScience (Online service). In Comprehensive Chiroptical Spectroscopy. Volume 1, Instrumentation, Methodologies, and Theoretical Simulations; John Wiley & Sons: Hoboken, NJ, USA, 2012. [Google Scholar]
- Petrovic, A.G.A.G.; Navarro-Vázquez, A.; Alonso-Gómez, J.L.J.L.; Navarro-Vazquez, A.; Alonso-Gomez, J.L. From Relative to Absolute Configuration of Complex Natural Products: Interplay Between NMR, ECD, VCD, and ORD Assisted by ab initio Calculations. Curr. Org. Chem. 2010, 14, 1612–1628. [Google Scholar] [CrossRef]
- Berova, N.; Di Bari, L.; Pescitelli, G. Application of electronic circular dichroism in configurational and conformational analysis of organic compounds. Chem. Soc. Rev. 2007, 36, 914–931. [Google Scholar] [CrossRef] [PubMed]
- Kelly, T.R.; De Silva, H.; Silva, R.A. Unidirectional rotary motion in a molecular system. Nature 1999, 401, 150–152. [Google Scholar] [CrossRef] [PubMed]
- Zsila, F. Circular Dichroism Spectroscopy Is a Sensitive Tool for Investigation of Bilirubin−Enzyme Interactions. Biomacromolecules 2011, 12, 221–227. [Google Scholar] [CrossRef] [PubMed]
- Alonso-Gómez, J.L.J.L.; Rivera-Fuentes, P.; Harada, N.; Berova, N.; Diederich, F. An enantiomerically pure alleno-acetylenic macrocycle: Synthesis and rationalization of its outstanding chiroptical response. Angew. Chem. Int. Ed. 2009, 48, 5545–5548. [Google Scholar] [CrossRef] [PubMed]
- Castro-Fernández, S.; Yang, R.; García, A.P.; Garzón, I.L.; Xu, H.; Petrovic, A.G.; Alonso-Gómez, J.L. Diverse Chiral Scaffolds from Diethynylspiranes: All-Carbon Double Helices and Flexible Shape-Persistent Macrocycles. Chem. Eur. J. 2017, 23, 11747–11751. [Google Scholar] [CrossRef] [PubMed]
- Ozcelik, A.; Pereira-Cameselle, R.; Von Weber, A.; Paszkiewicz, M.; Carlotti, M.; Paintner, T.; Zhang, L.; Lin, T.; Zhang, Y.-Q.; Barth, J.V.V.; et al. Device-Compatible Chiroptical Surfaces through Self-Assembly of Enantiopure Allenes. Langmuir 2018, 34, 4548–4553. [Google Scholar] [CrossRef] [PubMed]
- Pescitelli, G.; Di Bari, L.; Berova, N.; El-Hachemi, Z.; Naubron, J.-V.; Balaban, T.S.; Bussotti, L.; Atsbeha, T.; Marcelli, A.; Foggi, P.; et al. Application of electronic circular dichroism in the study of supramolecular systems. Chem. Soc. Rev. 2014, 43, 5211–5233. [Google Scholar] [CrossRef] [PubMed]
- Polavarapu, P.L. Chiroptical Spectroscopy: Fundamentals and Applications; CRC Press: Boca Raton, FL, USA, 2016. [Google Scholar]
- Jiemchooroj, A.; Norman, P. Electronic circular dichroism spectra from the complex polarization propagator. J. Chem. Phys. 2007, 126, 134102. [Google Scholar] [CrossRef] [PubMed]
- Bannwarth, C.; Grimme, S. A simplified time-dependent density functional theory approach for electronic ultraviolet and circular dichroism spectra of very large molecules. Comput. Theor. Chem. 2014, 1040–1041, 45–53. [Google Scholar] [CrossRef]
- Harada, N.; Nakanishi, K. Exciton chirality method and its application to configurational and conformational studies of natural products. Acc. Chem. Res. 1972, 5, 257–263. [Google Scholar] [CrossRef]
- Berova, N.; Pescitelli, G.; Petrovic, A.G.; Proni, G. Probing molecular chirality by CD-Sensitive dimeric metalloporphyrin hosts. Chem. Commun. 2009, 5958–5980. [Google Scholar] [CrossRef] [PubMed]
- Harada, N.; Nakanishi, K. Circular Dichroic Spectroscopy Exciton Coupling in Organic Stereochemistry; University Science Books: Mill Valley, CA, USA, 1983. [Google Scholar]
- Gropp, C.; Trapp, N.; Diederich, F. Alleno-Acetylenic Cage (AAC) Receptors: Chiroptical Switching and Enantioselective Complexation of trans-1,2-Dimethylcyclohexane in a Diaxial Conformation. Angew. Chem. Int. Ed. 2016, 55, 14444–14449. [Google Scholar] [CrossRef]
- Castro-Fernández, S.; Peña-Gallego, Á.; Mosquera, R.A.; Alonso-Gómez, J.L. Chiroptical symmetry analysis: Exciton Chirality-Based formulae to understand the chiroptical responses of Cn and Dn symmetric systems. Molecules 2019, 24, 141. [Google Scholar] [CrossRef] [PubMed]
- Szymkowiak, J.; Kwit, M. Electronic and vibrational exciton coupling in oxidized trianglimines. Chirality 2018, 30, 117–130. [Google Scholar] [CrossRef] [PubMed]
- Frisch, M.J.; Trucks, G.W.; Schlegel, H.B.; Scuseria, G.E.; Robb, M.A.; Cheeseman, J.R.; Scalmani, G.; Barone, V.; Petersson, G.A.; Nakatsuji, H.; et al. Gaussian 09, Revision D.01; Gaussian, Inc.: Wallingford, CT, USA, 2013. [Google Scholar]
- Yanai, T. A new hybrid exchange? correlation functional using the Coulomb-attenuating method (CAM-B3LYP). Chem. Phys. Lett. 2004, 393, 51–57. [Google Scholar] [CrossRef]
- Zara, Z.; Iqbal, J.; Ayub, K.; Irfan, M.; Mahmood, A.; Khera, R.A.; Eliasson, B. A comparative study of DFT calculated and experimental UV/Visible spectra for thirty carboline and carbazole based compounds. J. Mol. Struct. 2017, 1149, 282–298. [Google Scholar] [CrossRef]
- Jurinovich, S.; Pescitelli, G.; Di Bari, L.; Mennucci, B. A TDDFT/MMPol/PCM model for the simulation of exciton-coupled circular dichroism spectra. Phys. Chem. Chem. Phys. 2014, 16, 16407–16418. [Google Scholar] [CrossRef]


| Structure | R12 | ω | θ | V12 |
|---|---|---|---|---|
| 1 1 | 12.3 bohr | 13.8° | 29.1° | 0.11 eV |
| 1 | 12.3 bohr | 90° | 77.7° | 0.11 eV |
| Structure | Splitting CSA/TD-DFT | Module of EDTM CSA/TD-DFT | Rotatory Strength CSA/TD-DFT |
|---|---|---|---|
| 11 | -/4.8026 eV | -/2.54 | -/- |
| 12 | 0.22/0.20 | 3 1.8:3.1/1.7:3.1 | 3 −334:334/−272:448 |
| 1 | 0.33/0.31 | 0.6:2.0/0.2:3.4 | 4 −1190/595/−363:332 |
| Structure | R12 | ω | Θ | V12/eV |
|---|---|---|---|---|
| 2.1 | 12.4 bohr | 90° | 99.7° | 0.05 eV |
| 2.2 | 12.4 bohr | 90° | 74.4° | 0.05 eV |
| Structure | Splitting CSA/TD-DFT | Module of EDTM CSA/TD-DFT | Rotatory Strength CSA/TD-DFT |
|---|---|---|---|
| 2.1 1 | -/3.8879 eV | -/1.75 | -/- |
| 2.1 | 0.15/0.15 | 3 0.6:1.7/0.6:2.26 | 3 368:−184/649:−349 |
| 2.2 2 | -/4.8181 eV | -/1.91 | -/- |
| 2.2 | 0.15/0.15 | 3 0.8:1.6/0.58:2.57 | 3 −847:423/−665:325 |
| Structure | R12 | ω | Θ | V12/eV |
|---|---|---|---|---|
| 3.1 | 12.4 bohr | 90° | 77° | 0.02 eV |
| 3.2 | 12.4 bohr | 90° | c.a. 90° | 0.04 eV |
| 3.3 | 12.4 bohr | 90° | 94° | 0.03 eV |
| Structure | Splitting CSA/TD-DFT | Module of EDTM CSA/TD-DFT | Rotatory Strength CSA/TD-DFT |
|---|---|---|---|
| 3.1 1 | -/3.4007 eV | -/1.41 | -/- |
| 3.1 | 0.06/0.06 | 3 1.3:1.0/1.09:1.50 | 3 −276:138/−801:304 |
| 3.3 2 | -/5.7592 eV | -/2.05 | -/- |
| 3.3 | 0.09/0.14 | 3 0.6:1.7/0.6:2.69 | 3 313:−157/813:−535 |
© 2019 by the authors. Licensee MDPI, Basel, Switzerland. This article is an open access article distributed under the terms and conditions of the Creative Commons Attribution (CC BY) license (http://creativecommons.org/licenses/by/4.0/).
Share and Cite
Ozcelik, A.; Pereira-Cameselle, R.; Mosquera, R.A.; Peña-Gallego, Á.; Alonso-Gómez, J.L. Chiroptical Symmetry Analysis of Trianglimines: A Case Study. Symmetry 2019, 11, 1245. https://doi.org/10.3390/sym11101245
Ozcelik A, Pereira-Cameselle R, Mosquera RA, Peña-Gallego Á, Alonso-Gómez JL. Chiroptical Symmetry Analysis of Trianglimines: A Case Study. Symmetry. 2019; 11(10):1245. https://doi.org/10.3390/sym11101245
Chicago/Turabian StyleOzcelik, Ani, Raquel Pereira-Cameselle, Ricardo A. Mosquera, Ángeles Peña-Gallego, and J. Lorenzo Alonso-Gómez. 2019. "Chiroptical Symmetry Analysis of Trianglimines: A Case Study" Symmetry 11, no. 10: 1245. https://doi.org/10.3390/sym11101245
APA StyleOzcelik, A., Pereira-Cameselle, R., Mosquera, R. A., Peña-Gallego, Á., & Alonso-Gómez, J. L. (2019). Chiroptical Symmetry Analysis of Trianglimines: A Case Study. Symmetry, 11(10), 1245. https://doi.org/10.3390/sym11101245