A Novel Approach for Evaluation of Projects Using an Interval–Valued Fuzzy Additive Ratio Assessment (ARAS) Method: A Case Study of Oil and Gas Well Drilling Projects

 , ,
, , 
Abstract
1. Introduction
2. Literature Review
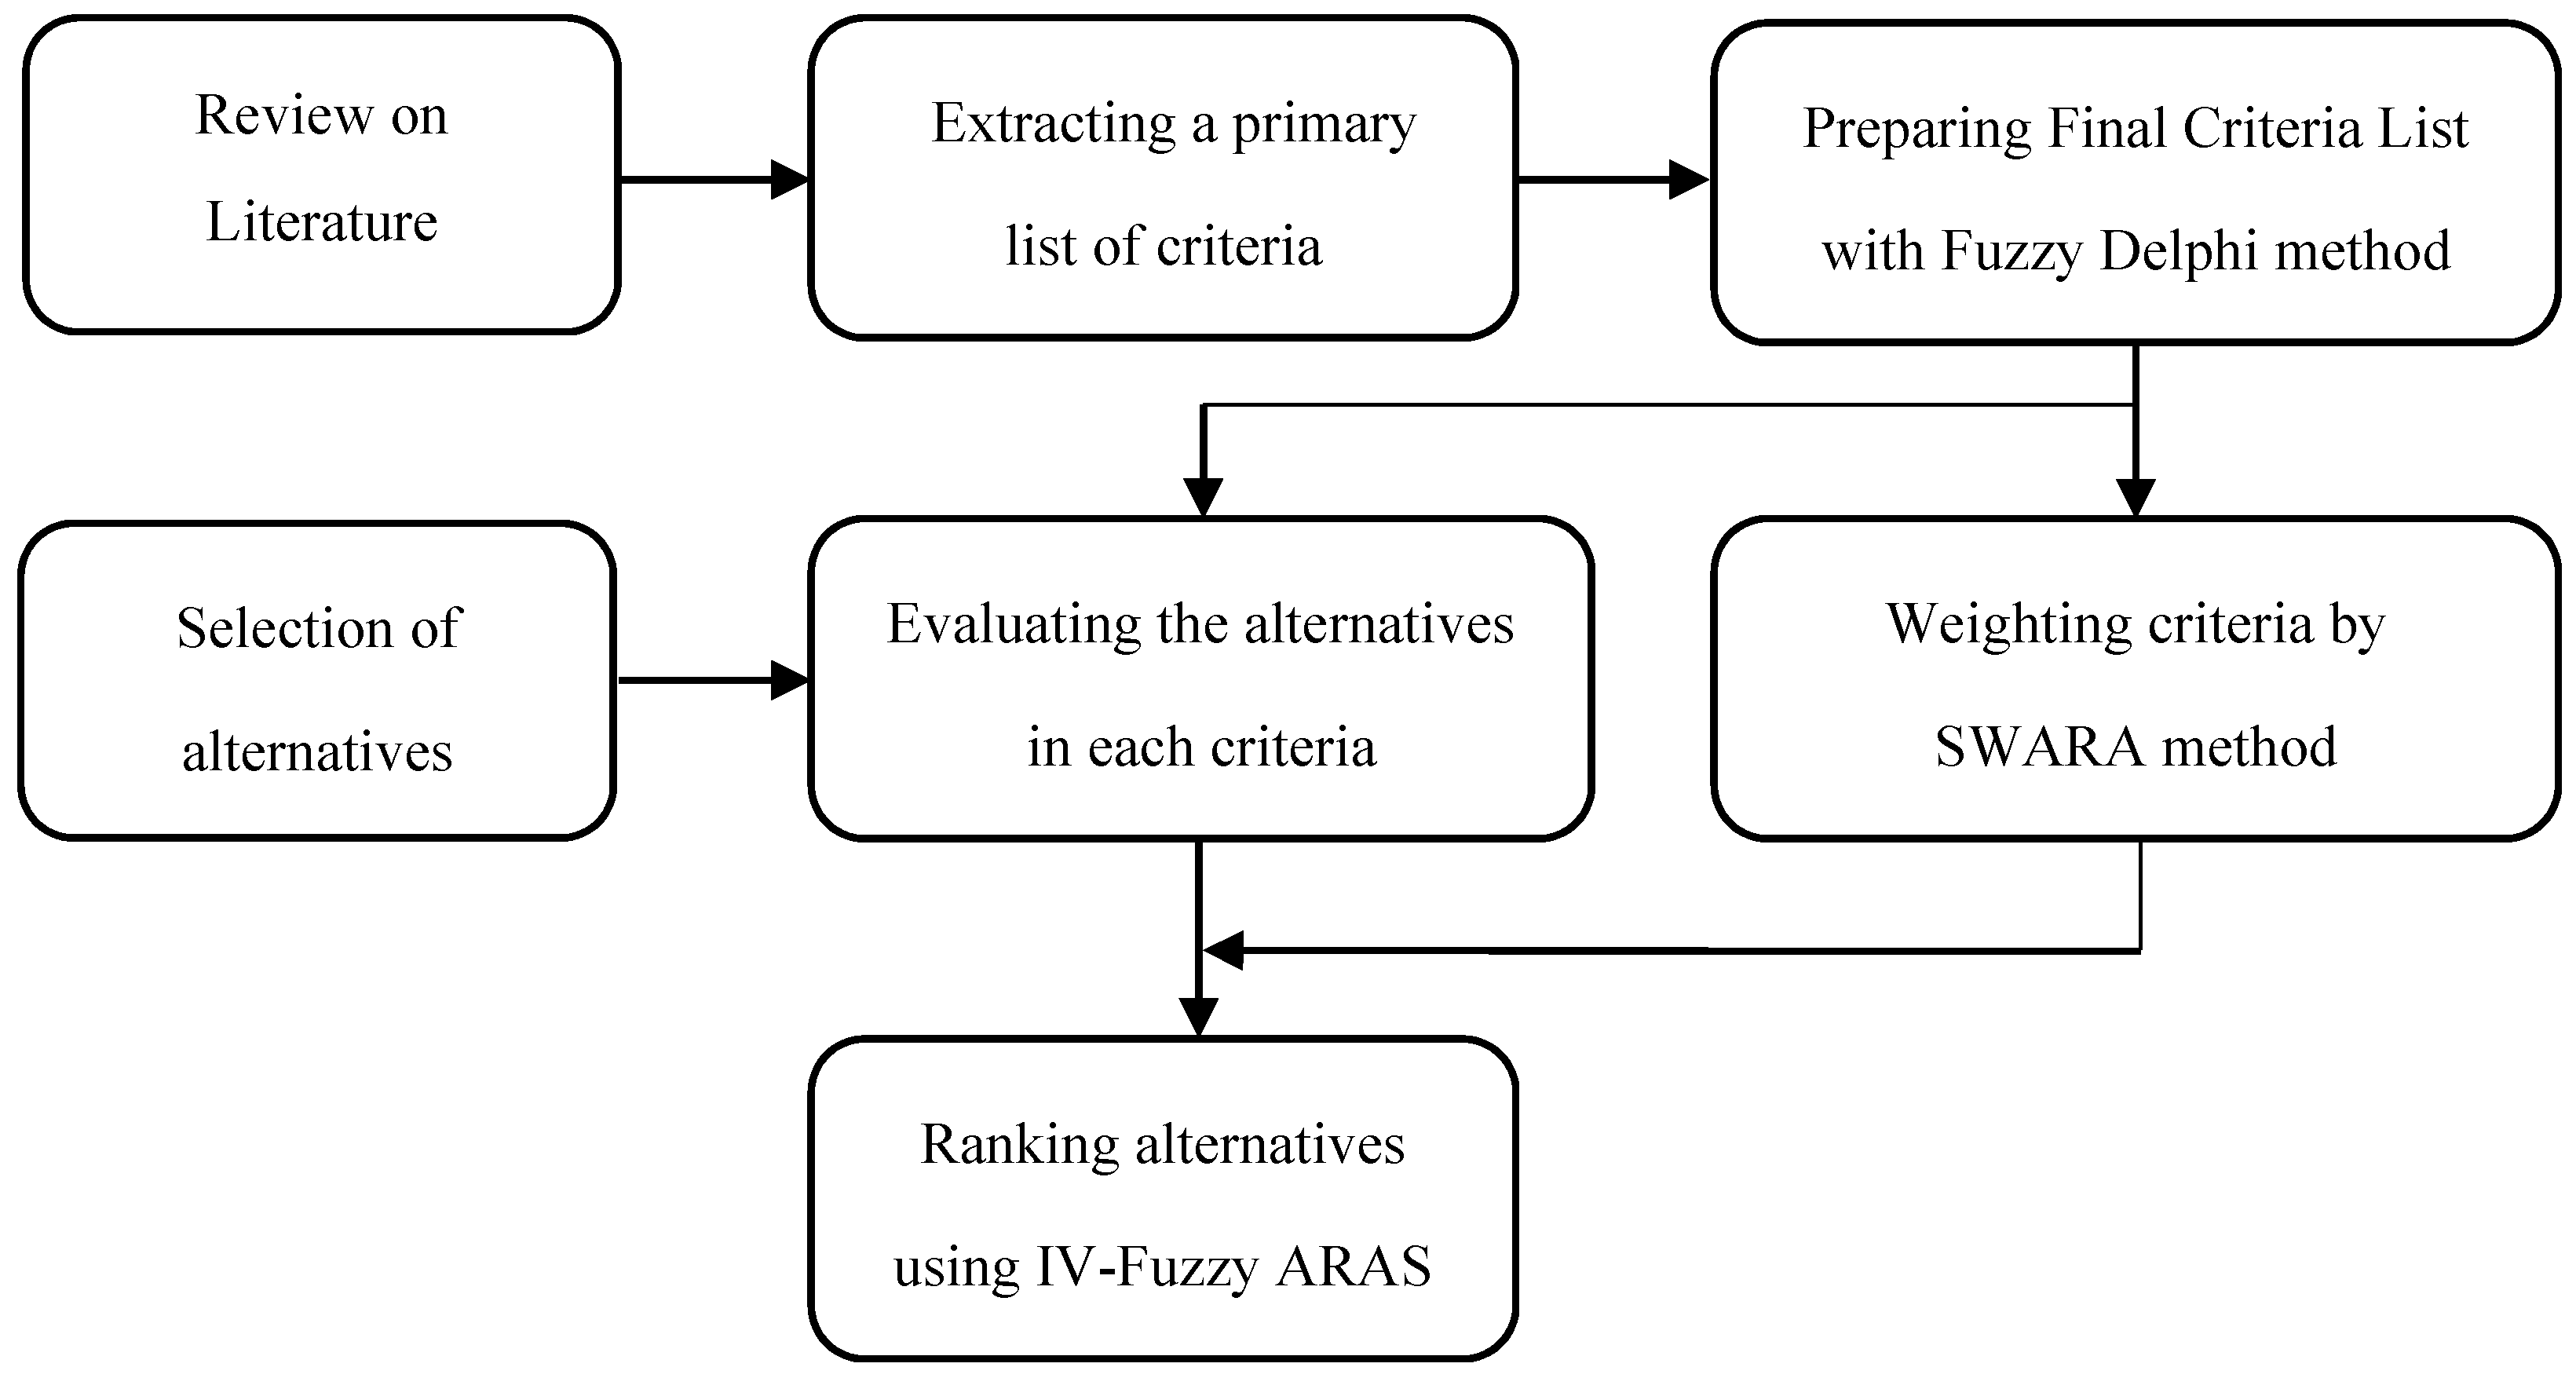
3. Research Methodology
3.1. Fuzzy Delphi Method
3.2. SWARA Method
- -
- Step 1: Rank Criteria—First, the criteria determined by decision-makers are selected as the final criteria and then all the criteria are ranked in order of their importance. Accordingly, the most/least important criteria take the highest/lowest position of ranking.
- -
- Step 2: Determine Relative Importance for Criteria ()—Now, the relative importance of each criterion is measured against the most important criterion. This value is represented by .
- -
- Step 3: Calculate Coefficient Value of —As a function of the relative importance for each criterion, the coefficient is determined using Equation (3).
- -
- Step 4: Calculate Initial Weights for Criteria—In this step, the initial weights of each criterion are calculated by Equation (4). Note that the initial weight for the first—i.e., the most important—criterion is generally considered equal to 1 ().
- -
- Step 5: Calculate Final Normalized Weights—As the final step of SWARA, the final weights which is also known as the normalized weights are determined by Equation (5).
3.3. Interval-Valued Fuzzy Additive Ratio Assessment
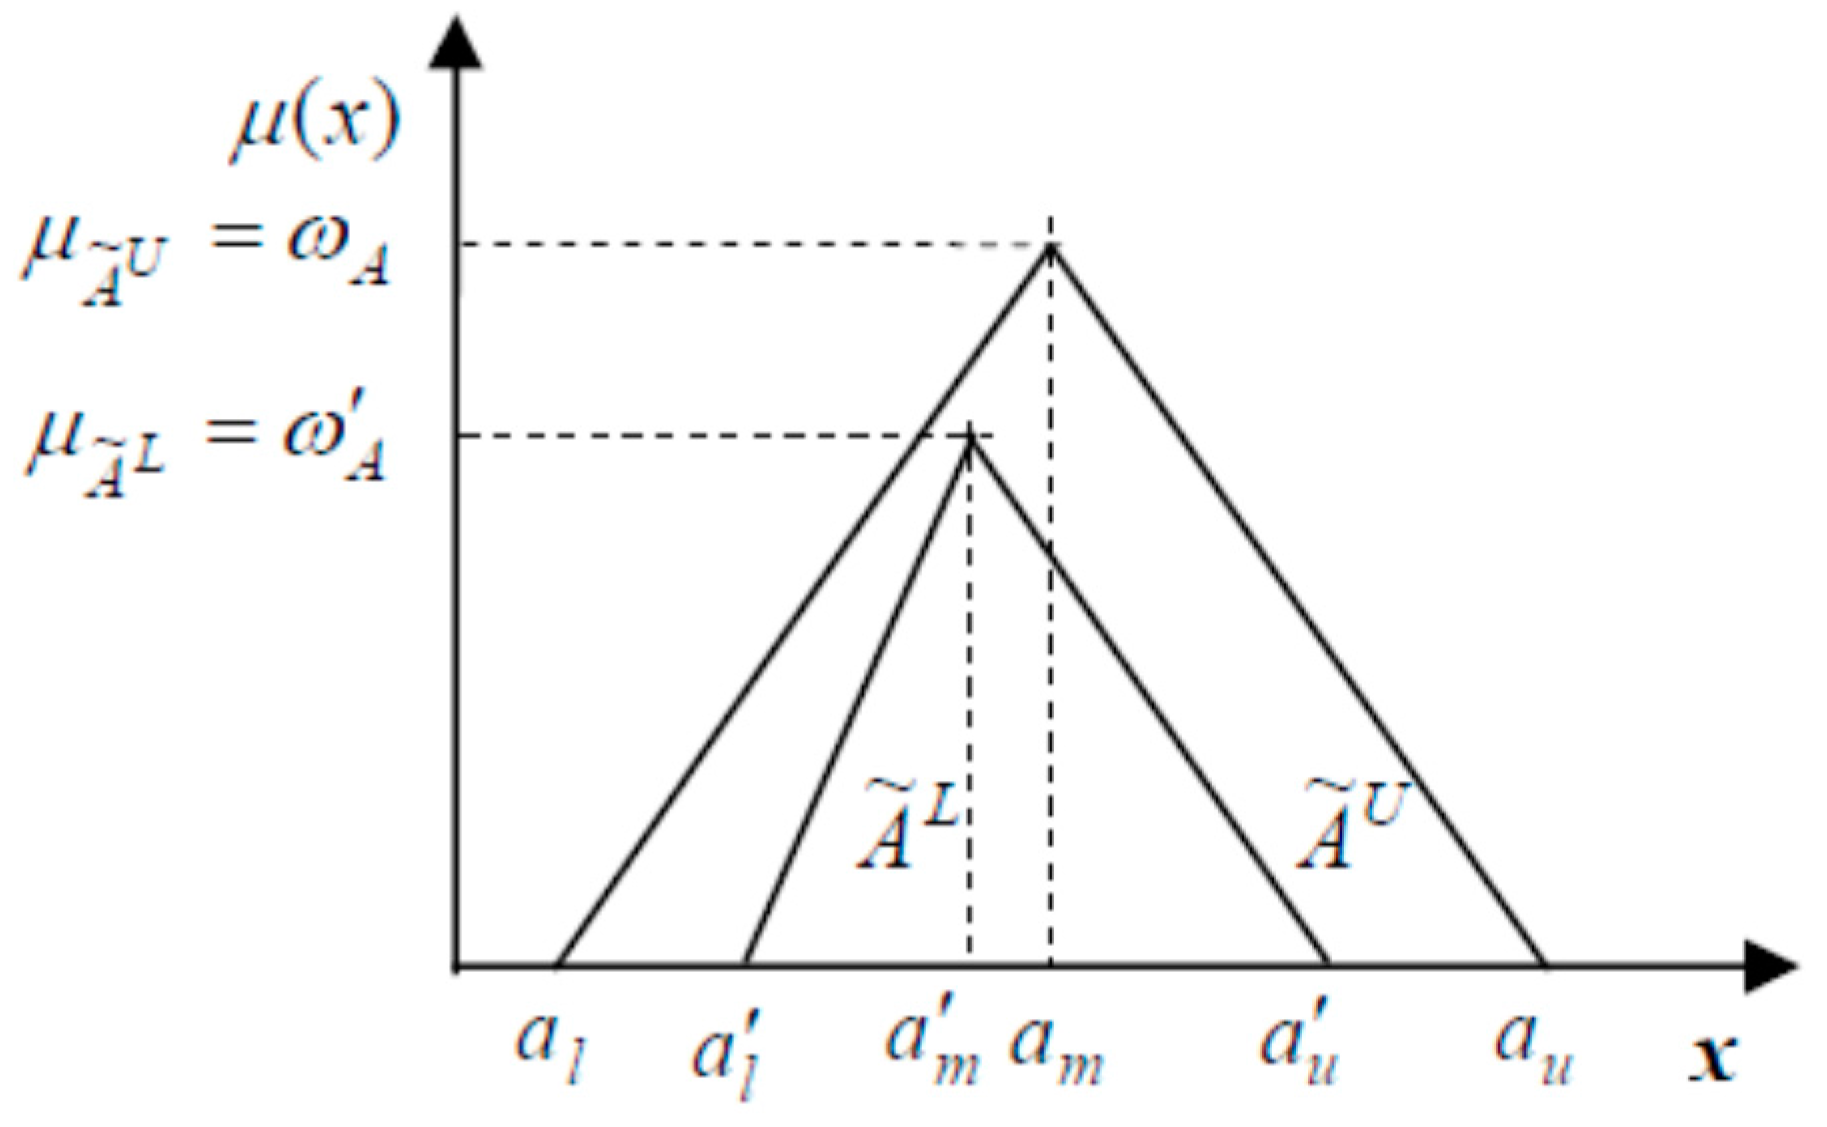
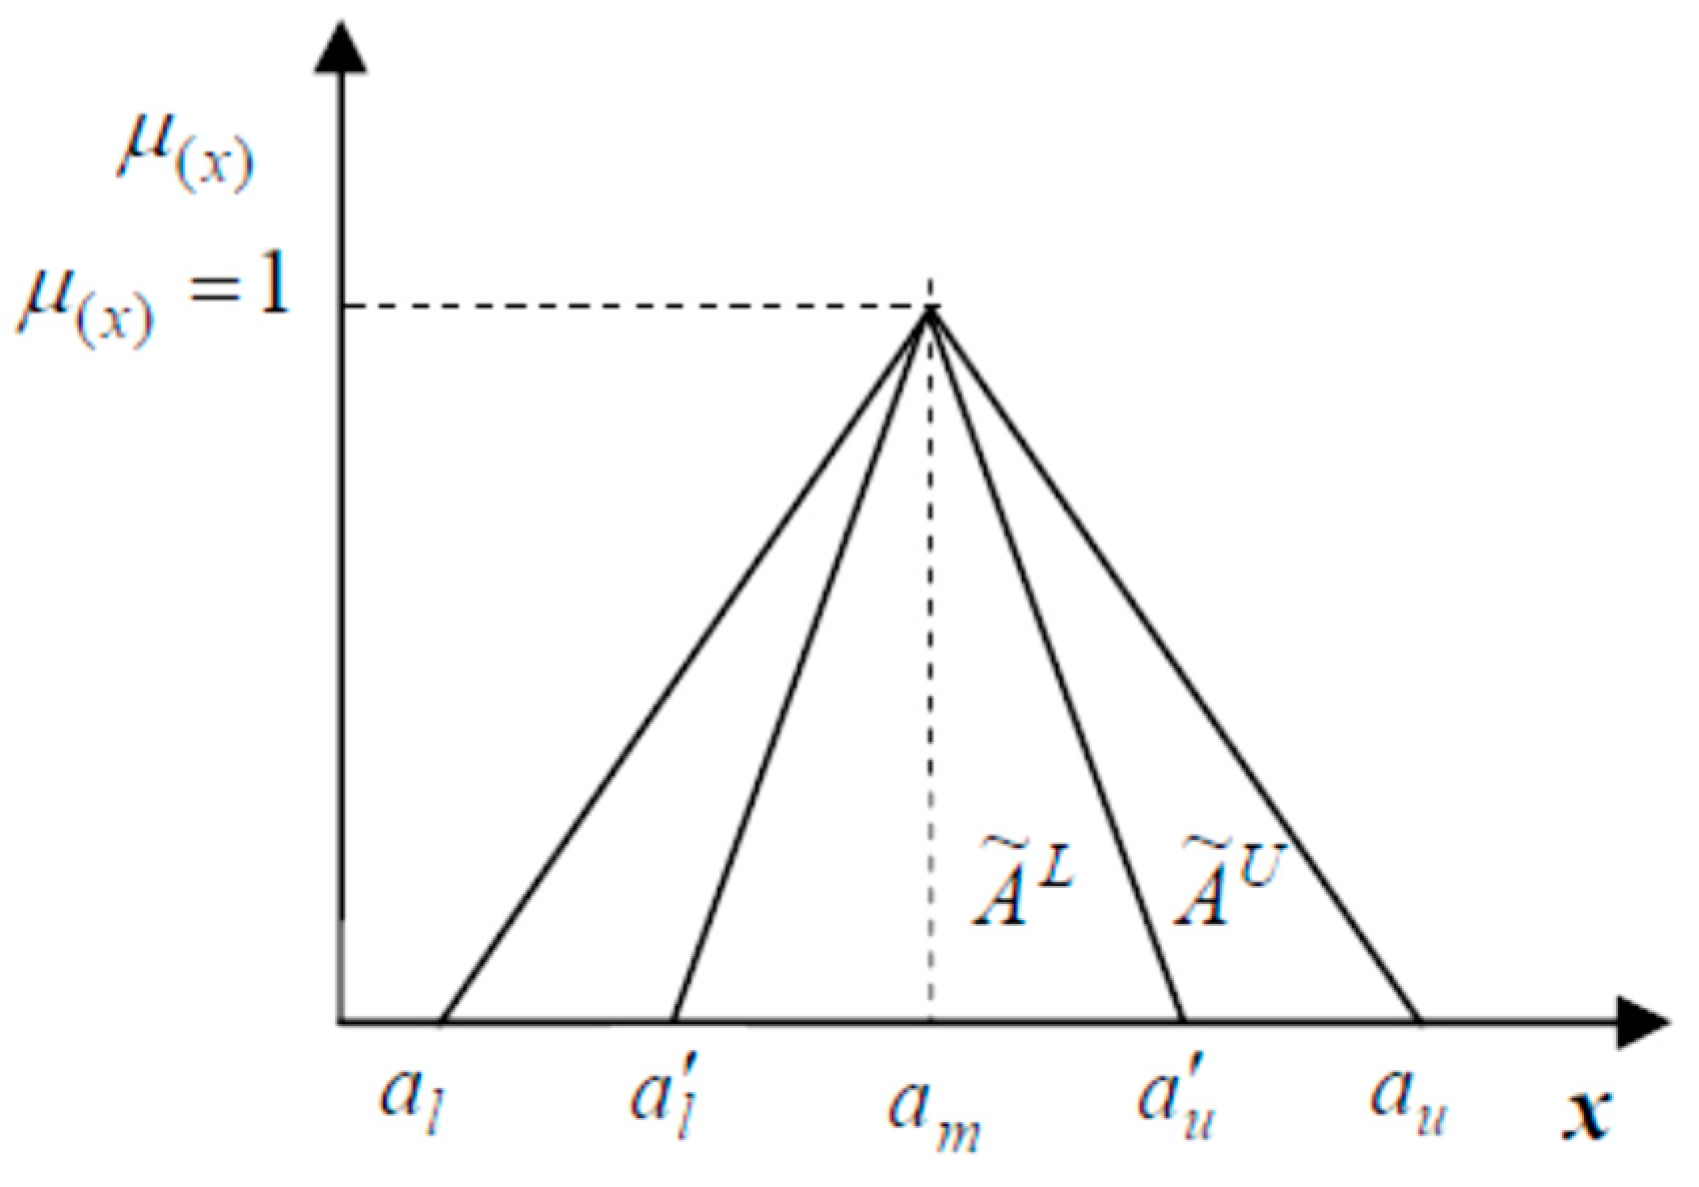
3.3.1. Generalized Fuzzy Numbers
- is a continuous mapping from Ʀ to the closed interval [0, 1].
- is strictly increasing on [a, b].
- for all , where ω is a constant on [0, 1], .
- is strictly decreasing on [c, d].
- for all .
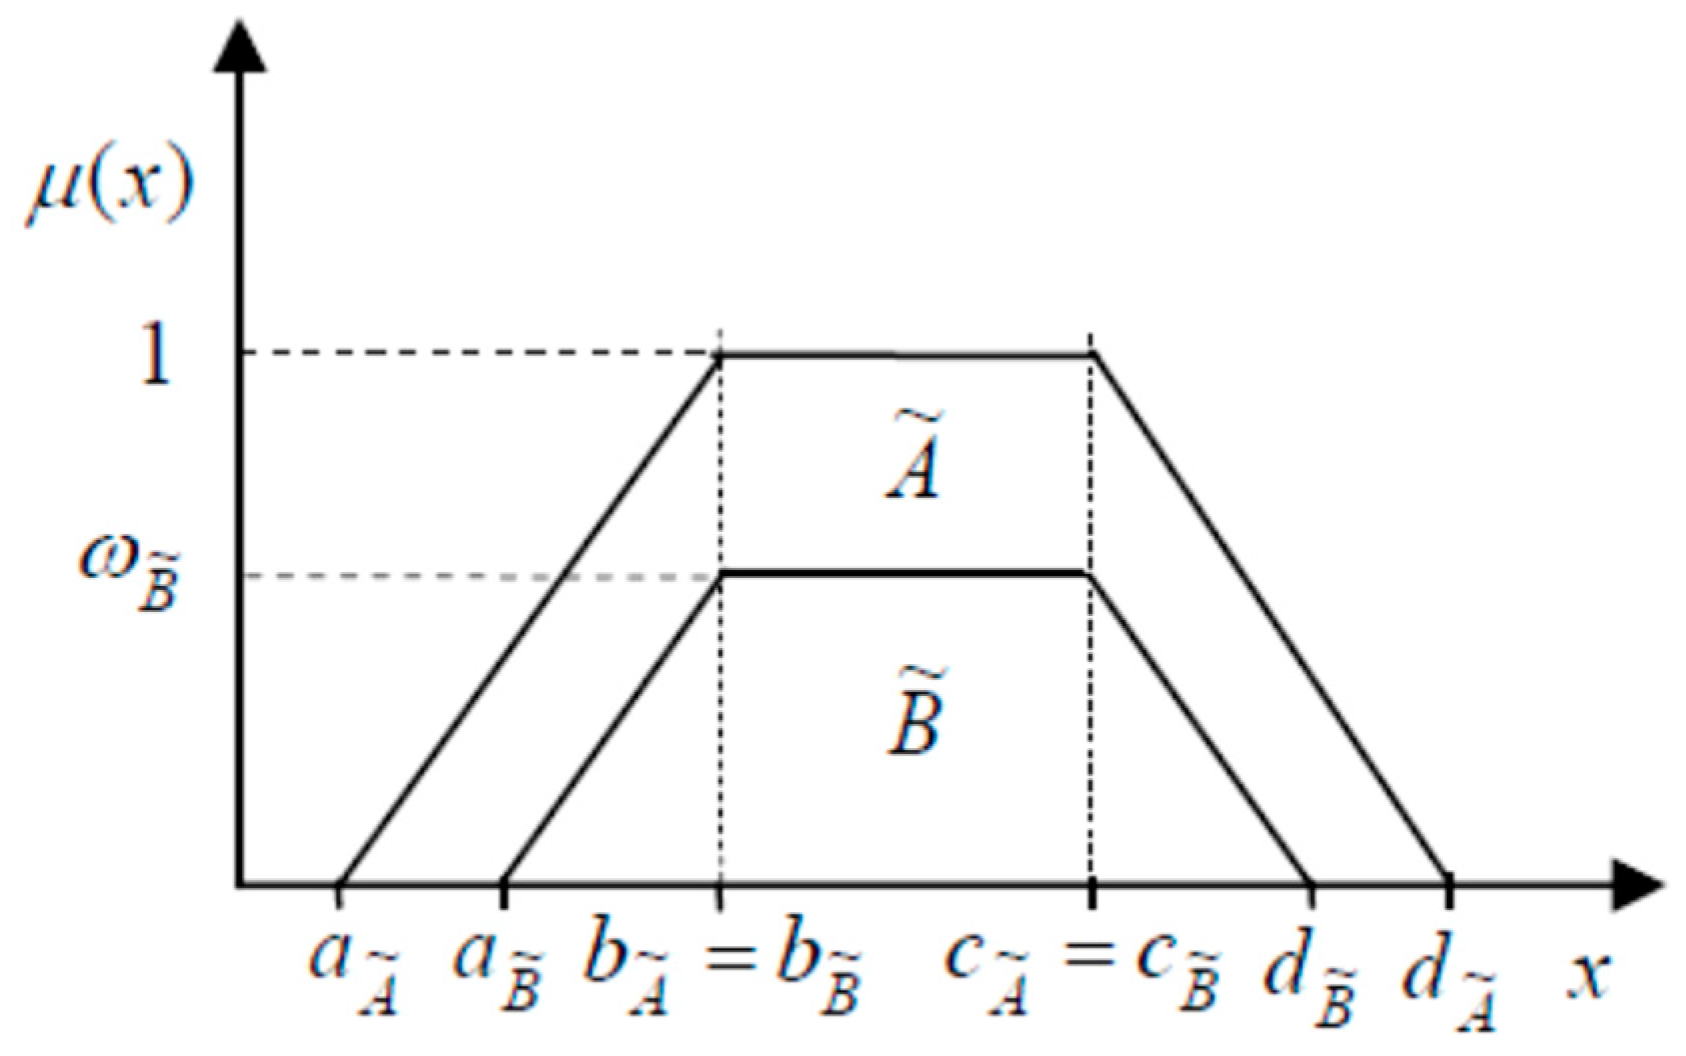
3.3.2. Interval-Valued Fuzzy Numbers
3.3.3. Linguistic Variables
3.3.4. Defuzzification of Interval-Valued Triangular Fuzzy Numbers
3.3.5. Additive Ratio Assessment (ARAS) Method
3.3.6. An Extension of ARAS Method Based on Interval-Valued Triangular Fuzzy Numbers
4. Results: A Case Study of Well-Drilling Projects
5. Conclusions and Recommendations
Author Contributions
Conflicts of Interest
References
- Salazar-Aramayo, J.L.; Rodrigues-da-Silveira, R.; Rodrigues-de-Almeida, M.; de Castro-Dantas, T.N. A conceptual model for project management of exploration and production in the oil and gas industry: The case of a Brazilian company. Int. J. Proj. Manag. 2013, 31, 589–601. [Google Scholar] [CrossRef]
- Lewis, J.P. The Project Manager’s Desk Reference: A Comprehensive Guide to Project Planning, Scheduling, Evaluation, Control and Systems; McGraw-Hill Inc.: Chicago, IL, USA, 1999. [Google Scholar]
- Institute, P.M.; Staff, P.M.I. A Guide to The Project Management Body of Knowledge (PMBOK Guide), 3rd ed.; An American National Standard, ANSI/PMI 99-001-2004; Project Management Institute: Sydney, Australia, 2004. [Google Scholar]
- Ahari, R.M.; Niaki, S.T.A. A hybrid approach based on locally linear neuro-fuzzy modeling and TOPSIS to determine the quality grade of gas well-drilling projects. J. Pet. Sci. Eng. 2014, 114, 99–106. [Google Scholar] [CrossRef]
- Butt, A.; Naaranoja, M.; Savolainen, J. Project change stakeholder communication. Int. J. Proj. Manag. 2016, 34, 1579–1595. [Google Scholar] [CrossRef]
- Xu, Y.; Yeh, C.-H. A performance-based approach to project assignment and performance evaluation. Int. J. Proj. Manag. 2014, 32, 218–228. [Google Scholar] [CrossRef]
- Cao, Q.; Hoffman, J.J. A case study approach for developing a project performance evaluation system. Int. J. Proj. Manag. 2011, 29, 155–164. [Google Scholar] [CrossRef]
- Büyüközkan, G.; Karabulut, Y. Energy project performance evaluation with sustainability perspective. Energy 2017, 119, 549–560. [Google Scholar] [CrossRef]
- Haralambopoulos, D.; Polatidis, H. Renewable energy projects: Structuring a multi-criteria group decision-making framework. Renew. Energy 2003, 28, 961–973. [Google Scholar] [CrossRef]
- Barfod, M.B. An MCDA approach for the selection of bike projects based on structuring and appraising activities. Eur. J. Oper. Res. 2012, 218, 810–818. [Google Scholar] [CrossRef]
- Wei, G.; Zhao, X. Induced hesitant interval-valued fuzzy Einstein aggregation operators and their application to multiple attribute decision making. J. Intell. Fuzzy Syst. 2013, 24, 789–803. [Google Scholar]
- Zadeh, L.A. The concept of a linguistic variable and its application to approximate reasoning—I. Inf. Sci. 1975, 8, 199–249. [Google Scholar] [CrossRef]
- Gorzałczany, M.B. A method of inference in approximate reasoning based on interval-valued fuzzy sets. Fuzzy Sets Syst. 1987, 21, 1–17. [Google Scholar] [CrossRef]
- Atanassov, K.T. Intuitionistic fuzzy sets. Fuzzy Sets Syst. 1986, 20, 87–96. [Google Scholar] [CrossRef]
- Baležentis, T.; Zeng, S. Group multi-criteria decision making based upon interval-valued fuzzy numbers: An extension of the MULTIMOORA method. Expert Syst. Appl. 2013, 40, 543–550. [Google Scholar] [CrossRef]
- Zavadskas, E.K.; Antucheviciene, J.; Hajiagha, S.H.R.; Hashemi, S.S. Extension of weighted aggregated sum product assessment with interval-valued intuitionistic fuzzy numbers (WASPAS-IVIF). Appl. Soft Comput. 2014, 24, 1013–1021. [Google Scholar] [CrossRef]
- Grimsey, D.; Lewis, M.K. Evaluating the risks of public private partnerships for infrastructure projects. Int. J. Proj. Manag. 2002, 20, 107–118. [Google Scholar] [CrossRef]
- Castillo, L.; Dorao, C.A. Decision-making in the oil and gas projects based on game theory: Conceptual process design. Energy Convers. Manag. 2013, 66, 48–55. [Google Scholar] [CrossRef]
- Luo, D.; Zhao, X. Modeling the operating costs for petroleum exploration and development projects. Energy 2012, 40, 189–195. [Google Scholar] [CrossRef]
- Osmundsen, P.; Toft, A.; Agnar Dragvik, K. Design of drilling contracts—Economic incentives and safety issues. Energy Policy 2006, 34, 2324–2329. [Google Scholar] [CrossRef]
- Ahari, R.M.; Niaki, S.T.A. Contractor selection in gas well-drilling projects with quality evaluation using Neuro-fuzzy networks. IERI Procedia 2014, 10, 274–279. [Google Scholar] [CrossRef]
- Dachyar, M.; Pratama, N.R. Performance evaluation of a drilling project in oil and gas service company in Indonesia by MACBETH method. J. Phys. Conf. Ser. 2014, 495, 012012. [Google Scholar] [CrossRef]
- Martinsuo, M.; Korhonen, T.; Laine, T. Identifying, framing and managing uncertainties in project portfolios. Int. J. Proj. Manag. 2014, 32, 732–746. [Google Scholar] [CrossRef]
- Marques, G.; Gourc, D.; Lauras, M. Multi-criteria performance analysis for decision making in project management. Int. J. Proj. Manag. 2011, 29, 1057–1069. [Google Scholar] [CrossRef]
- Kähkönen, K. Level of complexity in projects and its impacts on managerial solutions. Int. Proj. Manag. Assoc. 2008, XXIX, 3. [Google Scholar]
- Turner, J.R.; Müller, R. On the nature of the project as a temporary organization. Int. J. Proj. Manag. 2003, 21, 1–8. [Google Scholar] [CrossRef]
- Cheng, C.-H.; Liou, J.J.; Chiu, C.-Y. A Consistent Fuzzy Preference Relations Based ANP Model for R&D Project Selection. Sustainability 2017, 9, 1352. [Google Scholar]
- Strojny, J.; Szulc, J.; Baran, M. Applying the AHP Method into the Assessment of Project Attitudes. In Eurasian Business Perspectives; Springer: New York, NY, USA, 2018; pp. 183–197. [Google Scholar]
- Aragonés-Beltrán, P.; Chaparro-González, F.; Pastor-Ferrando, J.-P.; Pla-Rubio, A. An AHP (Analytic Hierarchy Process)/ANP (Analytic Network Process)-based multi-criteria decision approach for the selection of solar-thermal power plant investment projects. Energy 2014, 66, 222–238. [Google Scholar] [CrossRef]
- He, Q.; Luo, L.; Hu, Y.; Chan, A.P. Measuring the complexity of mega construction projects in China—A fuzzy analytic network process analysis. Int. J. Proj. Manag. 2015, 33, 549–563. [Google Scholar] [CrossRef]
- Ozcan, U.; Dogan, A.; Soylemez, I. Evaluation of Research Projects of Undergraduate Students in an Engineering Department Using Topsis Method. Eurasia Proc. Educ. Soc. Sci. 2016, 5, 420–424. [Google Scholar]
- Altuntas, S.; Dereli, T. A novel approach based on DEMATEL method and patent citation analysis for prioritizing a portfolio of investment projects. Expert Syst. Appl. 2015, 42, 1003–1012. [Google Scholar] [CrossRef]
- Beccali, M.; Cellura, M.; Mistretta, M. Decision-making in energy planning. Application of the Electre method at regional level for the diffusion of renewable energy technology. Renew. Energy 2003, 28, 2063–2087. [Google Scholar] [CrossRef]
- Çolak, M.; Kaya, İ. Prioritization of renewable energy alternatives by using an integrated fuzzy MCDM model: A real case application for Turkey. Renew. Sustain. Energy Rev. 2017, 80, 840–853. [Google Scholar] [CrossRef]
- Anagnostopoulos, K.; Doukas, H.; Psarras, J. A linguistic multicriteria analysis system combining fuzzy sets theory, ideal and anti-ideal points for location site selection. Expert Syst. Appl. 2008, 35, 2041–2048. [Google Scholar] [CrossRef]
- Wang, J.; Wang, J.-Q.; Zhang, H.-Y.; Chen, X.-H. Multi-criteria decision-making based on hesitant fuzzy linguistic term sets: An outranking approach. Knowl. Based Syst. 2015, 86, 224–236. [Google Scholar] [CrossRef]
- Riera, J.V.; Massanet, S.; Herrera-Viedma, E.; Torrens, J. Some interesting properties of the fuzzy linguistic model based on discrete fuzzy numbers to manage hesitant fuzzy linguistic information. Appl. Soft Comput. 2015, 36, 383–391. [Google Scholar] [CrossRef]
- Yavuz, M.; Oztaysi, B.; Onar, S.C.; Kahraman, C. Multi-criteria evaluation of alternative-fuel vehicles via a hierarchical hesitant fuzzy linguistic model. Expert Syst. Appl. 2015, 42, 2835–2848. [Google Scholar] [CrossRef]
- Sanchez, M.A.; Castro, J.R.; Castillo, O.; Mendoza, O.; Rodriguez-Diaz, A.; Melin, P. Fuzzy higher type information granules from an uncertainty measurement. Granul. Comput. 2017, 2, 95–103. [Google Scholar] [CrossRef]
- Das, S.; Kar, S.; Pal, T. Robust decision making using intuitionistic fuzzy numbers. Granul. Comput. 2017, 2, 41–54. [Google Scholar] [CrossRef]
- Liu, P.; Mahmood, T.; Khan, Q. Multi-Attribute Decision-Making Based on Prioritized Aggregation Operator under Hesitant Intuitionistic Fuzzy Linguistic Environment. Symmetry 2017, 9, 270. [Google Scholar] [CrossRef]
- Dubois, D.J. Fuzzy Sets and Systems: Theory and Applications; Academic Press: Cambridge, MA, USA, 1980; Volume 144. [Google Scholar]
- Feng, F.; Li, Y.; Leoreanu-Fotea, V. Application of level soft sets in decision making based on interval-valued fuzzy soft sets. Comput. Math. Appl. 2010, 60, 1756–1767. [Google Scholar] [CrossRef]
- Xu, Z.; Gou, X. An overview of interval-valued intuitionistic fuzzy information aggregations and applications. Granul. Comput. 2017, 2, 13–39. [Google Scholar] [CrossRef]
- Jiang, Y.; Xu, Z.; Shu, Y. Interval-valued intuitionistic multiplicative aggregation in group decision making. Granul. Comput. 2017, 2, 387–407. [Google Scholar] [CrossRef]
- Meng, S.; Liu, N.; He, Y. GIFIHIA operator and its application to the selection of cold chain logistics enterprises. Granul. Comput. 2017, 2, 187–197. [Google Scholar] [CrossRef]
- Wang, C.; Fu, X.; Meng, S.; He, Y. Multi-attribute decision-making based on the SPIFGIA operators. Granul. Comput. 2017, 2, 321–331. [Google Scholar] [CrossRef]
- Liang, D.; Xu, Z. The new extension of TOPSIS method for multiple criteria decision making with hesitant Pythagorean fuzzy sets. Appl. Soft Comput. 2017, 60, 167–179. [Google Scholar] [CrossRef]
- Karnik, N.N.; Mendel, J.M. Operations on type-2 fuzzy sets. Fuzzy Sets Syst. 2001, 122, 327–348. [Google Scholar] [CrossRef]
- Liu, P. A weighted aggregation operators multi-attribute group decision-making method based on interval-valued trapezoidal fuzzy numbers. Expert Syst. Appl. 2011, 38, 1053–1060. [Google Scholar] [CrossRef]
- Xu, Z.; Wang, H. Managing multi-granularity linguistic information in qualitative group decision making: An overview. Granul. Comput. 2016, 1, 21–35. [Google Scholar] [CrossRef]
- Zhang, H. Some interval-valued 2-tuple linguistic aggregation operators and application in multiattribute group decision making. Appl. Math. Model. 2013, 37, 4269–4282. [Google Scholar] [CrossRef]
- Mendel, J.M. A comparison of three approaches for estimating (synthesizing) an interval type-2 fuzzy set model of a linguistic term for computing with words. Granul. Comput. 2016, 1, 59–69. [Google Scholar] [CrossRef]
- Wu, J.; Chiclana, F. A social network analysis trust–consensus based approach to group decision-making problems with interval-valued fuzzy reciprocal preference relations. Knowl. Based Syst. 2014, 59, 97–107. [Google Scholar] [CrossRef]
- Reiser, R.H.S.; Bedregal, B.; Dos Reis, G. Interval-valued fuzzy coimplications and related dual interval-valued conjugate functions. J. Comput. Syst. Sci. 2014, 80, 410–425. [Google Scholar] [CrossRef]
- Qin, J. Interval type-2 fuzzy Hamy mean operators and their application in multiple criteria decision making. Granul. Comput. 2017, 2, 249–269. [Google Scholar] [CrossRef]
- Vahdani, B.; Hadipour, H.; Sadaghiani, J.S.; Amiri, M. Extension of VIKOR method based on interval-valued fuzzy sets. Int. J. Adv. Manuf. Technol. 2010, 47, 1231–1239. [Google Scholar] [CrossRef]
- Chatterjee, K.; Kar, S. Unified Granular-number-based AHP-VIKOR multi-criteria decision framework. Granul. Comput. 2017, 2, 199–221. [Google Scholar] [CrossRef]
- Ashtiani, B.; Haghighirad, F.; Makui, A.; ali Montazer, G. Extension of fuzzy TOPSIS method based on interval-valued fuzzy sets. Appl. Soft Comput. 2009, 9, 457–461. [Google Scholar] [CrossRef]
- Liu, P.; You, X. Probabilistic linguistic TODIM approach for multiple attribute decision-making. Granul. Comput. 2017, 2, 333–342. [Google Scholar] [CrossRef]
- Campeol, G.; Carollo, S.; Masotto, N. Infrastructural projects and territorial development in Veneto Dolomites: Evaluation of performances through AHP. Procedia Soc. Behav. Sci. 2016, 223, 468–474. [Google Scholar] [CrossRef]
- Osmundsen, P.; Sørenes, T.; Toft, A. Offshore oil service contracts new incentive schemes to promote drilling efficiency. J. Pet. Sci. Eng. 2010, 72, 220–228. [Google Scholar] [CrossRef]
- Liu, J.; Li, Q.; Wang, Y. Risk analysis in ultra deep scientific drilling project—A fuzzy synthetic evaluation approach. Int. J. Proj. Manag. 2013, 31, 449–458. [Google Scholar] [CrossRef]
- Ngacho, C.; Das, D. A performance evaluation framework of development projects: An empirical study of constituency development fund (CDF) construction projects in Kenya. Int. J. Proj. Manag. 2014, 32, 492–507. [Google Scholar] [CrossRef]
- Bassioni, H.A.; Price, A.D.F.; Hassan, T.M. Performance measurement in construction. J. Manag. Eng. 2004, 20, 42–50. [Google Scholar] [CrossRef]
- Hare, B.; Cameron, I.; Roy Duff, A. Exploring the integration of health and safety with pre-construction planning. Eng. Constr. Archit. Manag. 2006, 13, 438–450. [Google Scholar] [CrossRef]
- Haslam, R.A.; Hide, S.A.; Gibb, A.G.F.; Gyi, D.E.; Pavitt, T.; Atkinson, S.; Duff, A.R. Contributing factors in construction accidents. Appl. Ergon. 2005, 36, 401–415. [Google Scholar] [CrossRef] [PubMed]
- Ortega, I. Systematic prevention of construction failures: An overview. Technol. Law Insur. 2000, 5, 15–22. [Google Scholar] [CrossRef]
- Tabish, S.Z.S.; Jha, K.N. Analyses and evaluation of irregularities in public procurement in India. Constr. Manag. Econ. 2011, 29, 261–274. [Google Scholar] [CrossRef]
- Eriksson, P.E.; Westerberg, M. Effects of cooperative procurement procedures on construction project performance: A conceptual framework. Int. J. Proj. Manag. 2011, 29, 197–208. [Google Scholar] [CrossRef]
- Ali, A.S.; Rahmat, I. The performance measurement of construction projects managed by ISO-certified contractors in Malaysia. J. Retail Leis. Prop. 2010, 9, 25–35. [Google Scholar] [CrossRef]
- Chan, A.P.C. Key performance indicators for measuring construction success. Benchmarking 2004, 11, 203–221. [Google Scholar] [CrossRef]
- Fuentes, R.; Fuster, B.; Lillo-Bañuls, A. A three-stage DEA model to evaluate learning-teaching technical efficiency: Key performance indicators and contextual variables. Expert Syst. Appl. 2016, 48, 89–99. [Google Scholar] [CrossRef]
- Tone, K.; Tsutsui, M. Network DEA: A slacks-based measure approach. Eur. J. Oper. Res. 2009, 197, 243–252. [Google Scholar] [CrossRef]
- Li, K.; Lin, B. Impact of energy conservation policies on the green productivity in China’s manufacturing sector: Evidence from a three-stage DEA model. Appl. Energy 2016, 168, 351–363. [Google Scholar] [CrossRef]
- Oral, M.; Oukil, A.; Malouin, J.-L.; Kettani, O. The appreciative democratic voice of DEA: A case of faculty academic performance evaluation. Socio Econ. Plan. Sci. 2014, 48, 20–28. [Google Scholar] [CrossRef]
- Tongzon, J. Efficiency measurement of selected Australian and other international ports using data envelopment analysis. Transp. Res. Part A Policy Pract. 2001, 35, 107–122. [Google Scholar] [CrossRef]
- Menkhoff, L.; Schmidt, U.; Brozynski, T. The impact of experience on risk taking, overconfidence, and herding of fund managers: Complementary survey evidence. Eur. Econ. Rev. 2006, 50, 1753–1766. [Google Scholar] [CrossRef]
- Schmidt, F.L.; Hunter, J.E.; Outerbridge, A.N. Impact of job experience and ability on job knowledge, work sample performance, and supervisory ratings of job performance. J. Appl. Psychol. 1986, 71, 432–439. [Google Scholar] [CrossRef]
- Paquin, J.-P.; Gauthier, C.; Morin, P.-P. The downside risk of project portfolios: The impact of capital investment projects and the value of project efficiency and project risk management programmes. Int. J. Proj. Manag. 2016, 34, 1460–1470. [Google Scholar] [CrossRef]
- Jankowski, J.E. Do we need a price index for industrial R&D? Res. Policy 1993, 22, 195–205. [Google Scholar]
- McGrath, M. The R&D effectiveness index: A metric for product development performance. J. Prod. Innov. Manag. 1994, 11, 213–220. [Google Scholar]
- Meredith, J. Alternative research paradigms in operations. J. Oper. Manag. 1989, 8, 297–326. [Google Scholar] [CrossRef]
- Kardaras, D.K.; Karakostas, B.; Mamakou, X.J. Content presentation personalisation and media adaptation in tourism web sites using fuzzy Delphi method and fuzzy cognitive maps. Expert Syst. Appl. 2013, 40, 2331–2342. [Google Scholar] [CrossRef]
- Okoli, C.; Pawlowski, S.D. The Delphi method as a research tool: An example, design considerations and applications. Inf. Manag. 2004, 42, 15–29. [Google Scholar] [CrossRef]
- Kuo, Y.-F.; Chen, P.-C. Constructing performance appraisal indicators for mobility of the service industries using fuzzy Delphi method. Expert Syst. Appl. 2008, 35, 1930–1939. [Google Scholar] [CrossRef]
- Murray, T.J.; Pipino, L.L.; van Gigch, J.P. A pilot study of fuzzy set modification of Delphi. Hum. Syst. Manag. 1985, 5, 76–80. [Google Scholar]
- Hsu, T.; Yang, T. Application of fuzzy analytic hierarchy process in the selection of advertising media. J. Manag. Syst. 2000, 7, 19–39. [Google Scholar]
- Tzeng, G.H.; Teng, J.Y. Transportation investment project selection with fuzzy multiobjectives. Transp. Plan. Technol. 1993, 17, 91–112. [Google Scholar] [CrossRef]
- Hashemkhani Zolfani, S.; Aghdaie, M.H.; Derakhti, A.; Zavadskas, E.K.; Morshed Varzandeh, M.H. Decision making on business issues with foresight perspective; an application of new hybrid MCDM model in shopping mall locating. Expert Syst. Appl. 2013, 40, 7111–7121. [Google Scholar] [CrossRef]
- Keršuliene, V.; Zavadskas, E.K.; Turskis, Z. Selection of rational dispute resolution method by applying new step-wise weight assessment ratio analysis (Swara). J. Bus. Econ. Manag. 2010, 11, 243–258. [Google Scholar] [CrossRef]
- Dehnavi, A.; Aghdam, I.N.; Pradhan, B.; Morshed Varzandeh, M.H. A new hybrid model using Step-Wise Weight Assessment Ratio Analysis (SWARA) technique and Adaptive Neuro-Fuzzy Inference System (ANFIS) for regional landslide hazard assessment in Iran. CATENA 2015, 135, 122–148. [Google Scholar] [CrossRef]
- Hashemkhani Zolfani, S.; Bahrami, M. Investment prioritizing in high tech industries based on SWARA-COPRAS approach. Technol. Econ. Dev. Econ. 2014, 20, 534–553. [Google Scholar] [CrossRef]
- Chen, S.-J.; Chen, S.-M. Fuzzy risk analysis based on similarity measures of generalized fuzzy numbers. IEEE Trans. Fuzzy Syst. 2003, 11, 45–56. [Google Scholar] [CrossRef]
- Yao, J.-S.; Lin, F.-T. Constructing a fuzzy flow-shop sequencing model based on statistical data. Int. J. Approx. Reason. 2002, 29, 215–234. [Google Scholar] [CrossRef]
- Chen, S.-J.; Chen, S.-M. Fuzzy risk analysis based on measures of similarity between interval-valued fuzzy numbers. Comput. Math. Appl. 2008, 55, 1670–1685. [Google Scholar] [CrossRef]
- Chen, C.-T. Extensions of the TOPSIS for group decision-making under fuzzy environment. Fuzzy Sets Syst. 2000, 114, 1–9. [Google Scholar] [CrossRef]
- Mahdavi, I.; Mahdavi-Amiri, N.; Heidarzade, A.; Nourifar, R. Designing a model of fuzzy TOPSIS in multiple criteria decision making. Appl. Math. Comput. 2008, 206, 607–617. [Google Scholar] [CrossRef]
- Wang, Y.-M.; Elhag, T.M. Fuzzy TOPSIS method based on alpha level sets with an application to bridge risk assessment. Expert Syst. Appl. 2006, 31, 309–319. [Google Scholar] [CrossRef]
- Wei, S.-H.; Chen, S.-M. Fuzzy risk analysis based on interval-valued fuzzy numbers. Expert Syst. Appl. 2009, 36, 2285–2299. [Google Scholar] [CrossRef]
- Tupenaite, L.; Zavadskas, E.K.; Kaklauskas, A.; Turskis, Z.; Seniut, M. Multiple criteria assessment of alternatives for built and human environment renovation. J. Civ. Eng. Manag. 2010, 16, 257–266. [Google Scholar] [CrossRef]
- Zavadskas, E.K.; Turskis, Z. A new additive ratio assessment (ARAS) method in multicriteria decision-making. Technol. Econ. Dev. Econ. 2010, 16, 159–172. [Google Scholar] [CrossRef]
- Zavadskas, E.; Turskis, Z.; Vilutiene, T. Multiple criteria analysis of foundation instalment alternatives by applying Additive Ratio Assessment (ARAS) method. Arch. Civ. Mech. Eng. 2010, 10, 123–141. [Google Scholar] [CrossRef]


| No. | Description | Source |
|---|---|---|
| 1 | Cost spent for drilling | [1,4,21,22] |
| 2 | Types of drilled wells in terms of number of holes | [4,32] |
| 3 | Time of drilling operations | [1,4,21,22] |
| 4 | Number of accidents caused by non-compliance with safety regulation or environmental factors | [4,20,21,22,63,66,67,68,70] |
| 5 | Actual cost compliance percentage with plans | [4,21] |
| 6 | Number of operational experts working on the project | [74,75,76] |
| 7 | Scientific levels of drilling specialists working in the project | [79] |
| 8 | Experience of drilling specialists working in Project | [78,79] |
| 9 | Average salaries of employees in the project | [74,75,76,77] |
| 10 | Types of wells drilled in operational risk | [20,22,23,63,69,81] |
| 11 | Number of operational failures | [4,21,63] |
| 12 | Employer/Senior Manager Satisfaction | [4,21,71,72] |
| 13 | Quality of materials and goods | [1,63,73,74] |
| 14 | R & D expenditure | [63,81,82] |
| Linguistic Variables | Triangular Fuzzy Number | Interval-Valued Triangular Fuzzy Number |
|---|---|---|
| Very low (VL) | (0.0, 0.0, 0.1) | [(0.00, 0.00), 0.0, (0.10, 0.15)] |
| Low (L) | (0.0, 0.1, 0.3) | [(0.00, 0.50), 0.1, (0.25, 0.35)] |
| Medium low (ML) | (0.1, 0.3, 0.5) | [(0.00, 0.15), 0.3, (0.45, 0.55)] |
| Medium (M) | (0.3, 0.5, 0.7) | [(0.25, 0.35), 0.5, (0.65, 0.75)] |
| Medium high (MH) | (0.5, 0.7, 0.9) | [(0.45, 0.55), 0.7, (0.80, 0.95)] |
| High (H) | (0.7, 0.7, 1.0) | [(0.55, 0.75), 0.9, (0.95, 1.00)] |
| Very high (VH) | (0.9, 1.0, 1.0) | [(0.85, 0.95), 1.0, (1.00, 1.00)] |
| Linguistic Variables | Triangular Fuzzy Number | Interval-Valued Triangular Fuzzy Number |
|---|---|---|
| Very poor (VP) | (0.0, 0.0, 0.1) | [(0.00, 0.00), 0.0, (0.10, 0.15)] |
| Poor (P) | (0.0, 0.1, 0.3) | [(0.00, 0.50), 0.1, (0.25, 0.35)] |
| Medium poor (MP) | (0.1, 0.3, 0.5) | [(0.00, 0.15), 0.3, (0.45, 0.55)] |
| Fair (F) | (0.3, 0.5, 0.7) | [(0.25, 0.35), 0.5, (0.65, 0.75)] |
| Medium good (MG) | (0.5, 0.7, 0.9) | [(0.45, 0.55), 0.7, (0.80, 0.95)] |
| Good (G) | (0.7, 0.7, 1.0) | [(0.55, 0.75), 0.9, (0.95, 1.00)] |
| Very good (VG) | (0.9, 1.0, 1.0) | [(0.85, 0.95), 1.0, (1.00, 1.00)] |
| Criteria | Code | Sub-Criteria | Code |
|---|---|---|---|
| Materials & Equipment | A | Number of drilling rigs used | A1 |
| Type of drilling rigs | A2 | ||
| Quality of materials and goods used | A3 | ||
| Quality of drilling and support service | A4 | ||
| Human Resource | B | Number of operational experts working on the project | B1 |
| Scientific levels of drilling specialists working in the project | B2 | ||
| Experience of drilling specialists working in Project (Ave.) | B3 | ||
| Average salaries of employees in the project (Million Rls) | B4 | ||
| Planning | C | Type of drilled wells in terms of operational risk | C1 |
| Type of drilled wells in terms of depth | C2 | ||
| Type and number of fields under operation | C3 | ||
| Cost spent for drilling project (Billion Rls) | C4 | ||
| Status of cash flows in project | C5 | ||
| Quality | D | Employer/Senior Manager Satisfaction | D1 |
| Waiting time percentage to total well drilling time | D2 | ||
| Number of failure reports | D3 | ||
| Number of accidents caused by non-compliance with safety regulation, or environmental factors | D4 | ||
| Actual cost compliance percentage with planned cost | D5 | ||
| Number of planned wells | E | number of planned wells in a certain period of time | E |
| Number of drilled wells | F | number of drilled wells in a certain period of time | F |
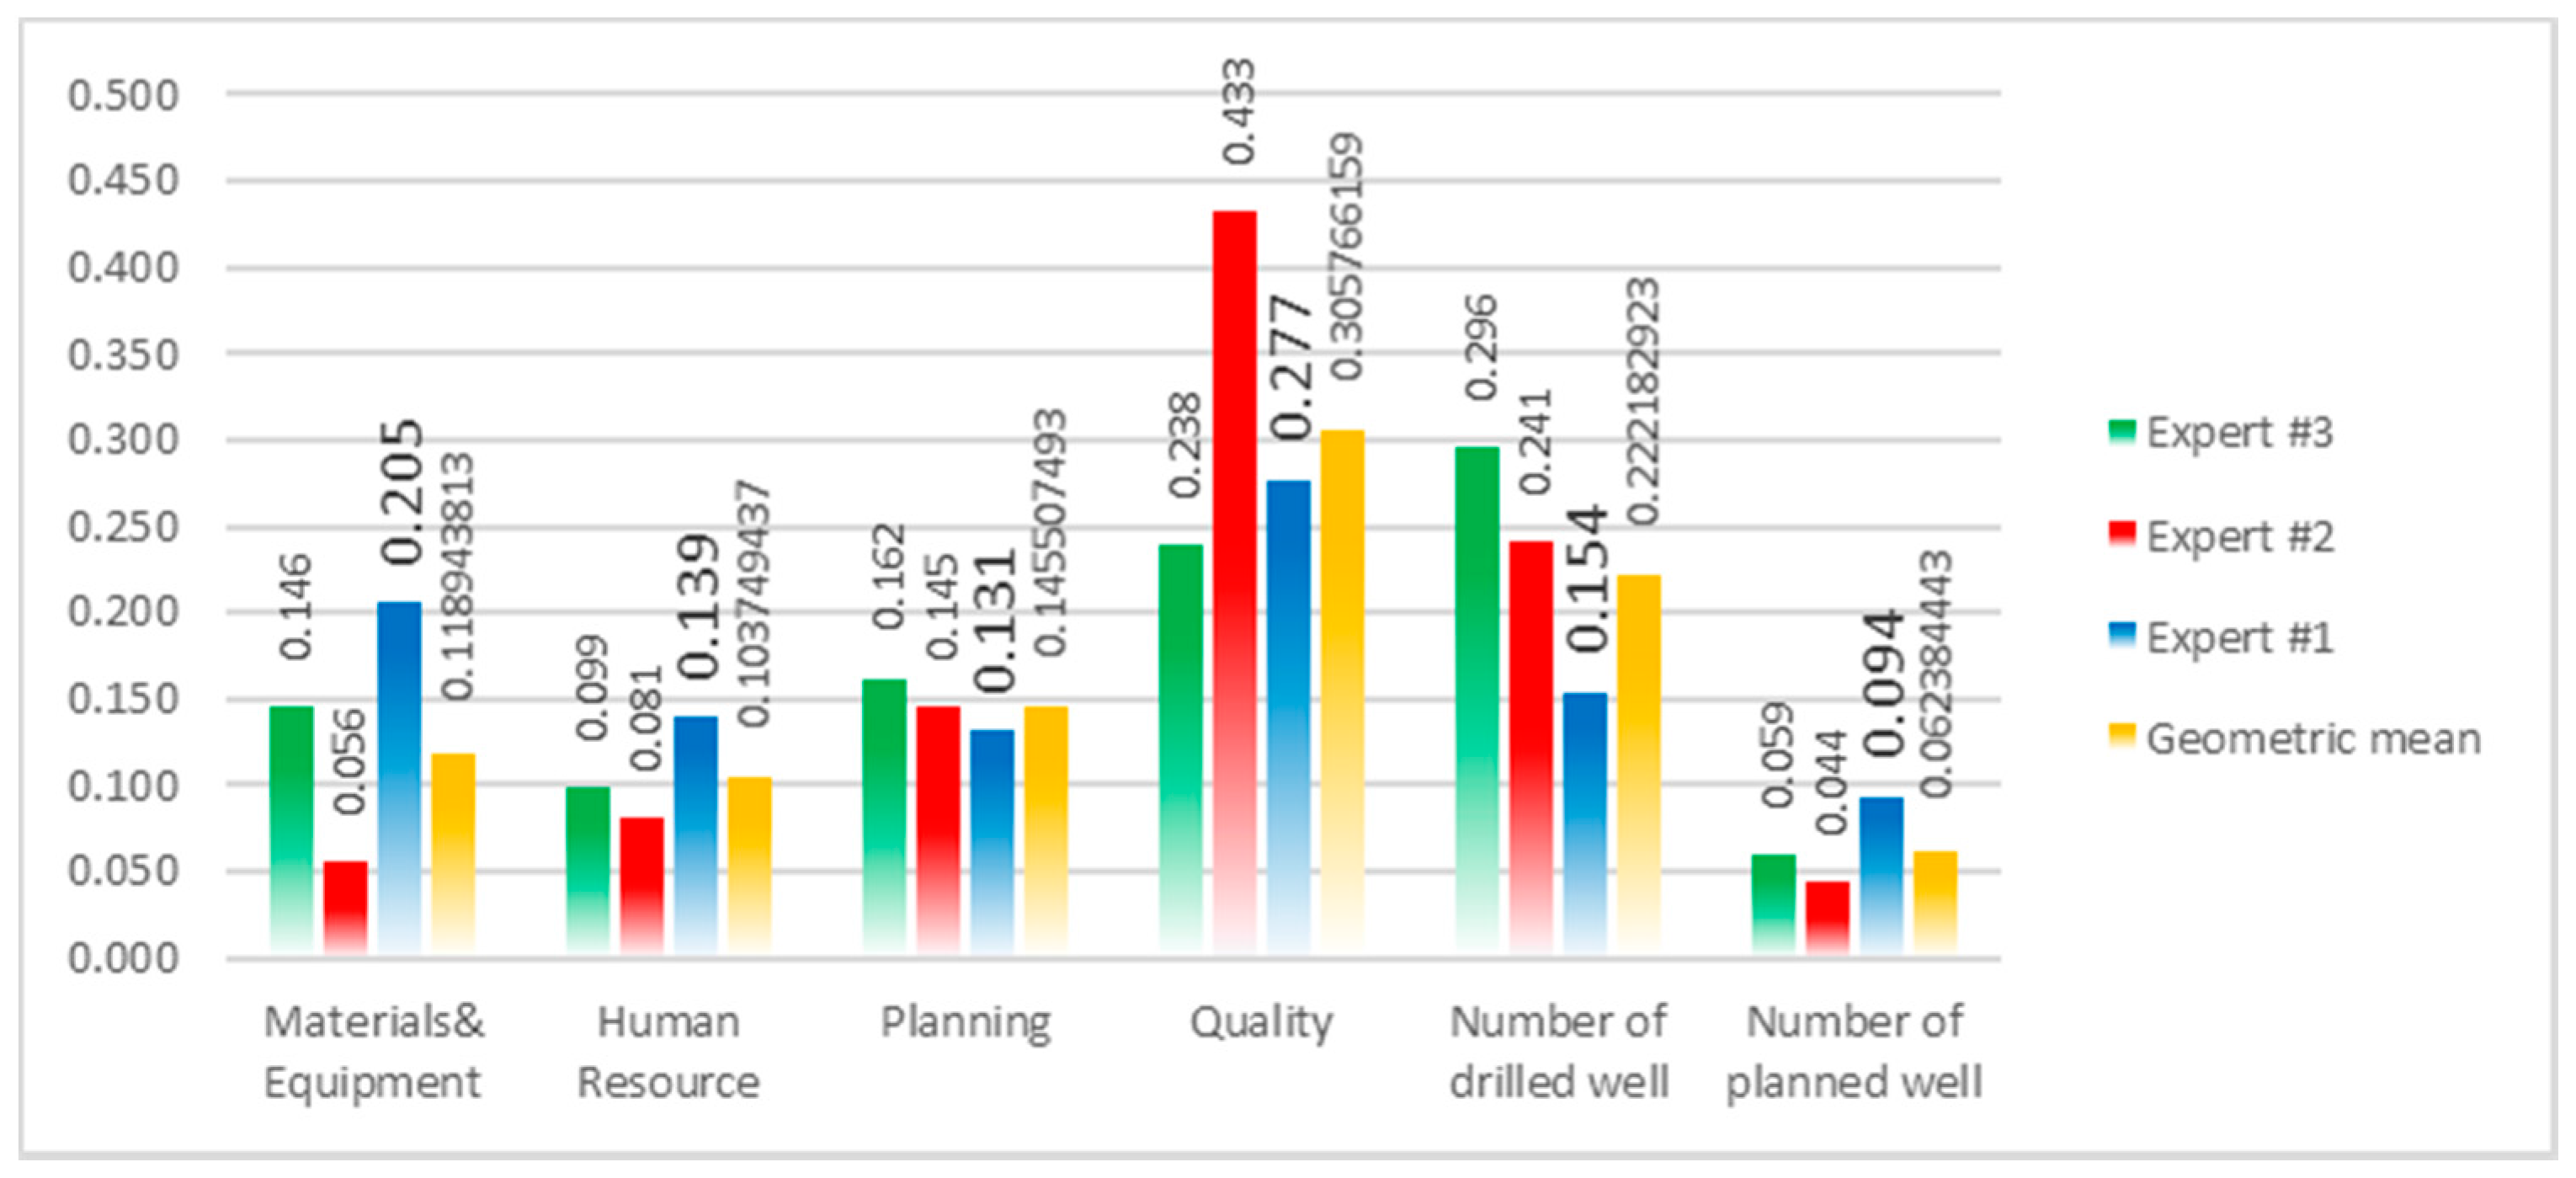
| Code | Criterion | Sj | Kj (Kj = 1 + Sj) | Initial Weight | Normalized Final Weights |
|---|---|---|---|---|---|
| D | Quality | 1 | 1 | 1 | 0.277 |
| A | Materials & Equipment | 0.35 | 1.35 | 0.741 | 0.205 |
| E | Number of drilled wells | 0.33 | 1.33 | 0.557 | 0.154 |
| B | Human Resource | 0.11 | 1.11 | 0.502 | 0.139 |
| C | Planning | 0.06 | 1.06 | 0.473 | 0.131 |
| F | Number of planned wells | 0.4 | 1.4 | 0.338 | 0.094 |
| Expert #1 | Expert #2 | Expert #3 | Geometric Mean of Sub-Criteria Weight | Normalized Final Weights | ||||||||||||
|---|---|---|---|---|---|---|---|---|---|---|---|---|---|---|---|---|
| Criterion Code | Criterion Weight | Sub-Criterion Code | Weight in Each Criterion | Final Weight of Sub-Criteria | Criterion Code | Criterion Weight | Sub-Criterion Code | Weight in Each Criterion | Final Weight of Sub-Criteria | Criterion Code | Criterion Weight | Sub-Criterion Code | Weight in Each Criterion | Final Weight of Sub-Criteria | ||
| A | 0.205 | A1 | 0.221 | 0.045 | A | 0.056 | A1 | 0.262 | 0.015 | A | 0.146 | A1 | 0.312 | 0.046 | 0.031 | 0.033 |
| A2 | 0.307 | 0.063 | A2 | 0.445 | 0.025 | A2 | 0.295 | 0.043 | 0.041 | 0.044 | ||||||
| A3 | 0.272 | 0.056 | A3 | 0.114 | 0.006 | A3 | 0.185 | 0.027 | 0.021 | 0.023 | ||||||
| A4 | 0.201 | 0.041 | A4 | 0.178 | 0.010 | A4 | 0.208 | 0.030 | 0.023 | 0.025 | ||||||
| B | 0.139 | B1 | 0.236 | 0.033 | B | 0.081 | B1 | 0.108 | 0.009 | B | 0.099 | B1 | 0.301 | 0.030 | 0.020 | 0.022 |
| B2 | 0.278 | 0.039 | B2 | 0.287 | 0.023 | B2 | 0.193 | 0.019 | 0.026 | 0.028 | ||||||
| B3 | 0.286 | 0.040 | B3 | 0.425 | 0.035 | B3 | 0.389 | 0.038 | 0.038 | 0.040 | ||||||
| B4 | 0.200 | 0.028 | B4 | 0.180 | 0.015 | B4 | 0.117 | 0.012 | 0.017 | 0.018 | ||||||
| C | 0.131 | C1 | 0.186 | 0.024 | C | 0.145 | C1 | 0.348 | 0.050 | C | 0.162 | C1 | 0.180 | 0.029 | 0.033 | 0.035 |
| C2 | 0.307 | 0.040 | C2 | 0.170 | 0.025 | C2 | 0.249 | 0.040 | 0.034 | 0.037 | ||||||
| C3 | 0.109 | 0.014 | C3 | 0.132 | 0.019 | C3 | 0.127 | 0.021 | 0.018 | 0.019 | ||||||
| C4 | 0.279 | 0.037 | C4 | 0.264 | 0.038 | C4 | 0.3 | 0.060 | 0.044 | 0.047 | ||||||
| C5 | 0.119 | 0.016 | C5 | 0.087 | 0.013 | C5 | 0.073 | 0.012 | 0.013 | 0.014 | ||||||
| D | 0.277 | D1 | 0.248 | 0.069 | D | 0.433 | D1 | 0.108 | 0.047 | D | 0.238 | D1 | 0.278 | 0.066 | 0.060 | 0.064 |
| D2 | 0.199 | 0.055 | D2 | 0.423 | 0.183 | D2 | 0.177 | 0.042 | 0.075 | 0.080 | ||||||
| D3 | 0.129 | 0.036 | D3 | 0.159 | 0.069 | D3 | 0.135 | 0.032 | 0.043 | 0.046 | ||||||
| D4 | 0.136 | 0.038 | D4 | 0.083 | 0.036 | D4 | 0.076 | 0.018 | 0.029 | 0.031 | ||||||
| D5 | 0.288 | 0.080 | D5 | 0.226 | 0.098 | D5 | 0.334 | 0.080 | 0.085 | 0.091 | ||||||
| E | 0.154 | E | 0.241 | E | 0.296 | 0.222 | 0.237 | |||||||||
| F | 0.094 | F | 0.044 | F | 0.059 | 0.062 | 0.067 | |||||||||
| Code | Sub-Criteria | Final Weight |
|---|---|---|
| E | Number of drilled wells | 0.237 |
| D5 | Actual cost compliance percentage with planned cost | 0.091 |
| D2 | Waiting time percentage to total well drilling time | 0.080 |
| F | Number of planned wells | 0.067 |
| D1 | Employer/Senior Manager Satisfaction | 0.064 |
| C4 | Cost spent for drilling project (Billion Rls) | 0.047 |
| D3 | Number of failure reports | 0.046 |
| A2 | Type of drilling rigs | 0.044 |
| B3 | Experience of drilling specialists working in Project | 0.040 |
| C2 | Type of drilled wells in terms of depth | 0.037 |
| C1 | Type of drilled wells in terms of operational risk | 0.035 |
| A1 | Number of drilling rigs used | 0.033 |
| D4 | Number of accidents caused by non-compliance with safety regulation | 0.031 |
| B2 | Scientific levels of drilling specialists working in the project | 0.028 |
| A4 | Quality of drilling and support service | 0.025 |
| A3 | Quality of materials and goods used | 0.023 |
| B1 | Number of operational experts working on the project | 0.022 |
| C3 | Type and number of fields under operation | 0.019 |
| B4 | Average salaries of employees in the project (Million Rls) | 0.018 |
| C5 | Status of cash flows in project | 0.014 |
| Code | A1 | A2 | A3 | A4 | B1 | B2 | B3 | B4 | C1 | C2 | C3 | C4 | C5 | D1 | D2 | D3 | D4 | D5 | E | F |
|---|---|---|---|---|---|---|---|---|---|---|---|---|---|---|---|---|---|---|---|---|
| Weight | 0.033 | 0.044 | 0.023 | 0.025 | 0.022 | 0.028 | 0.040 | 0.018 | 0.035 | 0.037 | 0.019 | 0.047 | 0.014 | 0.064 | 0.080 | 0.046 | 0.031 | 0.091 | 0.237 | 0.067 |
| Sign | + | + | + | + | + | + | + | + | − | − | − | − | + | + | − | − | − | + | + | − |
| Expert #1 | ||||||||||||||||||||
| Project #1 | G | G | G | VG | F | F | VG | G | F | VG | VG | F | G | G | F | F | F | G | P | G |
| Project #2 | F | VG | F | G | G | G | G | P | P | G | F | G | F | G | P | P | F | VG | G | G |
| Project #3 | F | G | VG | G | G | F | F | P | F | G | P | F | VG | F | F | G | VP | P | VP | G |
| Project #4 | P | G | G | F | F | G | VG | F | G | F | F | VG | G | VG | P | P | G | G | F | VG |
| Project #5 | G | F | F | G | F | G | G | F | VG | F | F | F | G | G | G | VG | G | VP | VG | F |
| Project #6 | F | VG | P | VG | VG | VG | F | P | F | VG | G | P | F | F | VP | P | P | F | P | F |
| Project #7 | G | G | G | F | G | F | F | P | VG | VG | VG | VG | G | VG | P | G | G | F | VP | G |
| Expert #2 | ||||||||||||||||||||
| Project #1 | VG | G | VG | VG | P | F | VG | F | F | VG | VG | F | VG | G | F | F | F | VG | P | G |
| Project #2 | F | VG | P | F | F | G | G | P | VP | G | F | G | F | VG | P | P | F | VG | G | G |
| Project #3 | F | G | G | VG | G | F | P | P | G | G | P | P | VG | F | G | G | VP | P | VP | G |
| Project #4 | P | P | F | P | F | G | VG | F | G | P | F | VG | G | VG | P | P | G | G | P | VG |
| Project #5 | VG | F | F | F | P | G | G | F | VG | F | F | VG | G | G | VG | VP | VG | VP | VG | F |
| Project #6 | F | VG | P | G | VG | VG | P | P | F | VG | G | P | P | P | VP | P | P | P | P | VG |
| Project #7 | VG | G | G | P | G | F | F | P | VG | VG | VG | VG | G | VG | P | G | VG | P | VP | G |
| Expert #3 | ||||||||||||||||||||
| Project #1 | G | G | F | VG | F | F | VG | G | P | VG | VG | F | G | VG | F | F | G | G | G | P |
| Project #2 | F | VG | F | G | G | G | F | P | P | P | F | G | F | G | P | P | F | VG | G | G |
| Project #3 | F | G | VG | F | F | F | P | P | F | G | P | F | VG | P | G | VG | VP | P | P | G |
| Project #4 | VP | F | P | G | G | P | G | G | VG | VP | G | VG | G | G | P | P | VG | VG | G | VG |
| Project #5 | VG | VP | F | G | P | G | G | F | G | VG | F | P | G | F | VG | VP | VG | VP | VG | F |
| Project #6 | P | VG | P | VG | VG | VG | F | P | P | G | G | F | F | VP | VP | P | F | F | VG | VP |
| Project #7 | G | G | G | P | G | F | VP | VP | G | VG | VG | G | G | VG | F | G | VG | G | VP | F |
| Code | A1 | A2 | A3 | A4 | B1 | B2 | B3 | B4 | C1 | C2 |
| Weight | 0.033 | 0.044 | 0.023 | 0.025 | 0.022 | 0.028 | 0.040 | 0.018 | 0.035 | 0.037 |
| Sign | + | + | + | + | + | + | + | + | − | − |
| Project #1 | (0.9, 1, 1) | (0.7, 0.9, 1) | (0.9, 1, 1) | (0.9, 1, 1) | (0, 0.1, 0.3) | (0.3, 0.5, 0.7) | (0.9, 1, 1) | (0.3, 0.5, 0.7) | (0.3, 0.5, 0.7) | (0.9, 1, 1) |
| Project #2 | (0.3, 0.5, 0.7) | (0.9, 1, 1) | (0, 0.1, 0.3) | (0.3, 0.5, 0.7) | (0.3, 0.5, 0.7) | (0.7, 0.9, 1) | (0.7, 0.9, 1) | (0, 0.1, 0.3) | (0, 0, 0.1) | (0.7, 0.9, 1) |
| Project #3 | (0.3, 0.5, 0.7) | (0.7, 0.9, 1) | (0.7, 0.9, 1) | (0.9, 1, 1) | (0.7, 0.9, 1) | (0.3, 0.5, 0.7) | (0, 0.1, 0.3) | (0, 0.1, 0.3) | (0.7, 0.9, 1) | (0.7, 0.9, 1) |
| Project #4 | (0, 0.1, 0.3) | (0, 0.1, 0.3) | (0.3, 0.5, 0.7) | (0, 0.1, 0.3) | (0.3, 0.5, 0.7) | (0.7, 0.9, 1) | (0.9, 1, 1) | (0.3, 0.5, 0.7) | (0.7, 0.9, 1) | (0, 0.1, 0.3) |
| Project #5 | (0.9, 1, 1) | (0.3, 0.5, 0.7) | (0.3, 0.5, 0.7) | (0.3, 0.5, 0.7) | (0, 0.1, 0.3) | (0.7, 0.9, 1) | (0.7, 0.9, 1) | (0.3, 0.5, 0.7) | (0.9, 1, 1) | (0.3, 0.5, 0.7) |
| Project #6 | (0.3, 0.5, 0.7) | (0.9, 1, 1) | (0, 0.1, 0.3) | (0.7, 0.9, 1) | (0.9, 1, 1) | (0.9, 1, 1) | (0, 0.1, 0.3) | (0, 0.1, 0.3) | (0.3, 0.5, 0.7) | (0.9, 1, 1) |
| Project #7 | (0.9, 1, 1) | (0.7, 0.9, 1) | (0.7, 0.9, 1) | (0, 0.1, 0.3) | (0.7, 0.9, 1) | (0.3, 0.5, 0.7) | (0.3, 0.5, 0.7) | (0, 0.1, 0.3) | (0.9, 1, 1) | (0.9, 1, 1) |
| Code | C3 | C4 | C5 | D1 | D2 | D3 | D4 | D5 | E | F |
| Weight | 0.019 | 0.047 | 0.014 | 0.064 | 0.080 | 0.046 | 0.031 | 0.091 | 0.237 | 0.067 |
| Sign | − | − | + | + | − | − | − | + | + | − |
| Project #1 | (0.9, 1, 1) | (0.3, 0.5, 0.7) | (0.9, 1, 1) | (0.7, 0.9, 1) | (0.3, 0.5, 0.7) | (0.3, 0.5, 0.7) | (0.3, 0.5, 0.7) | (0.9, 1, 1) | (0, 0.1, 0.3) | (0.7, 0.9, 1) |
| Project #2 | (0.3, 0.5, 0.7) | (0.7, 0.9, 1) | (0.3, 0.5, 0.7) | (0.9, 1, 1) | (0, 0.1, 0.3) | (0, 0.1, 0.3) | (0.3, 0.5, 0.7) | (0.9, 1, 1) | (0.7, 0.9, 1) | (0.7, 0.9, 1) |
| Project #3 | (0, 0.1, 0.3) | (0, 0.1, 0.3) | (0.9, 1, 1) | (0.3, 0.5, 0.7) | (0.7, 0.9, 1) | (0.7, 0.9, 1) | (0, 0, 0.1) | (0, 0.1, 0.3) | (0, 0, 0.1) | (0.7, 0.9, 1) |
| Project #4 | (0.3, 0.5, 0.7) | (0.9, 1, 1) | (0.7, 0.9, 1) | (0.9, 1, 1) | (0, 0.1, 0.3) | (0, 0.1, 0.3) | (0.7, 0.9, 1) | (0.7, 0.9, 1) | (0, 0.1, 0.3) | (0.9, 1, 1) |
| Project #5 | (0.3, 0.5, 0.7) | (0.9, 1, 1) | (0.7, 0.9, 1) | (0.7, 0.9, 1) | (0.9, 1, 1) | (0, 0, 0.1) | (0.9, 1, 1) | (0, 0, 0.1) | (0.9, 1, 1) | (0.3, 0.5, 0.7) |
| Project #6 | (0.7, 0.9, 1) | (0, 0.1, 0.3) | (0, 0.1, 0.3) | (0, 0.1, 0.3) | (0, 0, 0.1) | (0, 0.1, 0.3) | (0, 0.1, 0.3) | (0, 0.1, 0.3) | (0, 0.1, 0.3) | (0.9, 1, 1) |
| Project #7 | (0.9, 1, 1) | (0.9, 1, 1) | (0.7, 0.9, 1) | (0.9, 1, 1) | (0, 0.1, 0.3) | (0.7, 0.9, 1) | (0.9, 1, 1) | (0, 0.1, 0.3) | (0, 0, 0.1) | (0.7, 0.9, 1) |
| Code | A1 | A2 | A3 | A4 | B1 | B2 | B3 | B4 | C1 | C2 |
| Weight | 0.033 | 0.044 | 0.023 | 0.025 | 0.022 | 0.028 | 0.040 | 0.018 | 0.035 | 0.037 |
| Sign | + | + | + | + | + | + | + | + | − | − |
| Project #1 | (0.7, 0.9, 1) | (0.7, 0.9, 1) | (0.3, 0.5, 0.7) | (0.9, 1, 1) | (0.3, 0.5, 0.7) | (0.3, 0.5, 0.7) | (0.9, 1, 1) | (0.7, 0.9, 1) | (0, 0.1, 0.3) | (0.9, 1, 1) |
| Project #2 | (0.3, 0.5, 0.7) | (0.9, 1, 1) | (0.3, 0.5, 0.7) | (0.7, 0.9, 1) | (0.7, 0.9, 1) | (0.7, 0.9, 1) | (0.3, 0.5, 0.7) | (0, 0.1, 0.3) | (0, 0.1, 0.3) | (0, 0.1, 0.3) |
| Project #3 | (0.3, 0.5, 0.7) | (0.7, 0.9, 1) | (0.9, 1, 1) | (0.3, 0.5, 0.7) | (0.3, 0.5, 0.7) | (0.3, 0.5, 0.7) | (0, 0.1, 0.3) | (0, 0.1, 0.3) | (0.3, 0.5, 0.7) | (0.7, 0.9, 1) |
| Project #4 | (0, 0, 0.1) | (0.3, 0.5, 0.7) | (0, 0.1, 0.3) | (0.7, 0.9, 1) | (0.7, 0.9, 1) | (0, 0.1, 0.3) | (0.7, 0.9, 1) | (0.7, 0.9, 1) | (0.9, 1, 1) | (0, 0, 0.1) |
| Project #5 | (0.9, 1, 1) | (0, 0, 0.1) | (0.3, 0.5, 0.7) | (0.7, 0.9, 1) | (0, 0.1, 0.3) | (0.7, 0.9, 1) | (0.7, 0.9, 1) | (0.3, 0.5, 0.7) | (0.7, 0.9, 1) | (0.9, 1, 1) |
| Project #6 | (0, 0.1, 0.3) | (0.9, 1, 1) | (0, 0.1, 0.3) | (0.9, 1, 1) | (0.9, 1, 1) | (0.9, 1, 1) | (0.3, 0.5, 0.7) | (0, 0.1, 0.3) | (0, 0.1, 0.3) | (0.7, 0.9, 1) |
| Project #7 | (0.7, 0.9, 1) | (0.7, 0.9, 1) | (0.7, 0.9, 1) | (0, 0.1, 0.3) | (0.7, 0.9, 1) | (0.3, 0.5, 0.7) | (0, 0, 0.1) | (0, 0, 0.1) | (0.7, 0.9, 1) | (0.9, 1, 1) |
| Code | C3 | C4 | C5 | D1 | D2 | D3 | D4 | D5 | E | F |
| Weight | 0.019 | 0.047 | 0.014 | 0.064 | 0.080 | 0.046 | 0.031 | 0.091 | 0.237 | 0.067 |
| Sign | − | − | + | + | − | − | − | + | + | − |
| Project #1 | (0.9, 1, 1) | (0.3, 0.5, 0.7) | (0.7, 0.9, 1) | (0.9, 1, 1) | (0.3, 0.5, 0.7) | (0.3, 0.5, 0.7) | (0.7, 0.9, 1) | (0.7, 0.9, 1) | (0.7, 0.9, 1) | (0, 0.1, 0.3) |
| Project #2 | (0.3, 0.5, 0.7) | (0.7, 0.9, 1) | (0.3, 0.5, 0.7) | (0.7, 0.9, 1) | (0, 0.1, 0.3) | (0, 0.1, 0.3) | (0.3, 0.5, 0.7) | (0.9, 1, 1) | (0.7, 0.9, 1) | (0.7, 0.9, 1) |
| Project #3 | (0, 0.1, 0.3) | (0.3, 0.5, 0.7) | (0.9, 1, 1) | (0, 0.1, 0.3) | (0.7, 0.9, 1) | (0.9, 1, 1) | (0, 0, 0.1) | (0, 0.1, 0.3) | (0, 0.1, 0.3) | (0.7, 0.9, 1) |
| Project #4 | (0.7, 0.9, 1) | (0.9, 1, 1) | (0.7, 0.9, 1) | (0.7, 0.9, 1) | (0, 0.1, 0.3) | (0, 0.1, 0.3) | (0.9, 1, 1) | (0.9, 1, 1) | (0.7, 0.9, 1) | (0.9, 1, 1) |
| Project #5 | (0.3, 0.5, 0.7) | (0, 0.1, 0.3) | (0.7, 0.9, 1) | (0.3, 0.5, 0.7) | (0.9, 1, 1) | (0, 0, 0.1) | (0.9, 1, 1) | (0, 0, 0.1) | (0.9, 1, 1) | (0.3, 0.5, 0.7) |
| Project #6 | (0.7, 0.9, 1) | (0.3, 0.5, 0.7) | (0.3, 0.5, 0.7) | (0, 0, 0.1) | (0, 0, 0.1) | (0, 0.1, 0.3) | (0.3, 0.5, 0.7) | (0.3, 0.5, 0.7) | (0.9, 1, 1) | (0, 0, 0.1) |
| Project #7 | (0.9, 1, 1) | (0.7, 0.9, 1) | (0.7, 0.9, 1) | (0.9, 1, 1) | (0.3, 0.5, 0.7) | (0.7, 0.9, 1) | (0.9, 1, 1) | (0.7, 0.9, 1) | (0, 0, 0.1) | (0.3, 0.5, 0.7) |
| Code | A1 | A2 | A3 | A4 | B1 | B2 | B3 | B4 | C1 | C2 |
| Weight | 0.033 | 0.044 | 0.023 | 0.025 | 0.022 | 0.028 | 0.040 | 0.018 | 0.035 | 0.037 |
| Sign | + | + | + | + | + | + | + | + | − | − |
| Ideal Alternative (X0) | [(0.7, 0.8277), 0.9655, (1, 1)] | [(0.9, 0.9), 1, (1, 1)] | [(0.7, 0.8277), 0.9655, (1, 1)] | [(0.9, 0.9), 1, (1, 1)] | [(0.9, 0.9), 1, (1, 1)] | [(0.9, 0.9), 1, (1, 1)] | [(0.9, 0.9), 1, (1, 1)] | [(0.3, 0.5278), 0.7399, (0.8879, 1)] | [(0, 0), 0, (0.2080, 0.3)] | [(0, 0), 0, (0.2759, 0.7)] |
| Project #1 | [(0.7, 0.76), 0.93, (1, 1)] | [(0.7, 0.7), 0.90, (1, 1)] | [(0.30, 0.57), 0.77, (0.89, 1)] | [(0.90, 0.90), 1, (1, 1)] | [(0, 0), 0.29, (0.53, 0.7)] | [(0.30, 0.30), 0.50, (0.7, 0.7)] | [(0.90, 0.90), 1, (1, 1)] | [(0.30, 0.53), 0.74, (0.89, 1)] | [(0, 0), 0.29, (0.53, 0.7)] | [(0.90, 0.90), 1, (1, 1)] |
| Project #2 | [(0.30, 0.30), 0.50, (0.7, 0.7)] | [(0.90, 0.90), 1, (1, 1)] | [(0, 0), 0.29, (0.53, 0.7)] | [(0.30, 0.53), 0.74, (0.89, 1)] | [(0.30, 0.53), 0.74, (0.89, 1)] | [(0.7, 0.7), 0.90, (1, 1)] | [(0.30, 0.53), 0.74, (0.89, 1)] | [(0, 0), 0.10, (0.30, 0.30)] | [(0, 0), 0, (0.21, 0.30)] | [(0, 0), 0.43, (0.67, 1)] |
| Project #3 | [(0.30, 0.30), 0.50, (0.7, 0.7)] | [(0.7, 0.7), 0.90, (1, 1)] | [(0.7, 0.83), 0.97, (1, 1)] | [(0.30, 0.57), 0.77, (0.89, 1)] | [(0.30, 0.53), 0.74, (0.89, 1)] | [(0.30, 0.30), 0.50, (0.7, 0.7)] | [(0, 0), 0.17, (0.40, 0.7)] | [(0, 0), 0.10, (0.30, 0.30)] | [(0.30, 0.40), 0.61, (0.79, 1)] | [(0.7, 0.7), 0.90, (1, 1)] |
| Project #4 | [(0, 0), 0, (0.21, 0.30)] | [(0, 0), 0.36, (0.59, 1)] | [(0, 0), 0.36, (0.59, 1)] | [(0, 0), 0.36, (0.59, 1)] | [(0.30, 0.40), 0.61, (0.79, 1)] | [(0, 0), 0.43, (0.67, 1)] | [(0.7, 0.83), 0.97, (1, 1)] | [(0.30, 0.40), 0.61, (0.79, 1)] | [(0.7, 0.76), 0.93, (1, 1)] | [(0, 0), 0, (0.28, 0.7)] |
| Project #5 | [(0.7, 0.83), 0.97, (1, 1)] | [(0, 0), 0, (0.37, 0.7)] | [(0.30, 0.30), 0.50, (0.7, 0.7)] | [(0.30, 0.53), 0.74, (0.89, 1)] | [(0, 0), 0.17, (0.40, 0.7)] | [(0.7, 0.7), 0.90, (1, 1)] | [(0.7, 0.7), 0.90, (1, 1)] | [(0.30, 0.30), 0.50, (0.7, 0.7)] | [(0.7, 0.83), 0.97, (1, 1)] | [(0.30, 0.43), 0.63, (0.79, 1)] |
| Project #6 | [(0, 0), 0.29, (0.53, 0.7)] | [(0.90, 0.90), 1, (1, 1)] | [(0, 0), 0.10, (0.30, 0.30)] | [(0.7, 0.83), 0.97, (1, 1)] | [(0.90, 0.90), 1, (1, 1)] | [(0.90, 0.90), 1, (1, 1)] | [(0, 0), 0.29, (0.53, 0.7)] | [(0, 0), 0.10, (0.30, 0.30)] | [(0, 0), 0.29, (0.53, 0.7)] | [(0.7, 0.83), 0.97, (1, 1)] |
| Project #7 | [(0.7, 0.76), 0.93, (1, 1)] | [(0.7, 0.7), 0.90, (1, 1)] | [(0.7, 0.7), 0.90, (1, 1)] | [(0, 0), 0.17, (0.40, 0.7)] | [(0.7, 0.7), 0.90, (1, 1)] | [(0.30, 0.30), 0.50, (0.7, 0.7)] | [(0, 0), 0, (0.37, 0.7)] | [(0, 0), 0, (0.21, 0.30)] | [(0.7, 0.83), 0.97, (1, 1)] | [(0.90, 0.90), 1, (1, 1)] |
| Code | C3 | C4 | C5 | D1 | D2 | D3 | D4 | D5 | E | F |
| Weight | 0.019 | 0.047 | 0.014 | 0.064 | 0.080 | 0.046 | 0.031 | 0.091 | 0.237 | 0.067 |
| Sign | − | − | + | + | − | − | − | + | + | − |
| Ideal Alternative (X0) | [(0, 0), 0.1, (0.3, 0.3)] | [(0, 0), 0.1710, (0.3979, 0.7)] | [(0.9, 0.9), 1, (1, 1)] | [(0.9, 0.9), 1, (1, 1)] | [(0, 0), 0, (0.1, 0.1)] | [(0, 0), 0, (0.2154, 0.3)] | [(0, 0), 0, (0.1, 0.1)] | [(0.9, 0.9), 1, (1, 1)] | [(0.9, 0.9), 1, (1, 1)] | [(0, 0), 0, (0.4121, 0.7)] |
| Project #1 | [(0.90, 0.90), 1, (1, 1)] | [(0.30, 0.30), 0.50, (0.7, 0.7)] | [(0.7, 0.76), 0.93, (1, 1)] | [(0.7, 0.76), 0.93, (1, 1)] | [(0.30, 0.30), 0.50, (0.7, 0.7)] | [(0.30, 0.30), 0.50, (0.7, 0.7)] | [(0.30, 0.40), 0.61, (0.79, 1)] | [(0.7, 0.76), 0.93, (1, 1)] | [(0, 0), 0.21, (0.45, 1)] | [(0, 0), 0.43, (0.67, 1)] |
| Project #2 | [(0.30, 0.30), 0.50, (0.7, 0.7)] | [(0.7, 0.7), 0.90, (1, 1)] | [(0.30, 0.30), 0.50, (0.7, 0.7)] | [(0.7, 0.76), 0.93, (1, 1)] | [(0, 0), 0.10, (0.30, 0.30)] | [(0, 0), 0.10, (0.30, 0.30)] | [(0.30, 0.30), 0.50, (0.7, 0.7)] | [(0.90, 0.90), 1, (1, 1)] | [(0.7, 0.7), 0.90, (1, 1)] | [(0.7, 0.7), 0.90, (1, 1)] |
| Project #3 | [(0, 0), 0.10, (0.30, 0.30)] | [(0, 0), 0.29, (0.53, 0.7)] | [(0.90, 0.90), 1, (1, 1)] | [(0, 0), 0.29, (0.53, 0.7)] | [(0.30, 0.53), 0.74, (0.89, 1)] | [(0.7, 0.76), 0.93, (1, 1)] | [(0, 0), 0, (0.10, 0.10)] | [(0, 0), 0.10, (0.30, 0.30)] | [(0, 0), 0, (0.14, 0.30)] | [(0.7, 0.7), 0.90, (1, 1)] |
| Project #4 | [(0.30, 0.40), 0.61, (0.79, 1)] | [(0.90, 0.90), 1, (1, 1)] | [(0.7, 0.7), 0.90, (1, 1)] | [(0.7, 0.83), 0.97, (1, 1)] | [(0, 0), 0.10, (0.30, 0.30)] | [(0, 0), 0.10, (0.30, 0.30)] | [(0.7, 0.76), 0.93, (1, 1)] | [(0.7, 0.76), 0.93, (1, 1)] | [(0, 0), 0.36, (0.59, 1)] | [(0.90, 0.90), 1, (1, 1)] |
| Project #5 | [(0.30, 0.30), 0.50, (0.7, 0.7)] | [(0, 0), 0.37, (0.59, 1)] | [(0.7, 0.7), 0.90, (1, 1)] | [(0.30, 0.53), 0.74, (0.89, 1)] | [(0.7, 0.83), 0.97, (1, 1)] | [(0, 0), 0, (0.22, 1)] | [(0.7, 0.83), 0.97, (1, 1)] | [(0, 0), 0, (0.10, 0.10)] | [(0.90, 0.90), 1, (1, 1)] | [(0.30, 0.30), 0.50, (0.7, 0.7)] |
| Project #6 | [(0.7, 0.7), 0.90, (1, 1)] | [(0, 0), 0.17, (0.40, 0.7)] | [(0, 0), 0.29, (0.53, 0.7)] | [(0, 0), 0, (0.28, 0.7)] | [(0, 0), 0, (0.10, 0.10)] | [(0, 0), 0.10, (0.30, 0.30)] | [(0, 0), 0.17, (0.40, 0.7)] | [(0, 0), 0.29, (0.53, 0.7)] | [(0, 0), 0.22, (0.45, 1)] | [(0, 0), 0, (0.41, 1)] |
| Project #7 | [(0.90, 0.90), 1, (1, 1)] | [(0.7, 0.83), 0.97, (1, 1)] | [(0.7, 0.7), 0.90, (1, 1)] | [(0.90, 0.90), 1, (1, 1)] | [(0, 0), 0.17, (0.40, 0.7)] | [(0.7, 0.7), 0.90, (1, 1)] | [(0.7, 0.83), 0.97, (1, 1)] | [(0, 0), 0.36, (0.59, 1)] | [(0, 0), 0, (0.10, 0.10)] | [(0.30, 0.53), 0.74, (0.89, 1)] |
| Code | A1 | A2 | A3 | A4 | B1 | B2 | B3 | B4 | C1 | C2 |
| Weight | 0.033 | 0.044 | 0.023 | 0.025 | 0.022 | 0.028 | 0.040 | 0.018 | 0.035 | 0.037 |
| Sign | + | + | + | + | + | + | + | + | − | − |
| Ideal Alternative (X0) | [(0.1169, 0.1169), 0.1299, (0.1299, 0.1299)] | [(0.1045, 0.1235), 0.1441, (0.1493, 0.1493)] | [(0.1169, 0.1169), 0.1299, (0.1299, 0.1299)] | [(0.1216, 0.1216), 0.1351, (0.1351, 0.1351)] | [(0.1268, 0.1268), 0.1408, (0.1408, 0.1408)] | [(0.1268, 0.1268), 0.1408, (0.1408, 0.1408)] | [(0.0612, 0.1077), 0.1510, (0.1812, 0.2041)] | [(0.2007, 0.2007), 0.2007, (0, 0)] | [(0.2687, 0.2687), 0.2687, (0, 0)] | [(0.5132, 0.5132), 0, (0, 0)] |
| Project #1 | [(0.0909, 0.0909), 0.1169, (0.1299, 0.1299)] | [(0.0448, 0.0857), 0.1144, (0.1325, 0.1493)] | [(0.1169, 0.1169), 0.1299, (0.1299, 0.1299)] | [(0, 0), 0.0395, (0.0713, 0.0946)] | [(0.0423, 0.0423), 0.0704, (0.0986, 0.0986)] | [(0.1268, 0.1268), 0.1408, (0.1408, 0.1408)] | [(0.0612, 0.1077), 0.1510, (0.1812, 0.2041)] | [(0.1911, 0.1911), 0, (0, 0)] | [(0, 0), 0, (0, 0)] | [(0, 0), 0, (0, 0)] |
| Project #2 | [(0.1169, 0.1169), 0.1299, (0.1299, 0.1299)] | [(0, 0), 0.0436, (0.0788, 0.1045)] | [(0.0390, 0.0685), 0.0961, (0.1153, 0.1299)] | [(0.0405, 0.0713), 0.1000, (0.1200, 0.1351)] | [(0.0986, 0.0986), 0.1268, (0.1408, 0.1408)] | [(0.0423, 0.0743), 0.1042, (0.1251, 0.1408)] | [(0, 0), 0.0204, (0.0612, 0.0612)] | [(0.3232, 0.3232), 0.3232, (0, 0)] | [(0.4326, 0.4326), 0, (0, 0)] | [(0, 0), 0, (0, 0)] |
| Project #3 | [(0.0909, 0.0909), 0.1169, (0.1299, 0.1299)] | [(0.1045, 0.1235), 0.1441, (0.1493, 0.1493)] | [(0.0390, 0.0745), 0.0995, (0.1153, 0.1299)] | [(0.0405, 0.0713), 0.1000, (0.1200, 0.1351)] | [(0.0423, 0.0423), 0.0704, (0.0986, 0.0986)] | [(0, 0), 0.0241, (0.0560, 0.0986)] | [(0, 0), 0.0204, (0.0612, 0.0612)] | [(0, 0), 0, (0, 0)] | [(0, 0), 0, (0, 0)] | [(0.4868, 0.4868), 0, (0, 0)] |
| Project #4 | [(0, 0), 0.0462, (0.0772, 0.1299)] | [(0, 0), 0.0531, (0.0887, 0.1493)] | [(0, 0), 0.0462, (0.0772, 0.1299)] | [(0.0405, 0.0538), 0.0822, (0.1065, 0.1351)] | [(0, 0), 0.0609, (0.0943, 0.1408)] | [(0.0986, 0.1166), 0.1360, (0.1408, 0.1408)] | [(0.0612, 0.0812), 0.1241, (0.1609, 0.2041)] | [(0, 0), 0, (0, 0)] | [(0.2987, 0.2987), 0.2987, (0, 0)] | [(0, 0), 0, (0, 0)] |
| Project #5 | [(0, 0), 0, (0.0475, 0.0909)] | [(0.0448, 0.0448), 0.0746, (0.1045, 0.1045)] | [(0.0390, 0.0685), 0.0961, (0.1153, 0.1299)] | [(0, 0), 0.0231, (0.0538, 0.0946)] | [(0.0986, 0.0986), 0.1268, (0.1408, 0.1408)] | [(0.0986, 0.0986), 0.1268, (0.1408, 0.1408)] | [(0.0612, 0.0612), 0.1020, (0.1429, 0.1429)] | [(0, 0), 0, (0, 0)] | [(0, 0), 0, (0, 0)] | [(0, 0), 0, (0, 0)] |
| Project #6 | [(0.1169, 0.1169), 0.1299, (0.1299, 0.1299)] | [(0, 0), 0.0149, (0.0448, 0.0448)] | [(0.0909, 0.1075), 0.1254, (0.1299, 0.1299)] | [(0.1216, 0.1216), 0.1351, (0.1351, 0.1351)] | [(0.1268, 0.1268), 0.1408, (0.1408, 0.1408)] | [(0, 0), 0.0412, (0.0743, 0.0986)] | [(0, 0), 0.0204, (0.0612, 0.0612)] | [(0.2849, 0.2849), 0, (0, 0)] | [(0, 0), 0, (0, 0)] | [(0, 0), 0, (0, 0)] |
| Project #7 | [(0.0909, 0.0909), 0.1169, (0.1299, 0.1299)] | [(0.1045, 0.1045), 0.1343, (0.1493, 0.1493)] | [(0, 0), 0.0222, (0.0517, 0.0909)] | [(0.0946, 0.0946), 0.1216, (0.1351, 0.1351)] | [(0.0423, 0.0423), 0.0704, (0.0986, 0.0986)] | [(0, 0), 0, (0.0515, 0.0986)] | [(0, 0), 0, (0.0425, 0.0612)] | [(0, 0), 0, (0, 0)] | [(0, 0), 0, (0, 0)] | [(0, 0), 0, (0, 0)] |
| Code | C3 | C4 | C5 | D1 | D2 | D3 | D4 | D5 | E | F |
| Weight | 0.019 | 0.047 | 0.014 | 0.064 | 0.080 | 0.046 | 0.031 | 0.091 | 0.237 | 0.067 |
| Sign | − | − | + | + | − | − | − | + | + | − |
| Ideal Alternative (X0) | [(0.1992, 0.1992), 0, (0, 0)] | [(0.1216, 0.1216), 0.1351, (0.1351, 0.1351)] | [(0.1216, 0.1216), 0.1351, (0.1351, 0.1351)] | [(0.1584, 0.1584), 0.1584, (0, 0)] | [(0.1472, 0.1472), 0.1472, (0, 0)] | [(0.2969, 0.2969), 0.2969, (0, 0)] | [(0.1475, 0.1475), 0.1639, (0.1639, 0.1639)] | [(0.1406, 0.1406), 0.1563, (0.1563, 0.1563)] | [(0.2966, 0.2966), 0.2966, (0, 0)] | |
| Project #1 | [(0, 0), 0, (0, 0)] | [(0.0946, 0.1029), 0.1260, (0.1351, 0.1351)] | [(0.0946, 0.1029), 0.1260, (0.1351, 0.1351)] | [(0, 0), 0, (0, 0)] | [(0, 0), 0, (0, 0)] | [(0, 0), 0, (0, 0)] | [(0.1148, 0.1248), 0.1528, (0.1639, 0.1639)] | [(0, 0), 0.0325, (0.0700, 0.1563)] | [(0.2824, 0.2824), 0, (0, 0)] | |
| Project #2 | [(0, 0), 0, (0, 0)] | [(0.0405, 0.0405), 0.0676, (0.0946, 0.0946)] | [(0.0946, 0.1029), 0.1260, (0.1351, 0.1351)] | [(0.2550, 0.2550), 0, (0, 0)] | [(0.2370, 0.2370), 0, (0, 0)] | [(0, 0), 0, (0, 0)] | [(0.1475, 0.1475), 0.1639, (0.1639, 0.1639)] | [(0.1094, 0.1094), 0.1406, (0.1563, 0.1563)] | [(0, 0), 0, (0, 0)] | |
| Project #3 | [(0.1889, 0.1889), 0, (0, 0)] | [(0.1216, 0.1216), 0.1351, (0.1351, 0.1351)] | [(0, 0), 0.0395, (0.0713, 0.0946)] | [(0, 0), 0, (0, 0)] | [(0, 0), 0, (0, 0)] | [(0.2816, 0.2816), 0.2816, (0, 0)] | [(0, 0), 0.0164, (0.0492, 0.0492)] | [(0, 0), 0, (0.0225, 0.0469)] | [(0, 0), 0, (0, 0)] | |
| Project #4 | [(0, 0), 0, (0, 0)] | [(0.0946, 0.0946), 0.1216, (0.1351, 0.1351)] | [(0.0946, 0.1118), 0.1305, (0.1351, 0.1351)] | [(0.1761, 0.1761), 0, (0, 0)] | [(0.1636, 0.1636), 0, (0, 0)] | [(0, 0), 0, (0, 0)] | [(0.1148, 0.1248), 0.1528, (0.1639, 0.1639)] | [(0, 0), 0.0556, (0.0929, 0.1563)] | [(0, 0), 0, (0, 0)] | |
| Project #5 | [(0.3293, 0.3293), 0, (0, 0)] | [(0.0946, 0.0946), 0.1216, (0.1351, 0.1351)] | [(0.0405, 0.0713), 0.1000, (0.1200, 0.1351)] | [(0, 0), 0, (0, 0)] | [(0.2433, 0.2433), 0.2433, (0, 0)] | [(0, 0), 0, (0, 0)] | [(0, 0), 0, (0.0164, 0.0164)] | [(0.1406, 0.1406), 0.1563, (0.1563, 0.1563)] | [(0, 0), 0, (0, 0)] | |
| Project #6 | [(0.2827, 0.2827), 0, (0, 0)] | [(0, 0), 0.0395, (0.0713, 0.0946)] | [(0, 0), 0, (0.0373, 0.0946)] | [(0.2248, 0.2248), 0.2248, (0, 0)] | [(0.2089, 0.2089), 0, (0, 0)] | [(0.4215, 0.4215), 0, (0, 0)] | [(0, 0), 0.0479, (0.0865, 0.1148)] | [(0, 0), 0.0337, (0.0700, 0.1563)] | [(0.4210, 0.4210), 0.4210, (0, 0)] | |
| Project #7 | [(0, 0), 0, (0, 0)] | [(0.0946, 0.0946), 0.1216, (0.1351, 0.1351)] | [(0.1216, 0.1216), 0.1351, (0.1351, 0.1351)] | [(0.1858, 0.1858), 0, (0, 0)] | [(0, 0), 0, (0, 0)] | [(0, 0), 0, (0, 0)] | [(0, 0), 0.0583, (0.0974, 0.1639)] | [(0, 0), 0, (0.0156, 0.0156)] | [(0, 0), 0, (0, 0)] |
| Code | A1 | A2 | A3 | A4 | B1 | B2 | B3 | B4 | C1 | C2 |
| Weight | 0.033 | 0.044 | 0.023 | 0.025 | 0.022 | 0.028 | 0.040 | 0.018 | 0.035 | 0.037 |
| Sign | + | + | + | + | + | + | + | + | − | − |
| Ideal Alternative (X0) | [(0.0036, 0.0043), 0.0050, (0.0052, 0.0052)] | [(0.0051, 0.0051), 0.0057, (0.0057, 0.0057)] | [(0.0024, 0.0028), 0.0033, (0.0034, 0.0034)] | [(0.0029, 0.0029), 0.0032, (0.0032, 0.0032)] | [(0.0027, 0.0027), 0.0030, (0.0030, 0.0030)] | [(0.0035, 0.0035), 0.0039, (0.0039, 0.0039)] | [(0.0051, 0.0051), 0.0056, (0.0056, 0.0056)] | [(0.0011, 0.0019), 0.0027, (0.0032, 0.0036)] | [(0.0071, 0.0071), 0.0071, (0, 0)] | [(0.0098, 0.0098), 0.0098, (0, 0)] |
| Project #1 | [(0.0036, 0.0040), 0.0049, (0.0052, 0.0052)] | [(0.0040, 0.0040), 0.0051, (0.0057, 0.0057)] | [(0.0010, 0.0019), 0.0026, (0.0030, 0.0034)] | [(0.0029, 0.0029), 0.0032, (0.0032, 0.0032)] | [(0, 0), 0.0009, (0.0016, 0.0021)] | [(0.0012, 0.0012), 0.0019, (0.0027, 0.0027)] | [(0.0051, 0.0051), 0.0056, (0.0056, 0.0056)] | [(0.0011, 0.0019), 0.0027, (0.0032, 0.0036)] | [(0.0067, 0.0067), 0, (0, 0)] | [(0, 0), 0, (0, 0)] |
| Project #2 | [(0.0016, 0.0016), 0.0026, (0.0036, 0.0036)] | [(0.0051, 0.0051), 0.0057, (0.0057, 0.0057)] | [(0, 0), 0.0010, (0.0018, 0.0024)] | [(0.0010, 0.0017), 0.0024, (0.0029, 0.0032)] | [(0.0009, 0.0016), 0.0022, (0.0026, 0.0030)] | [(0.0027, 0.0027), 0.0035, (0.0039, 0.0039)] | [(0.0017, 0.0030), 0.0042, (0.0050, 0.0056)] | [(0, 0), 0.0004, (0.0011, 0.0011)] | [(0.0114, 0.0114), 0.0114, (0, 0)] | [(0.0158, 0.0158), 0, (0, 0)] |
| Project #3 | [(0.0016, 0.0016), 0.0026, (0.0036, 0.0036)] | [(0.0040, 0.0040), 0.0051, (0.0057, 0.0057)] | [(0.0024, 0.0028), 0.0033, (0.0034, 0.0034)] | [(0.0010, 0.0018), 0.0025, (0.0029, 0.0032)] | [(0.0009, 0.0016), 0.0022, (0.0026, 0.0030)] | [(0.0012, 0.0012), 0.0019, (0.0027, 0.0027)] | [(0, 0), 0.0010, (0.0022, 0.0040)] | [(0, 0), 0.0004, (0.0011, 0.0011)] | [(0, 0), 0, (0, 0)] | [(0, 0), 0, (0, 0)] |
| Project #4 | [(0, 0), 0, (0.0011, 0.0016)] | [(0, 0), 0.0020, (0.0034, 0.0057)] | [(0, 0), 0.0012, (0.0020, 0.0034)] | [(0, 0), 0.0011, (0.0019, 0.0032)] | [(0.0009, 0.0012), 0.0018, (0.0023, 0.0030)] | [(0, 0), 0.0017, (0.0026, 0.0039)] | [(0.0040, 0.0047), 0.0055, (0.0056, 0.0056)] | [(0.0011, 0.0015), 0.0022, (0.0029, 0.0036)] | [(0, 0), 0, (0, 0)] | [(0.0109, 0.0109), 0.0109, (0, 0)] |
| Project #5 | [(0.0036, 0.0043), 0.0050, (0.0052, 0.0052)] | [(0, 0), 0, (0.0021, 0.0040)] | [(0.0010, 0.0010), 0.0017, (0.0024, 0.0024)] | [(0.0010, 0.0017), 0.0024, (0.0029, 0.0032)] | [(0, 0), 0.0005, (0.0012, 0.0021)] | [(0.0027, 0.0027), 0.0035, (0.0039, 0.0039)] | [(0.0040, 0.0040), 0.0051, (0.0056, 0.0056)] | [(0.0011, 0.0011), 0.0018, (0.0026, 0.0026)] | [(0, 0), 0, (0, 0)] | [(0, 0), 0, (0, 0)] |
| Project #6 | [(0, 0), 0.0015, (0.0027, 0.0036)] | [(0.0051, 0.0051), 0.0057, (0.0057, 0.0057)] | [(0, 0), 0.0003, (0.0010, 0.0010)] | [(0.0023, 0.0027), 0.0031, (0.0032, 0.0032)] | [(0.0027, 0.0027), 0.0030, (0.0030, 0.0030)] | [(0.0035, 0.0035), 0.0039, (0.0039, 0.0039)] | [(0, 0), 0.0017, (0.0030, 0.0040)] | [(0, 0), 0.0004, (0.0011, 0.0011)] | [(0.0100, 0.0100), 0, (0, 0)] | [(0, 0), 0, (0, 0)] |
| Project #7 | [(0.0036, 0.0040), 0.0049, (0.0052, 0.0052)] | [(0.0040, 0.0040), 0.0051, (0.0057, 0.0057)] | [(0.0024, 0.0024), 0.0031, (0.0034, 0.0034)] | [(0, 0), 0.0006, (0.0013, 0.0023)] | [(0.0021, 0.0021), 0.0027, (0.0030, 0.0030)] | [(0.0012, 0.0012), 0.0019, (0.0027, 0.0027)] | [(0, 0), 0, (0.0021, 0.0040)] | [(0, 0), 0, (0.0008, 0.0011)] | [(0, 0), 0, (0, 0)] | [(0, 0), 0, (0, 0)] |
| Code | C3 | C4 | C5 | D1 | D2 | D3 | D4 | D5 | E | F |
| Weight | 0.019 | 0.047 | 0.014 | 0.064 | 0.080 | 0.046 | 0.031 | 0.091 | 0.237 | 0.067 |
| Sign | − | − | + | + | − | − | − | + | + | − |
| Ideal Alternative (X0) | [(0.0097, 0.0097), 0, (0, 0)] | [(0.0093, 0.0093), 0, (0, 0)] | [(0.0017, 0.0017), 0.0019, (0.0019, 0.0019)] | [(0.0078, 0.0078), 0.0086, (0.0086, 0.0086)] | [(0.0127, 0.0127), 0.0127, (0, 0)] | [(0.0068, 0.0068), 0.0068, (0, 0)] | [(0.0092, 0.0092), 0.0092, (0, 0)] | [(0.0134, 0.0134), 0.0149, (0.0149, 0.0149)] | [(0.0334, 0.0334), 0.0371, (0.0371, 0.0371)] | [(0.0198, 0.0198), 0.0198, (0, 0)] |
| Project #1 | [(0, 0), 0, (0, 0)] | [(0, 0), 0, (0, 0)] | [(0.0013, 0.0015), 0.0018, (0.0019, 0.0019)] | [(0.0060, 0.0066), 0.0080, (0.0086, 0.0086)] | [(0, 0), 0, (0, 0)] | [(0, 0), 0, (0, 0)] | [(0, 0), 0, (0, 0)] | [(0.0105, 0.0114), 0.0139, (0.0149, 0.0149)] | [(0, 0), 0.0077, (0.0166, 0.0371)] | [(0.0188, 0.0188), 0, (0, 0)] |
| Project #2 | [(0, 0), 0, (0, 0)] | [(0, 0), 0, (0, 0)] | [(0.0006, 0.0006), 0.0010, (0.0013, 0.0013)] | [(0.0060, 0.0066), 0.0080, (0.0086, 0.0086)] | [(0.0205, 0.0205), 0, (0, 0)] | [(0.0109, 0.0109), 0, (0, 0)] | [(0, 0), 0, (0, 0)] | [(0.0134, 0.0134), 0.0149, (0.0149, 0.0149)] | [(0.0260, 0.0260), 0.0334, (0.0371, 0.0371)] | [(0, 0), 0, (0, 0)] |
| Project #3 | [(0.0092, 0.0092), 0, (0, 0)] | [(0.0088, 0.0088), 0, (0, 0)] | [(0.0017, 0.0017), 0.0019, (0.0019, 0.0019)] | [(0, 0), 0.0025, (0.0046, 0.0060)] | [(0, 0), 0, (0, 0)] | [(0, 0), 0, (0, 0)] | [(0.0088, 0.0088), 0.0088, (0, 0)] | [(0, 0), 0.0015, (0.0045, 0.0045)] | [(0, 0), 0, (0.0053, 0.0111)] | [(0, 0), 0, (0, 0)] |
| Project #4 | [(0, 0), 0, (0, 0)] | [(0, 0), 0, (0, 0)] | [(0.0013, 0.0013), 0.0017, (0.0019, 0.0019)] | [(0.0060, 0.0071), 0.0083, (0.0086, 0.0086)] | [(0.0141, 0.0141), 0, (0, 0)] | [(0.0075, 0.0075), 0, (0, 0)] | [(0, 0), 0, (0, 0)] | [(0.0105, 0.0114), 0.0139, (0.0149, 0.0149)] | [(0, 0), 0.0132, (0.0220, 0.0371)] | [(0, 0), 0, (0, 0)] |
| Project #5 | [(0, 0), 0, (0, 0)] | [(0.0154, 0.0154), 0, (0, 0)] | [(0.0013, 0.0013), 0.0017, (0.0019, 0.0019)] | [(0.0026, 0.0046), 0.0064, (0.0077, 0.0086)] | [(0, 0), 0, (0, 0)] | [(0.0112, 0.0112), 0.0112, (0, 0)] | [(0, 0), 0, (0, 0)] | [(0, 0), 0, (0.0015, 0.0015)] | [(0.0334, 0.0334), 0.0371, (0.0371, 0.0371)] | [(0, 0), 0, (0, 0)] |
| Project #6 | [(0, 0), 0, (0, 0)] | [(0.0132, 0.0132), 0, (0, 0)] | [(0, 0), 0.0006, (0.0010, 0.0013)] | [(0, 0), 0, (0.0024, 0.0060)] | [(0.0181, 0.0181), 0.0181, (0, 0)] | [(0.0096, 0.0096), 0, (0, 0)] | [(0.0131, 0.0131), 0, (0, 0)] | [(0, 0), 0.0044, (0.0079, 0.0105)] | [(0, 0), 0.0080, (0.0166, 0.0371)] | [(0.0281, 0.0281), 0.0281, (0, 0)] |
| Project #7 | [(0, 0), 0, (0, 0)] | [(0, 0), 0, (0, 0)] | [(0.0013, 0.0013), 0.0017, (0.0019, 0.0019)] | [(0.0078, 0.0078), 0.0086, (0.0086, 0.0086)] | [(0.0149, 0.0149), 0, (0, 0)] | [(0, 0), 0, (0, 0)] | [(0, 0), 0, (0, 0)] | [(0, 0), 0.0053, (0.0089, 0.0149)] | [(0, 0), 0, (0.0037, 0.0037)] | [(0, 0), 0, (0, 0)] |
| Alternatives | S | λ = 0 | λ = 0.5 | λ = 1 | ||||||
|---|---|---|---|---|---|---|---|---|---|---|
| BNP | Q | Rank | BNP | Q | Rank | BNP | Q | Rank | ||
| Ideal Alternative | [(0.167, 0.169), 0.160, (0.096, 0.096)] | 0.144 | 1 | 0 | 0.142 | 1 | 0 | 0.161 | 1 | 0 |
| Project #1 | [(0.062, 0.066),0.058, (0.072, 0.094)] | 0.073 | 0.505 | 4 | 0.069 | 0.485 | 4 | 0.066 | 0.411 | 4 |
| Project #2 | [(0.118, 0.121), 0.091, (0.089, 0.090)] | 0.101 | 0.704 | 1 | 0.010 | 0.705 | 1 | 0.094 | 0.581 | 1 |
| Project #3 | [(0.039, 0.041),0.034, (0.041, 0.050)] | 0.043 | 0.2959 | 7 | 0.040 | 0.281 | 7 | 0.038 | 0.238 | 7 |
| Project #4 | [(0.056, 0.060), 0.064, (0.069, 0.093)] | 0.070 | 0.483 | 5 | 0.068 | 0.477 | 5 | 0.066 | 0.409 | 5 |
| Project #5 | [(0.077, 0.081), 0.076, (0.074, 0.078)] | 0.076 | 0.528 | 3 | 0.077 | 0.545 | 3 | 0.079 | 0.489 | 2 |
| Project #6 | [(0.106, 0.106), 0.079, (0.051, 0.080)] | 0.080 | 0.553 | 2 | 0.083 | 0.590 | 2 | 0.068 | 0.420 | 3 |
| Project #7 | [(0.037, 0.038), 0.034, (0.047, 0.056)] | 0.045 | 0.310 | 6 | 0.041 | 0.290 | 6 | 0.039 | 0.244 | 6 |
© 2018 by the authors. Licensee MDPI, Basel, Switzerland. This article is an open access article distributed under the terms and conditions of the Creative Commons Attribution (CC BY) license (http://creativecommons.org/licenses/by/4.0/).
Share and Cite
Dahooie, J.H.; Zavadskas, E.K.; Abolhasani, M.; Vanaki, A.; Turskis, Z. A Novel Approach for Evaluation of Projects Using an Interval–Valued Fuzzy Additive Ratio Assessment (ARAS) Method: A Case Study of Oil and Gas Well Drilling Projects. Symmetry 2018, 10, 45. https://doi.org/10.3390/sym10020045
Dahooie JH, Zavadskas EK, Abolhasani M, Vanaki A, Turskis Z. A Novel Approach for Evaluation of Projects Using an Interval–Valued Fuzzy Additive Ratio Assessment (ARAS) Method: A Case Study of Oil and Gas Well Drilling Projects. Symmetry. 2018; 10(2):45. https://doi.org/10.3390/sym10020045
Chicago/Turabian StyleDahooie, Jalil Heidary, Edmundas Kazimieras Zavadskas, Mahdi Abolhasani, Amirsalar Vanaki, and Zenonas Turskis. 2018. "A Novel Approach for Evaluation of Projects Using an Interval–Valued Fuzzy Additive Ratio Assessment (ARAS) Method: A Case Study of Oil and Gas Well Drilling Projects" Symmetry 10, no. 2: 45. https://doi.org/10.3390/sym10020045
APA StyleDahooie, J. H., Zavadskas, E. K., Abolhasani, M., Vanaki, A., & Turskis, Z. (2018). A Novel Approach for Evaluation of Projects Using an Interval–Valued Fuzzy Additive Ratio Assessment (ARAS) Method: A Case Study of Oil and Gas Well Drilling Projects. Symmetry, 10(2), 45. https://doi.org/10.3390/sym10020045