1. Introduction
Transportation, according to Grabara et al. [
1], represents the most important logistics activity and in order to enable the smooth running of a transportation process, a series of activities has to be integrated into one coherent whole. Transportation is, according to Borzacchiello et al. [
2], a natural and dynamic part of any modern space-economy, offers great economic benefits and improves economic development, as confirmed by research [
3] emphasizing that freight transportation plays a key role in today’s economies. Mobility in this century is an everyday aspect of life, and it is necessary to take into account all trends in commodity flows, measure their performance and optimize them from economic, functional, technological and organizational aspects. The trend of urbanization is constantly increasing in the world, which increases the delivery frequency of goods and demands for transportation, which makes it an even more important factor of a complete supply chain. Adding to this the fact that it is necessary to connect production and consumption that are thousands of kilometers away from each other in many cases, understanding and measuring one’s own performance is a prerequisite for the efficient operation of transportation companies. It has been recognized that the large number of criteria that contributed to the problem-solution process must be considered embody duality, paradox, unity in diversity, change, and harmony, offering a holistic approach to problem-solving. An effective integration of cross-functional processes has a considerable influence on the success [
4] any company. According to Stević et al. [
5], transportation represents the most expensive logistics subsystem, the subsystem that causes the largest percentage of logistics costs, as confirmed by Guasch [
6], who states that transportation costs represent the most significant item in total logistics costs. Considering the structure of total logistics costs, the transportation costs, according to Karri and Ojala [
7], account for about 40%, and in total costs account for up to 20%. According to Stević et al. [
5], it is necessary to work day-to-day to reduce these costs, especially regarding large companies that have a large volume of transportation movements on a daily basis.
Taking into account the aforementioned, the procedure for measuring and monitoring performance indicators is of great importance for the operation of every transportation company. Determining the performance that has the greatest impact on the efficiency of the operation of transportation companies enables optimization of logistics processes and shorter time to complete them. In developed countries around the world, monitoring key performance indicators has been recognized as a necessity, both due to the improvement of the operation of companies as well as the increasing competition on the market, and it is an inevitable part of the logistics processes of every company. However, developing countries have not fully recognized the importance of identifying key performance yet or are at very beginning of recognizing it.
Throughout the research and development of the model in this paper, several goals have been presented. The first goal relates to the improvement and enrichment of the methodology for dealing with uncertainty in the field of group multi-criteria decision-making throughout the development and presentation of a novel rough additive ratio assessment (ARAS) approach. The second goal of this paper is to bridge the gap that currently exists in the methodology for measuring and monitoring performance indicators in the logistics subsystem of transportation. The second goal is achieved throughout a newly developed approach to dealing with imprecision based on rough numbers. The third goal of the paper is a possibility of improving the efficiency of the operation of transportation companies in developing countries and encouraging the development of competitiveness as an important factor in the success of every company. The fourth goal of the paper refers to a possibility of post-analysis in transportation companies that are evaluated in this paper, where the best-ranked ones can serve others as a benchmark. The last, fifth goal of the paper is to popularize and affirm the idea of rough numbers throughout a detailed calculation of operations with rough numbers, which are characteristic of the field of multi-criteria decision-making.
This paper contains six sections in total, the first of which relates to the importance of measuring and monitoring the performance of transportation companies. In the second section, which is related to a literature review, there is a review of studies on similar issues in which multi-criteria decision-making methods are applied. The third section presents the applied methods. Basic operations with rough numbers and a detailed algorithm of a newly developed rough ARAS approach are presented. The fourth section presents a detailed study on performance measurement in Bosnia and Herzegovina, Libya and Serbia based on the developed approach. The fifth section is a sensitivity analysis that involves checking the stability of the results using a three-phase procedure and the discussion of the results. The sixth section presents the key contributions of the developed model and the research, as well as proposals for future research.
2. Literature Review
In order to evaluate and improve the performance of transportation companies, it is necessary to know and analyse key performance indicators (KPIs) [
8,
9]. KPIs are the measures that organizations can use to assess their own performance. In other words, KPIs help organizations determine the degree of their success in achieving their goals [
10,
11]. KPIs help managers of transportation companies determine which components of the company require more care and continuous monitoring in order to achieve values that will satisfy service users. In general, the development of key performance indicators for every organization has always been one of the most stressful tasks [
12,
13]. In that sense, although today many organizations around the world use key performance indicators to find out how successful they are, a very small number of organizations use the most appropriate KPIs to assess their own performance. The reason for that is a lack of understanding of the key performance indicators by business leaders [
14]. Performance measurement, in various logistics domains, using performance indicators was carried out in several studies to assess the logistics situation in countries such as Malaysia [
15], Finland [
16] and Turkey [
17,
18]. These studies show the acceptance of a logistics performance index as a measure for assessing the logistics performance in the country and linking the logistics performance to trade and transportation policies. Other studies have used indicators of logistics performance for research purposes. Hoekman and Nicita [
19] consider various World Bank indices that affect the limitation and facilitation of trade and consider their application in developing countries.
In some studies, the estimation of KPIs is also used as a reflection of logistics performance that may be affected by certain policy measures [
20,
21,
22]. Cemberci et al. [
22] considered the effect of global competitiveness on the KPIs of transportation operators and concluded that better competitiveness could be achieved by timely improvement of the KPI components as well as through active monitoring of international shipments. Kim and Min [
20] combined the KPIs and the environmental performance index to create an index of green logistics performance, which significantly influenced the final results of the research. Marti et al. [
21] examined the importance of each component of KPIs in relation to trade in developing economies using a gravity model. They concluded that all components of KPIs have a positive connection with the scope of international trade. Civelek et al. [
23] applied a hierarchical regression analysis to determine the correlation between the logistics performance index, the competitive index and the gross domestic product. Another study that applied the hierarchical regression analysis was by Uca et al. [
24] who, similar to Civelek et al. [
23], considered the correlation between transportation performance, a corruption perception index and the extent of external trade. The conclusion of the study is that there is a significant correlation and influence between the logistical capacity of a country, corruption, and the extent of external trade.
Leading practitioners who are researching the performance of transportation companies look for answers to several questions, including the question of which indicators they should use and when they need to use them to measure the performance of transportation companies [
25]. Therefore, in the transportation industry there is a need to establish a framework for the implementation of a strategic system for measuring the performance of companies [
26]. Such a system implies a choice of balanced indicators with a holistic approach [
27]. However, the importance of identifying indicators for performance measurement in transportation companies has been recognized only by a small number of researchers and practitioners [
26]. Several studies focus on evaluating the logistics performance from several perspectives [
28] and logistics throughout performance measurement [
29]. Consequently, in order to identify key indicators in logistics performance measurement, the balanced scorecard (BSC) concept is a widely accepted approach and it has been used in several studies [
30,
31,
32].
Norin [
33] investigated logistics in air transportation. The study proposed a set of key performance indicators to assess the performance of logistics components using a conceptual model. In recent studies, Kosanke and Schultz [
9] have proposed a KPI set to assess the performance of air transportation operations at an airport. Humphreys and Francis [
34] have come to the conclusion that increasing demand in air transportation and changes in airport ownership led to the introduction of new financial and environmental measures. The authors have provided a good discussion on a wide range of past, present and future key performance indicators of airports. Regarding the issue of the environment, Morrell and Lu [
35] and Ignaccolo [
36] studied noise related to transportation activities and its impact on communities near transportation terminals.
In a limited number of studies, models for multi-criteria decision-making are used. The research shown in [
37] has indicated that KPIs are necessary to improve internal organization, relationship with customers, competitiveness, and strategy planning in the case of tanker companies in Greece. Nathnail et al. [
38] used the analytic hierarchy process (AHP) to assess the significance of each criterion in KPIs and the overall performance of two terminals. Bentaleb et al. [
39] identified and analyzed key performance indicators for a port using Measuring Attractiveness by a Categorical-Based Evaluation Technique (MACBETH) tools. The methodology based on the previous analysis helps managers in such companies to make decisions and increase global performance. In [
40], the decision-making trial and evaluation laboratory (DEMATEL) method for analyzing the importance and relation among the criteria for evaluating intermodal transportation was used. Moreover, there are many other models used to evaluate and compare key performance indicators [
41,
42,
43,
44,
45]. In addition to the presented multi-criteria decision-making models (MCDM) for the analysis of KPIs of transportation companies, methods of strategic management in combination with MCDM were also used, e.g., a benchmarking technique that is very useful for assessing the impact of various factors such as services, safety, environment, costs and profit indicators [
46,
47,
48,
49,
50].
This study extends the existing knowledge of the applicability of KPI measurement in the transportation industry by introducing a comprehensive, balanced set of performance indicators. In complex real-life scenarios, there may be a need for modeling a hierarchical structure, as well as a need to determine the prioritization of different indicators. This presents a challenging and still insufficiently considered issue in the domain of transportation [
51]. It is therefore necessary for transportation companies to explore the relations among their different abilities [
52]. Therefore, managers of transportation companies should try to answer several questions, such as how to determine the priorities of indicators and how to build a hierarchical relation in order to identify the impacts among indicators [
53]. In such cases, MCDM methods offer practical solutions. However, designing the MCDM framework for performance measurement is a complex process that is further elaborated in order to improve the area discussed in this paper [
54].
Consequently, in order to face the above challenges, it is necessary to develop a model for identifying the key performance indicators of transportation companies and determining their relations. It is precisely this purpose that is the goal of this study, in order to provide a comprehensive decision-making model that identifies key performance indicators for the transportation industry and evaluate the relations among these indicators from the perspective of logistics providers using MCDM models. In order to achieve this goal, the main research question of this study is: how do you form a decision-making model in which key transportation performance indicators are implemented and which enables the setting of priorities for these indicators, taking into account mutual relations? To solve this problem, the study proposes the measurement of KPIs of transportation companies using step-wise weight assessment ratio analysis (SWARA) and ARAS methods, throughout the analysis of dependence among performance indicators and a proposal of their priorities. Although there are several studies focusing on the application of the MCDM concept in the transportation industry [
55], the implementation of a rough approach in MCDM models, which are applied in the field of logistics, has received very limited attention. In particular, there are no studies that consider the integration of a rough approach in the SWARA-ARAS hybrid model, not only in the field of performance measurement of logistics companies, but in general in the MCDM literature. The SWARA-rough ARAS model is a new comprehensive decision-making model that allows management of transportation companies to measure performance even in situations where there are inaccuracies and uncertainties in data.
3. A Novel Rough Additive Ratio Assessment (ARAS) Method
The ARAS method belongs to a group of multi-criteria decision-making methods that have been developed over the past decade and it has found a wide application in different areas. A classic form of this method was developed in 2010 [
56], while its fuzzy [
57] and grey forms [
58] were developed in the same year. Bearing in mind all the advantages of using rough theory [
59,
60] in the MCDM to represent ambiguity, vagueness and uncertainty, the authors have decided in this paper to modify the ARAS algorithm using rough numbers, which is an original contribution. The fuzzy form of ARAS method offers certain benefits in terms of uncertainty, and due to a possibility of reducing subjectivity to a minimum, reducing uncertainty, and obtaining clearer results, a new rough ARAS consisting of seven steps has been developed in this paper.
Step 1. Forming a multi-criteria model. In this step, it is necessary to define the problem that needs to be solved, to form a set of m criteria on the basis of which n alternatives will be evaluated. In addition, it is necessary to define a set of k decision-makers who will participate in a process of group decision-making.
Step 2. Forming a group rough matrix. In this step using Equations (A1)–(A6) it is necessary to aggregate individual matrices into a group rough matrix represented by Equation (1). An integral part of this initial matrix, unlike in other approaches, is an additional row that represents optimal values of the alternatives according to the criteria.
Optimal values of alternatives according to criteria are formed by taking the highest or lowest values depending on whether the criterion belongs to a cost or benefit type. If it is a benefit-type criterion, then the maximum value is taken, and if it is a cost-type criterion, the minimum value is taken.
Step 3. Normalization of an initial rough matrix that involves three phases depending on the type of criteria. The first phase relates to the normalization of benefit-type criteria by applying Equation (2).
If we take into account the basic operations with rough numbers and the sum calculated by columns for each criterion in particular, the normalization process obtains the following form Equation (3)
where
indicates the upper sum limit by the criterion, and
the lower sum limit.
The second and third phase of normalization involve the application of Equations (4) and (5): for cost criteria; Equation (4) should be first applied in order to obtain inverse values for
.
and then the Equation (5) in order to complete the normalization process:
where
and
represents the upper and lower limits of the sum by the inverse value criterion for
, respectively.
Step 4. Weighting the normalized rough matrix using Equation (6):
Step 5. Determining the matrix
by summing all the values per rows from the previous weighted matrix, Equation (7).
Step 6. Calculation of the degree of usefulness applying Equation (8):
where
indicates the value of the best alternative.
Step 7: Ranking the alternatives in decreasing order. The highest value is the best solution, while the smallest value represents the worst solution.
To adequately solve decision-making problems with vague or imprecise information according to Mardani et al. [
61], the fuzzy set theory [
62,
63,
64] and aggregation operator theory [
65,
66] have become powerful tools. As opposed to fuzzy sets theory, which requires a subjective approach in determining partial functions and fuzzy set boundaries, rough set theory determines set boundaries based on real values and depends on the degree of certainty of the decision maker. Since rough set theory deals solely with internal knowledge, i.e., operational data, there is no need to rely on assumption models. In other words, when applying rough sets, only the structure of the given data is used instead of various additional/external parameters. The logic of rough set theory is based solely on data that speak for themselves. When dealing with rough sets, the measurement of uncertainty is based on the vagueness already contained in the data. In this way, the objective indicators contained in the data can be determined. In addition, rough set theory is suitable for application on sets characterized by irrelevant data where the use of statistical methods does not seem appropriate [
67].
The benefits of the novel rough ARAS approach in relation to other approaches developed so far can be seen throughout several options. The first one refers to a relatively small number of steps that are needed for a complete calculation according to this approach; then taking into account the optimal alternative as a possibility for more precise decision-making; and reducing uncertainty and subjectivity in a decision-making process using rough instead of crisp numbers.
The implementation of this approach was demonstrated on the case study of transportation companies in Libya, Serbia and Bosnia and Herzegovina.
4. Case Study
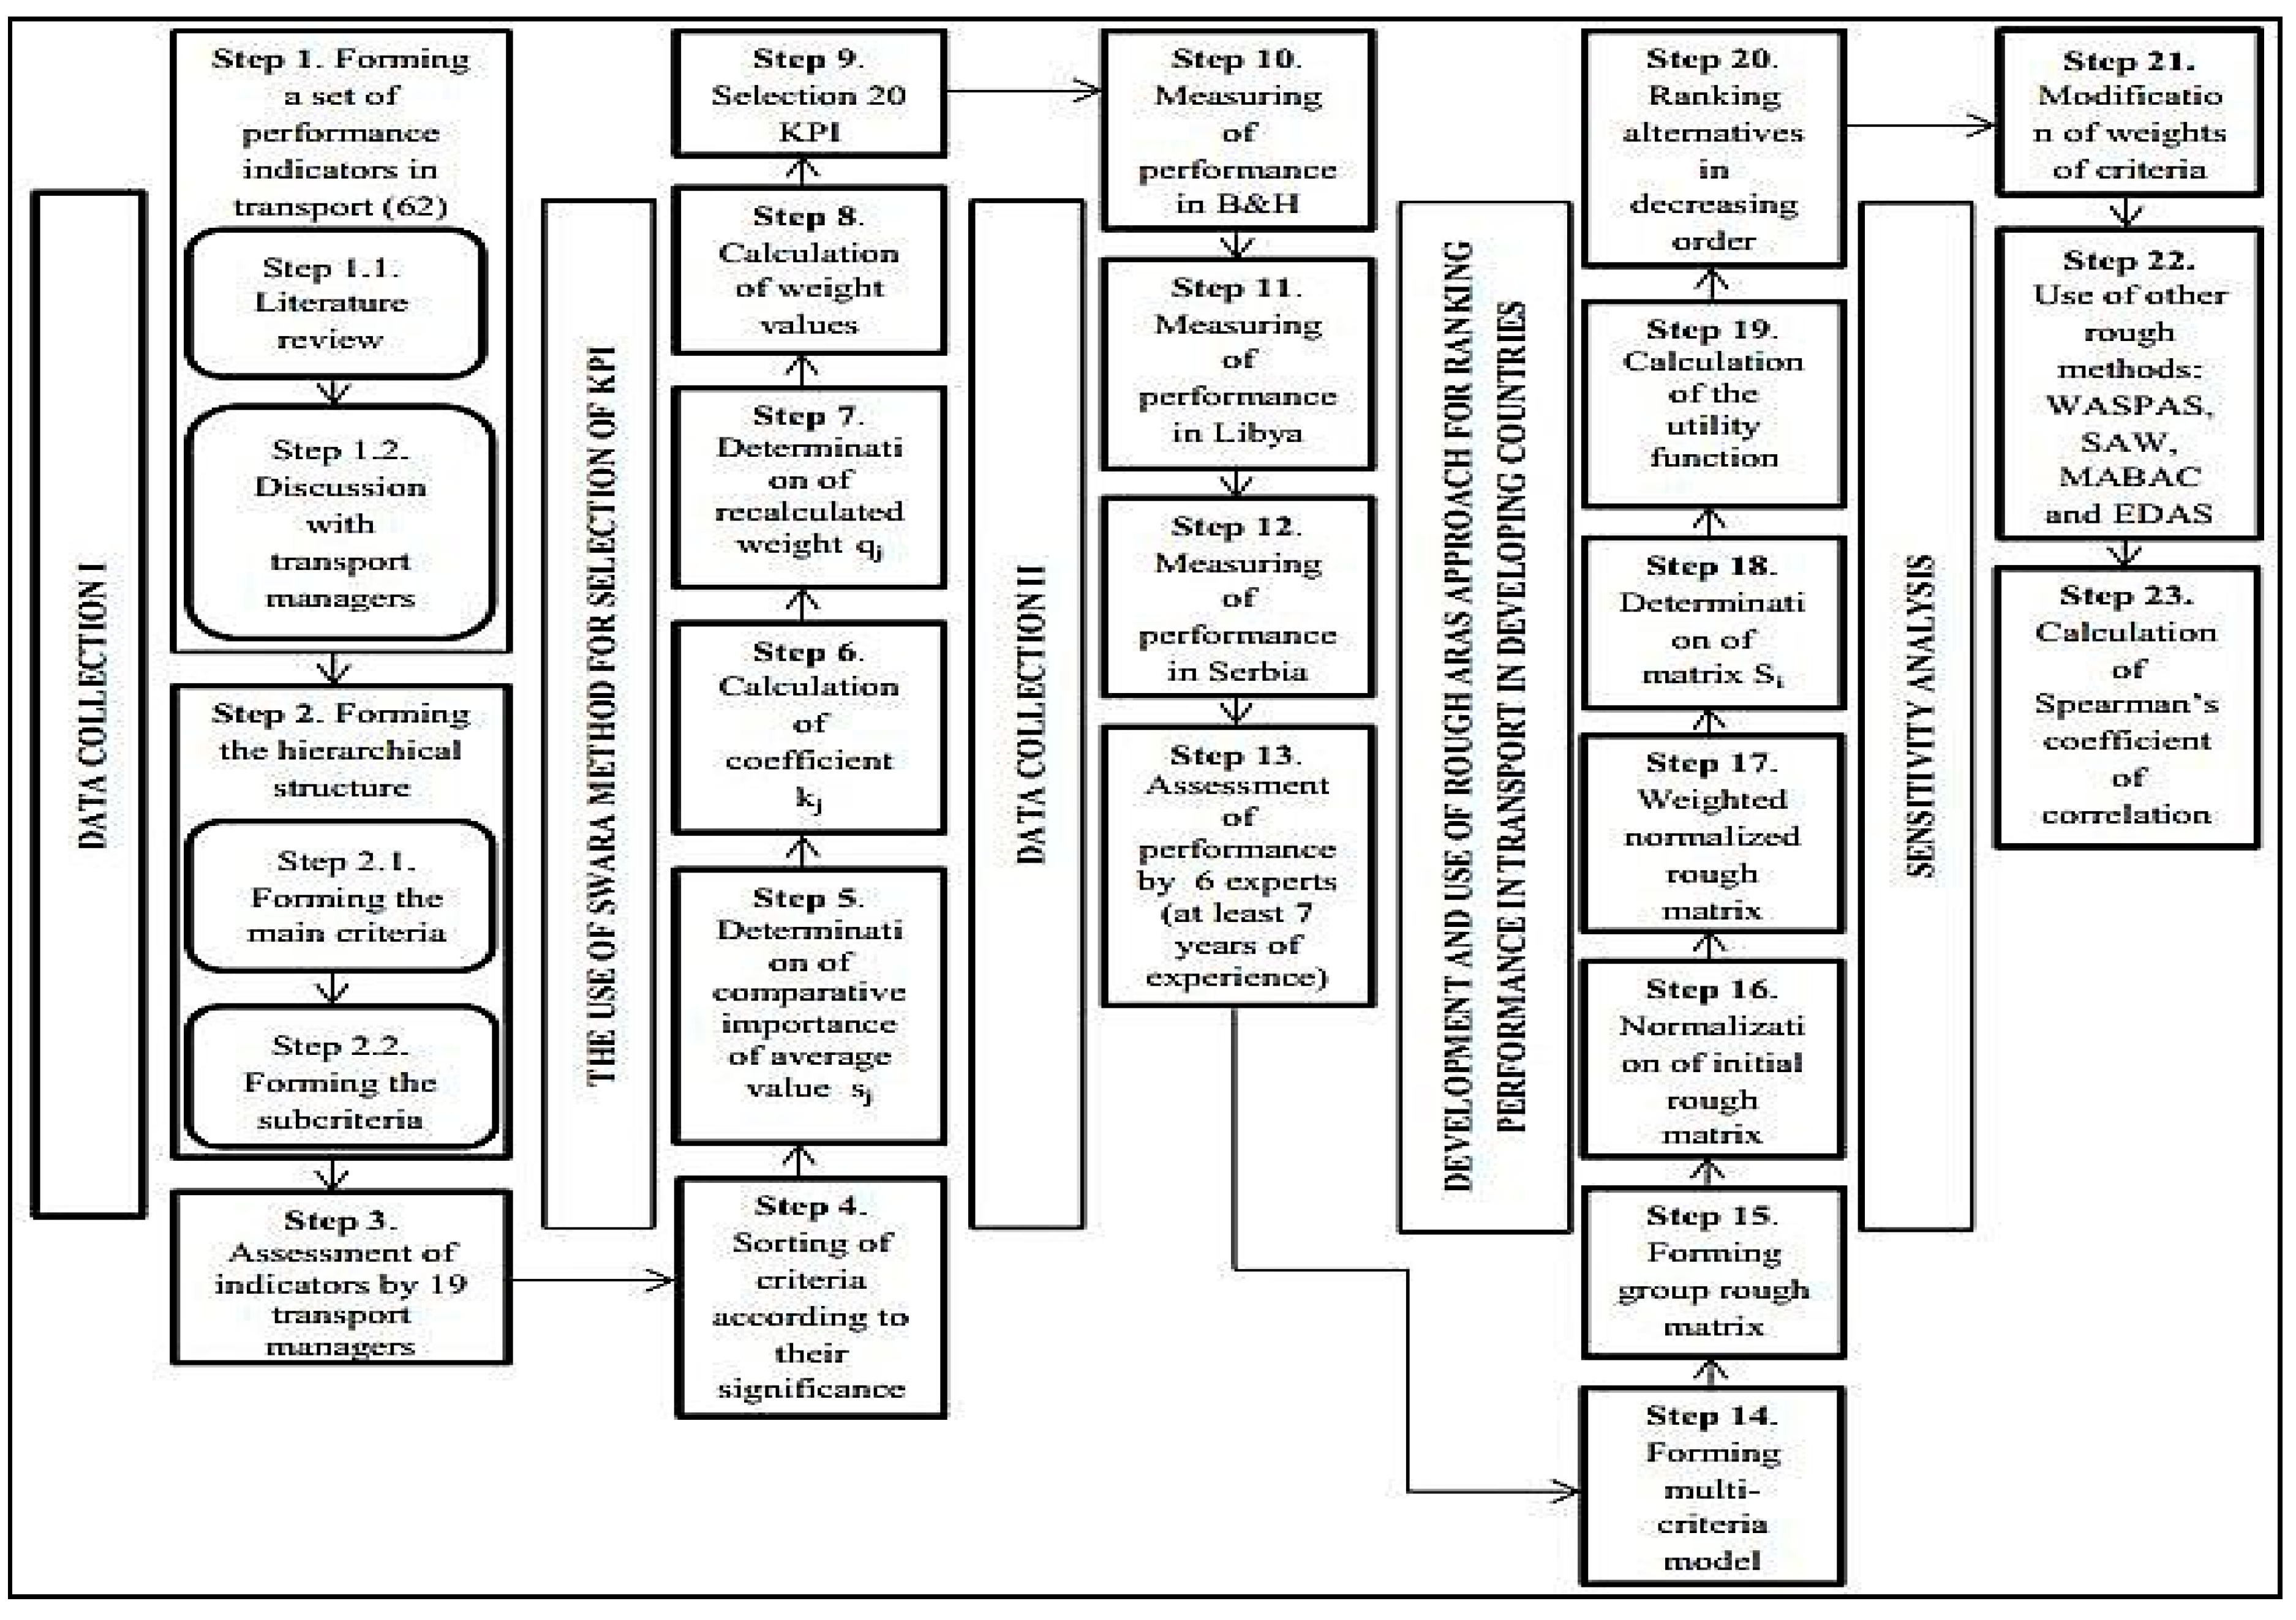
The developed model for performance evaluation in transportation companies in developing countries consists of a total of 23 steps divided into five phases: initial data collection, the application of the SWARA (step-wise weight assessment ratio analysis) method [
68] for the selection of performance indicators, data collection related to performance measurement in developing countries, the development and implementation of the novel rough ARAS approach and sensitivity analysis. The proposed model is shown in
Figure 1 where steps and sub-steps of all phases are presented.
Recognizing the need for forming such a model and completing performance measurement started at the end of 2017, when a part of the team for research and development of the model was formed. The first ideas, a review of the relevant literature, and discussion on indicators for performance measurement with managers of transportation companies, were carried out exactly in that period. In the period of January–March 2018, the first phase of data collection was completed, while the second phase was completed at the beginning of April. The third phase related to data re-collection was carried out in the period of April–June. Along with the idea of the development of this model, it also started the development of the novel rough ARAS algorithm, which is one of key contributions of this paper, and lasted until May 2018. Taking into account the aforementioned and later the application of the developed rough ARAS approach in June it can be concluded that the fourth phase lasted longer than five months. The last phase was carried out in July. When the timing of all the phases of the proposed model is taken into account, it can be concluded that the complete research took about nine months.
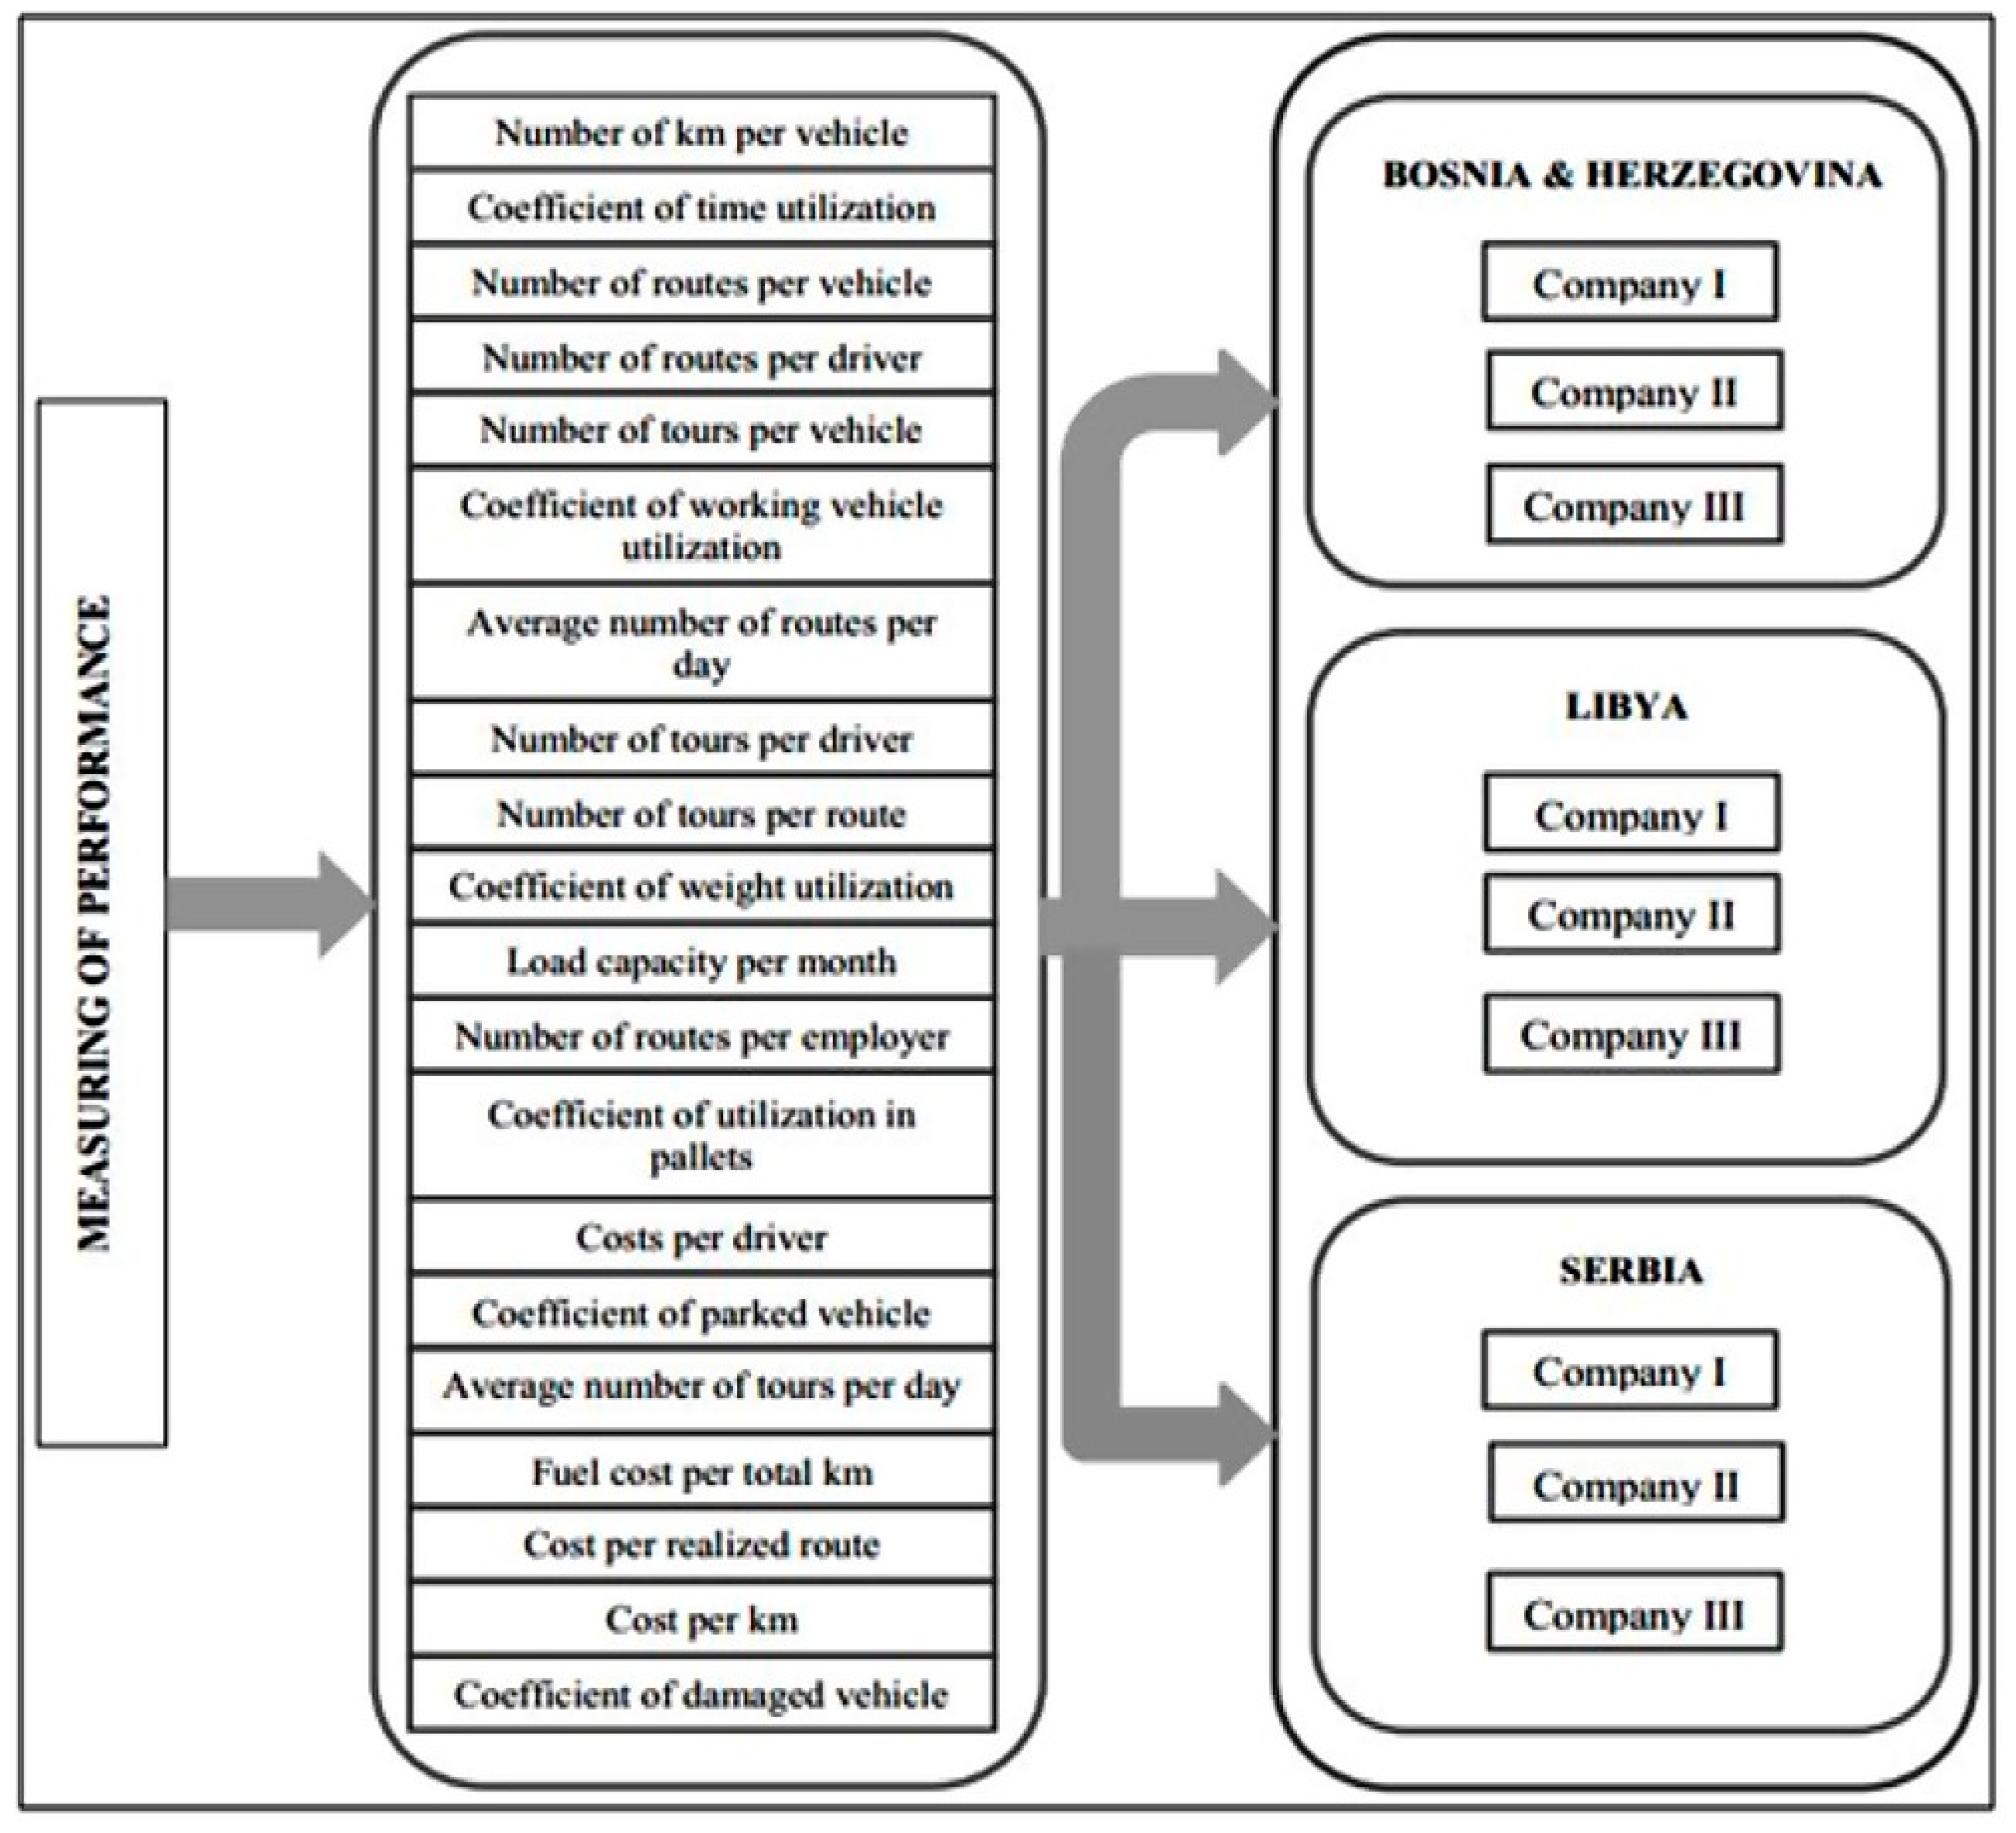
The first phase is data collection and consists of three steps. The first step is forming a set of 62 performance indicators in the field of transportation based on a detailed literature review, as well as opinions and discussions with managers from various transportation companies. The second step is forming a hierarchical structure made up of the main criteria and sub-criteria, which is given in detail in
Figure 2 and explained in
Table 1. The third step of the first phase is the assessment of 62 performance indicators by managers from 19 different transportation companies.
Determining the significance of criteria according to different authors [
69,
70] is one of the most important stages in the decision-making process, so the second phase represents the use of the SWARA method in order to perform the selection of key performance indicators. It consists of six steps, with the first five steps representing the integral steps of the SWARA method. At the very beginning, it is necessary to sort the criteria according to their importance, i.e., it is necessary that experts rank the criteria according to their significance. Then, it is necessary to determine the comparative importance of the average value. The third, fourth and fifth steps are related to the calculation and determination of coefficient and weight values. The sixth step of the second phase is a selection of 20 key performance indicators.
The third phase is also a collection of data for the next part of the work related to the measurement of 20 identified performance indicators in developing countries, in this case Bosnia and Herzegovina, Libya and Serbia. The managers of nine transportation companies located in the aforementioned countries filled in the tables by inputting their own values for each performance indicator. After that, the performance indicators were evaluated by six experts with at least seven years of experience in the field of transportation, and located in the territory of Bosnia and Herzegovina and Serbia.
The fourth phase relates to the development and application of the novel rough ARAS approach for evaluating measured performance indicators in transportation companies in developing countries. It consists of seven steps that are explained in detail in the section related to work methods.
The fifth and also the last phase of the proposed model refers to a sensitivity analysis. The sensitivity analysis was carried out in three steps. The first step is the change in the weight of criteria, and the second step is the application of different methods of multi-criteria decision-making, which is given in detail in the fifth section of the paper. Several methods are applied to the same multi-criteria model in order to better represent the difference in the ranks of transportation companies with a change in approach. The last step is the determination of Spearman’s coefficient of correlation, on the basis of which the stability of the obtained results, i.e., the ranking of alternatives, can be determined. The SCC is calculated for both phases of the sensitivity analysis, i.e., for the rank of alternatives according to formed scenarios in which the weights of criteria are changed and in comparison to other approaches.
Figure 2 shows a hierarchical structure with 20 key performance indicators identified by evaluations by experts from 19 different transportation companies. At the first level of the hierarchy, there is a goal that is related to performance measurement in transportation companies in developing countries. The second level of the hierarchy consists of a total of 20 performance indicators that are identified based on the first part of this study, which is shown in [
71]. At the third level, there are values of measured performance indicators in transportation companies in developing countries, i.e., in Bosnia and Herzegovina, Libya and Serbia.
As already noted in the section explaining the proposed model, a detailed explanation of the used indicators is given in
Table 1 to enable transport managers to input their own values of indicators in an easier and more understandable way.
The values of performance indicators, on the basis of which the alternatives were evaluated, were obtained using the SWARA method in the research [
71]. In the initial study, as already mentioned, a total of 62 indicators were evaluated based on 19 decision-makers. The weight coefficients of the criteria in this paper have been multiplied by two in relation to the above research, for the purpose of easier calculation.
In the first step of the proposed approach, a multi-criteria model should be formed, which in this case consists of 20 criteria, nine alternatives and six decision-makers. The alternatives represent three transportation companies from Bosnia and Herzegovina, Libya and Serbia, respectively. In order to be able to form a group rough matrix, it is first necessary to convert individual matrices of all decision-makers (
Table 2) into group rough ones.
The evaluation of the alternatives by six experts shown in
Table 2 was carried out on the basis of the linguistic scale defined in [
5], taking into account the type of criteria.
The transformation of individual matrices is completed using the Equations (A1)–(A6) in the following way: For the first criterion
it will be:
For the second criterion according to the first alternative
For the eighth criterion
:
For the twentieth criterion according to the first alternative
In an identical way, the other values shown in
Table 3 are also calculated.
Table 3 shows a part of the calculation that refers to obtaining an aggregated initial group rough matrix for the first alternative. In the same way, other values for other alternatives are calculated, so the initial aggregated rough matrix is presented in
Table 4.
Table 4 shows the initial rough matrix from the second step of the developed rough ARAS approach. The last column marked with gray indicates the optimal values of the alternatives obtained by taking maximum or minimum values depending on the type of criteria. The total number of criteria belonging to a beneficial group is 14, while the remaining six criteria are of cost type, and they are C
14, C
15, C
17, C
18, C
19 and C
20.
In the third step of the rough ARAS approach, it is necessary to apply a three-phase procedure for normalizing the initial rough matrix. In this step, it is also important which criteria are benefit ones, and which are the cost ones, and, accordingly, the normalization is carried out in the following way.
Applying Equation (2):
i.e., (3):
The normalized value of the first alternative for the first criterion was obtained. The normalization procedure for all the other criteria that belong to the benefit ones is the same. The second and third phases of normalization include the application of Equations (4) and (5): for cost criteria, Equation (4) should be first applied in order to obtain inverse values for .
For the first alternative according to the fourteenth criterion, the inverse value (
Table 5) is:
Applying Equation (5), a normalized value is obtained (
Table 6):
Table 5 shows inverse values from the initial rough matrix, i.e., values obtained by applying the second phase of normalization, which is the third step of the developed approach.
Table 6 gives an overview of a complete normalized matrix after the application of the above three phases.
The fourth step is the aggregation of the normalized rough matrix by multiplying all the values of the normalized matrix with the weighted values of criteria by applying Equation (6). The weighted normalized matrix is shown in
Table 7.
In the fifth step, it is necessary to determine the matrix
by summing all the values per rows of the previous weighted matrix (7). After that, applying Equation (8), the degree of usefulness
is calculated and in the last seventh step, the ranking of the alternatives according to decreasing order is performed. Operations with rough numbers are performed using Equations (15)–(20). The results of the last three steps of the rough ARAS approach are shown in
Table 8.
Alternative 9 represents the best solution, which means that the transportation company from Serbia is in first place with the best performance indicators compared to other alternatives. In second and third places are transportation companies from Bosnia and Herzegovina. The worst-ranked companies are from Libya, which is in some way an understandable and expected outcome taking into account recent events in that country.
5. Sensitivity Analysis and Discussion
The sensitivity analysis performed in this paper includes three phases, which determine the sensitivity and validity of the results obtained. The first phase consists of the formation of 10 different scenarios in which the values of weight coefficients are simulated and the rank obtained using Spearman’s correlation coefficient is checked. In the second phase, different methods of multi-criteria decision-making are applied in a rough form, and in the third phase, a statistical correlation checking is performed for all applied methods.
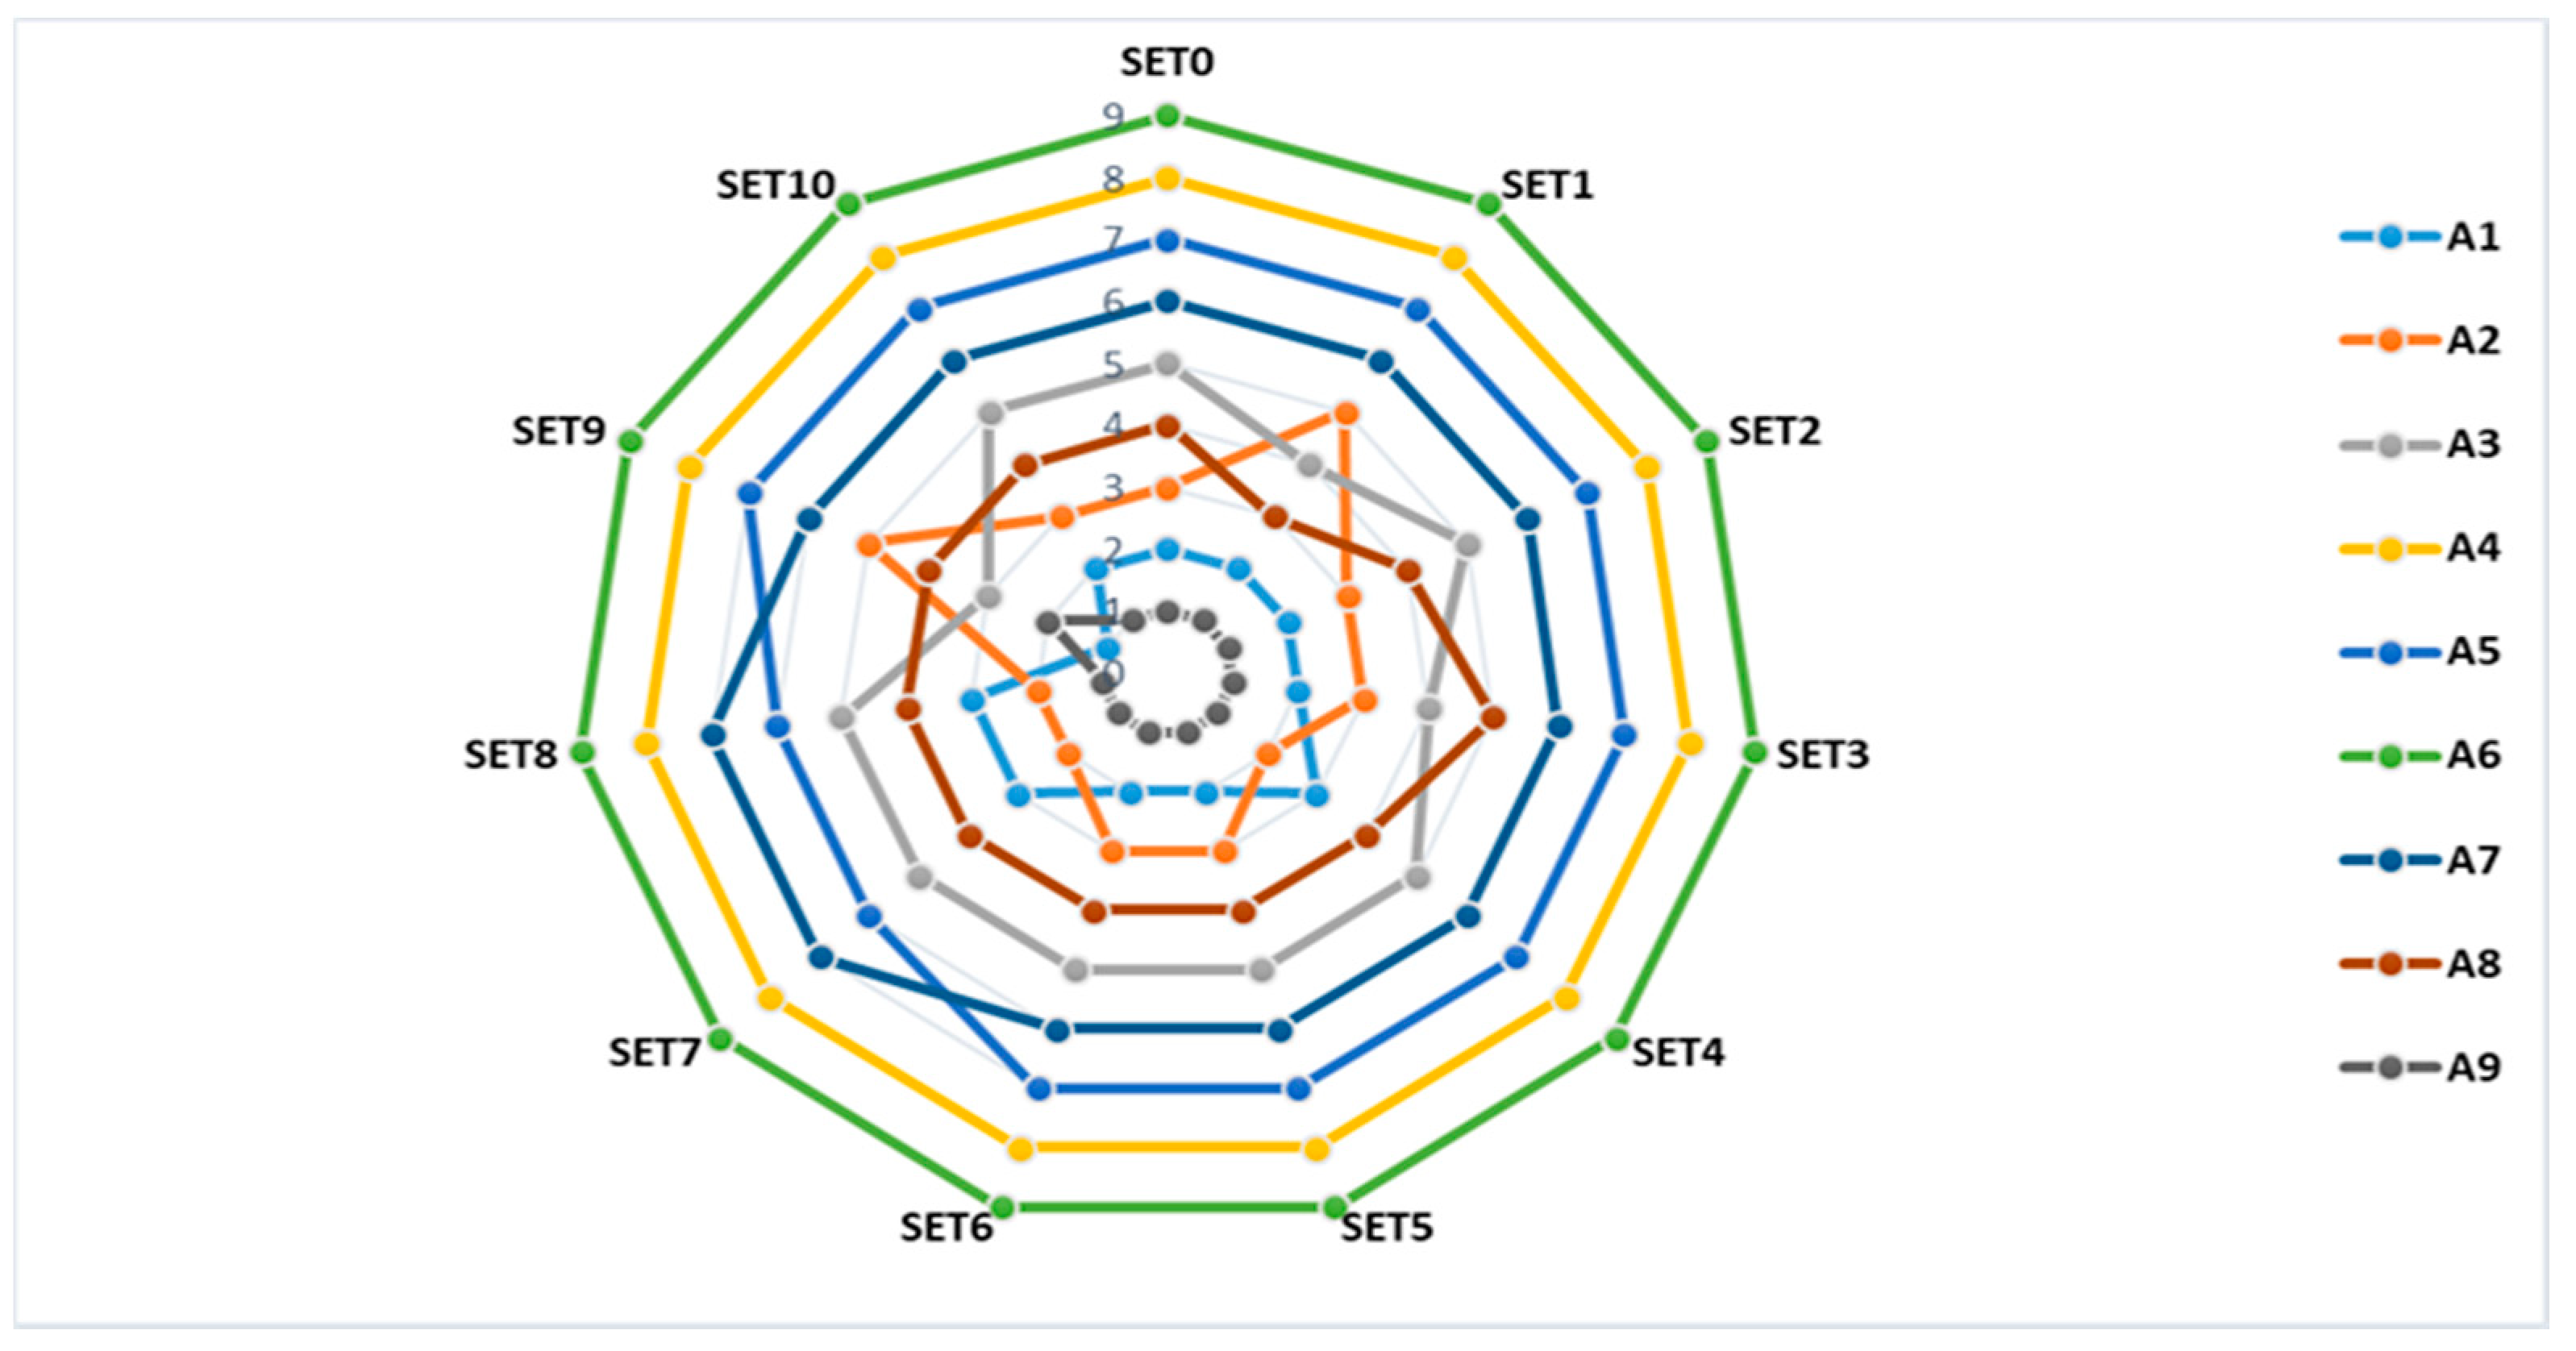
Figure 3 shows the ranks of alternatives throughout 10 scenarios formed. The first four scenarios are formed in such a way that five criteria per scenario increase by 0.100 or even 145% and more. In the first scenario, the first five criteria change the value, while the others remain unchanged in sequence to the fourth scenario. The fifth scenario implies a reduction in the value of the first 10 criteria by 100% of their own value. The sixth scenario is formed in the same way as the fifth, with the increased values of the other 10 criteria. In the seventh scenario, the values of C
1–C
10 criteria are reduced by 100% of their own value, and the C
11–C
20 criteria are increased by the same percentage. In the eighth scenario, the first five criteria are eliminated, so that the alternatives are ranked on the basis of 15 indicators, while in the ninth scenario, the five worst criteria are eliminated. The last, tenth scenario implies that all criteria are equally important with a share of 0.100.
Figure 3 shows the ranks of alternatives through the formed scenarios that have previously been explained in detail. The second, fifth, sixth and tenth scenarios encompass identical ranks as in the initial scenario. In the third scenario, the only difference in rank is the third and eighth alternatives that change places, while in the fourth, the difference is in the first two alternatives that also change positions. Scenarios 7 and 8 have an identical correlation with the initial scenario in which the first two alternatives change places and alternatives 6 and 8, so the correlation is a bit smaller compared to the scenarios previously explained. The first scenario presents greater differences in ranks than the initial scenario, which means that the increase in significance of the first five criteria significantly influences the rank. The biggest difference in the scenarios formed is in the ninth scenario when five of the worst criteria are eliminated, which means that these criteria still play an important role in measuring performance in transportation companies.
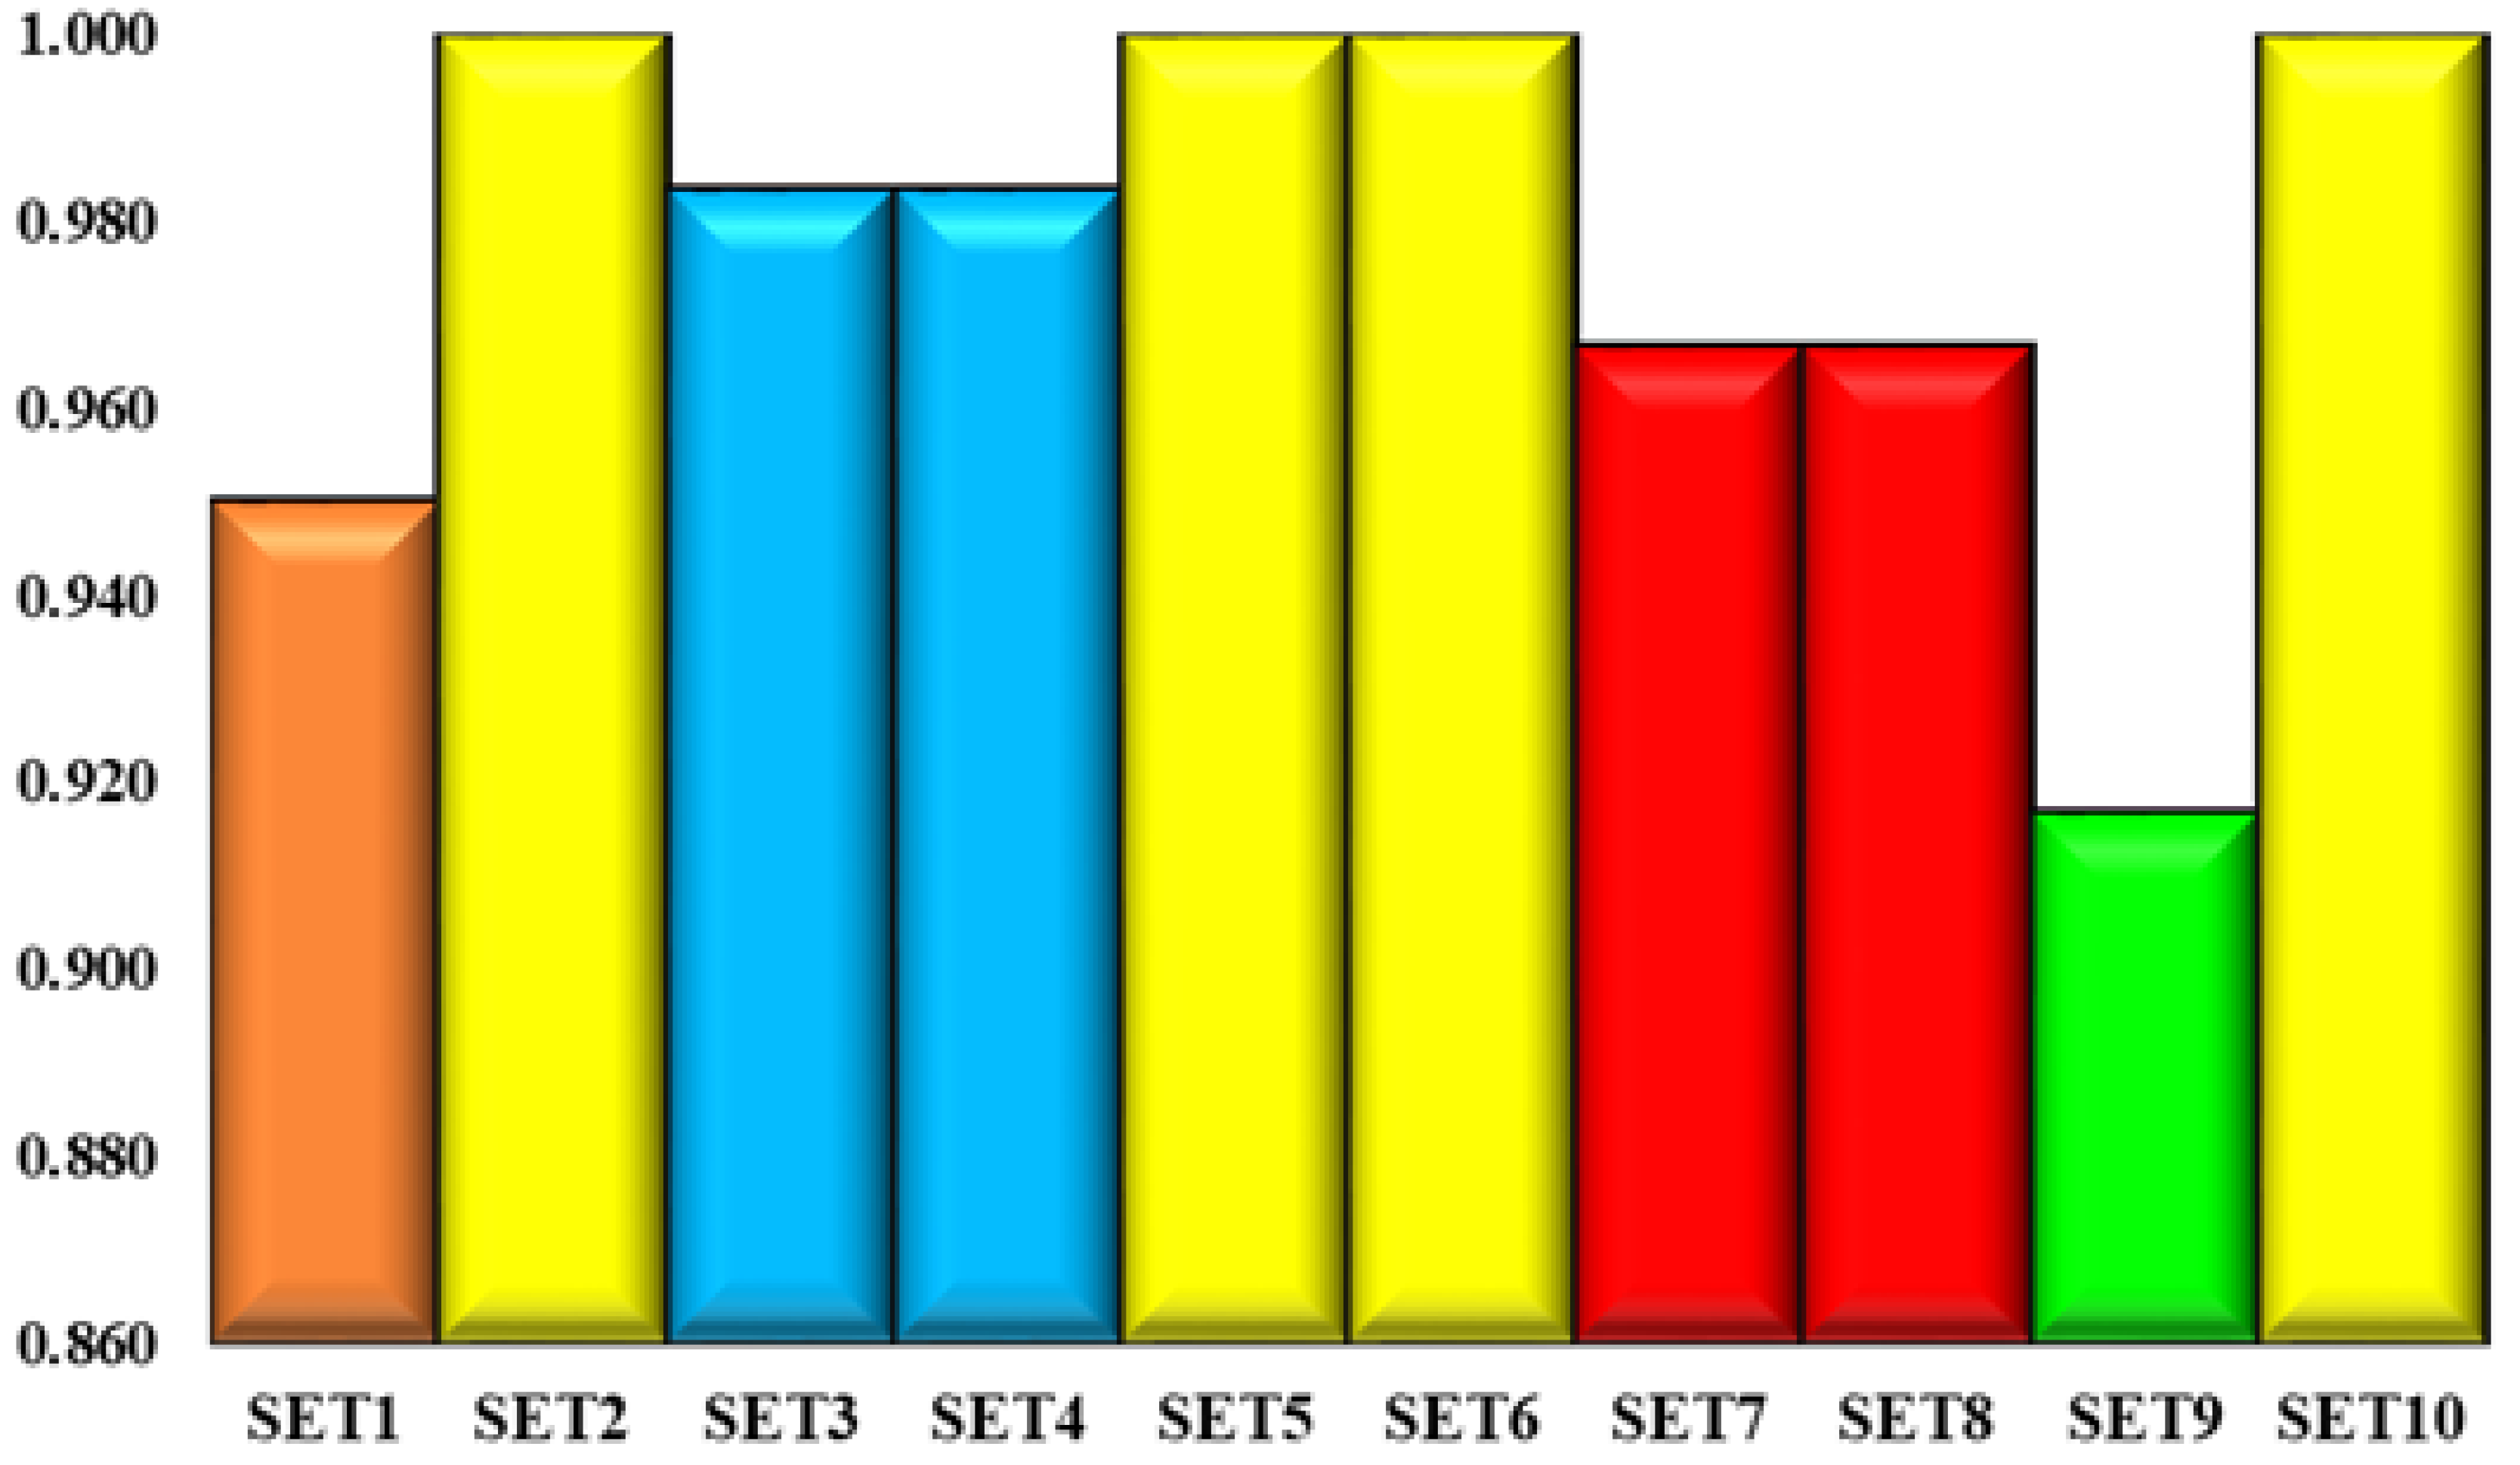
In
Figure 4, Spearman’s coefficient of rank correlation is shown in all scenarios compared to the initial one.
Figure 4 shows the SCC through all the scenarios for which it can be seen that the model is sensitive to changes of the weights of criteria and that each indicator plays an important role in measuring performance in transportation companies. Spearman’s coefficient of correlation ranges in the scope of 0.917–1.00, which represents a high degree of correlation, and the results obtained using the developed rough ARAS model are considered stable. The average SCC value of all 10 scenarios formed in relation to the initial rank is 0.977.
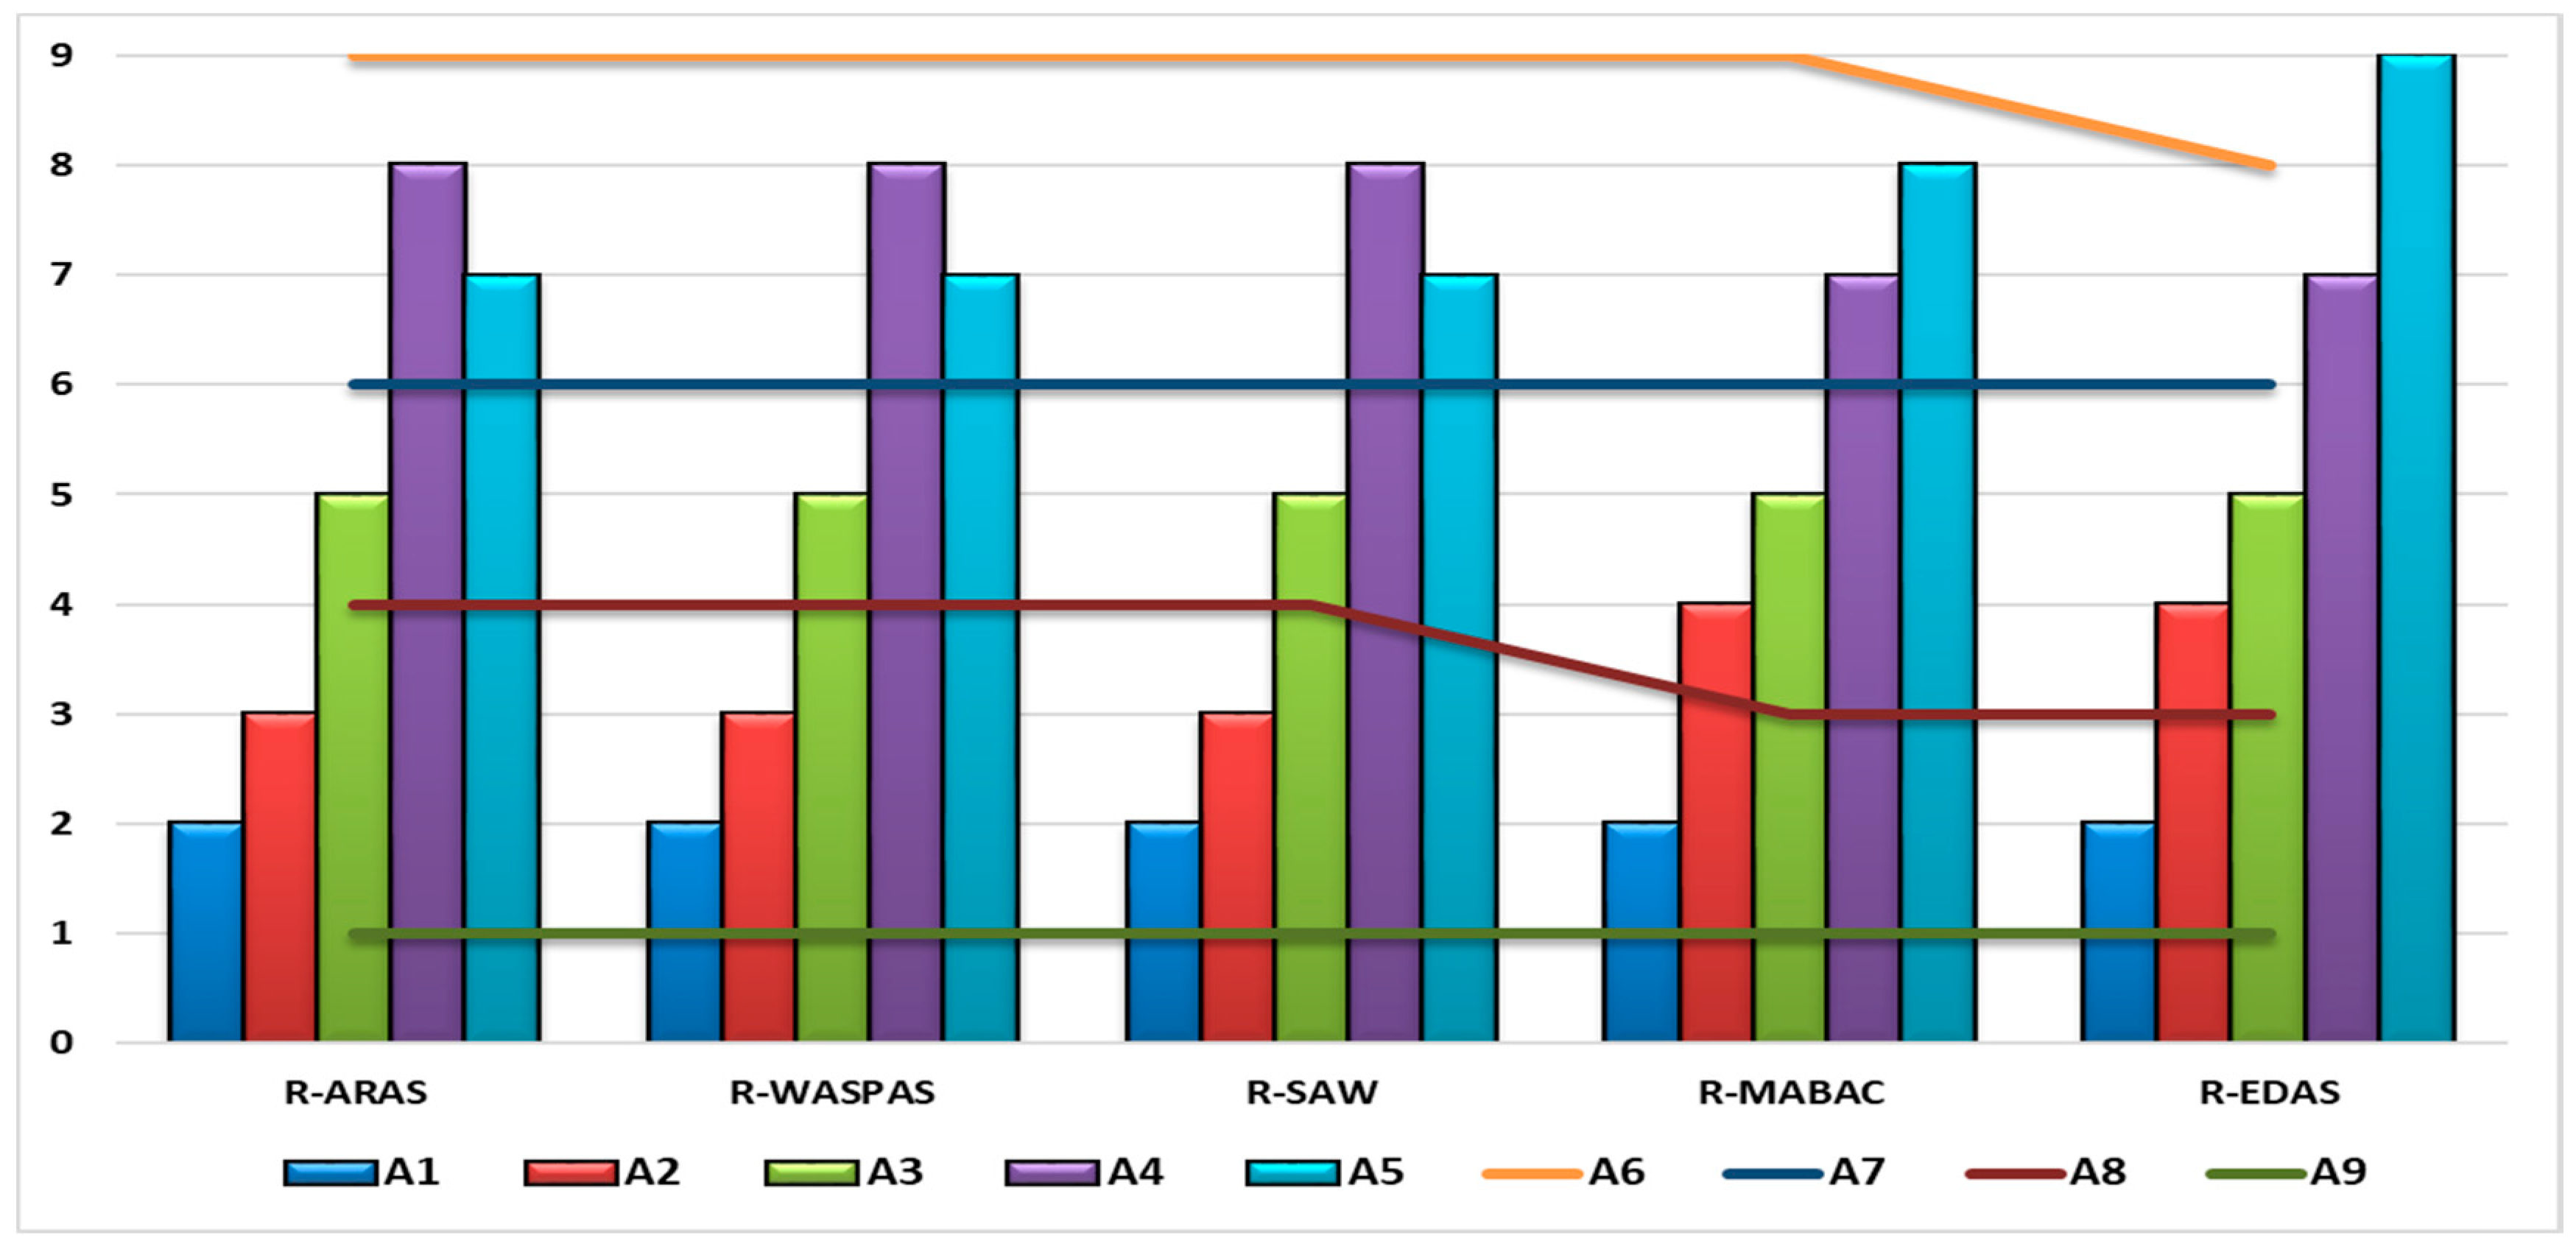
Figure 5 shows the second phase of the sensitivity analysis, which includes the application of different approaches: rough WASPAS (weighted aggregated sum product assessment) [
67] rough SAW (simple additive weighting) [
5], rough MABAC (multi-attributive border approximation area comparison) [
72] and rough EDAS (evaluation based on distance from average solution) [
73] to the same multi-criteria model. Extension of the MCDM methods with rough numbers has become common in the last few years. The reason for using a rough SAW, rough MABAC and rough EDAS method is that they in a very short time found application in different areas. These methods are well accepted by the wider academic community, which is confirmed by the number of their citations. Rough WASPAS is a method developed a few months ago and is often used in previous forms (crisp, fuzzy, grey) in the sensitivity analysis [
74].
In
Figure 5, it can be seen that the best transportation company does not change the rank in any approach, i.e., in all scenarios it is the best-ranked company. In addition, the following alternatives remain in their original positions by applying all approaches: the first, third and seventh alternatives are in the second, fifth and sixth place, respectively. The second alternative using rough ARAS, rough WASPAS and rough SAW takes the third position, while using rough MABAC and rough EDAS is in fourth place. By applying these two methods, the fourth alternative is best-ranked and takes the seventh position, while applying other approaches it is in the eighth position. The rank of the fifth alternative ranges from the seventh (rough ARAS, rough WASPAS and rough SAW) to ninth place (rough EDAS), while using rough MABAC it is in eighth place. The sixth alternative is worst-ranked in all approaches except rough EDAS when it takes the last position. The eighth alternative occupies the fourth position (rough ARAS, rough WASPAS and rough SAW), while applying rough MABAC and rough EDAS it is in a high third position.
Table 9 shows the third phase in the sensitivity analysis, which includes checking the correlation of ranks using different approaches.
Table 9 shows the SCC for all five applied approaches according to which it can be concluded that the ranks in all approaches are in very high correlation. The above is confirmed by the average value of SCC for all approaches which is 0.983. Spearman’s correlation coefficient ranges in the scope from 0.933–1.00. The developed rough ARAS has a full correlation of ranks with rough WASPAS and rough SAW. It has a slightly smaller correlation (0.967) with rough MABAC, while the smallest correlation with rough EDAS (0.933). Since rough WASPAS and rough SAW have a full correlation with rough ARAS, it is obvious that they have the same correlation with other approaches as rough ARAS has. Rough MABAC and rough EDAS have a correlation coefficient of 0.983, which is a consequence of the change of rank in two alternatives.
An explanation of the obtained results can be seen throughout the current state of the transport system in the observed countries. Libya is plagued by a poor transport system, which leads to enormous problems of traffic congestion and pollution. The lack of an integrated transport system has made logistics operations in the country primitive. City-to-city freight, sometimes over long distances of more than 1500 kilometers, is only carried out by people-owned vehicles or small shipping companies. This is also the case for logistics within cities, where they are carried out by inadequate fleets and trucks using the inner city roads. For instance, local product distributions are carried out by the same producing companies, which tend to own freight vehicles for distribution within cities, as well as larger trucks for longer haulage. The same applies to some food manufacturers, as well as to some companies specializing in supplying various goods and distributing them to retailers.
Road transportation is the most developed mode of transportation in Bosnia and Herzegovina, although by the middle of 2003, when it obtained the first 11 km of a modern highway, B&H was the only country in the region of south-east Europe that did not have a single kilometer of modern highway. With the construction of new road networks, road freight transportation has gained significance. Companies with their own fleets, which deal with both domestic and international freight transportation, have been established. Most frequently, cargo transportation is performed by furgon trucks, tanks and trailer trucks, but a large number of means of transportation exceeds the permitted age limit. Although road networks have already been constructed and reconstructed, there is still a need for improvement and the construction of a new road infrastructure; because of the aforementioned factors, there is often a delay in road traffic, and as a consequence, the delivery of goods to the recipient regarding transportation at a national level. Regarding international freight transportation, these problems are much less common.
Road transportation in Serbia is at a bit higher in its level of development than in BiH and represents a dynamic and dominant mode of transportation. Although transportation in Serbia is more developed compared to that in B&H, it still largely lags behind the region due to the poor condition of the existing road network, as well as a slow construction of new transport corridors. In the last few years, there has been a tendency for the growth of freight transportation and an increase in the number of road vehicles. However, this growth represents a heavy burden for already bad road infrastructure. The current road transportation is characterized by an ageing vehicle fleet, which affects safety in traffic, and poor road infrastructure causes damage to road vehicles.
It is important to note that in the last few years, the number of transportation companies offering logistics outsourcing in Bosnia and Herzegovina and Serbia has increased, and consequently, the quality of a complete transport system and, to a certain extent, logistics has also increased.


 ,
, 


