6.2.1. Data Description and Experimental Settings
Real datasets from the Sina micro-blog platform, such as the
dataset and
dataset, are used to examine the performance of various recommendation mechanisms. For the
dataset, we collected data from 4 December 2011 to 23 December 2011 in the
website (
http://www.nlpir.org/). Lastly, 144 users are selected for GUP modeling. The number of their followees is 7830. That is, averagely, each user has about 55 followees for mining representative group. In this dataset, most of followees rarely posted or reposted micro-blogs, so we utilized 1346 different activated followees who had posted or reposted micro-blogs for subject extraction. In addition, we collected 42,938 users who were followed by modeling users’ followees for computing social similarity. For the
dataset, we got the newest micro-blogs, followee friends, mutual responses and interactions from 10 April 2013 to 29 April 2013 in the Sina micro-blog platform (
http://open.weibo.com). We selected 525 users for GUP modeling. The number of their followees is 39,017. For each user, the average number of followees is approximate to 75. Due to the repetition of the followees, we investigated 3514 different activated followees with micro-blogs for subject extraction. They posted or reposted 11,198 micro-blogs. Meanwhile, we count the number of followees’ followees is 136,202 for calculating social similarity. The details for two datasets are shown in
Table 1.
In all experiments, we divide each dataset into two periods according to the timestamp. Specially, for the dataset, the data is from 4 December 2011 to 23 December 2011. So, we split it into two parts every ten days. That is, the data of the first half period is from 4 December 2011 to 13 December 2011. They are mainly used to model users’ interests and construct GUP. The second half period is from 14 December 2011 to 23 December 2011, which is utilized to test the accuracy of recommendation result. Similarly, we divide the dataset into two parts for our experiments. We compare the proposed GUP method with several existing methods, such as CF, LDA and personal UP method.
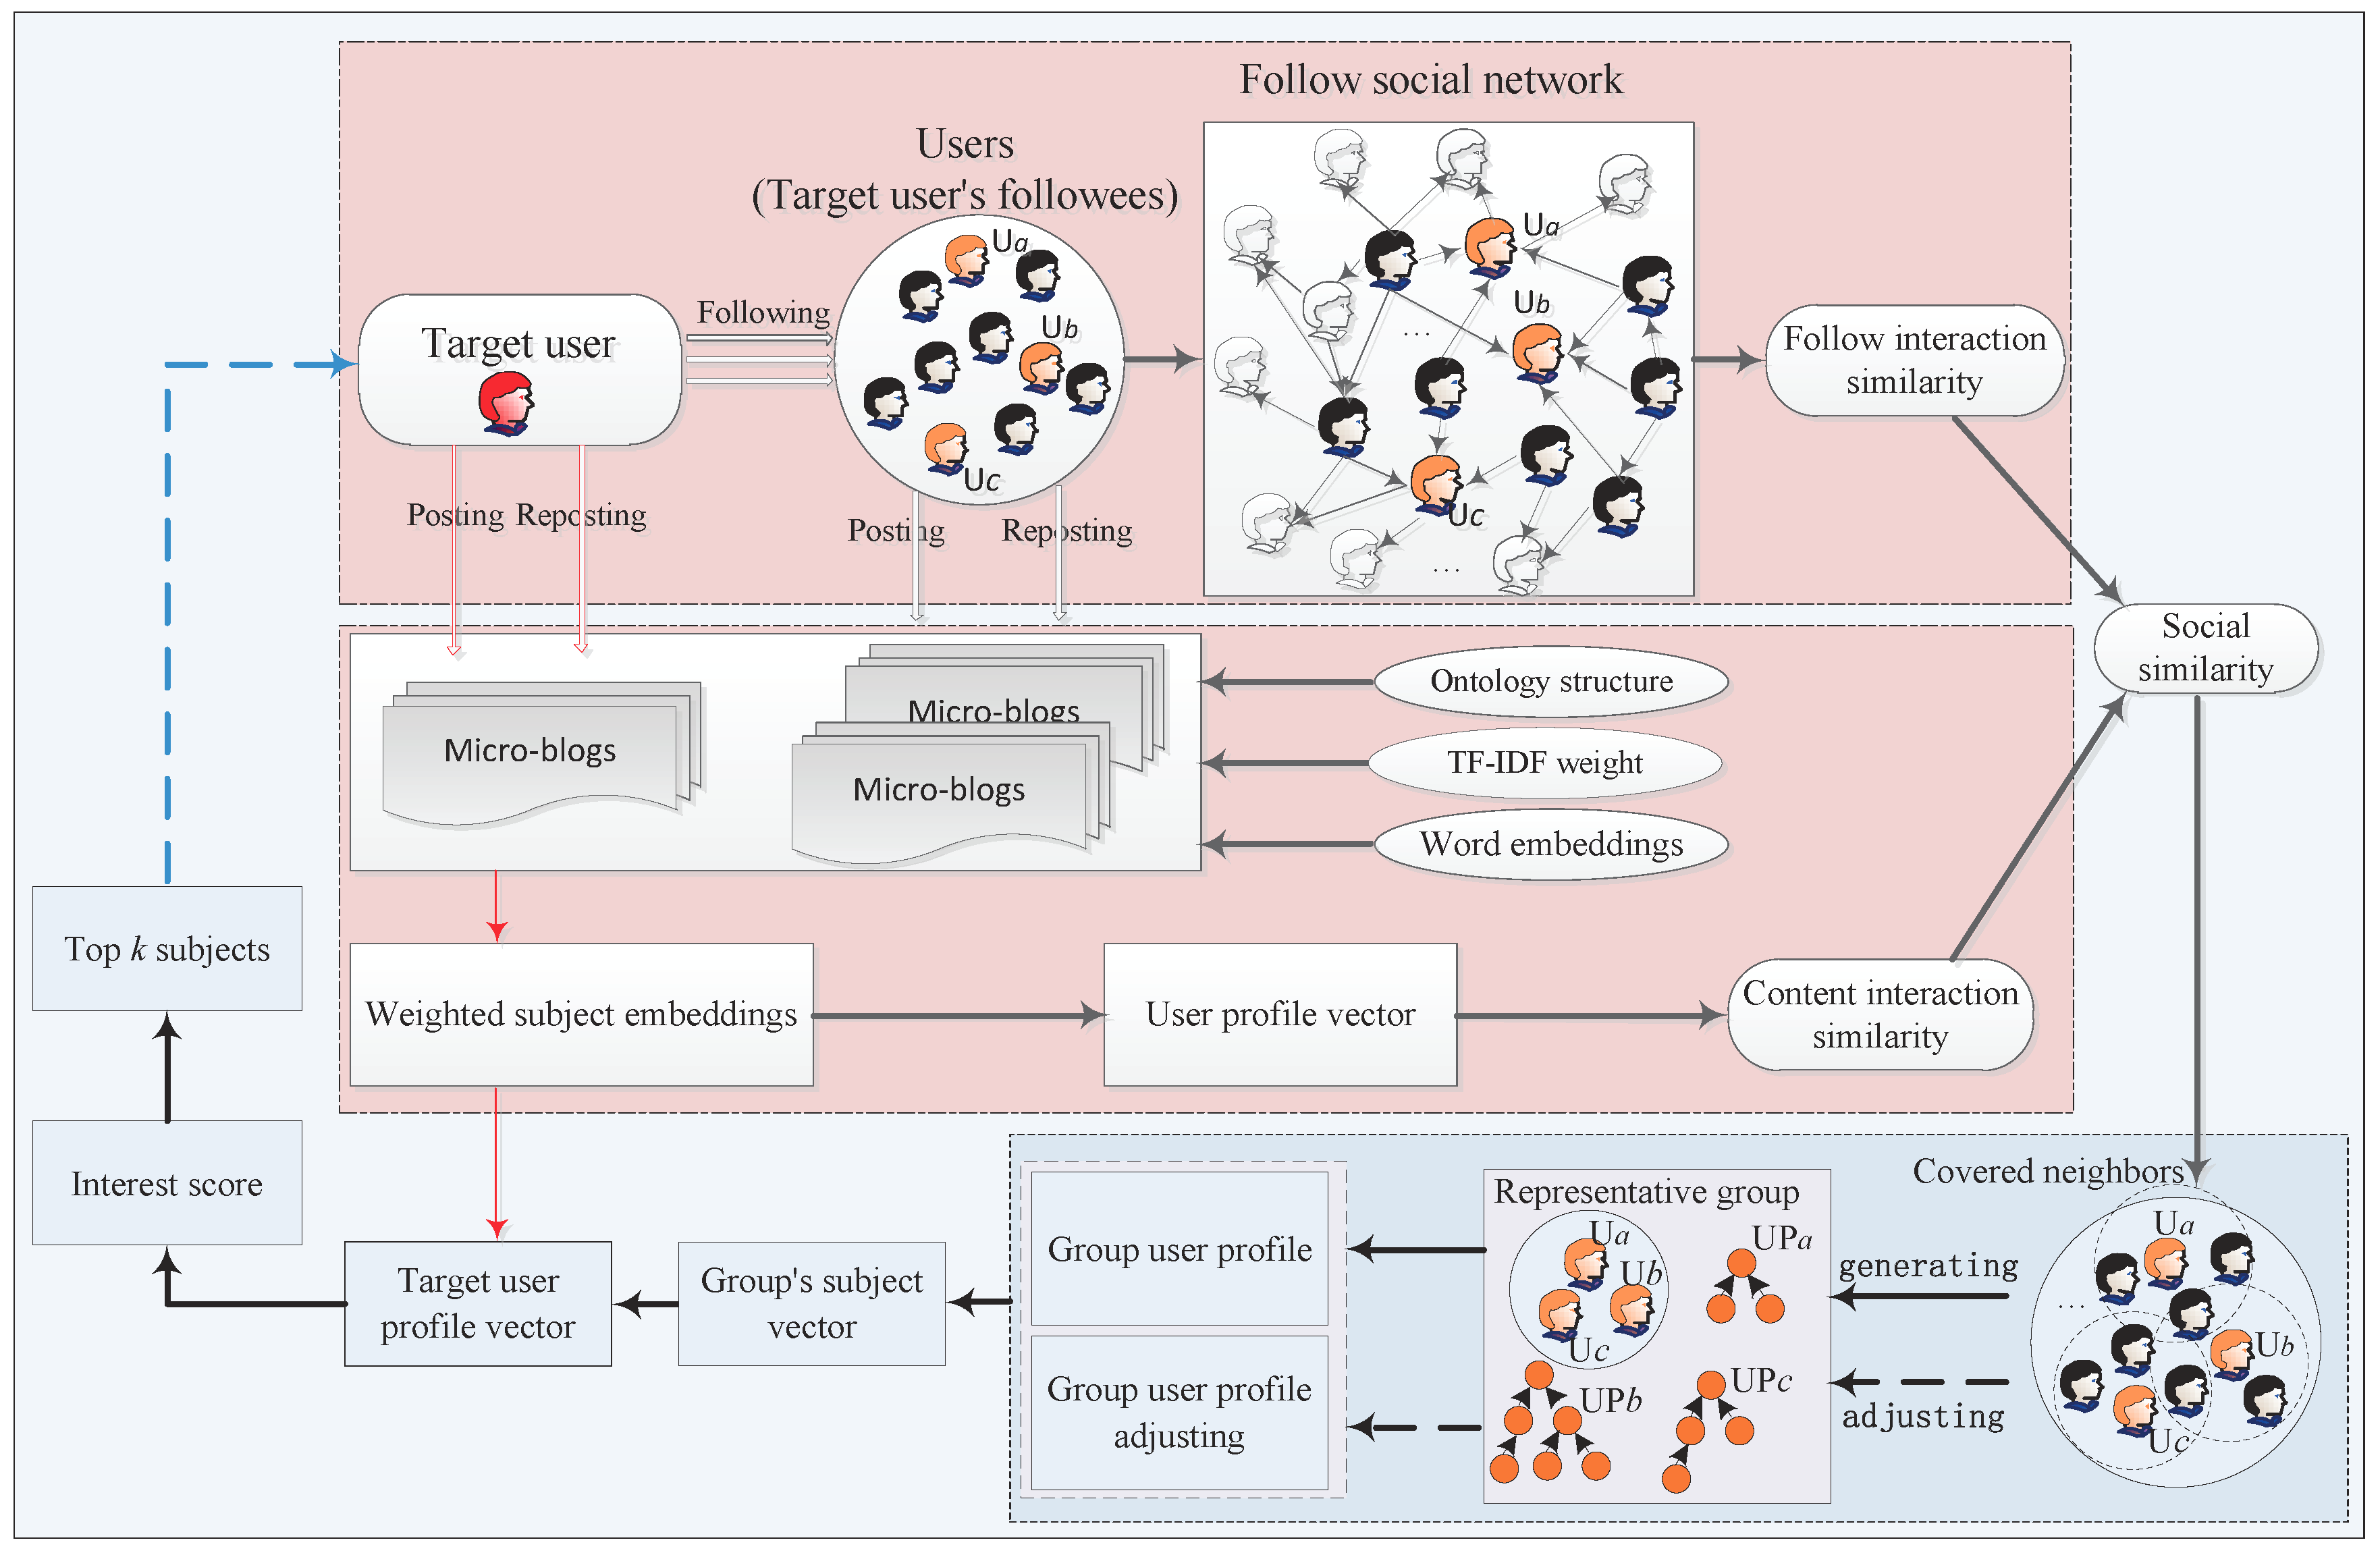
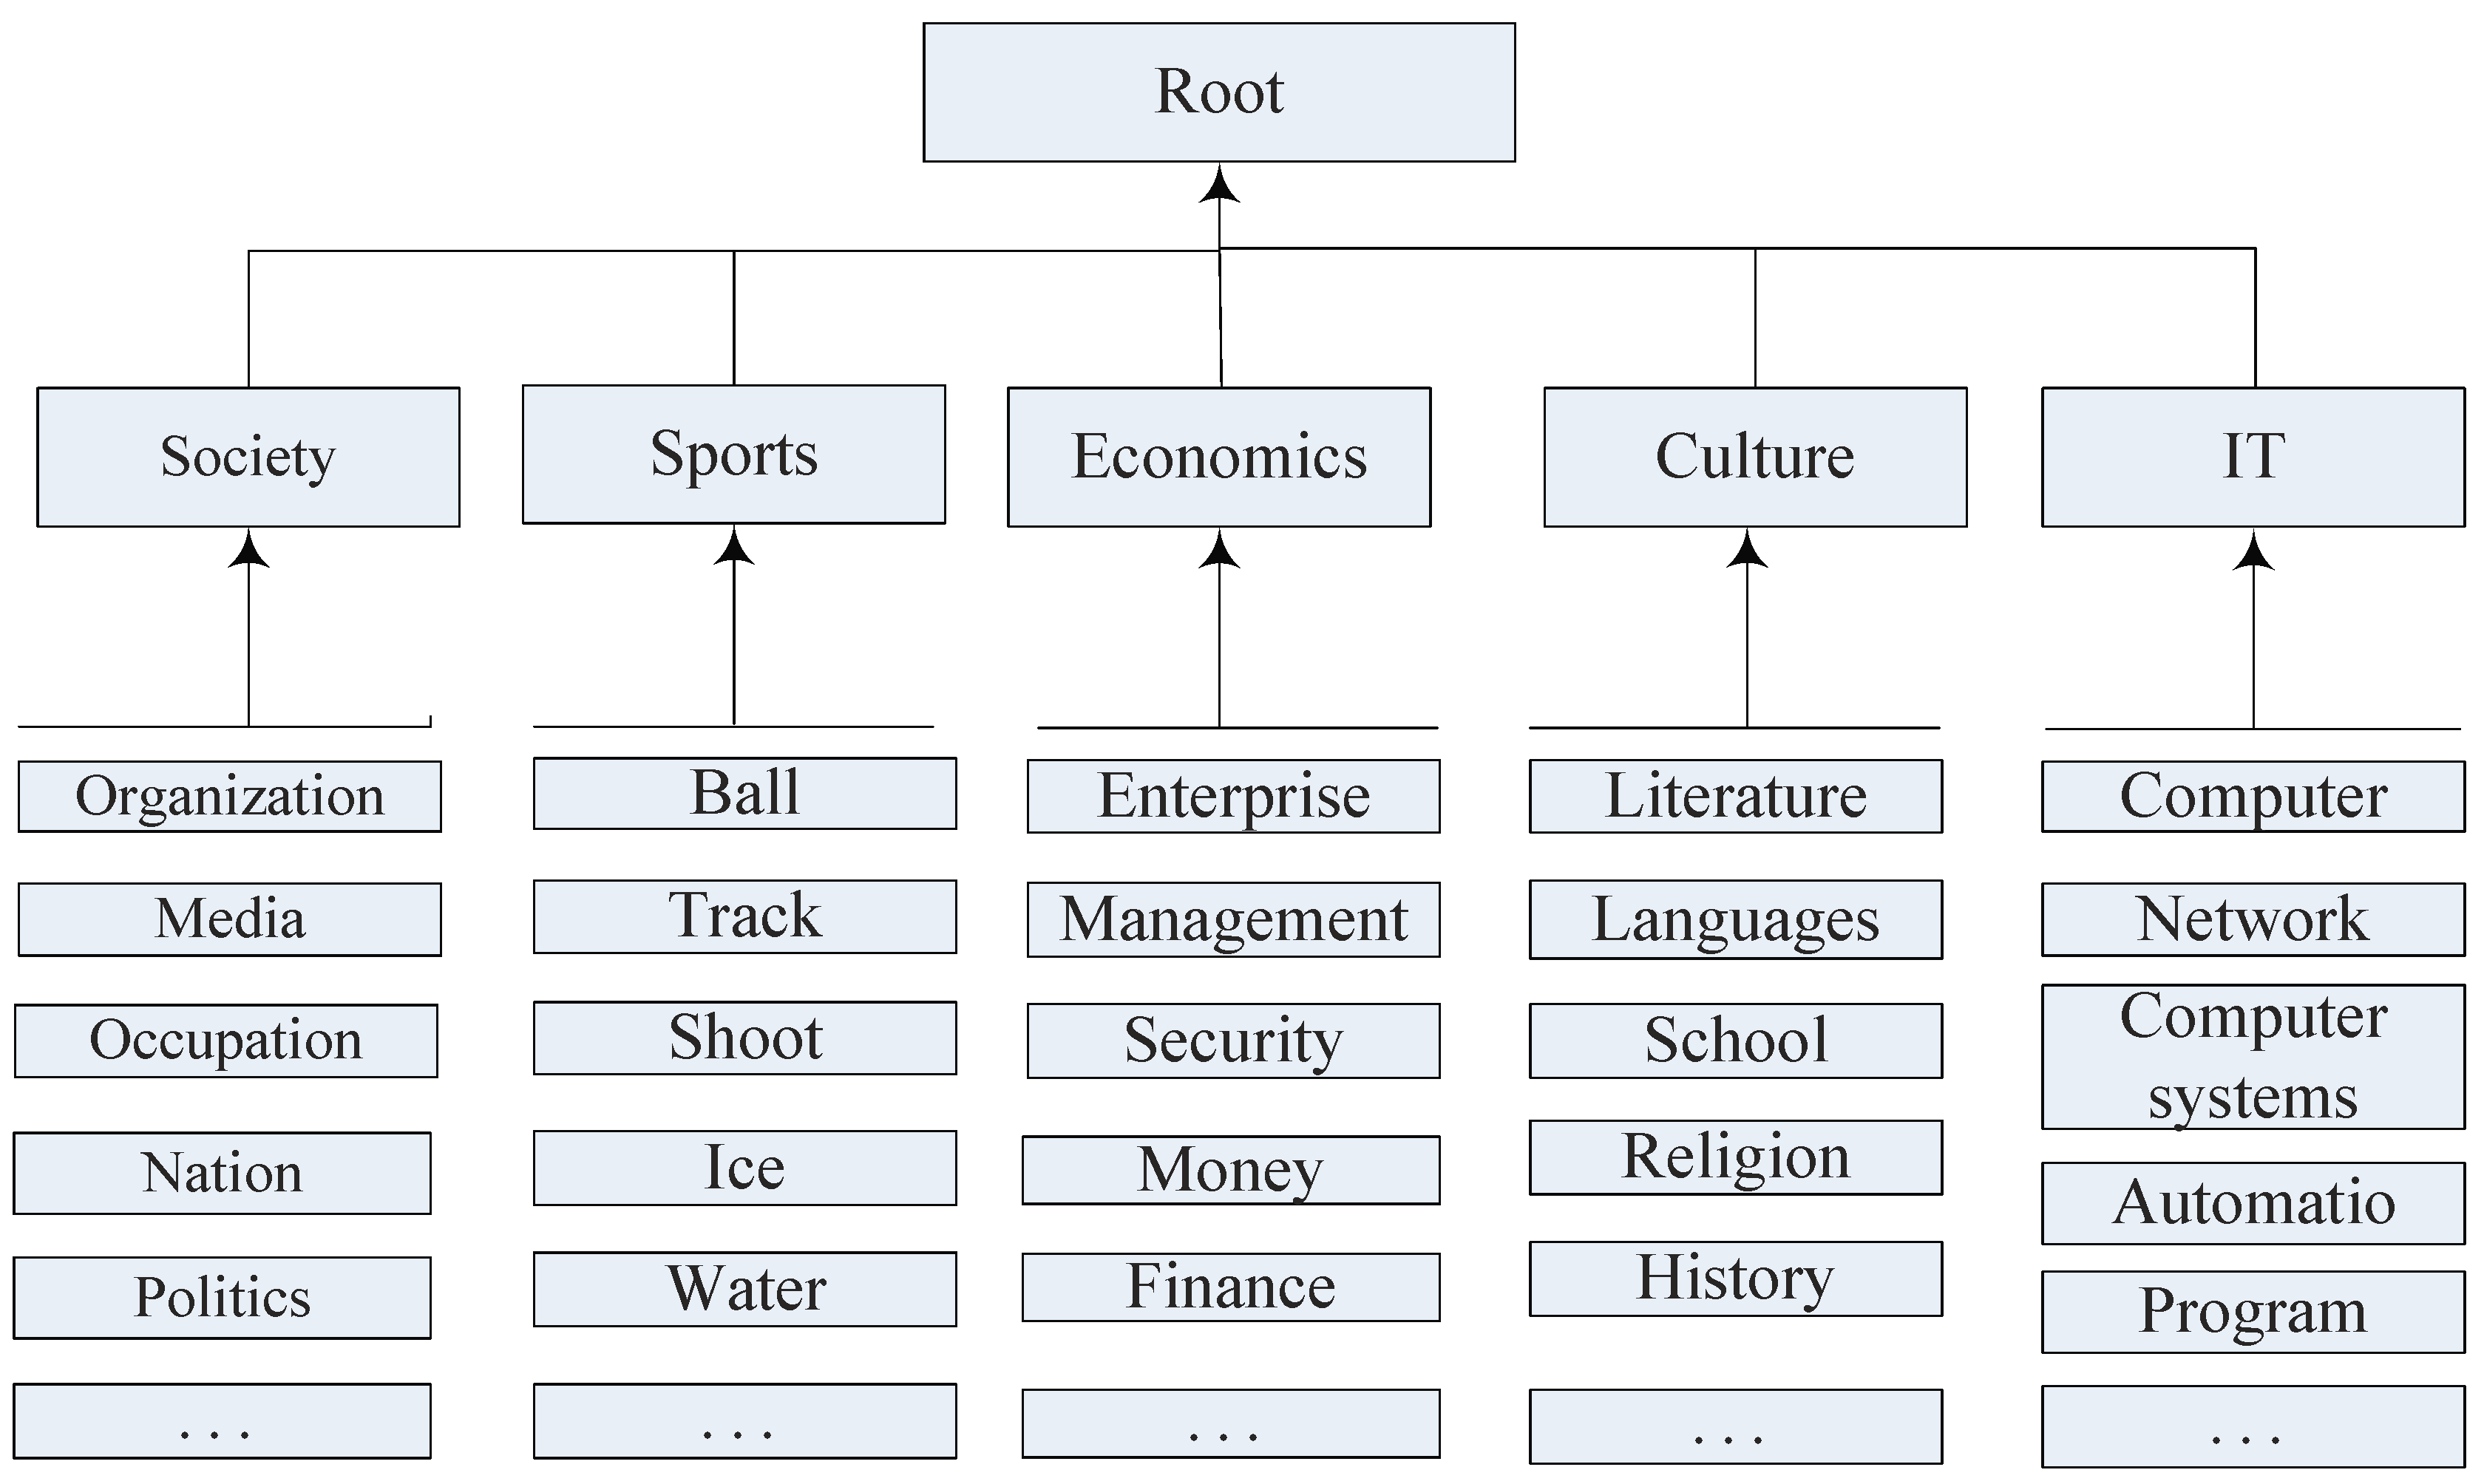
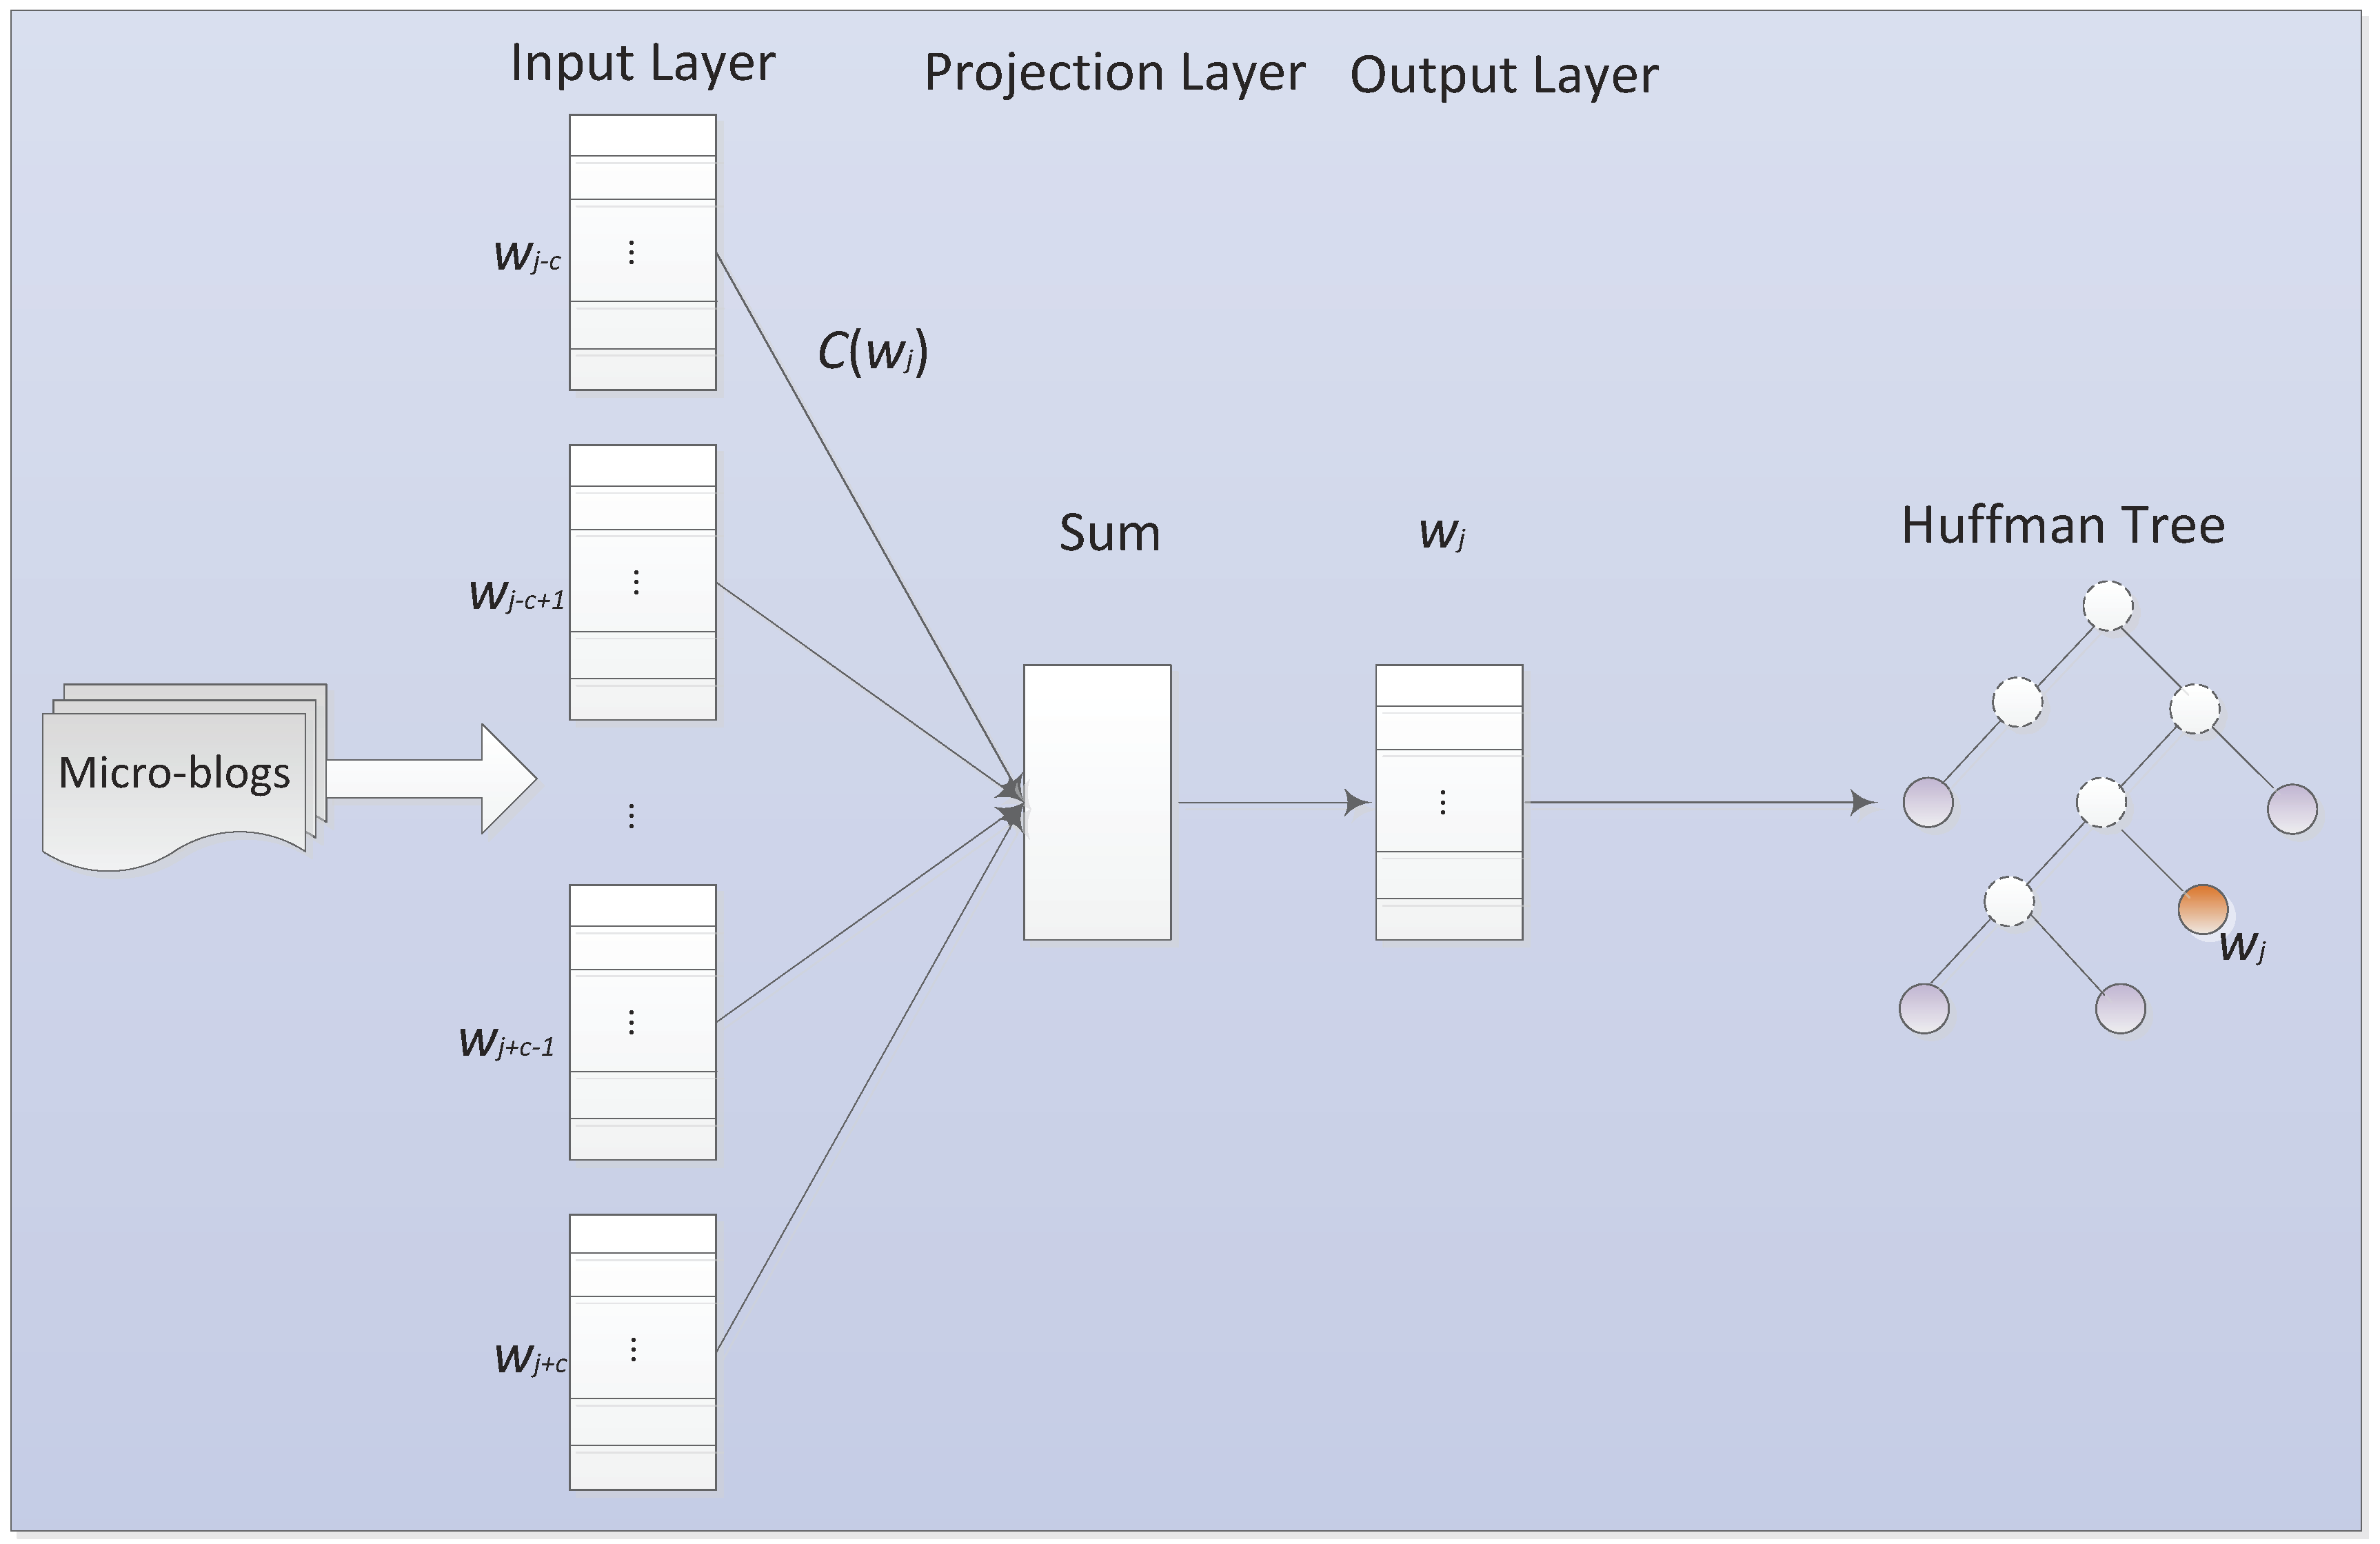
In the GUP experiment, we preprocessed the two dataset as follows. Given the micro-blogs corpus, the first step of preprocessing is word segmentation and stop words removing. After word segmentation, we mainly use a stop word dictionary to filter the conjunctions, adverbs, articles and prepositions. Then, we preserve the significant noun subjects and terms with Wikipedia ontology knowledge base to learn taxonomic structure. Next, we replace some irregular words, typographical errors and informal words by formal words in terms of an irregular word alternative list, which can form word vocabulary. By applying the TF-IDF mechanism, we can compute the accumulated weight of a word for target user. In terms of tensorflow tool, we implement the word in vocabulary list into a vector representation. For a user, considering all words’ TF-IDF weight and corresponding vector, we can get one’s user profile vector. we set the dimension of subject vectors and GUP vectors both as 100 to compute the interest score of subject. According to the rank of interest score, top-k subjects are provided for the target user.
The LDA method first models followees’ hidden topic distribution according to all the posted or reposted micro-blogs. Then considering the top-
k topic distribution of followees, we pushed the related subjects to the target user. In the process of modeling latent topic distribution, we set the hyper parameters
= 0.01. For the CF recommendation, we utilize the method in Equation (
11) to discover similar users and compute collaborative interest weight by Equation (
12). Then, top-
k subjects are selected for the target user. In addition, we adopted the content-based UP in Equation (
3) for recommendation. Specially, for each kind of recommendation mechanism, we then push micro-blogs involved in recommended subjects to the target user.
6.2.2. Evaluation Metrics
Precision and recall are conventional properties that measure the degree to which generated recommendations accurately match the personal interests [
33]. The metrics are shown as follows:
where
is the actual subject set of testing messages and
is the subject set of recommendation list in the training messages relying on the GUP, CF, LDA and personal UP methods.
In addition, Discounted Cumulative Gain (DCG) is a popular recommendation accuracy metric that gives more importance to highly ranked subjects and the relevance of each subject [
50]. The measure can be defined as:
where
if
i-the subject is relevant to the actual subject set of testing messages; otherwise,
. With the definition of
, the ideal
, denoted as
, is defined:
where
C is the number of relevant subjects in the recommendation list set
. Specifically, we adopt the normalized
to measure the relevancy performance of the recommendation list.
In most case, users enjoy diverse and novel subjects while they pay attention to their interests. Hence, the diversity is also an important quality for evaluating the usefulness of recommendation subjects for each user, which is defined as:
where
is the discrimination of two arbitrary subjects in the recommendation list
. Specifically,
, if
; otherwise,
.
Note that we average the metric scores of each user over the test set for every evaluation to measure the quality of recommendations.
6.2.3. Results and Evaluation
For the GUP, LDA, CF and UP methods, we make experiments with precision, recall, F1, IDCG and DIV metrics by varying the recommendation list size
k. In the process of GUP modeling, the social similarity parameter
affects the selection of group, and the covered radius
r also impacts the scale of group. So, we need to analyze the effect of parameters on the results. In the experiment, we get the best performance of GUP model at
= 0.5,
r = 0.5 for the
dataset. Similarly, for
dataset, the most effective result is achieved at
= 0.5,
r = 0.7.
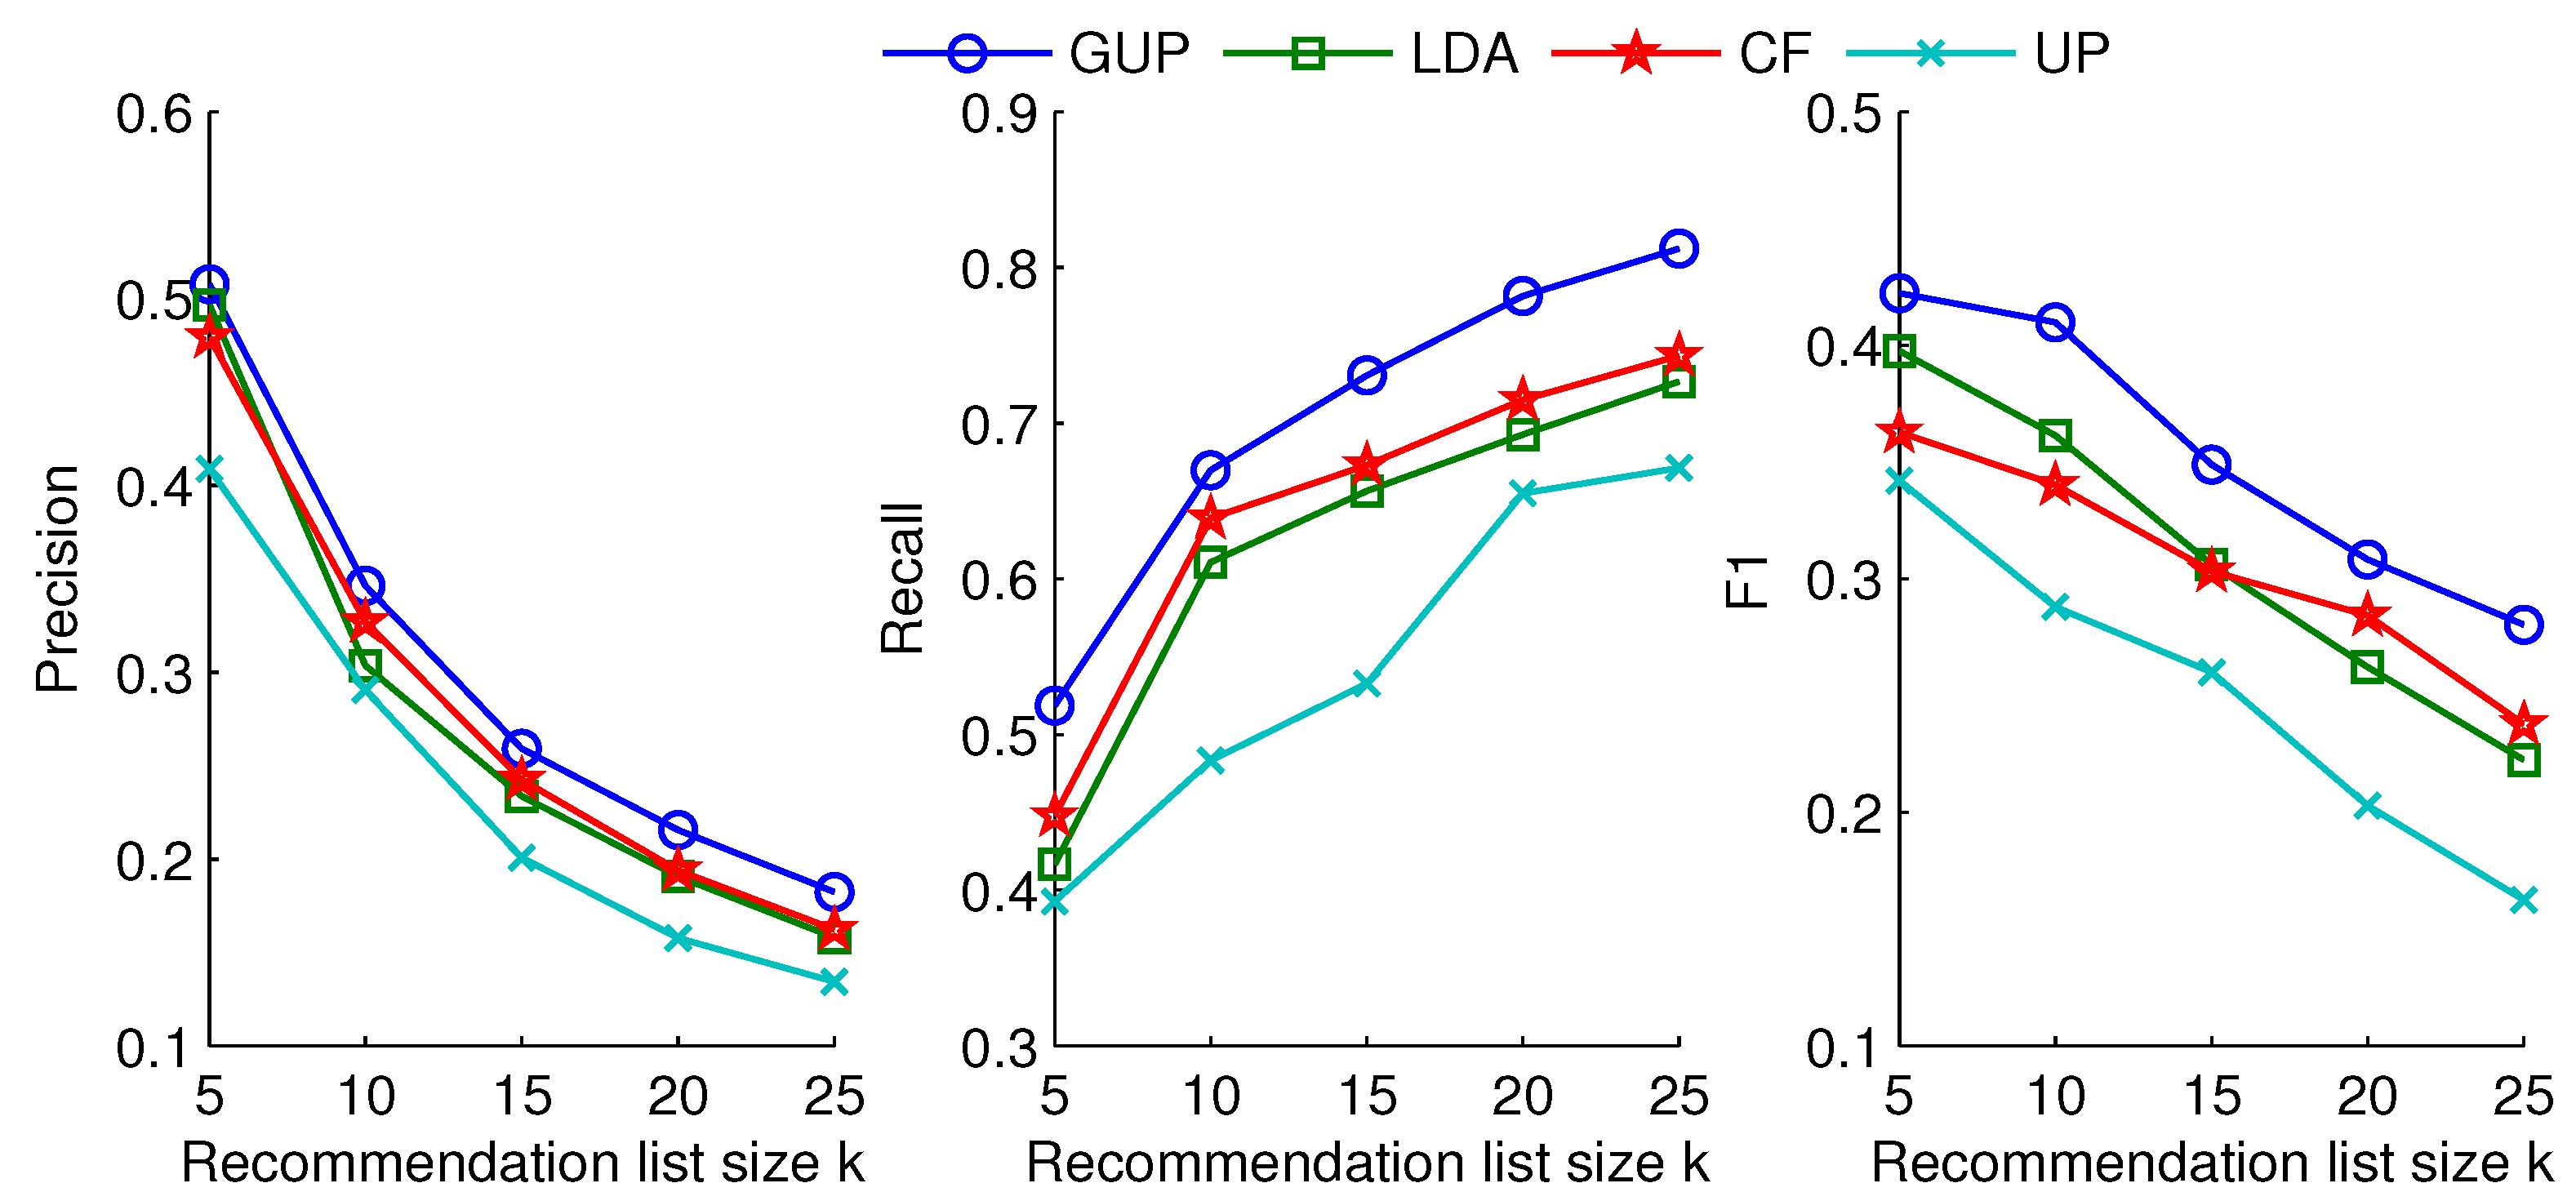
Figure 4 and
Figure 5 show average performance obtained by several methods on
and
datasets. For two datasets, on the precision indicators, the GUP strategy is superior overall to LDA, CF and UP methods. That is, the GUP recommendation method not only diversifies users’ interests but also improves the relative interest score of recommended subjects. For example, in the
dataset, the GUP approach achieves 0.5076 with a recommendation-list size of 5, higher than 0.4966 for LDA, 0.4792 for CF and 0.4087 for UP. This shows that more than 365 of the 720 subjects recommended by GUP are averagely received by 144 users. The phenomenon states that the representative group can cover most subjects of personal interests than an equal number of similar users. The representative group can contain diverse interests, which can be pushed to the target user.
The recall and F1 curves for GUP, LDA, CF and UP methods are given in
Figure 4 and
Figure 5 (center, right). The performance of GUP is obviously higher than those of other methods, which can better express diverse semantics. As the size of the recommendation list increases, the recall of GUP improves. That is, the recommended subjects can cover personal interests wonderfully. In the figure, the recalls for LDA and CF methods become increasingly close as the number of recommended subjects increases. This is because semantic relevant subjects have already appeared, while the novel interests are constantly emerging in two methods at a large recommendation list size.
In the process of GUP recommendation, as the number of diverse interests increases, the interest score of enhanced interests can also affect the ranking of recommendation list.
Table 2 and
Table 3 measure influences of interest score by comparing the rank accuracy and the diversity of the recommendation list. According to the tables, GUP performs best among all compared methods. As
k increases, the values of NDCG and DIV indicators in GUP method become significantly higher than those of other methods. This indicates that the interests in terms of GUP representation are highly ranked in the top of the list, which can both improve the performances of NDCG and DIV. For example, GUP outperforms all other models in terms of both NDCG@20 and DIV@20. On two datasets, NDCG and DIV values are basically stable, which indicates that the number of highly relevant diverse subjects is steadily increasing. It is clear that the interest score mechanism of GUP can gradually increase the diversity as the recommendation list size increases.
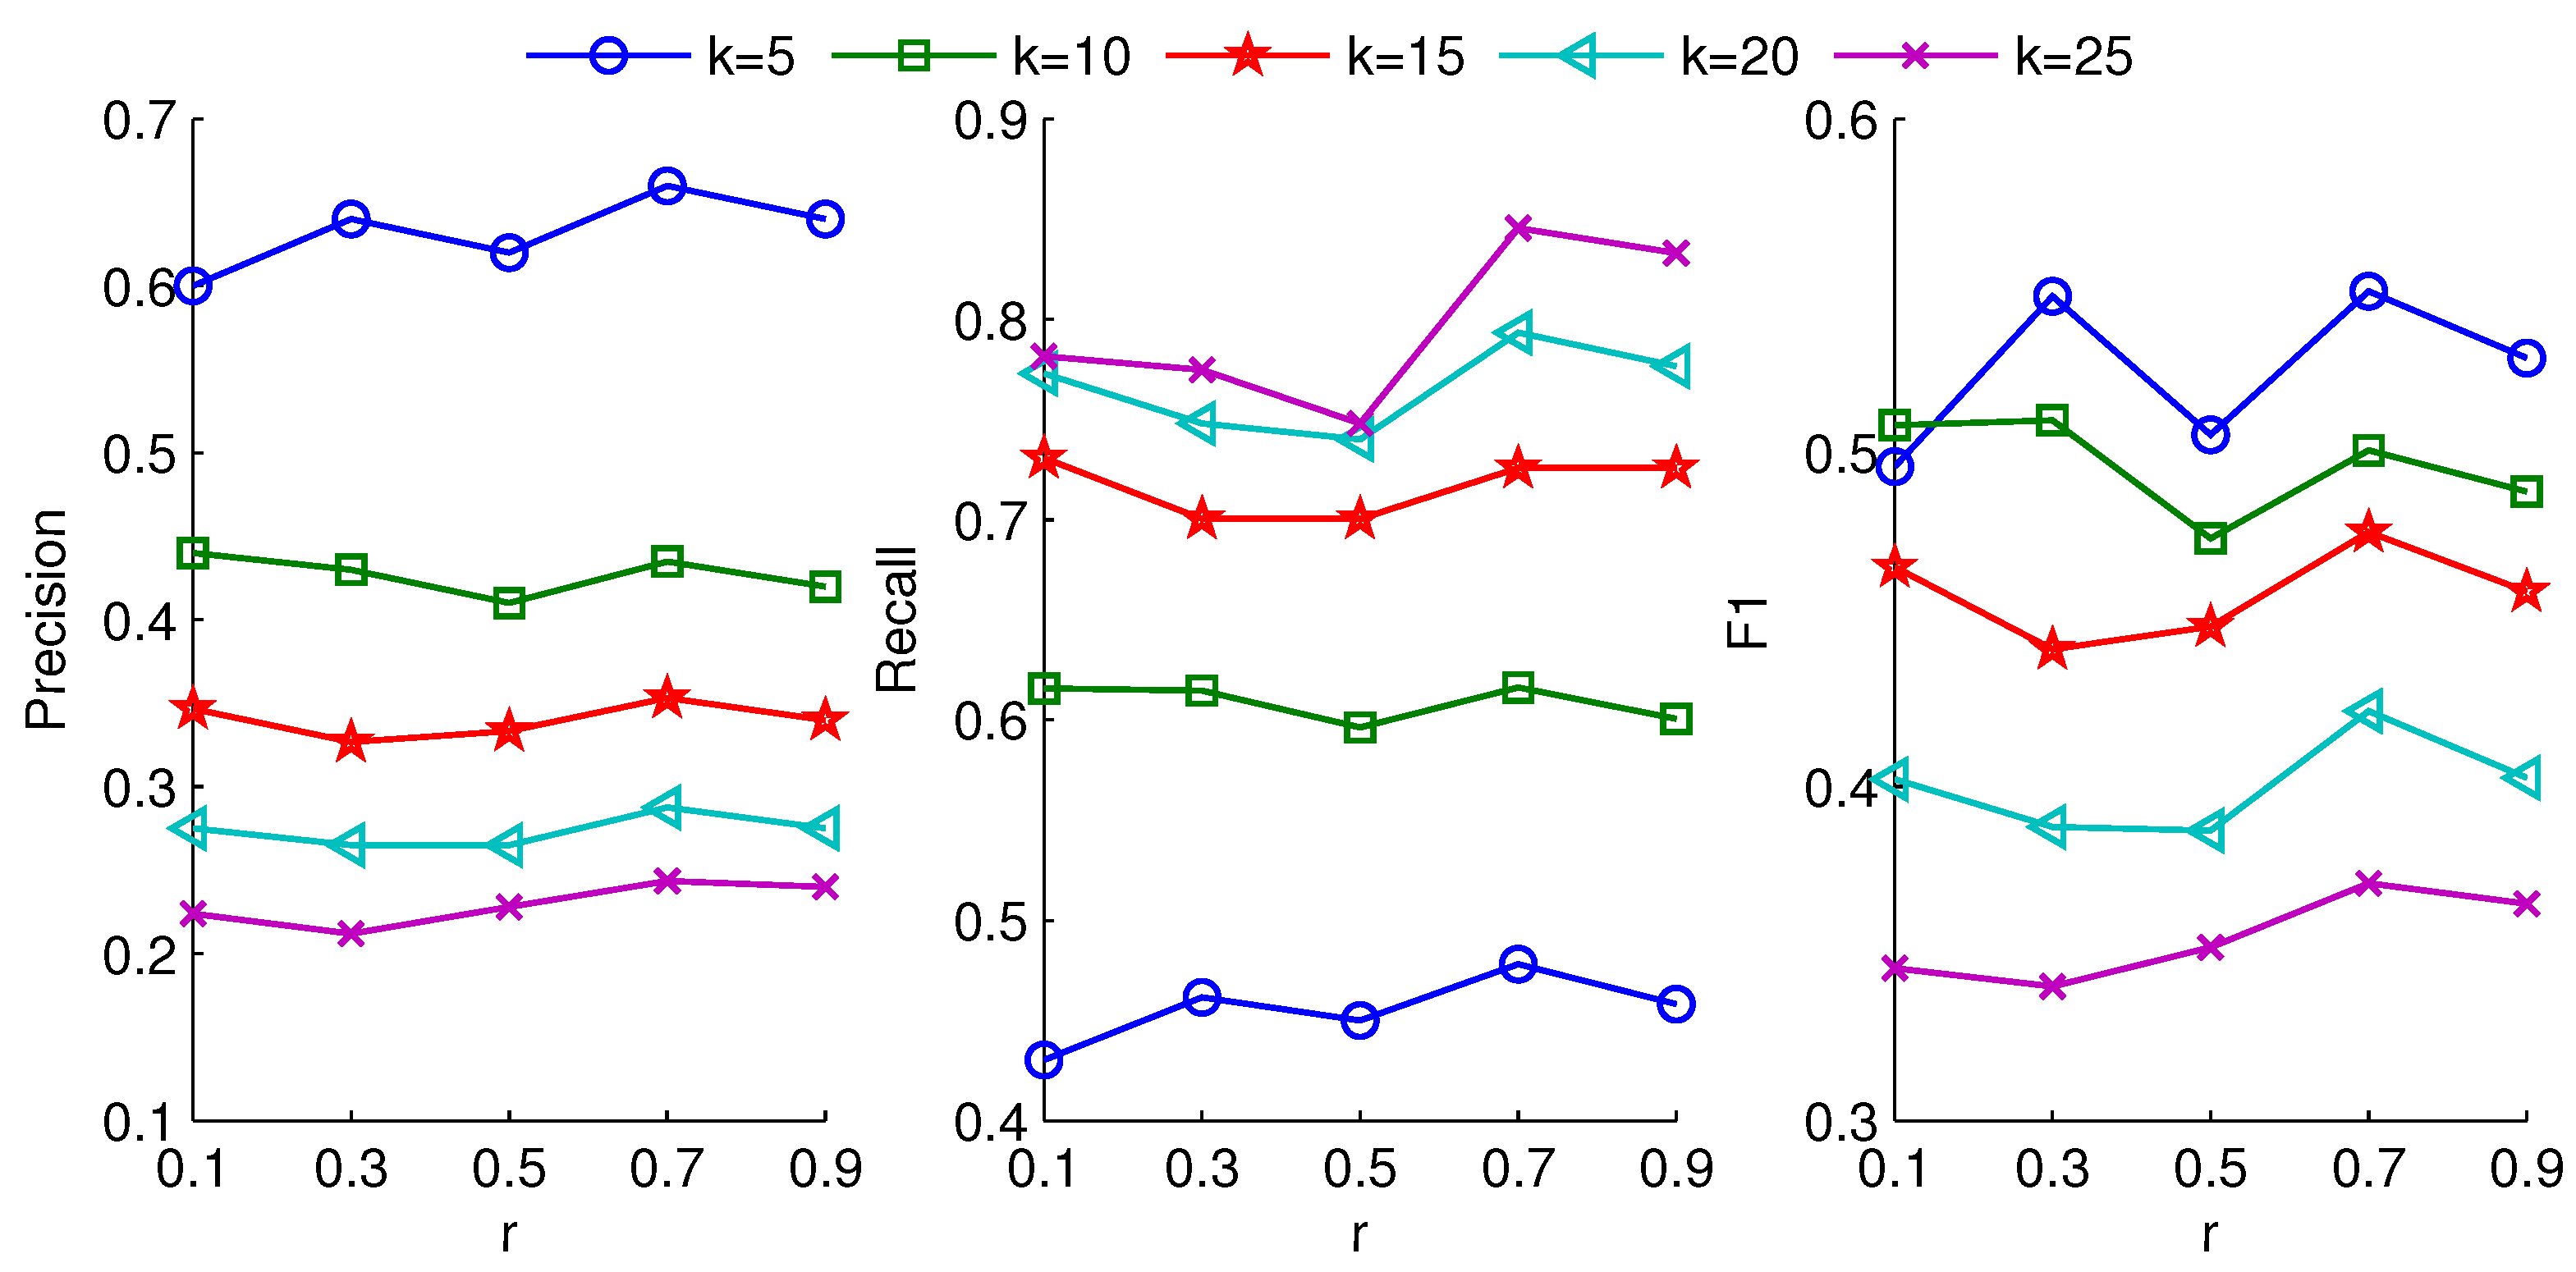
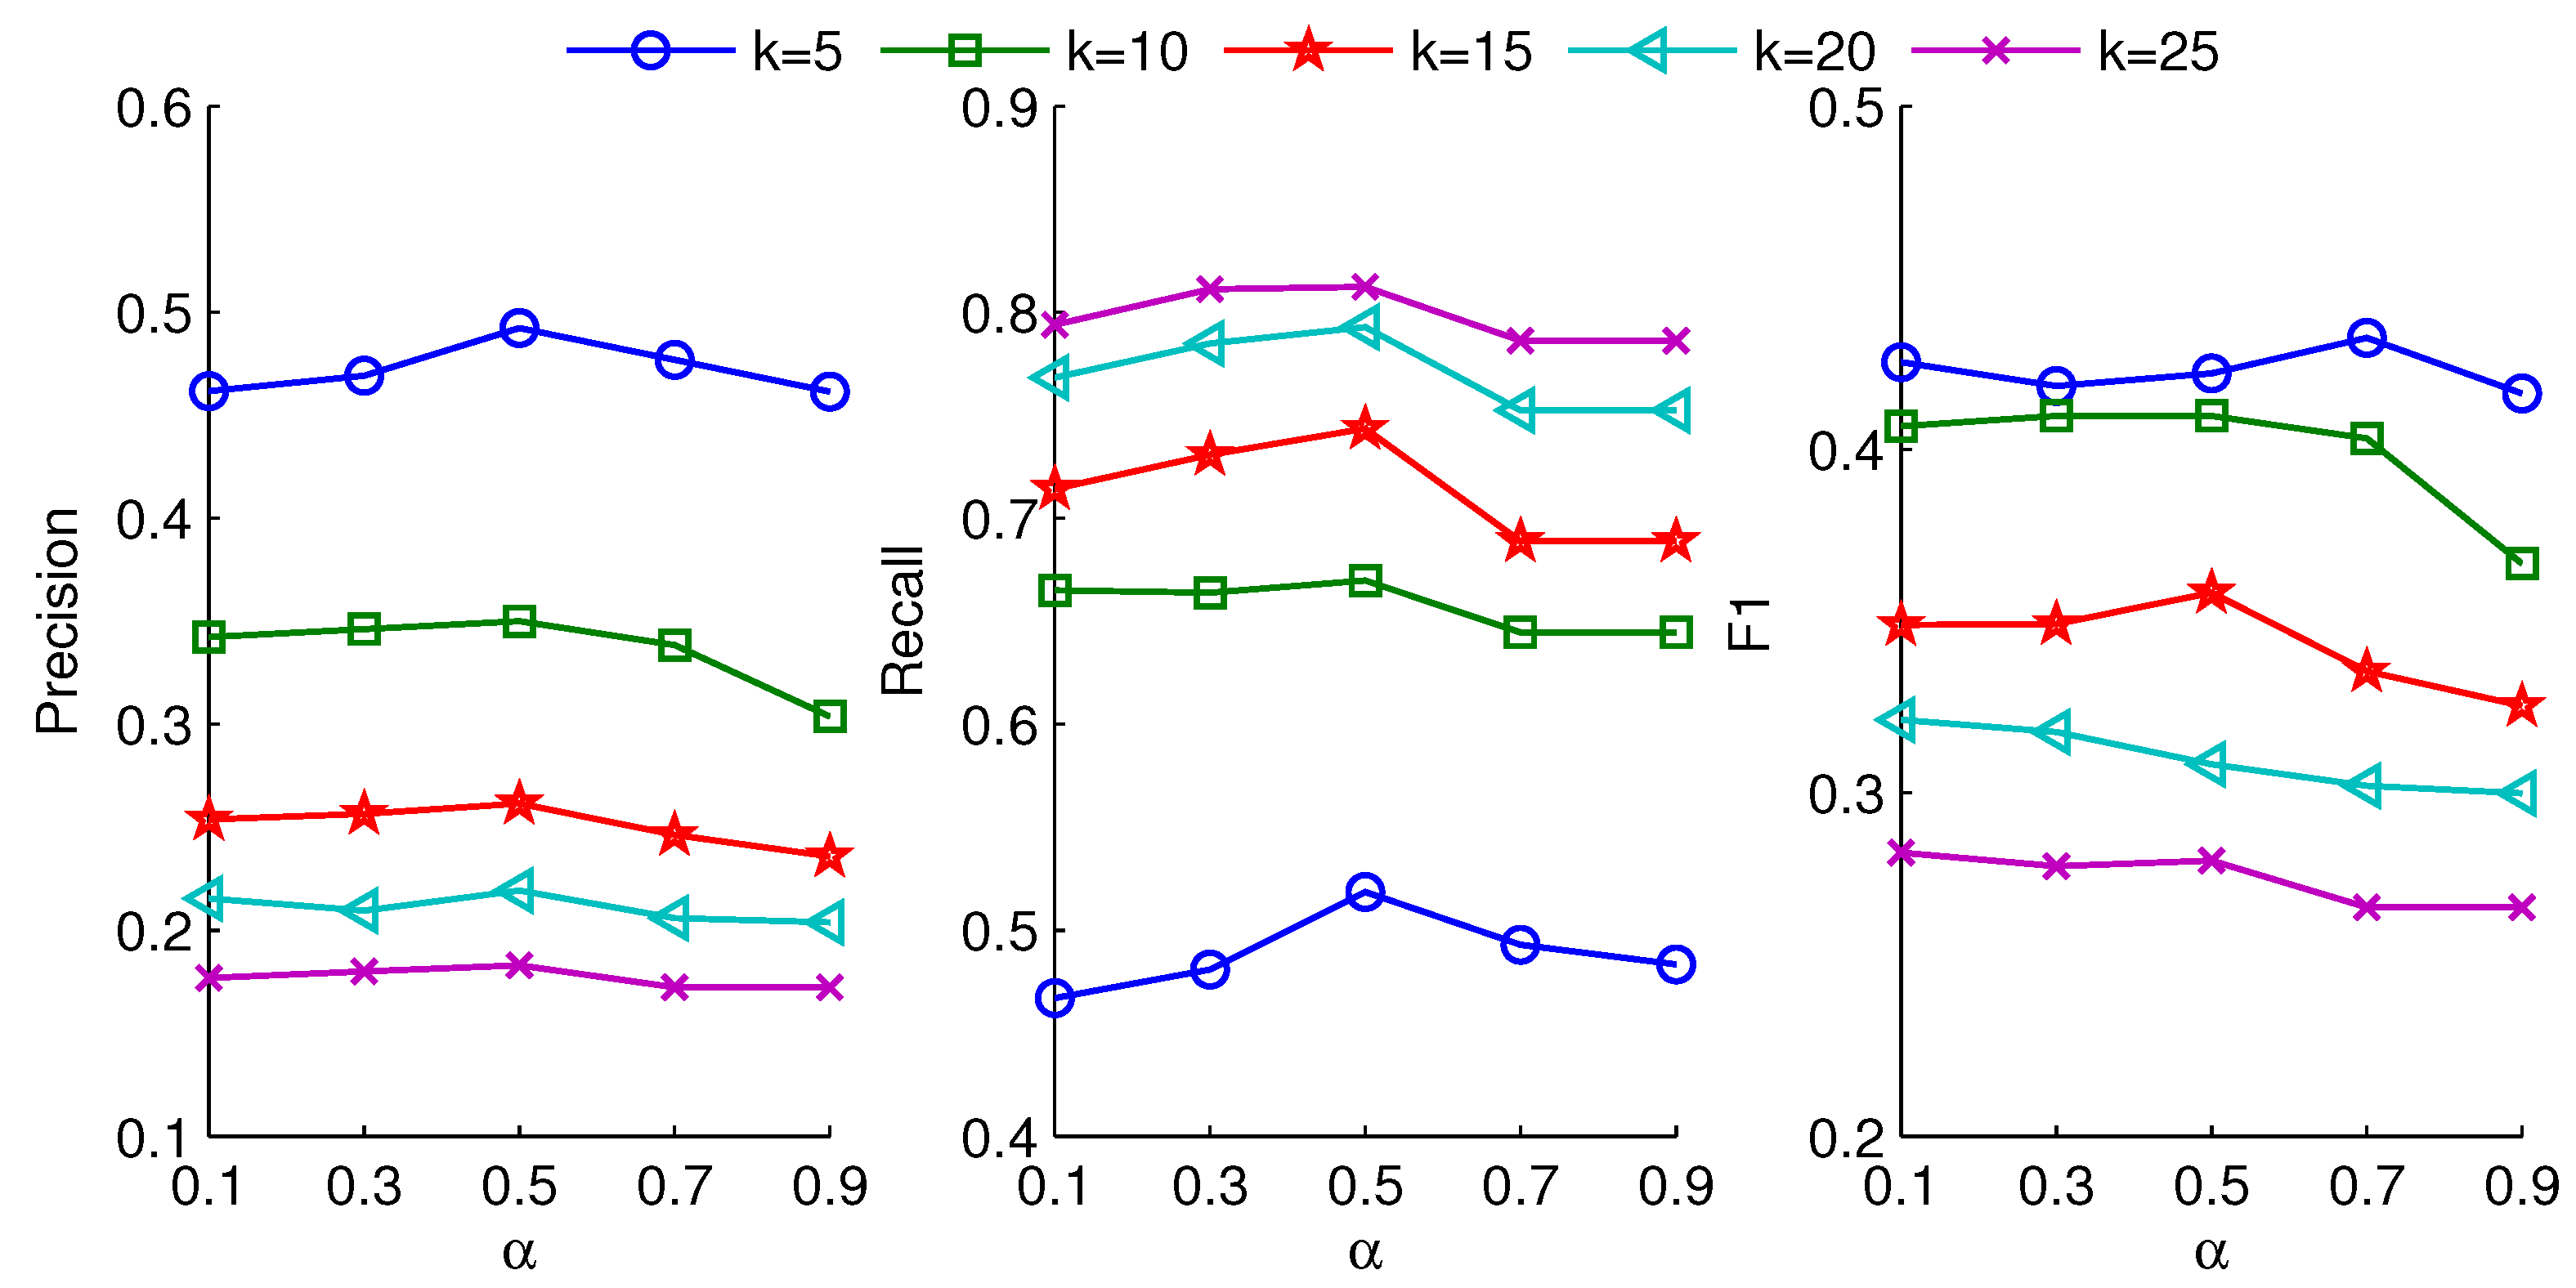
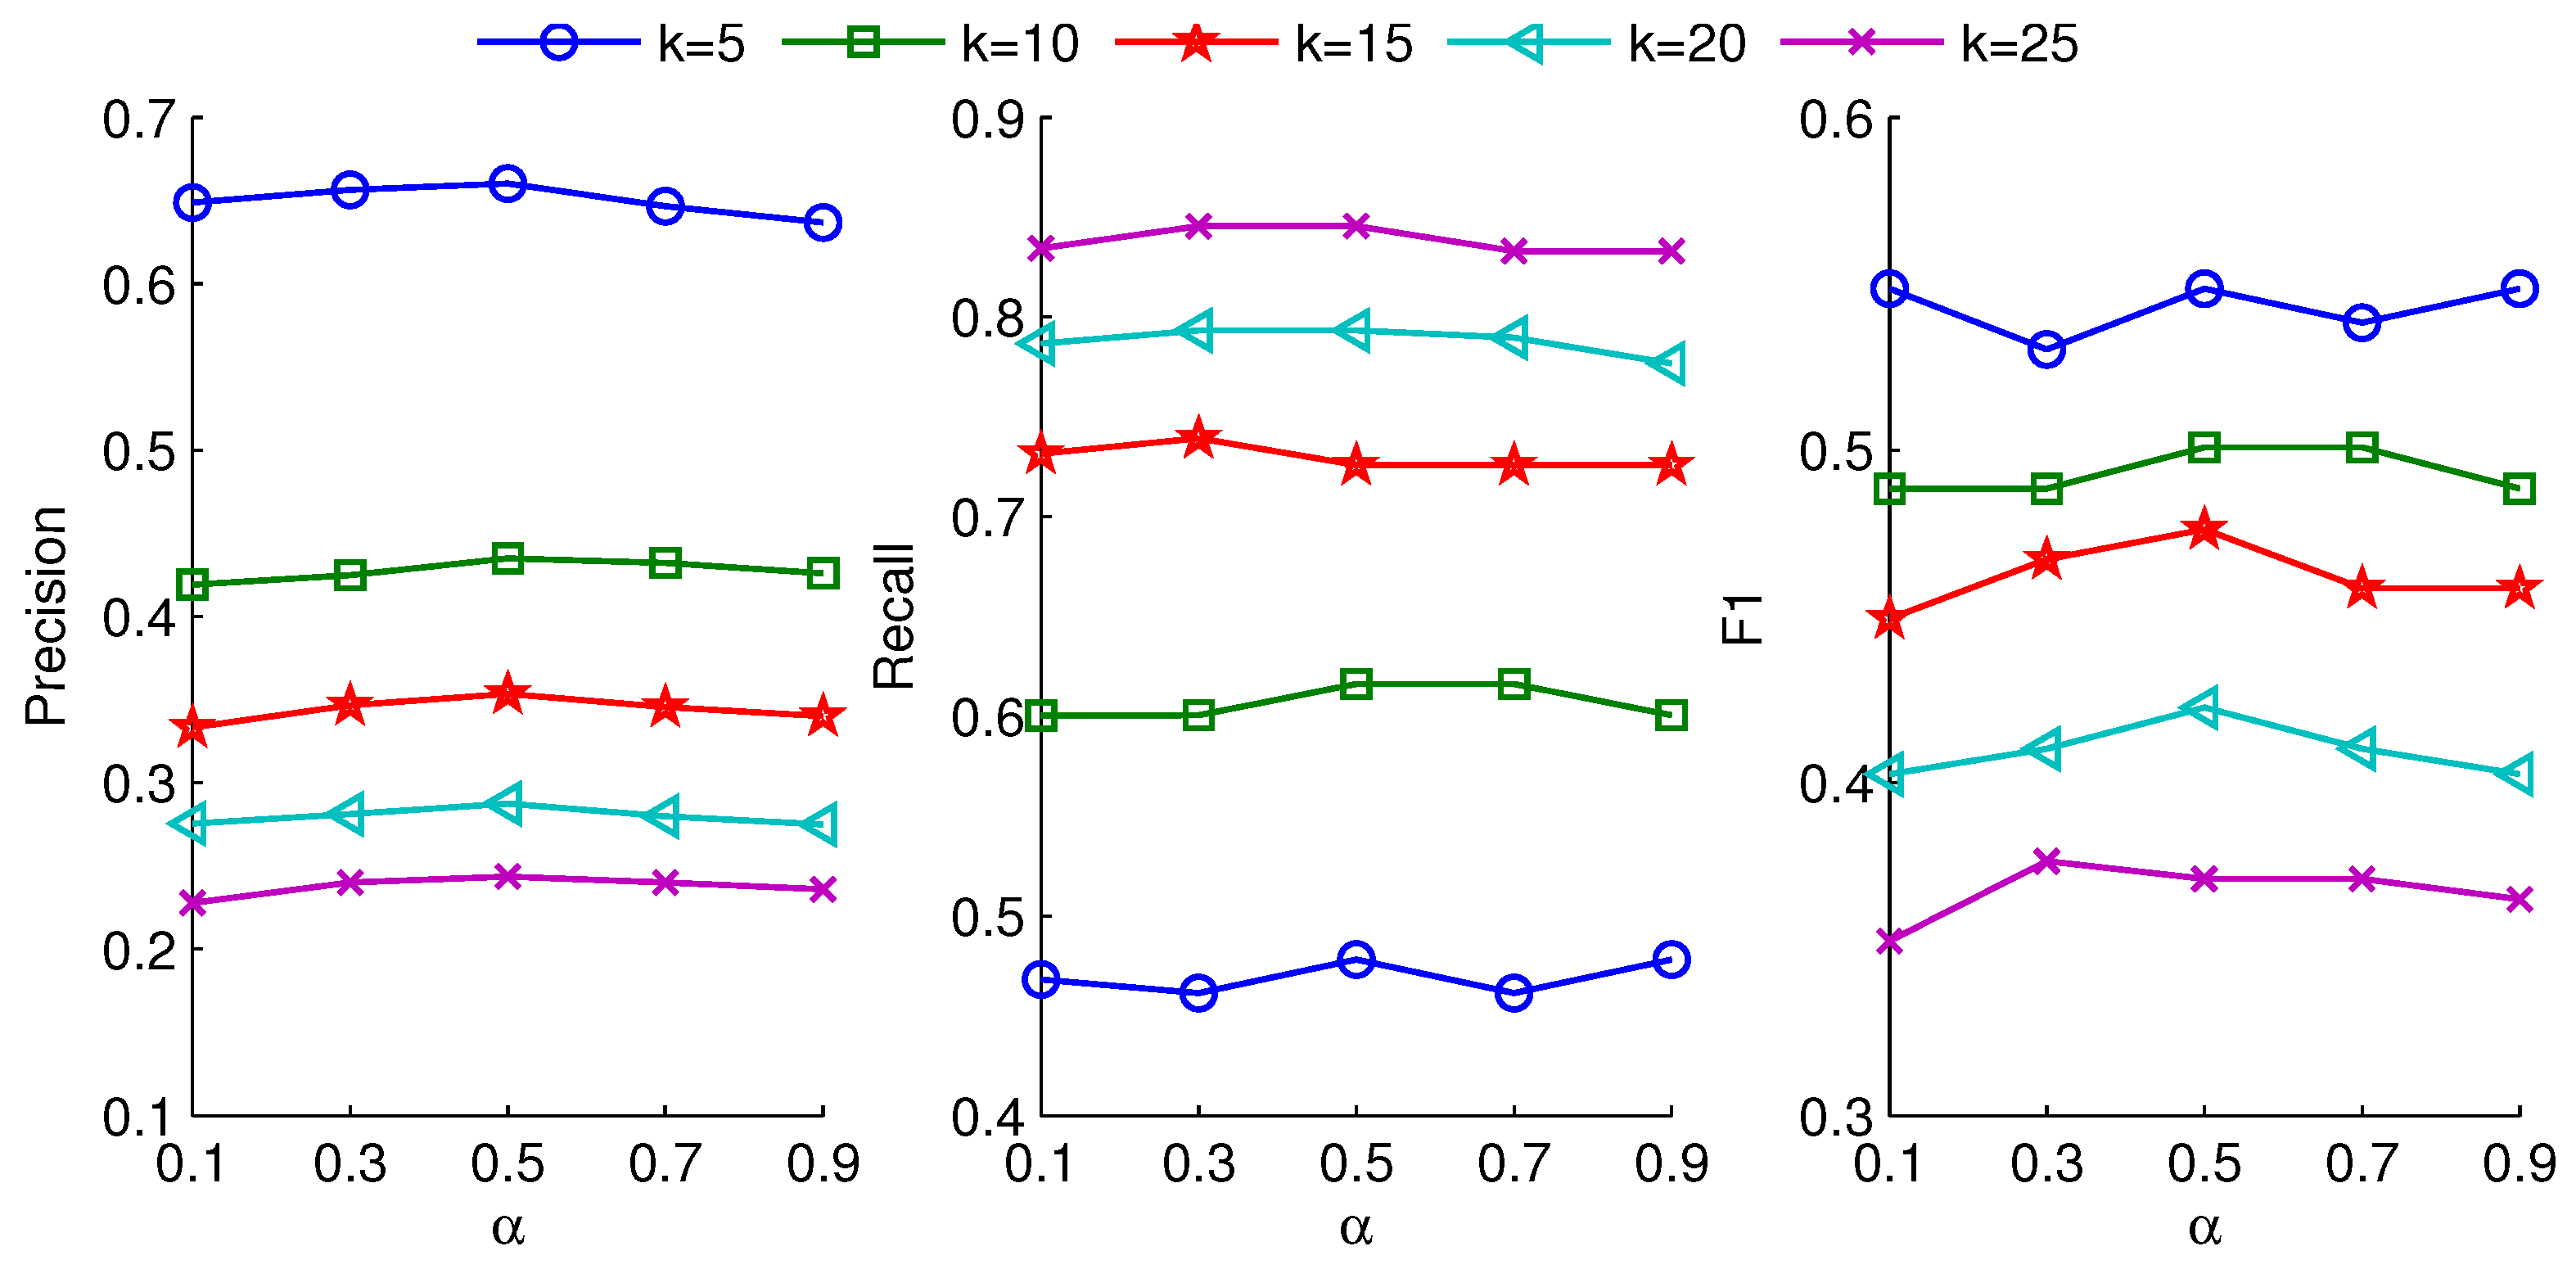
For the influence of social similarity, the value of parameter
can indirectly determine the number of covered neighbors, which induces the change of group.
Figure 6 and
Figure 7 show precision, recall, and F1 at different recommendation lists under different
with fixed radius
r for two datasets. These indicators obtain their maximal values at about
= 0.5 for different recommendation lists. Meanwhile, all the indicators are first increasing and then decreasing as the recommendation list size increases. This indicates that both the content interaction similarity and follow interaction similarity can influence the social similarity. The appropriate similarity can induce the best diverse group, especially when two factors have the same effect, which can generate the appropriate GUP. That is, when
= 0.5, most of recommendations can get relative balance for content interaction and follow interaction factors. Interestingly, the curves vary smoothly when
gradually increases but less than 0.5. Contrarily, when the value of
exceeds 0.5, the curves also change smoothly. This particularly reflects the importance of content interaction and follow interaction in the process of representative group selection.
Similarly, by changing the values of
and
k, the results about NDCG and DIV based on GUP are shown in
Table 4 and
Table 5. In the
dataset, the accuracy indicator (NDCG@20) of GUP first increases and then decreases when the
increases, which reaches its maximal value at
= 0.5. For the novelty indicator DIV@20, a similar phenomenon can be achieved. In addition, we can see that NDCG slowly increases and DIV decreases with the value of
k increasing. That is, based on the GUP, the recommended novel relevant subjects have large interest degree and are highly ranked. Meanwhile, the recommended irrelevant subjects rank lower, which are mostly the original interests of the target user. This observation suggests that the GUP can easily discover novel interests for the target user.
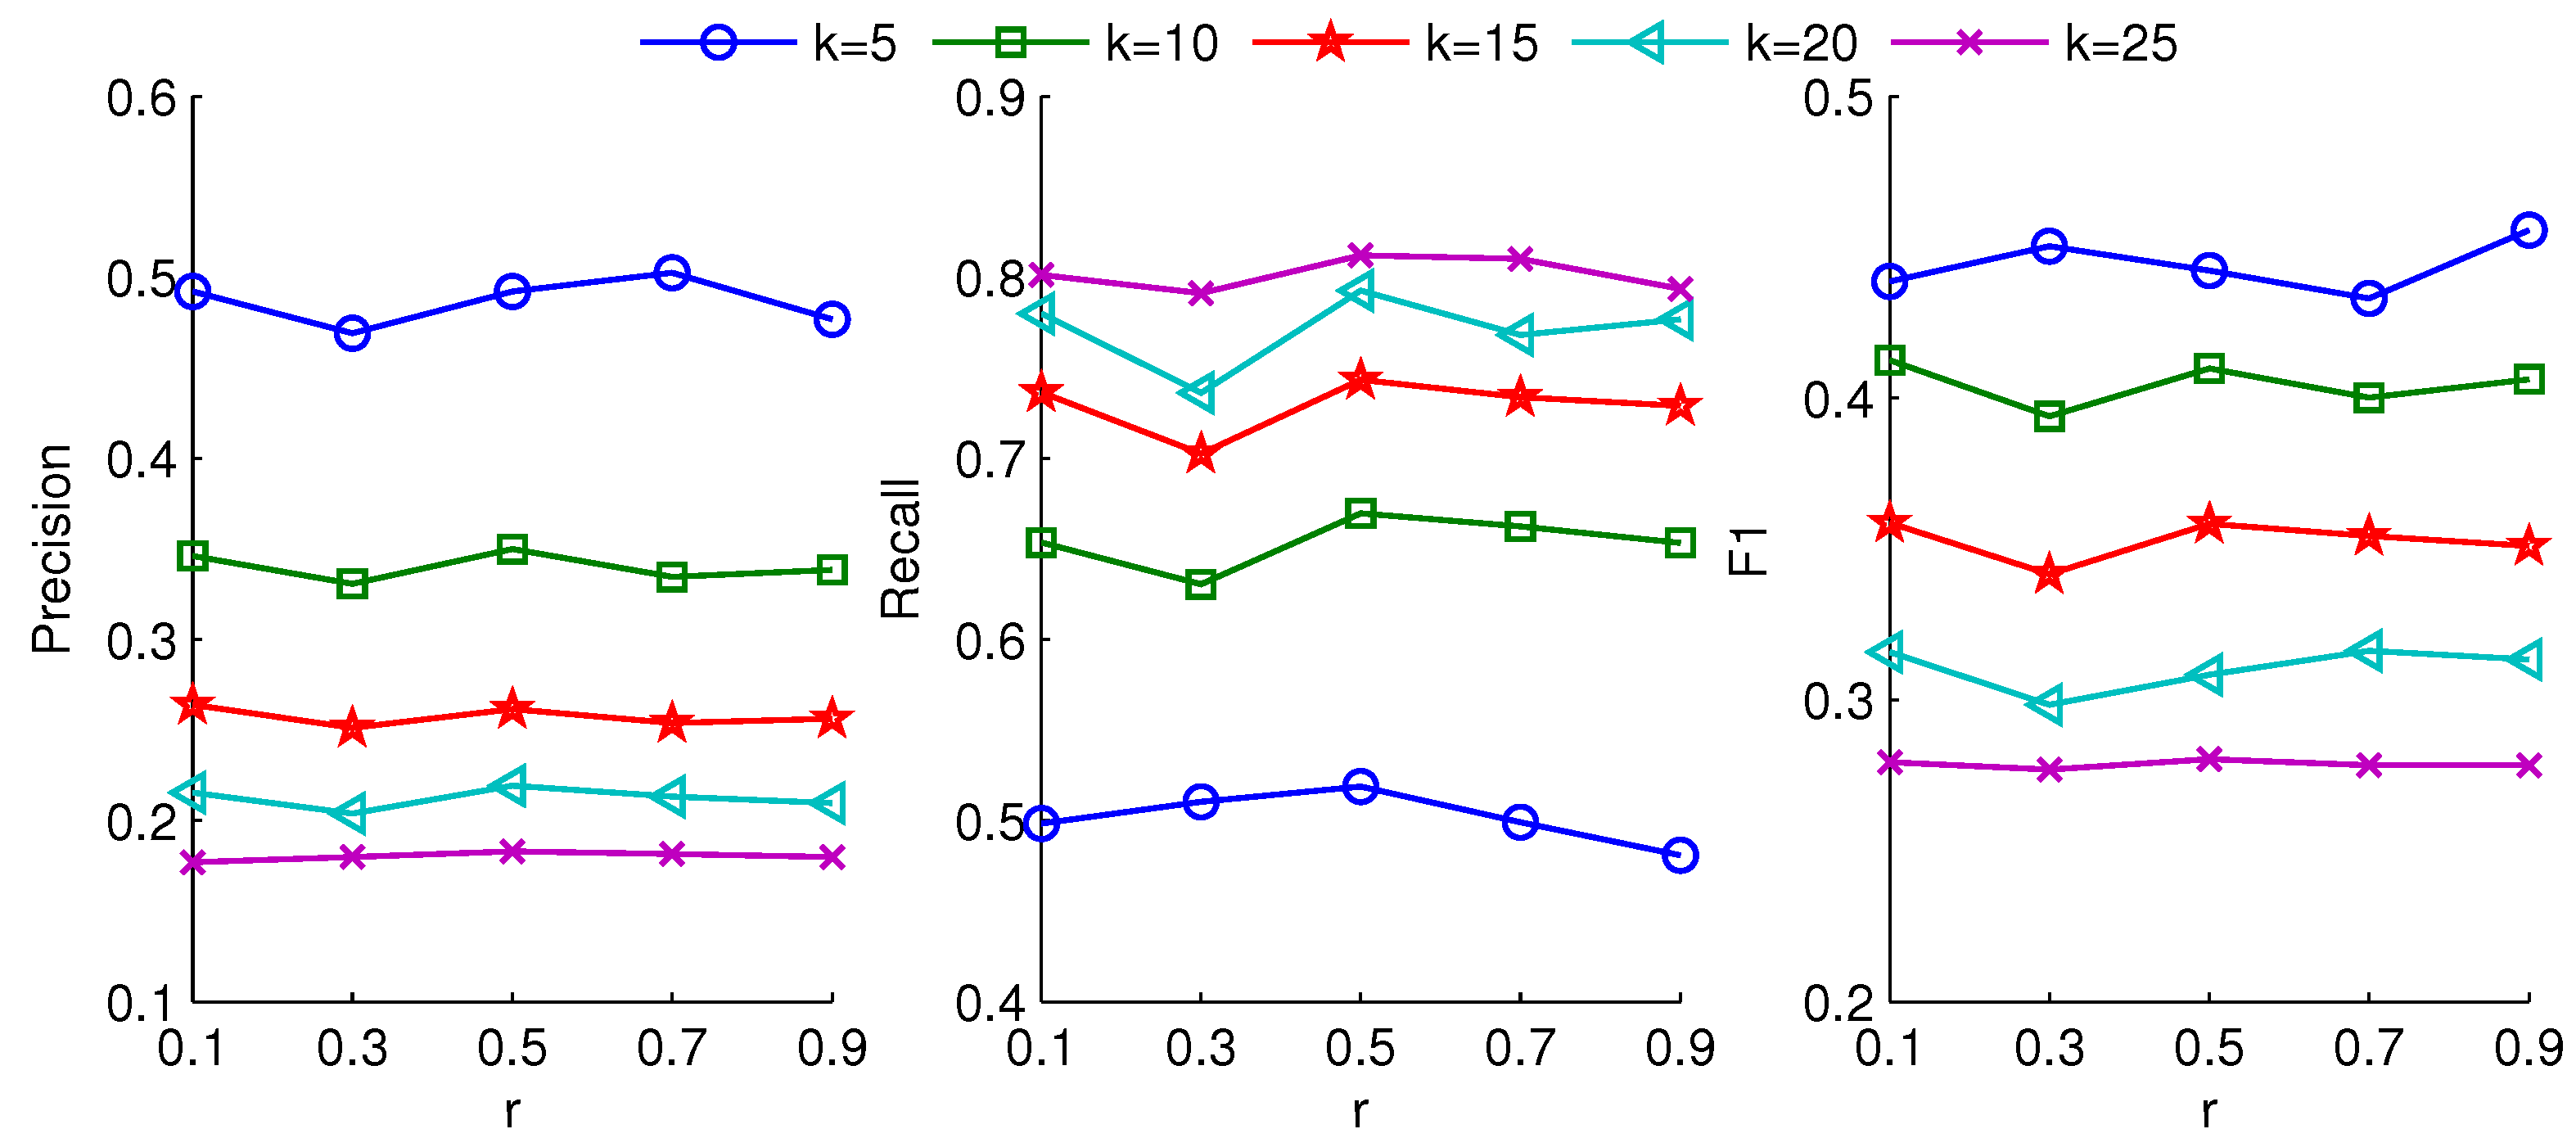
For the GUP modeling, the value of radius
r can also influence the number of group users. Different groups result in different recommendation results. In
Figure 8 and
Figure 9, we show precision, recall and F1 results under different radius settings. From the figures, the better results are obtained at
r = 0.5 and
r = 0.7, respectively. When the radius
r is large, the covered users are more, which can lead to a small representative group. The small group may not provide abundant subjects to expand diverse interests. In contrast, a small radius
r could deduce a larger number of representative users from followees. The superabundant representative users may generate disordered and unsystematic subjects, which are irrelevant to the interest of target user and reduce the quality of recommendations.
Figure 8 and
Figure 9 verify that the appropriate group can achieve high recall and F1 at the optimum value of
r.
To test the accuracy and diversity of GUP method under different radius
r,
Table 6 and
Table 7 show the NDCG and DIV results for GUP under different
k for two datasets. In the
dataset, for each recommendation list size, the GUP performs best when
r = 0.5, which is consistent with the phenomenon of precision. For the
dataset, the radius
r is 0.7. From the results, we can see that the number of group users can affect the number of recommended subjects. The appropriate group can provide rich novel subjects, which may be ranked in the top of the recommendation list, and promote the values of NDCG. Simultaneously, sufficient novel subjects can induce a large DIV. The values of DIV are maximal when
r = 0.5 and
r = 0.7 for two datasets.
6.2.4. Discussions
Based on the above result analysis, we can see that the proposed GUP outperforms other conventional methods, especially for indexes of recall and
, but with a relatively high time complexity. In addition, there are some insights from our observations and analysis for the GUP recommendation. In
Table 2 and
Table 3, the GUP not only can significantly enrich users’ interests, but also keep related interests for the target user. In the process of GUP modeling, the sample group users can cover the whole followees’ set as much as possible semantically. Meanwhile, the number of users in representative group is optimized minimum. Thus, in social networks, for users with many followees, there is a clear benefit that they can get required resources in terms of limited followee friends. Simultaneously, when followees the target user pays attention to changes, we need to select an adjusted group to match followees’ interests. By setting different zoom size of neighborhood radius, we get different diverse group to obtain update interests.
Interestingly, the zoom radius can determine the scale of GUP. A large radius induces a small group, which can generate less additional preferences. On the contrary, a small radius leads a large group, which can expand rich interests for target user. Specially, when the value of radius is 1, the GUP will become original personal UP. Indeed, GUP provides a new diverse insight, which can maximize the profit in micro-blog advertisements, marketing, and recommender systems and visitors’ quality of experience with small human resource cost.


