Article

H3 Isochrones in the Context of the 15-Minute City

by
Anca Ene
1,
Ana-Cornelia Badea
1,*,
Gheorghe Badea
1,*,
Anca-Patricia Grădinaru
1 and
Cezar Alexandru Vlăduț
2
1
Faculty of Geodesy, Technical University of Civil Engineering Bucharest, 020396 Bucharest, Romania
2
Technical University of Civil Engineering Bucharest, 020396 Bucharest, Romania
*
Authors to whom correspondence should be addressed.
Land 2026, 15(9), 1728; https://doi.org/10.3390/land15091728
Submission received: 3 August 2026 / Revised: 11 September 2026 / Accepted: 14 September 2026 / Published: 16 September 2026
(This article belongs to the Special Issue Urban Planning for a Sustainable Future)

Abstract

The 15-minute city concept has emerged as a framework for promoting more sustainable, inclusive, and accessible urban environments by enabling residents to reach essential daily services within a short distance from their homes. This study evaluates potential spatial accessibility to mapped points of interest in the Berceni neighbourhood, a socialist-era residential district in southern Bucharest, Romania. Walking isochrones were generated through network analysis and subsequently indexed and aggregated using the H3 hierarchical spatial system at resolution 10. Accessibility was assessed for seven social functions using three weighting specifications: 1:1:1, 3:2:1, and 5:3:1. The final analysis included 520 mapped POIs and 8465 H3 resolution 10 cells. The results reveal broadly consistent spatial patterns across the three weighting specifications, although the weighting assumptions influence local scores, the extent of high-accessibility areas, and the relative ranking of individual H3 cells. Caring has the largest mapped opportunity count and broad spatial coverage, whereas working and governing are the least represented functions and display comparatively low potential accessibility in several parts of the neighbourhood. A function-targeted scenario involving the addition of a childcare centre in the south-western part of Berceni produces a local improvement in working accessibility but does not eliminate the wider functional deficit. The findings demonstrate the applicability of combining network-derived isochrones with H3-based spatial aggregation for neighbourhood-scale accessibility assessment.

1. Introduction

Cities are dynamic systems whose spatial structures, functions, and populations continually evolve, requiring urban planning approaches that can respond to changing needs. The 15-minute city model can contribute to several targets established by the United Nations 2030 Agenda for Sustainable Development. Although the concept is most directly associated with SDG 11, which promotes inclusive, safe, resilient, and sustainable cities, it is also relevant to SDG 3 on health and well-being, SDG 4 on education, SDG 8 on decent work and economic growth, and SDG 13 on climate action.
The 15-minute city proposes that residents should be able to reach essential daily services within a short walk or bicycle trip from their homes. The concept has evolved from a planning principle into a measurable policy objective in cities such as Paris [1], Milan [2], Rome [3], and Melbourne [4]. However, the global implementation of 15-minute city initiatives remains geographically uneven. Existing applications are concentrated primarily in Western Europe and North America, particularly in France, the United Kingdom, and the United States, while Central and Eastern European countries, including Poland and Romania, remain less represented [5]. This uneven geographical distribution highlights the need for empirical research beyond the Western European contexts in which the concept has been most frequently developed and tested. Such research is particularly relevant to post-socialist cities, whose inherited functional structures, residential densities, service-distribution models, and subsequent economic transformations differ from those of many Western European cities.
Carlos Moreno’s chrono-urbanism approach defines the 15-minute city through the social functions that a neighbourhood should support locally: living, working, supplying, learning, caring, enjoying, and governing [6,7]. Translating this conceptual framework into a measurable spatial indicator requires an accessibility method that can represent travel through the pedestrian network, accommodate different types of amenities, and support consistent fine-scale spatial comparison. Network-based isochrones provide a means of identifying the areas from which amenities can be reached within a specified travel time. However, comparing multiple isochrone-derived accessibility surfaces also requires an appropriate spatial indexing and aggregation framework.
Uber’s H3 hierarchical spatial indexing system offers such a framework [8]. H3 does not generate network accessibility or walking isochrones. Rather, it provides a hierarchical spatial index through which network-derived accessibility values can be aggregated and compared across a common set of approximately equal-area cells. This distinction is important because the pedestrian network and travel time assumptions determine the accessible areas, whereas H3 provides the spatial units used to summarise and compare the resulting values. Previous studies have operationalised the 15-minute city through composite measures such as walkability scores [9,10], 15-minute city indices [11,12], and 15-minute city scores [13]. Nevertheless, the results of such measures remain sensitive to the definition and classification of amenities, the selected travel time threshold, the spatial unit of analysis, the normalisation procedure, and any weighting assumptions applied to the component indicators.
This study integrates network-based walking isochrones with H3 indexing at resolution 10 to evaluate potential spatial accessibility to mapped amenities in Berceni, a large residential neighbourhood in southern Bucharest. Berceni is characterised by high-rise apartment buildings constructed mainly during the 1970s and 1980s, subsequent commercial development, and an uneven contemporary distribution of public and private services. ArcGIS Online (Esri, Redlands, CA, USA) was used to generate 15-minute walking travel areas for the selected points of interest, while H3 cells were used to aggregate and compare the resulting accessibility values. The analysis considers the seven social functions identified in the adopted proximity framework [7] and evaluates three weighting specifications for proximity, intermediate, and central amenities: 1:1:1, 3:2:1, and 5:3:1. The 1:1:1 scheme provides an equal-weight baseline in which all reachable mapped amenities contribute equally, irrespective of their proximity level. The 3:2:1 scheme introduces a linear ordinal weighting that gives greater priority to amenities intended to be available at the proximity level. The 5:3:1 scheme applies a stronger proximity-priority weighting by increasing the relative contribution of in-proximity and intermediate amenities compared with central amenities. Comparing the resulting accessibility surfaces provides a sensitivity assessment of the extent to which the weighting assumptions influence the spatial distribution and relative ranking of H3 cells. The resulting scores should therefore be understood as indicators of potential spatial accessibility to mapped points of interest rather than measures of experienced accessibility, service capacity, service quality, or population exposure.
The research gap addressed by this study lies at the intersection of two issues: First, network-derived accessibility surfaces are frequently reported for entire cities and administrative areas, while less attention has been given to the use of a hierarchical and replicable spatial index for the fine-scale aggregation and comparison of multiple urban functions. Second, post-socialist residential neighbourhoods remain underrepresented in 15-minute city research, although their inherited functional structures and subsequent economic transformations differ from the urban contexts in which the concept has most often been examined. In particular, the original organisation of housing, employment, public services, and commercial activities in post-socialist districts may continue to influence contemporary accessibility patterns, while deindustrialisation, land-use conversion, suburbanisation, and the relocation of economic activities may have subsequently altered those patterns.
Against this background, the study addresses the following research question: How do patterns of potential 15-minute walking accessibility to mapped amenities vary across the seven social functions when network-derived isochrones are aggregated through H3 cells, and how do those patterns change when the proximity hierarchy is incorporated into the accessibility score? The study makes a combined methodological and empirical contribution. Methodologically, it presents a reproducible workflow that integrates pedestrian-network isochrones with H3-based spatial indexing and compares accessibility surfaces generated under the 1:1:1, 3:2:1, and 5:3:1 weighting specifications. H3 is treated as an indexing and aggregation framework rather than as an accessibility-generation method. Empirically, the study evaluates the spatial distribution of the seven social functions in Berceni, thereby extending the application of the 15-minute city framework to a post-socialist residential context. The analysis is further used to assess a function-targeted scenario in which an additional amenity is introduced into an area characterised by comparatively low potential accessibility.
The remainder of the paper is structured as follows: Section 2 reviews the conceptual development of the 15-minute city and the geospatial methods used to assess urban accessibility. Section 3 presents the study area, data, methodological workflow, H3 aggregation procedure, and three weighting specifications. Section 4 reports the accessibility patterns identified for the seven social functions and compares the existing and proposed scenarios. Section 5 discusses the findings in relation to previous accessibility research, and the methodological limitations of the study. Section 6 summarises the principal conclusions and outlines directions for future research.

2. State of the Art

2.1. 15-Minute City Concept

Urban planning must continuously respond to changing demographic, social, economic, and environmental conditions. Within this context, the 15-minute city has emerged as a proximity-based planning model intended to improve access to essential urban services and enhance residents’ quality of life. Moreno describes the concept as being structured around essential human needs, key urban objectives, and four guiding principles: ecology, proximity, solidarity, and participation [14]. The model proposes that residents should be able to access the principal functions of everyday life within approximately 15 min of their homes, preferably by walking or cycling. These functions include living, working, supplying, caring, learning, and enjoying. Density, diversity, digitalisation, and proximity constitute the principal dimensions through which this model can be implemented [14].
The operationalisation of the 15-minute city varies across the literature. Some studies divide the principal social functions into more detailed subcategories and associate them with specific infrastructure, land uses, and activities [12]. Other approaches focus on the accessibility of individual amenities and adopt more detailed classifications. One such framework distinguishes 11 categories: public transport, government services, financial services, healthcare facilities, professional services, education, entertainment, recreational areas, spiritual venues, food services, and retail [15]. These differences indicate that the selection and classification of amenities depend on the conceptual framework, available data, and objectives of each study.
The 15-minute city is frequently contrasted with functionalist planning approaches associated with Le Corbusier, particularly those based on the spatial separation of urban functions [3]. However, this distinction should not be presented as absolute. Although several of Le Corbusier’s projects promoted functional zoning, proposals such as the Plan Voisin and the Unité d’Habitation also sought to integrate housing with selected everyday amenities. The Unité d’Habitation, in particular, explored the vertical concentration of residential and service functions within a high-rise structure. The principal difference concerns the spatial organisation of these functions: whereas the 15-minute city generally promotes their distribution across a walkable neighbourhood, some modernist projects concentrated them vertically within individual buildings or building complexes.
The broader family of X-minute city models forms part of the chrono-urbanism paradigm, which examines the relationship between urban space and the time required to reach essential activities. Chrono-urbanism seeks to coordinate the spatial distribution of amenities with everyday patterns of mobility and time use [16]. Depending on local density, urban morphology, transport infrastructure, and planning objectives, this principle has been operationalised through 5-minute, 10-minute, 15-minute, and 20-minute city models.
The 5-minute city model has been applied in the Nordhavn district of Copenhagen, where planning policies discourage car dependency and seek to provide access to everyday amenities and public transport within a short walking distance [17]. Nordhavn represents a distinctive case because the district is being developed through the transformation of a former harbour area into a mixed-use and sustainability-oriented urban neighbourhood.
A related example is Project H1 in Seoul, designed by UNStudio in collaboration with Hyundai Development Company. The project proposes the regeneration of a former industrial site as a mixed-use neighbourhood integrating residential, commercial, communal, green, and digitally supported functions. Its spatial organisation is informed by the principles of the 10-minute city to reduce the time required to reach everyday services and activities.
The most prominent implementation of the 15-minute city is associated with Paris, where Moreno collaborated with the municipal administration led by Mayor Anne Hidalgo to advance the Ville du quart d’heure model. The approach seeks to reorganise daily urban activities around proximity and active mobility. Its implementation may also contribute to Sustainable Development Goal 11, concerning inclusive, safe, resilient, and sustainable cities, and Sustainable Development Goal 13, concerning climate action [18]. Comparable proximity-based policies have subsequently been adopted or explored in cities including Milan, Melbourne, Stockholm, Ottawa, Bogotá, and Barcelona.
The 20-minute city represents another variation in the X-minute city model [19]. Under this approach, residents should be able to reach everyday necessities within approximately 20 min by walking, cycling, or public transport. Related models include the 30-minute and 40-minute city concepts [20]. Although the selected time threshold differs among these approaches, each seeks to reduce unnecessary travel and improve the spatial relationship between housing, services, employment, and other everyday activities.
The concept has also been extended to high-density urban environments through the Vertical 15-Minute City [21,22]. This model recognises that the horizontal distribution of urban functions may be difficult to achieve in densely built megacities. Mixed-use high-rise buildings can therefore accommodate multiple residential, commercial, educational, recreational, and service functions on different floors. In this configuration, vertical circulation can complement horizontal mobility by reducing the time required to access everyday activities.
Overall, horizontal and vertical X-minute city models are grounded in the principles of chrono-urbanism and share the objective of creating more accessible, sustainable, and liveable urban environments. Rather than constituting a universally applicable spatial formula, the X-minute city should be understood as an adaptable planning framework. Its appropriate temporal threshold, spatial configuration, and combination of amenities depend on neighbourhood morphology, population characteristics, mobility conditions, and local service needs.

2.2. Geospatial Data Analysis

Geospatial analysis is necessary to assess accessibility to essential urban functions within the 15-minute city framework. Such an assessment can be conducted using isochrones generated in a Geographic Information System (GIS).
The term isochrone originates from the Greek words ísos, meaning “equal”, and khrónos, meaning “time”. An isochrone delineates the area that can be reached from a specified origin within a defined travel time threshold. Contemporary isochrones are commonly generated from routable transport networks using mode-specific travel assumptions. Depending on the platform and available data, the calculation may incorporate network topology, travel restrictions, and impedance factors [23]. Real-time information, however, is not a necessary component of the walking isochrones used in the present study.
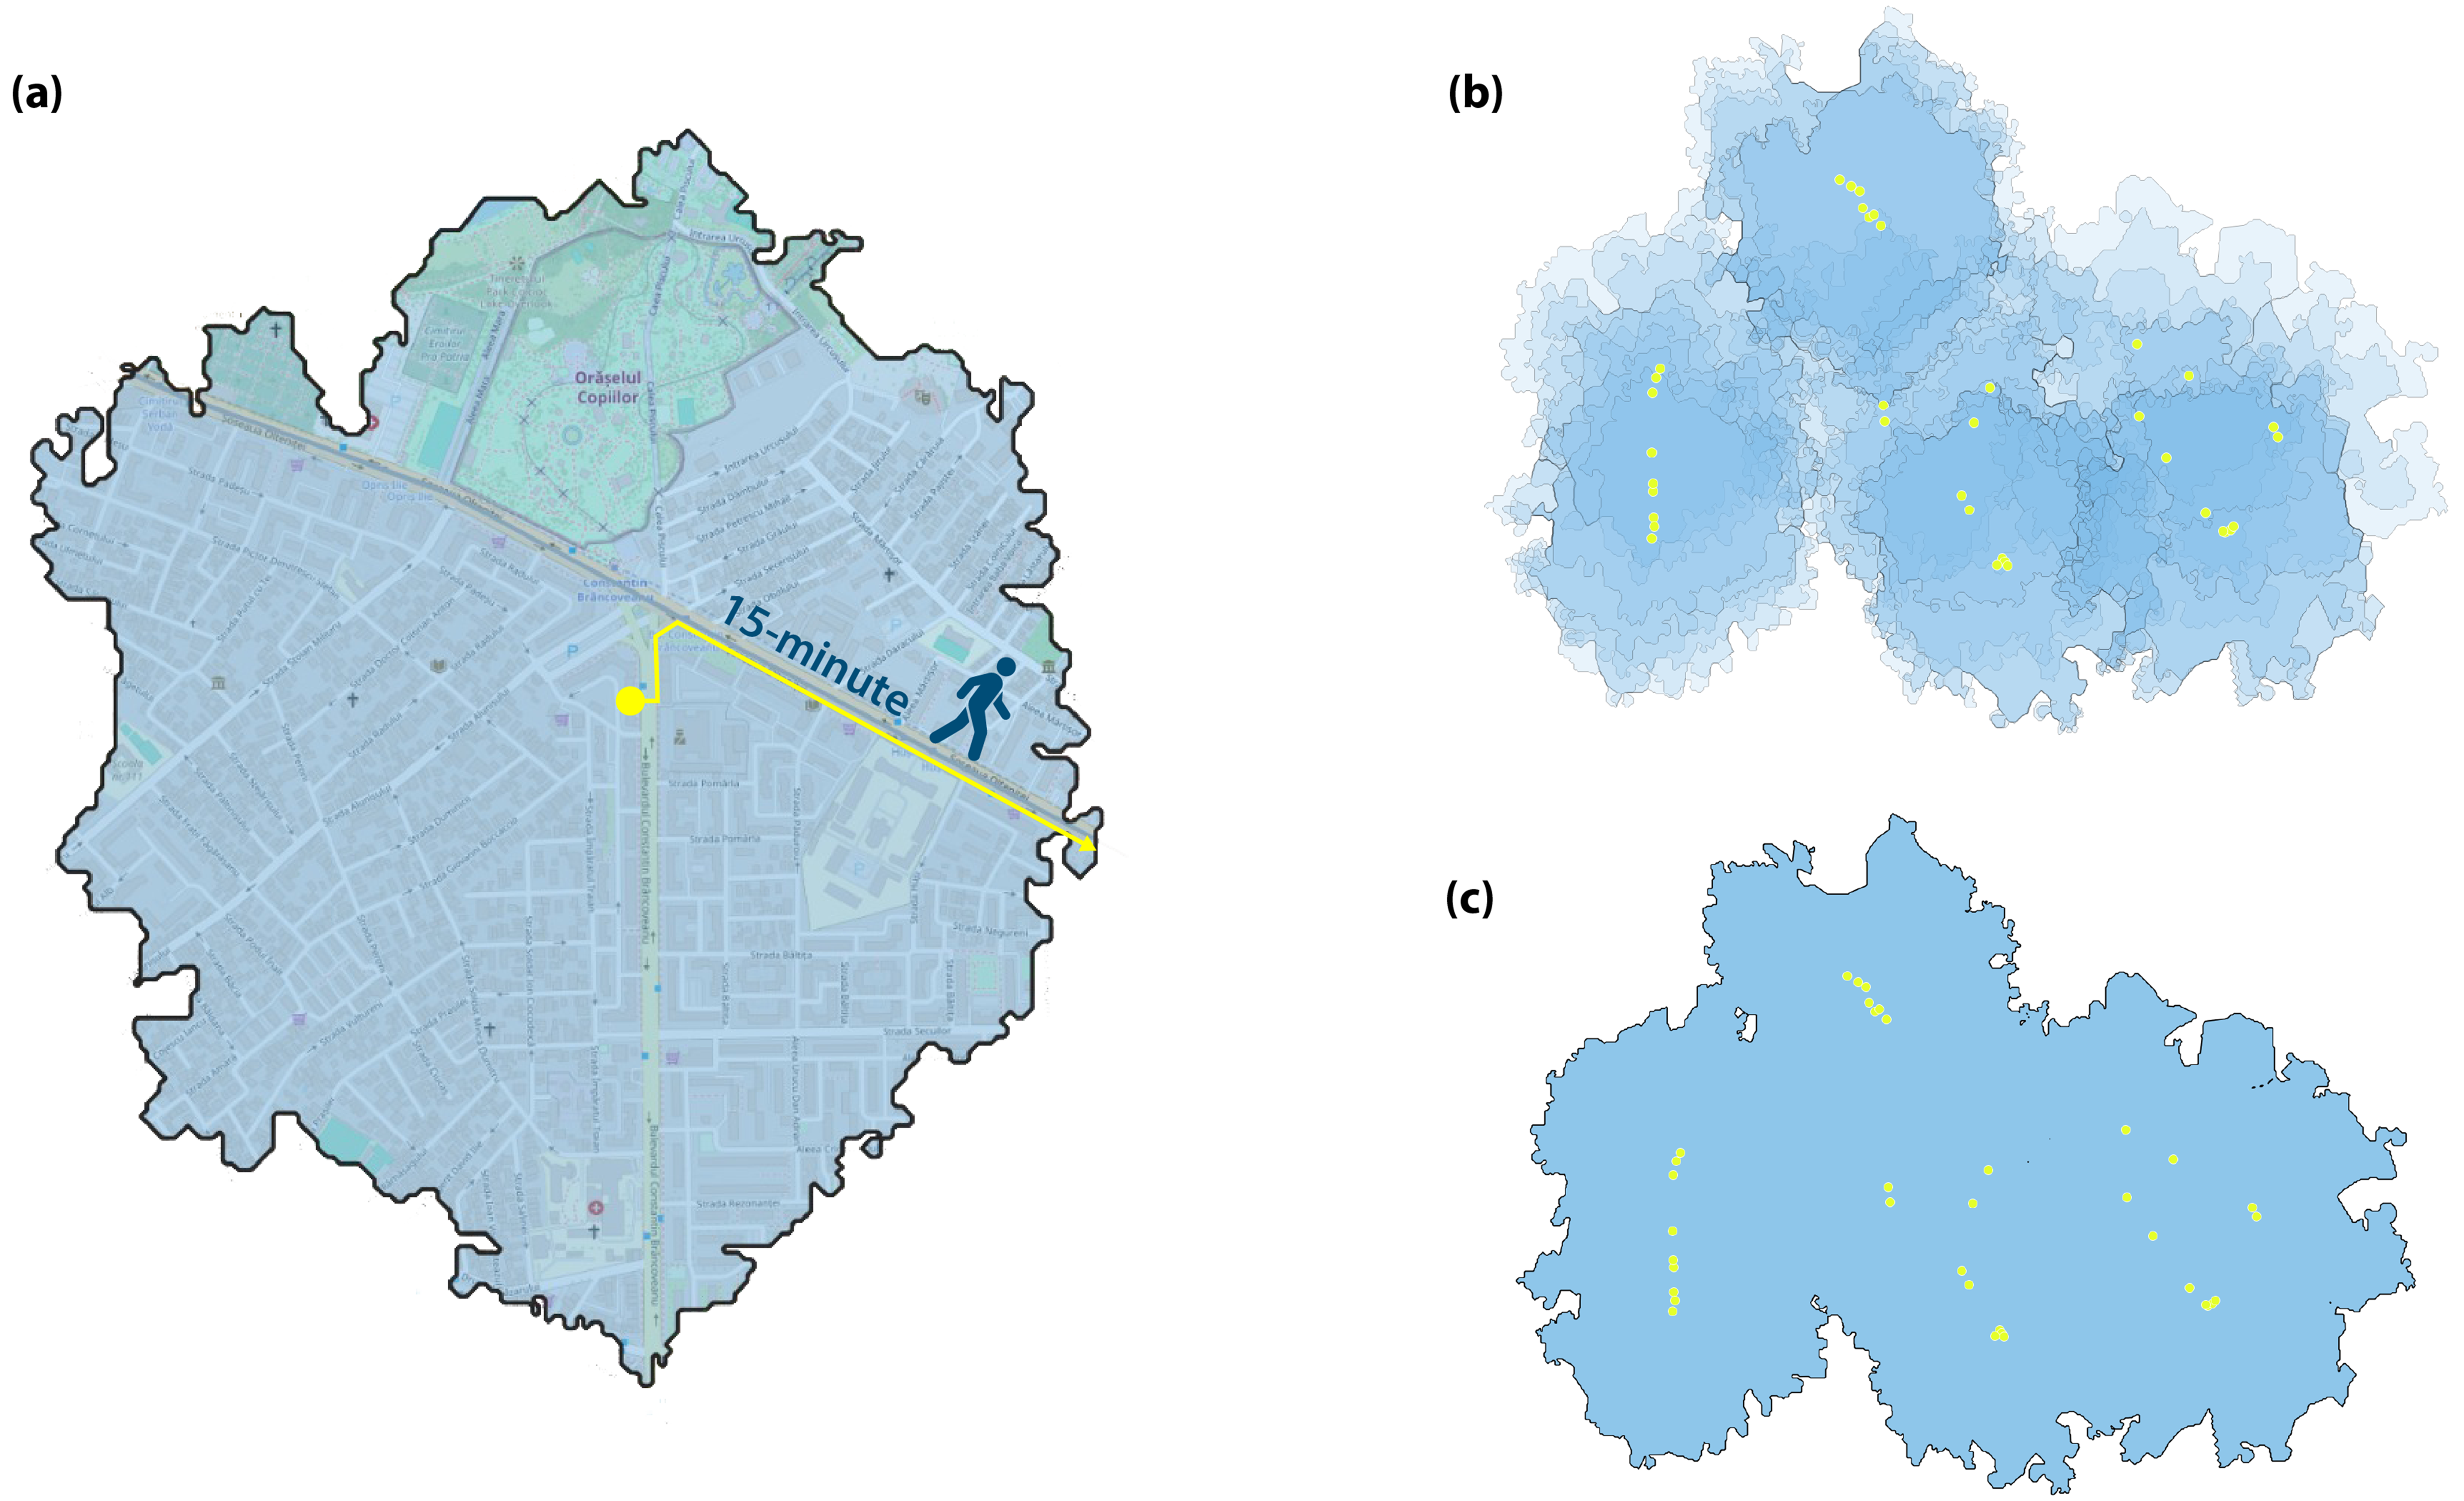
GIS software enables the simultaneous generation of multiple isochrones for travel time analysis and the assessment of accessibility to points of interest (POIs). The isochrones associated with a particular amenity category can subsequently be dissolved into a single polygon representing the area from which at least one amenity of that category is reachable within the specified travel time (Figure 1).
To quantify and compare the accessibility values derived from these isochrones, the resulting spatial information can be aggregated using a GIS tessellation. Tessellation refers to “the process of fitting shapes together in a pattern with no spaces in between” [24]. Depending on the geometry and dimensions of their constituent cells, tessellations may be classified as regular or irregular. Regular tessellations consist of cells with identical geometries, such as equilateral triangles, squares, or regular hexagons, whereas irregular tessellations comprise cells whose shapes and dimensions may vary according to the spatial phenomenon or analytical method used to generate them [25]. The three regular patterns are also known as regular Archimedean tilings, and they feature only one shape [26].
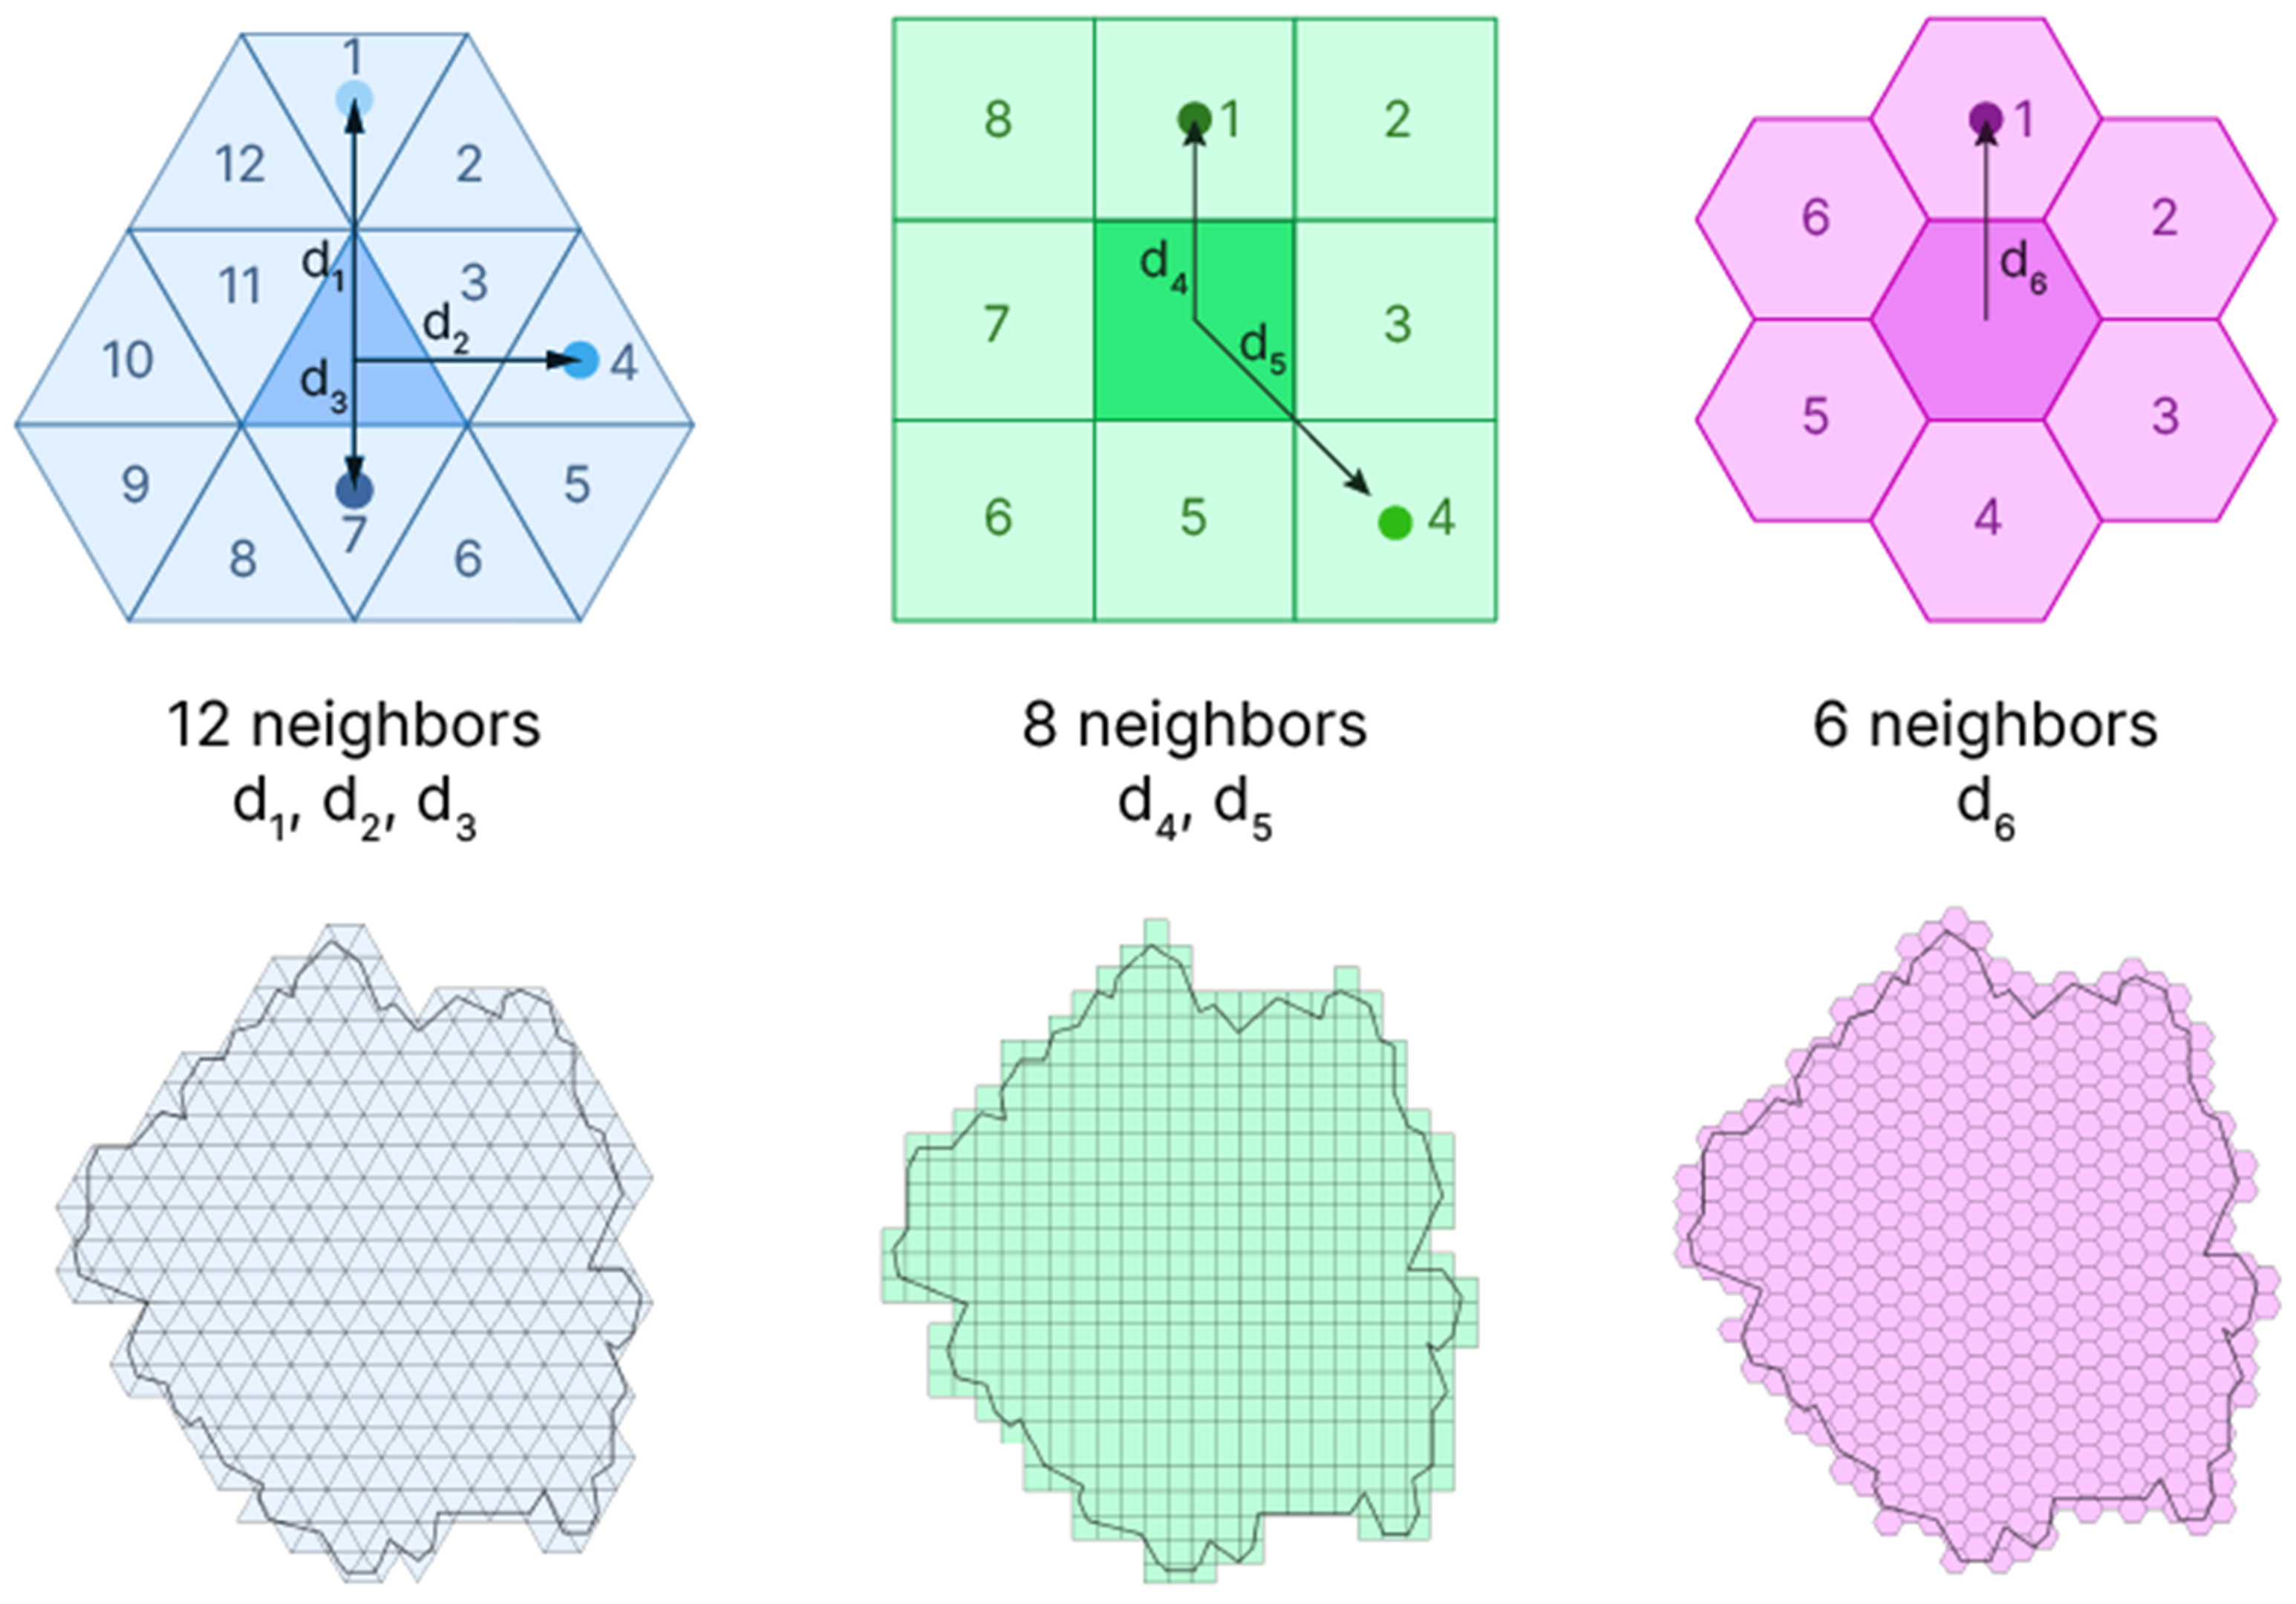
A variety of tessellation types have been incorporated into GIS; however, the most prevalent are tessellations using triangles, squares, and hexagons (Figure 2). Each grid possesses a different set of advantages and disadvantages. Each shape carries distinct implications for spatial analysis, considering accessibility and network-based studies, where distance between cells and adjacency consistency are important factors.
Triangular tessellations provide the highest geometric resolution and the least overlap among the three tessellations, making them the most effective for coverage and connectivity in networks. Triangular tessellations have the advantage of geometric versatility, which makes their geometries easier to adapt around than square or hexagonal tessellations [27]. Nevertheless, triangular tessellations require two orientations in a single grid, and each triangle will have neighbours in two different distance classes. This complicates the process of conducting standardised, distance-based comparisons, which are necessary for the calculation of accessibility scoring. Each triangular cell has twelve neighbours, divided into three types [28].
Square grids remain the main choice of tessellation used in GIS applications and thematic mapping. This is due to three key factors: their simplicity of definition, their alignment with the raster or Cartesian data model, and their long-standing familiarity to analysts. The primary constraint on network and accessibility analysis is that a square cell has eight adjacent neighbours at two different distances. Specifically, four of these cells share an edge, while the remaining four share a corner. This variation in adjacent-cell distance has the potential to create distortions when analysing spatial relationships, unlike hexagonal grids where the distance between the centres of adjacent cells is uniform. Square and triangular grids also have comparatively higher perimeter-to-area ratios than hexagonal grids covering the same area [29].
The hexagonal grid provides an equal distance between the neighbouring cell centroids. Each hexagonal cell has six neighbours, all sharing an edge. The grid’s isotropy is suitable for mapping and spatial analysis for large areas. Given its lower perimeter-to-area ratio and ability to minimize edge effects, the hexagonal grid provides a better visualization of continuous spatial phenomena [30].
While some well-known platforms, such as Google Maps, use square grids, also called fishnets, other platforms, such as Uber (San Francisco, CA, USA), use H3 hexagons. In 2018, Uber released H3, an open-source hierarchical spatial indexing system that can be used with GIS software [31]. The H3 grid is derived from an icosahedron projected onto the spherical surface. Because a spherical surface cannot be tessellated exclusively with regular hexagons, each H3 resolution includes 12 pentagonal cells, corresponding to the 12 vertices of the icosahedron [32]. The H3 system proposes 16 resolutions, numbered 0–15. As the resolution increases, the area of the cells decreases. With each finer resolution, the cells are one-seventh the area of the cells in the coarser resolution [33]. Table 1 details the H3 resolution [34].

3. Materials and Methods

3.1. Study Area

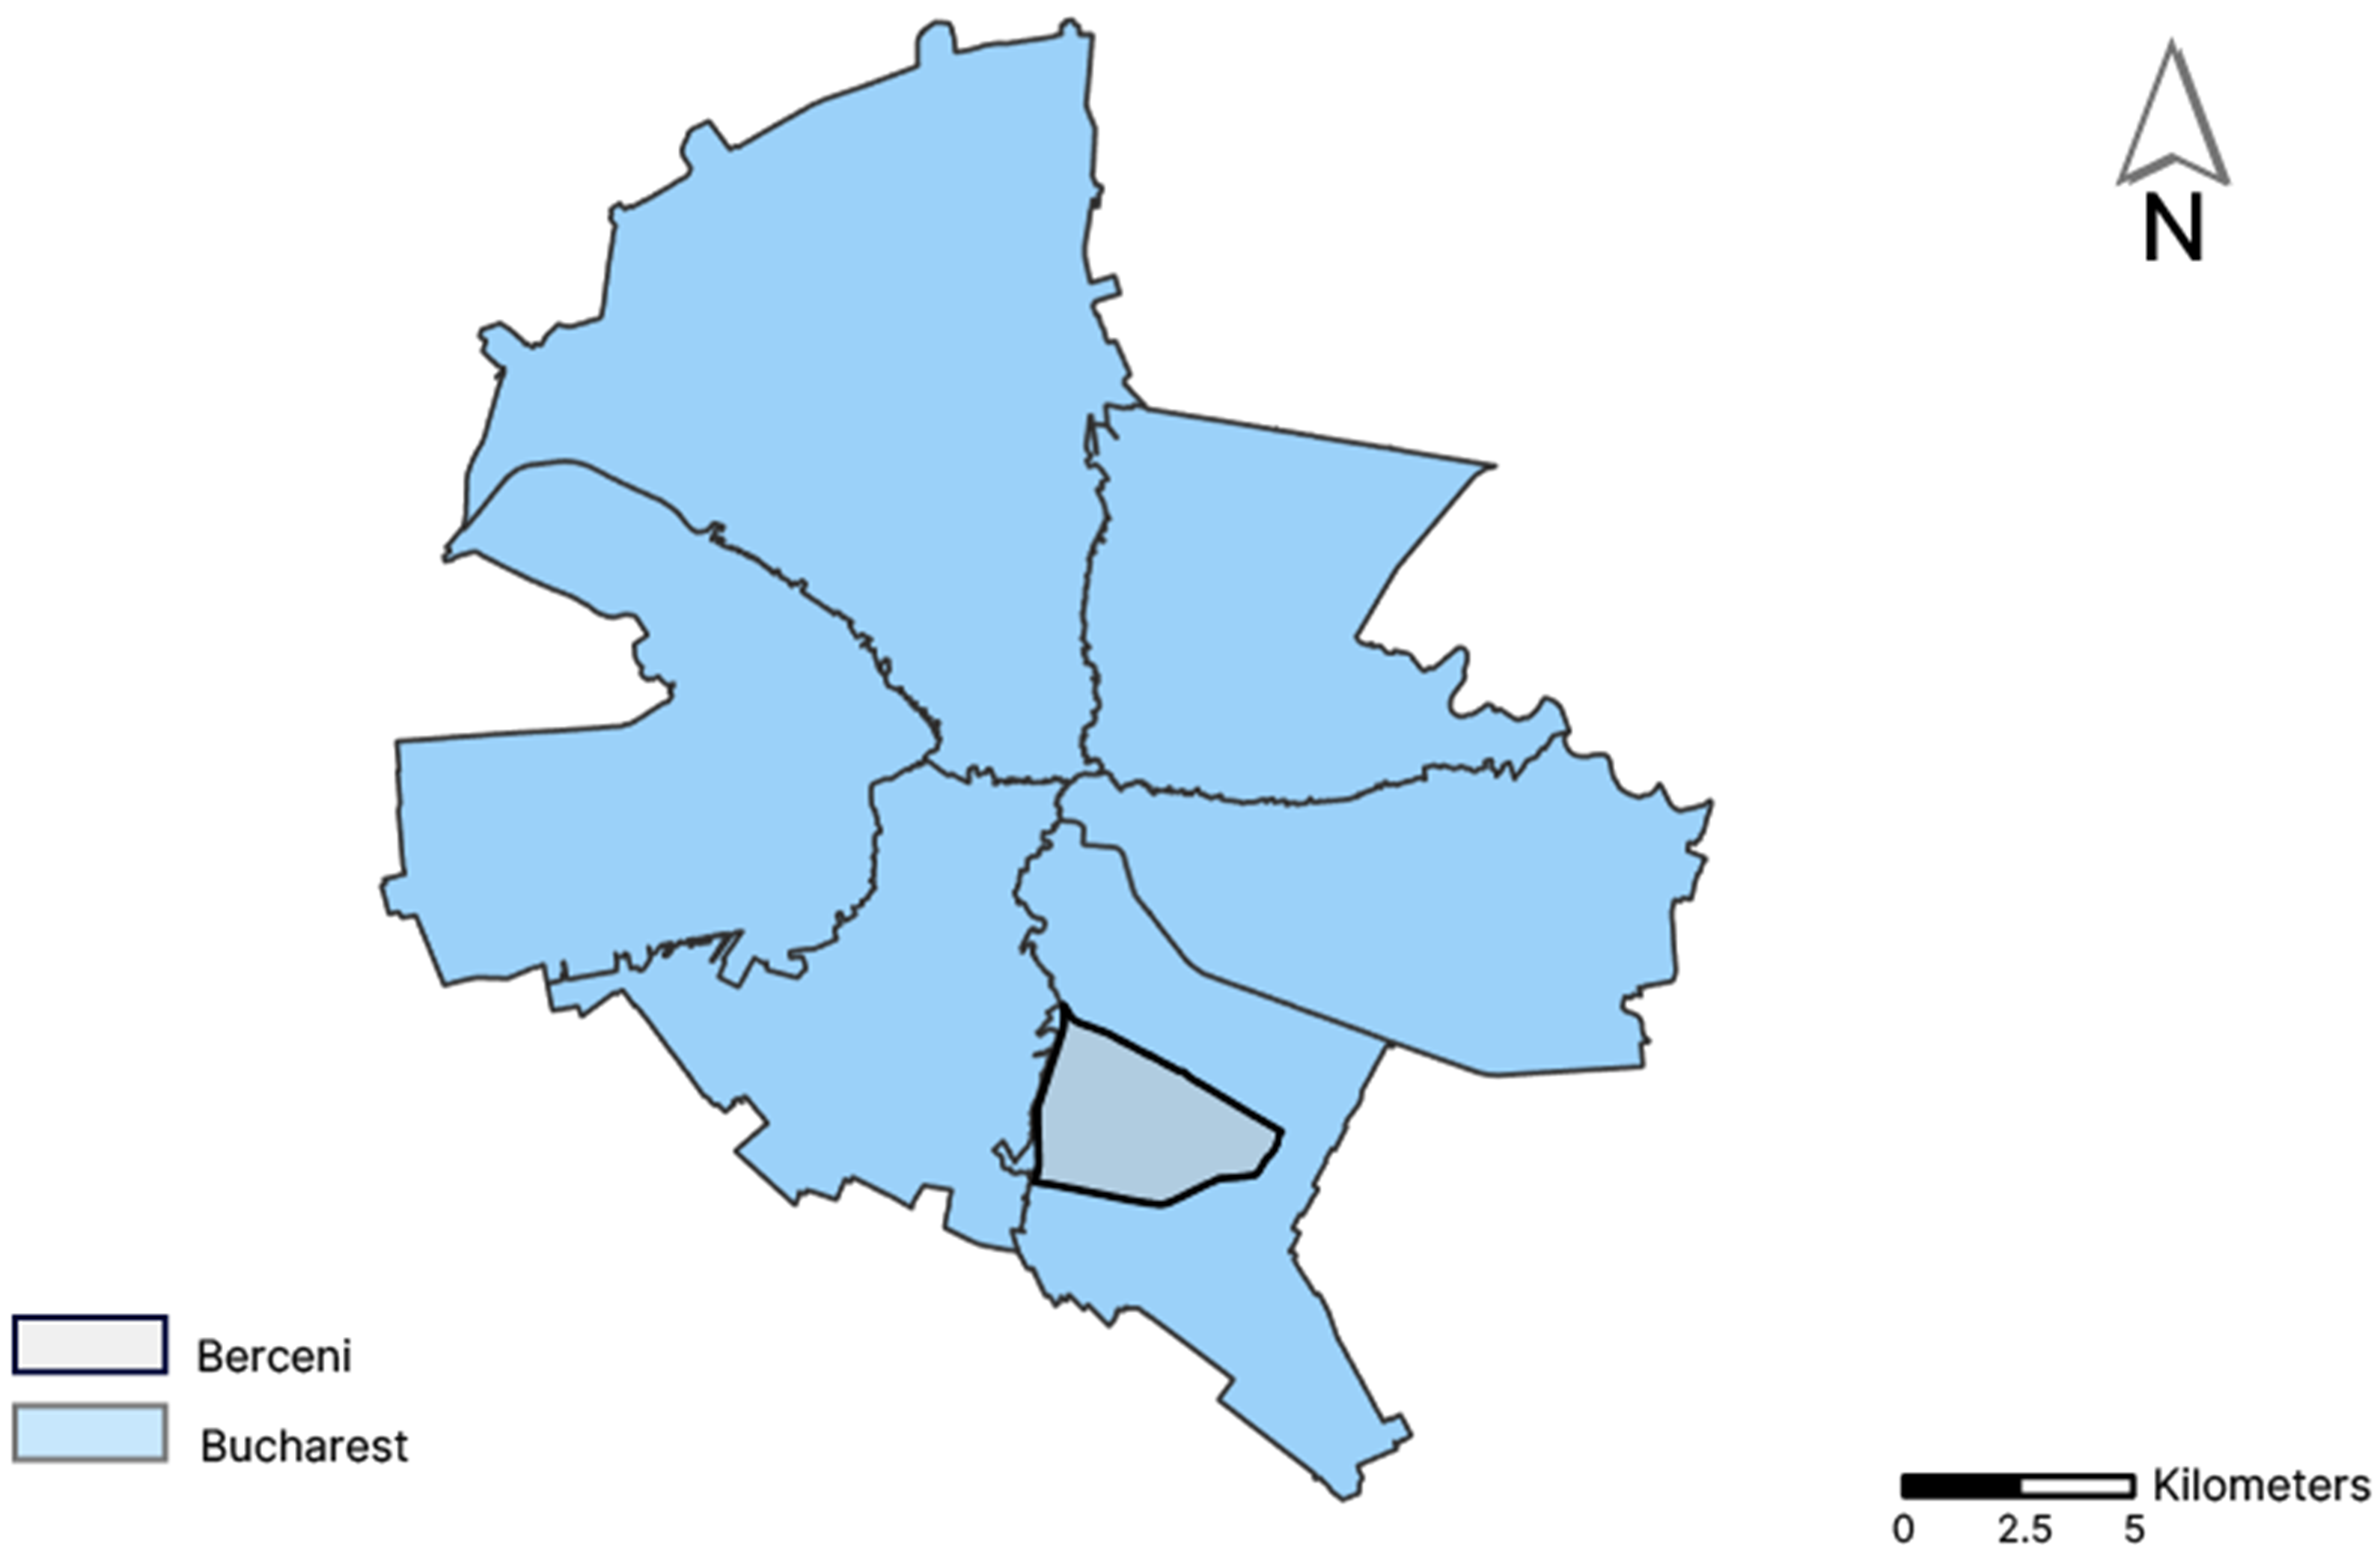
The Berceni neighbourhood is located in Sector 4, in the southern part of Bucharest, Romania (Figure 3). Developed predominantly between the 1960s and the 1980s, the area underwent a substantial transformation from a predominantly rural territory into a large urban residential district. This process was closely associated with the industrialisation and large-scale housing development policies implemented during the socialist period. Berceni is currently one of Bucharest’s largest residential neighbourhoods and is characterised primarily by extensive apartment-block developments. The present study examines Berceni through the analytical framework of the 15-minute city to evaluate potential spatial accessibility to essential daily amenities and to identify the principal strengths and deficiencies in their distribution across the neighbourhood.

3.2. Workflow Overview

Data preparation began with the identification of the social functions and amenity types included in the proximity analysis. The classification of amenities into seven social functions, namely living, working, supplying, learning, caring, enjoying, and governing, was based on the conceptual framework associated with the 15-minute city and on the corresponding three-level hierarchy of central, intermediate, and proximity amenities developed under the supervision of Carlos Moreno [7]. The present study adopts this classification as an analytical framework for evaluating potential spatial accessibility to mapped services. Accordingly, the services included in the analysis were selected by considering their assigned social function, their position within the three-level proximity hierarchy, and the availability of corresponding point-of-interest data in OpenStreetMap. The resulting selection is presented in Table 2.
The proximity analysis was implemented through a four-phase workflow comprising: (1) POI extraction and geometry standardisation; (2) generation of network-based 15-minute walking travel areas; (3) aggregation of the isochrone-derived information using the H3 spatial index; and (4) calculation and comparison of the accessibility scores under the 1:1:1, 3:2:1, and 5:3:1 weighting specifications. ArcGIS Online was used to generate the pedestrian-network travel areas, whereas ArcGIS Pro and H3 were used to assign, aggregate, and compare the resulting accessibility values. H3 therefore functions as a spatial indexing and reporting framework rather than as the generator of network accessibility.
Phase 1: Data collection and preparation: The points of interest (POIs) were extracted from OpenStreetMap (OSM) on 9 June 2026 using QGIS version 3.44.3 (QGIS Development Team, Open Source Geospatial Foundation) and the QuickOSM plugin. Queries used the keys: amenity, craft, shop, office, leisure, railway, and highway. Point and polygon representations were reviewed to identify duplicate representations of the same facility. After duplicate removal, polygons were converted to centroid points and merged with the original point features to create one standardised layer for each amenity type. This procedure produced a standardised POI dataset for the generation of network-based walking isochrones.
At the time of extraction, no corresponding POIs were identified for several proximity-level amenity types assigned to the living, working, and supplying functions. Two explanations are possible: the relevant services may not have been mapped or appropriately tagged in OSM, or they may not have been present within the study area. The absence of a POI from the extracted dataset should therefore not be interpreted automatically as evidence that the corresponding service does not exist in Berceni.
Phase 2: Generation of isochrones and 15-minute walking travel areas: Network-based isochrones were used to represent the areas from which the selected POIs could be reached within a specified walking time. Because the neighbourhood-scale analysis required the batch generation of a large number of travel areas, ArcGIS Online was selected as the routing environment.
Several alternative platforms were considered. AI-assisted applications, such as Aino’s 15mincity.ai, can facilitate preliminary urban accessibility and site-feasibility assessments for users without advanced GIS expertise. Depending on their functionality, such platforms may support travel time calculations, buffer delineation, population-density assessment, and land-use classification. An open-source workflow combining QGIS with a third-party routing service, such as the TravelTime API, was also considered. However, third-party APIs commonly restrict the number of requests available without a paid subscription. Given the volume of isochrones required for the present analysis, these restrictions would have constrained the workflow.
ArcGIS Online was therefore selected because of its batch-processing capacity and its compatibility with the subsequent H3 aggregation and scoring procedures conducted in ArcGIS Pro. This choice facilitated the processing of the required number of POIs, although it introduced a dependency on proprietary, licensed software rather than a fully open-source workflow.
A 15-minute walking travel area was generated for each selected POI using the pedestrian network available in ArcGIS Online. The network analysis considered streets and paths that permit pedestrian movement and applied a uniform walking speed of 5 km/h [35]. The resulting isochrones represent a standardised analytical scenario rather than the walking conditions experienced by all population groups. Older adults, young children, caregivers, and people with mobility limitations may travel shorter network distances within the same 15-minute interval. The resulting travel areas should therefore be interpreted as measures of potential network accessibility under a reference walking-speed assumption.
Phase 3: Geospatial aggregation: The WGS 84 geographic coordinate system (EPSG:4326) was used for the H3 cells and all spatial datasets involved in the overlay operations, as it constitutes the native coordinate reference system of H3. The geospatial aggregation of the 15-minute walking travel areas with the H3 spatial index was performed in ArcGIS Pro version 3.6.3 (Esri, Redlands, CA, USA). The individual isochrones associated with each amenity type were dissolved into a single polygon representing the area from which at least one mapped amenity of that type could be reached within 15 min. This operation provided category-specific walking-coverage surfaces for subsequent H3 aggregation.
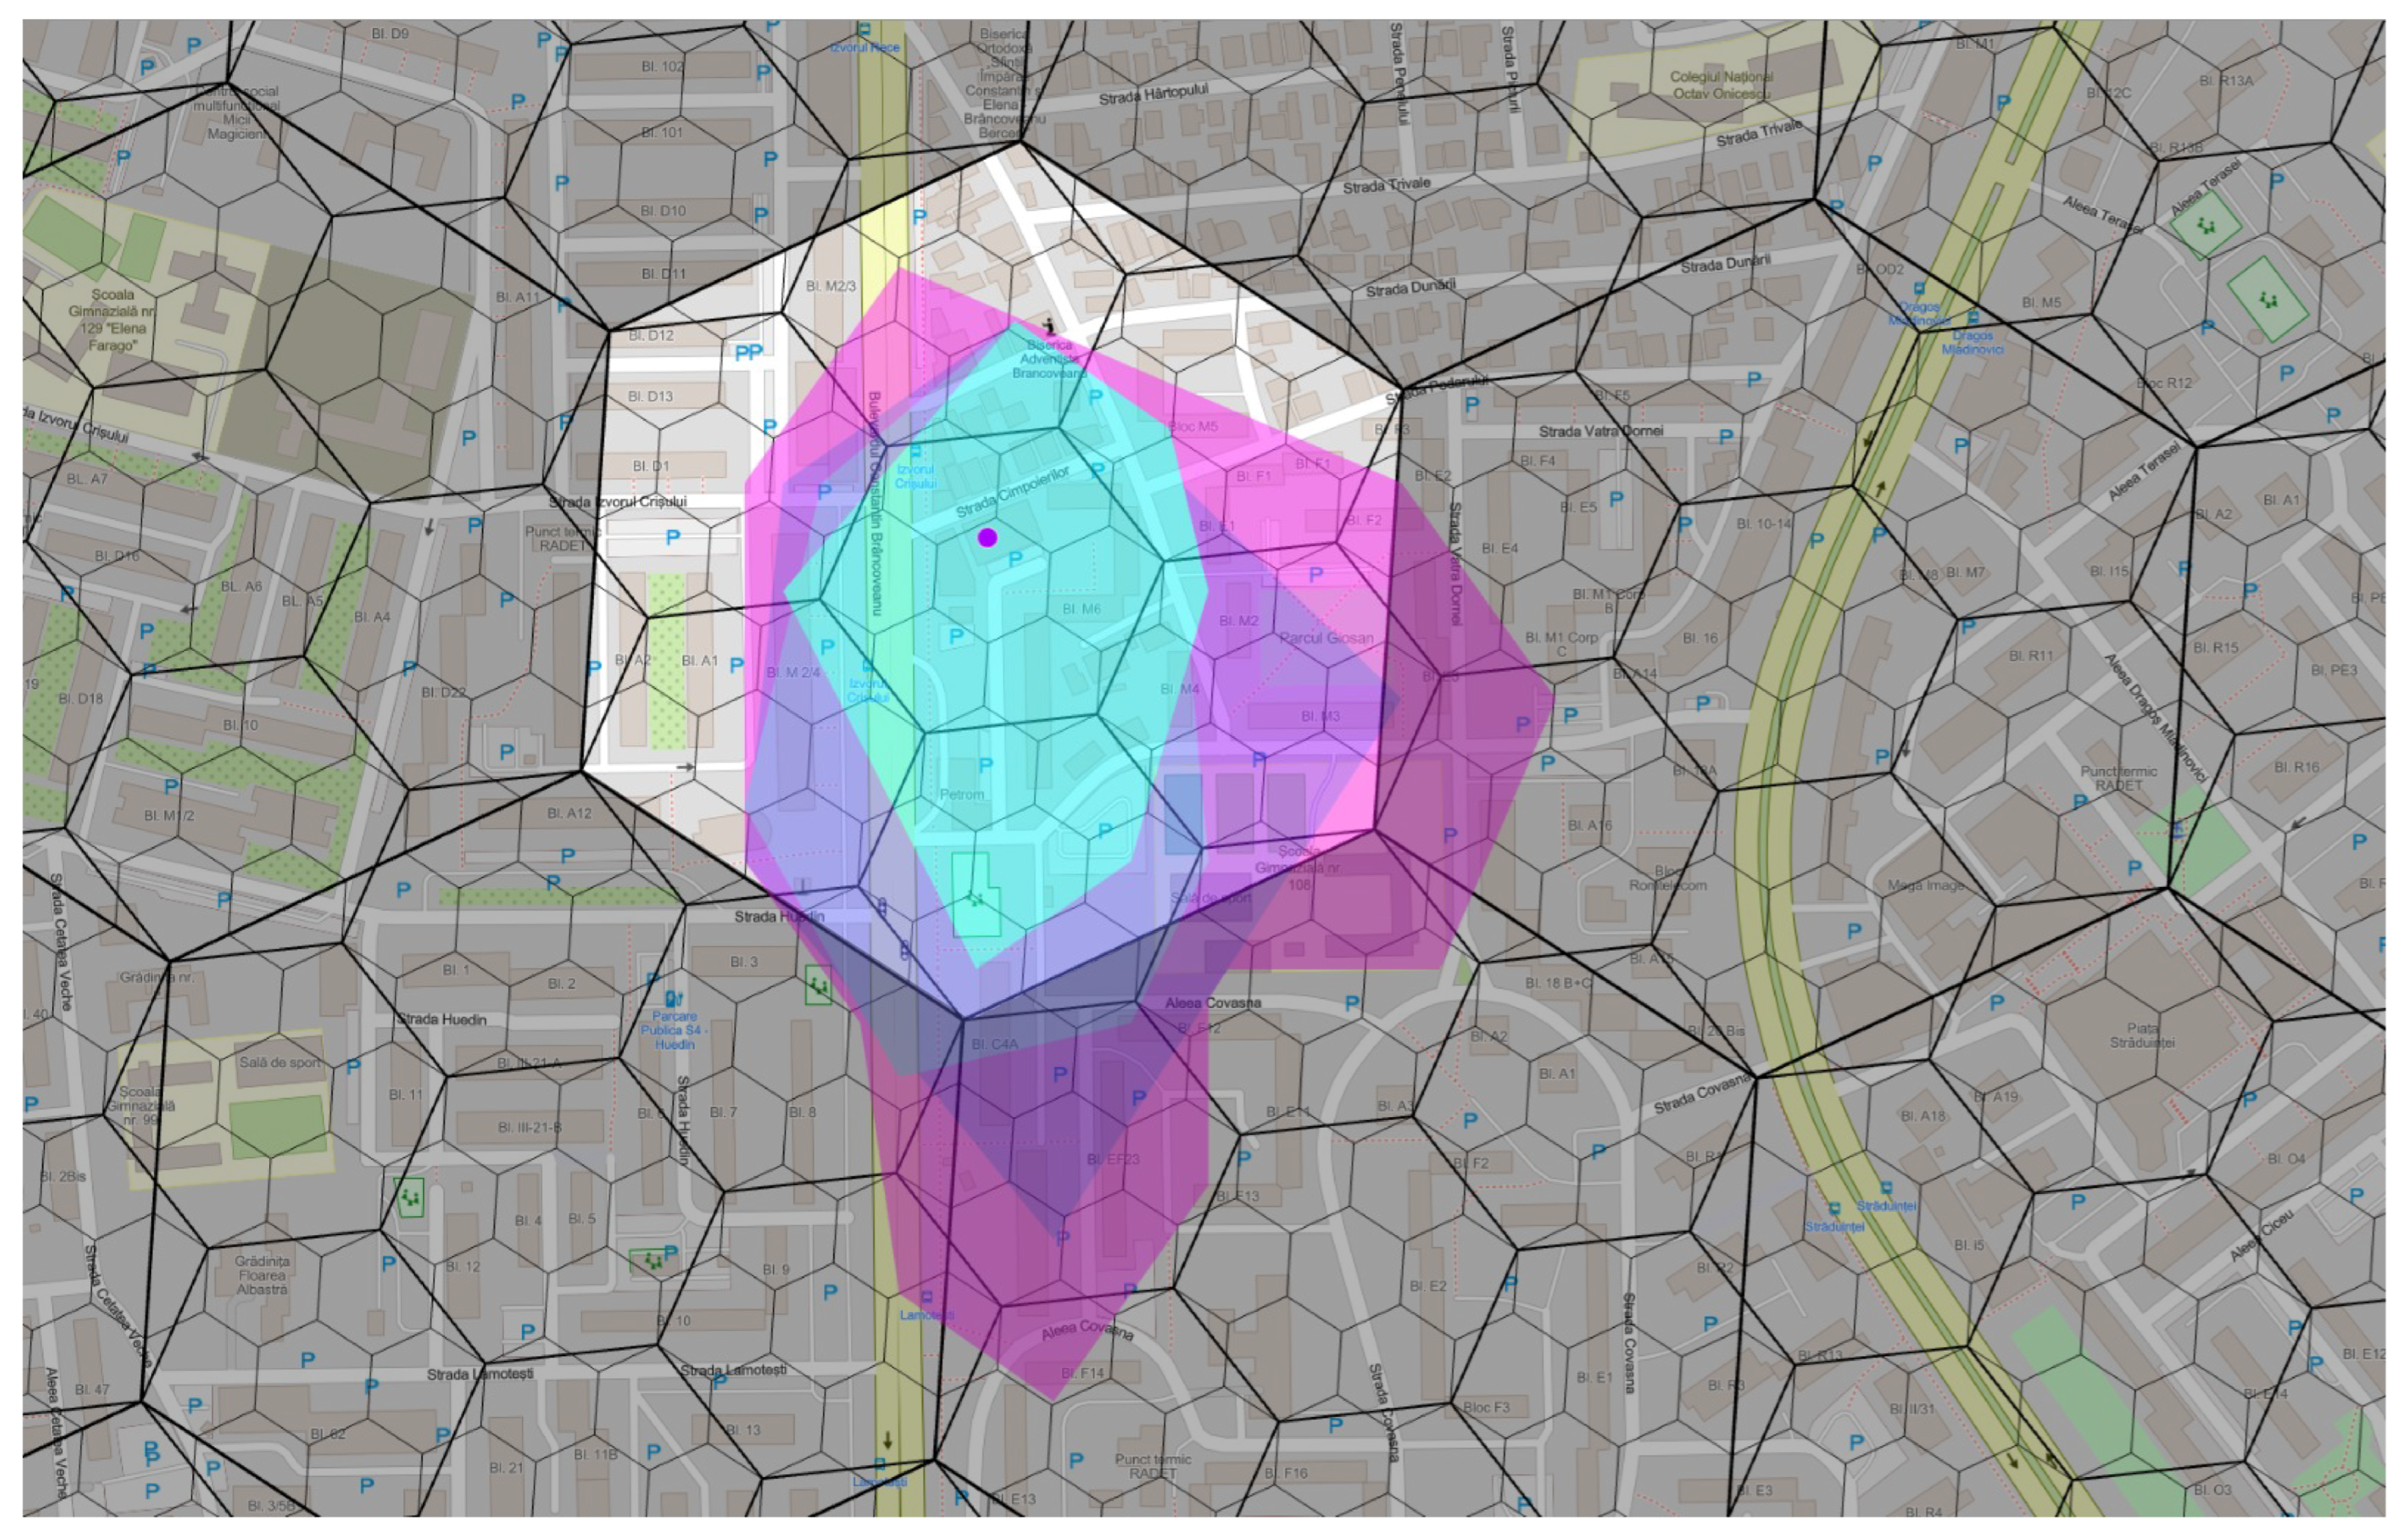
A comparative assessment of H3 resolutions 9, 10, and 11 was conducted to select an appropriate spatial aggregation unit for the study area (Figure 4). The comparison considered the relationship between cell dimensions, pedestrian travel time, the spatial scale of the analysed urban functions, and the degree of local detail retained by each resolution. H3 resolution 9 was considered too coarse because an individual cell could require approximately 3 to 4 min to cross on foot, potentially obscuring variations among residential block clusters. By contrast, resolution 11 has an average cell area of approximately 2150 m2 and was considered excessively fine in relation to the spatial extent of several urban functions included in the analysis. Its use would also have increased the fragmentation of the resulting accessibility surfaces.
H3 resolution 10 was therefore selected as an operational compromise between the loss of local spatial variation associated with resolution 9 and the increased fragmentation associated with resolution 11. With an average cell area of approximately 1.5 hectares, resolution 10 provides sufficient detail to identify variations within the neighbourhood while maintaining an interpretable spatial aggregation structure. The comparison among resolutions 9, 10, and 11 was intended to support the selection of the analytical unit and should not be interpreted as a statistical sensitivity test of the accessibility results across multiple resolutions.
The geospatial processing procedure consisted of intersecting the dissolved 15-minute walking areas with the H3 resolution 10 grid, followed by spatial joins between the H3 cells and the individual isochrones generated for each service. The procedure was repeated for all amenity types presented in Table 2. The resulting attributes indicate which mapped amenities are potentially reachable from each H3 cell within the adopted 15-minute walking scenario and provide the input data for the subsequent function-level accessibility scoring.
The accessibility data were subsequently aggregated for each social function by summarising, for every H3 cell, the number of mapped services reachable within a 15-minute walking distance. This procedure generated a function-specific H3 accessibility surface for each of the seven social functions. The resulting function-level datasets were then integrated to produce an overall assessment of potential spatial accessibility across the Berceni neighbourhood within the 15-minute city framework. Table 3 reports, for each amenity type, the number of mapped POIs and the number of H3 cells located within the corresponding 15-minute walking coverage area. It also presents the number of H3 cells reached for each social function after the spatial aggregation of its respective amenity categories. The final analytical surface comprised 8465 unique H3 resolution 10 cells intersecting the unmodified service areas generated from POIs within Berceni.
Phase 4: Proximity analysis. To assess potential spatial accessibility within the Berceni neighbourhood in relation to the 15-minute city framework, the accessibility scores were calculated under three specifications: 1:1:1, 3:2:1, and 5:3:1. All three specifications used the same POI dataset, classification of amenities, pedestrian network, 15-minute travel time threshold, and H3 resolution 10 grid. The specifications differ only in the weights assigned to amenities classified as in proximity, intermediate, or central.
The 1:1:1 specification was used as the equal-weight baseline, under which all reachable amenities contributed equally to the accessibility score, irrespective of their assigned proximity level. The 3:2:1 specification introduced a moderate ordinal prioritisation of amenities intended to be available locally, whereas the 5:3:1 specification assigned a stronger relative priority to in-proximity amenities. The three specifications were compared to assess the sensitivity of the accessibility results to alternative weighting assumptions.
For each H3 cell h, social function f, and weighting specification k, the accessibility score was calculated using Equation (1):
W S h , f ( k )   =   w P ( k ) P h , f   +   w I ( k ) I h , f   +   w C ( k ) C h , f
where
-
W S h , f ( k )  is the accessibility score for H3 cell h, social function f, and weighting specification k;
-
P h , f  is the number of in-proximity amenities belonging to social function f that are reachable from H3 cell h;
-
I h , f  is the number of intermediate amenities belonging to social function f that are reachable from H3 cell h;
-
C h , f  is the number of central amenities belonging to social function f that are reachable from H3 cell h;
-
  w P ( k ) , w I ( k ) , and w C ( k ) are weights assigned to in-proximity, intermediate, and central amenities under weighting specification k.
The weighting vectors applied in the analysis were defined as follows:
w ( 1 )   =   ( 1 ,   1 ,   1 ) ,   w ( 2 )   =   ( 3 ,   2 ,   1 ) ,   w ( 3 )   =   ( 5 ,   3 ,   1 ) .
Accordingly,
-
For k = 1, ( w P ,   w I ,   w C ) = 1 ,   1 ,   1 ;
-
For k = 2, ( w P ,   w I ,   w C ) = 3 ,   2 ,   1 ;
-
For k = 3, ( w P ,   w I ,   w C ) = 5 ,   3 ,   1 .
For each social function and weighting specification, the maximum attainable score within the mapped opportunity dataset was calculated using Equation (3):
W S f , m a x ( k ) =   w P ( k ) P f T o t a l +   w I ( k ) I f T o t a l   +   w C ( k ) C f T o t a l
where
-
W S f , m a x ( k ) is the maximum possible score for the social function f under weighting specification k;
-
  P f T o t a l is the total number of mapped in-proximity amenities assigned to social function f;
-
I f T o t a l is the total number of mapped intermediate amenities assigned to social function f;
-
C f T o t a l is the total number of mapped central amenities assigned to social function f.
The function-specific accessibility score was subsequently normalised using Equation (4):
N W S h , f ( k )   =   W S h , f ( k ) W S f , m a x ( k )  
where N W S h , f ( k ) represents the normalised accessibility score for H3 cell h, social function f, and weighting specification k.
Normalisation expresses the accessibility score as the proportion of all weighted mapped opportunities assigned to a social function that can be reached from a given H3 cell within the modelled 15-minute walking threshold. This procedure facilitates comparison among social functions with different numbers and compositions of mapped amenities. However, normalisation does not eliminate the influence of POI abundance, amenity classification, or category composition.
The overall accessibility score for each H3 cell and weighting specification was calculated as the arithmetic mean of the seven normalised function-specific scores:
O W S h ( k )   =   1 7 f = 1 7 N W S h , f ( k )
where O W S h ( k ) represents the overall accessibility score for H3 cell h under weighting specification k.
These weighting specifications are treated as ordinal analytical specifications rather than as empirically estimated behavioural models or representations of residents’ preferences. Instead, the three specifications are used to evaluate whether increasing the relative importance of locally available amenities changes the distribution and spatial ranking of accessibility scores. Because accessibility indicators are sensitive to normative choices concerning opportunity classification and weighting, the results of the three specifications are interpreted comparatively rather than as a direct measure of observed behaviour [36,37,38]. The resulting values should therefore be interpreted as measures of potential spatial accessibility to mapped opportunities. They do not assess minimum service sufficiency, facility capacity, service quality, opening hours, affordability, eligibility restrictions, amenity-type diversity, or the extent to which the accessible combination of services satisfies residents’ needs.
To evaluate the sensitivity of the accessibility results to the weighting assumptions, a cell-level comparison was conducted among the 1:1:1, 3:2:1, and 5:3:1 specifications. The analysis included Spearman’s rank correlation, mean and maximum absolute score differences, the percentage of H3 cells remaining in the same accessibility class, the percentage shifting by one class, and the Jaccard overlap of the highest-accessibility class. Common pooled-quintile thresholds were calculated from the combined distribution of the three accessibility scores and applied identically to each weighting specification. This procedure produced five comparable accessibility classes defined by the same numerical thresholds.
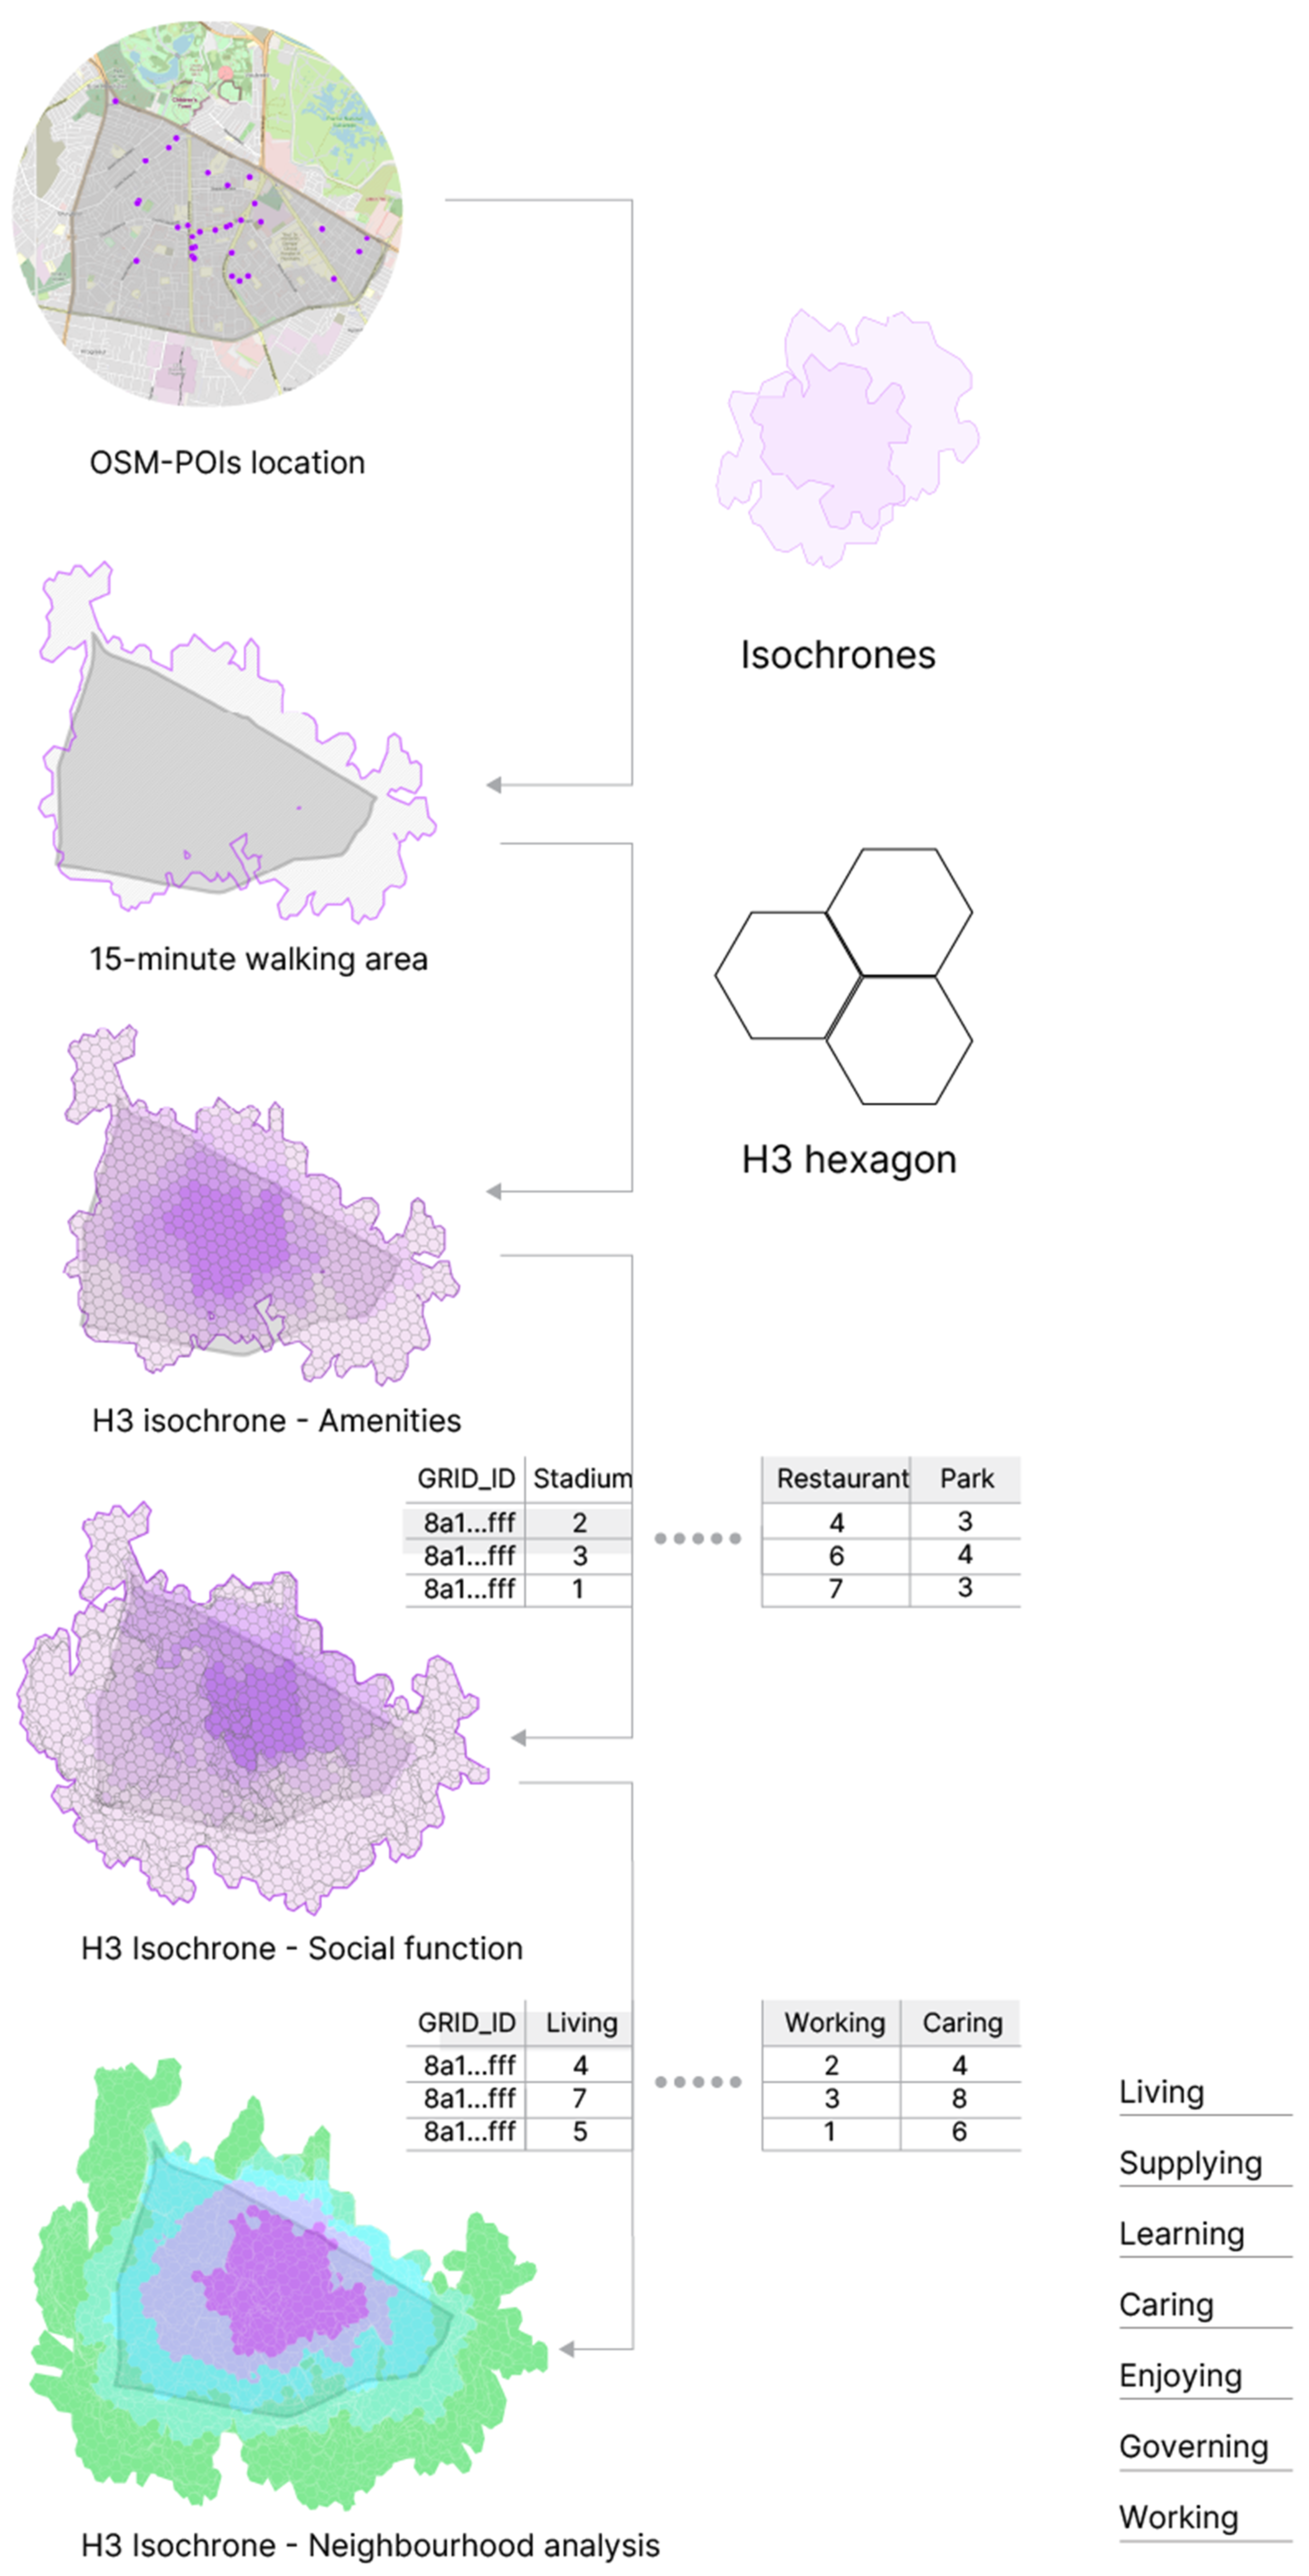
Figure 5 provides a schematic representation of the workflow that was employed in the present study.

4. Results

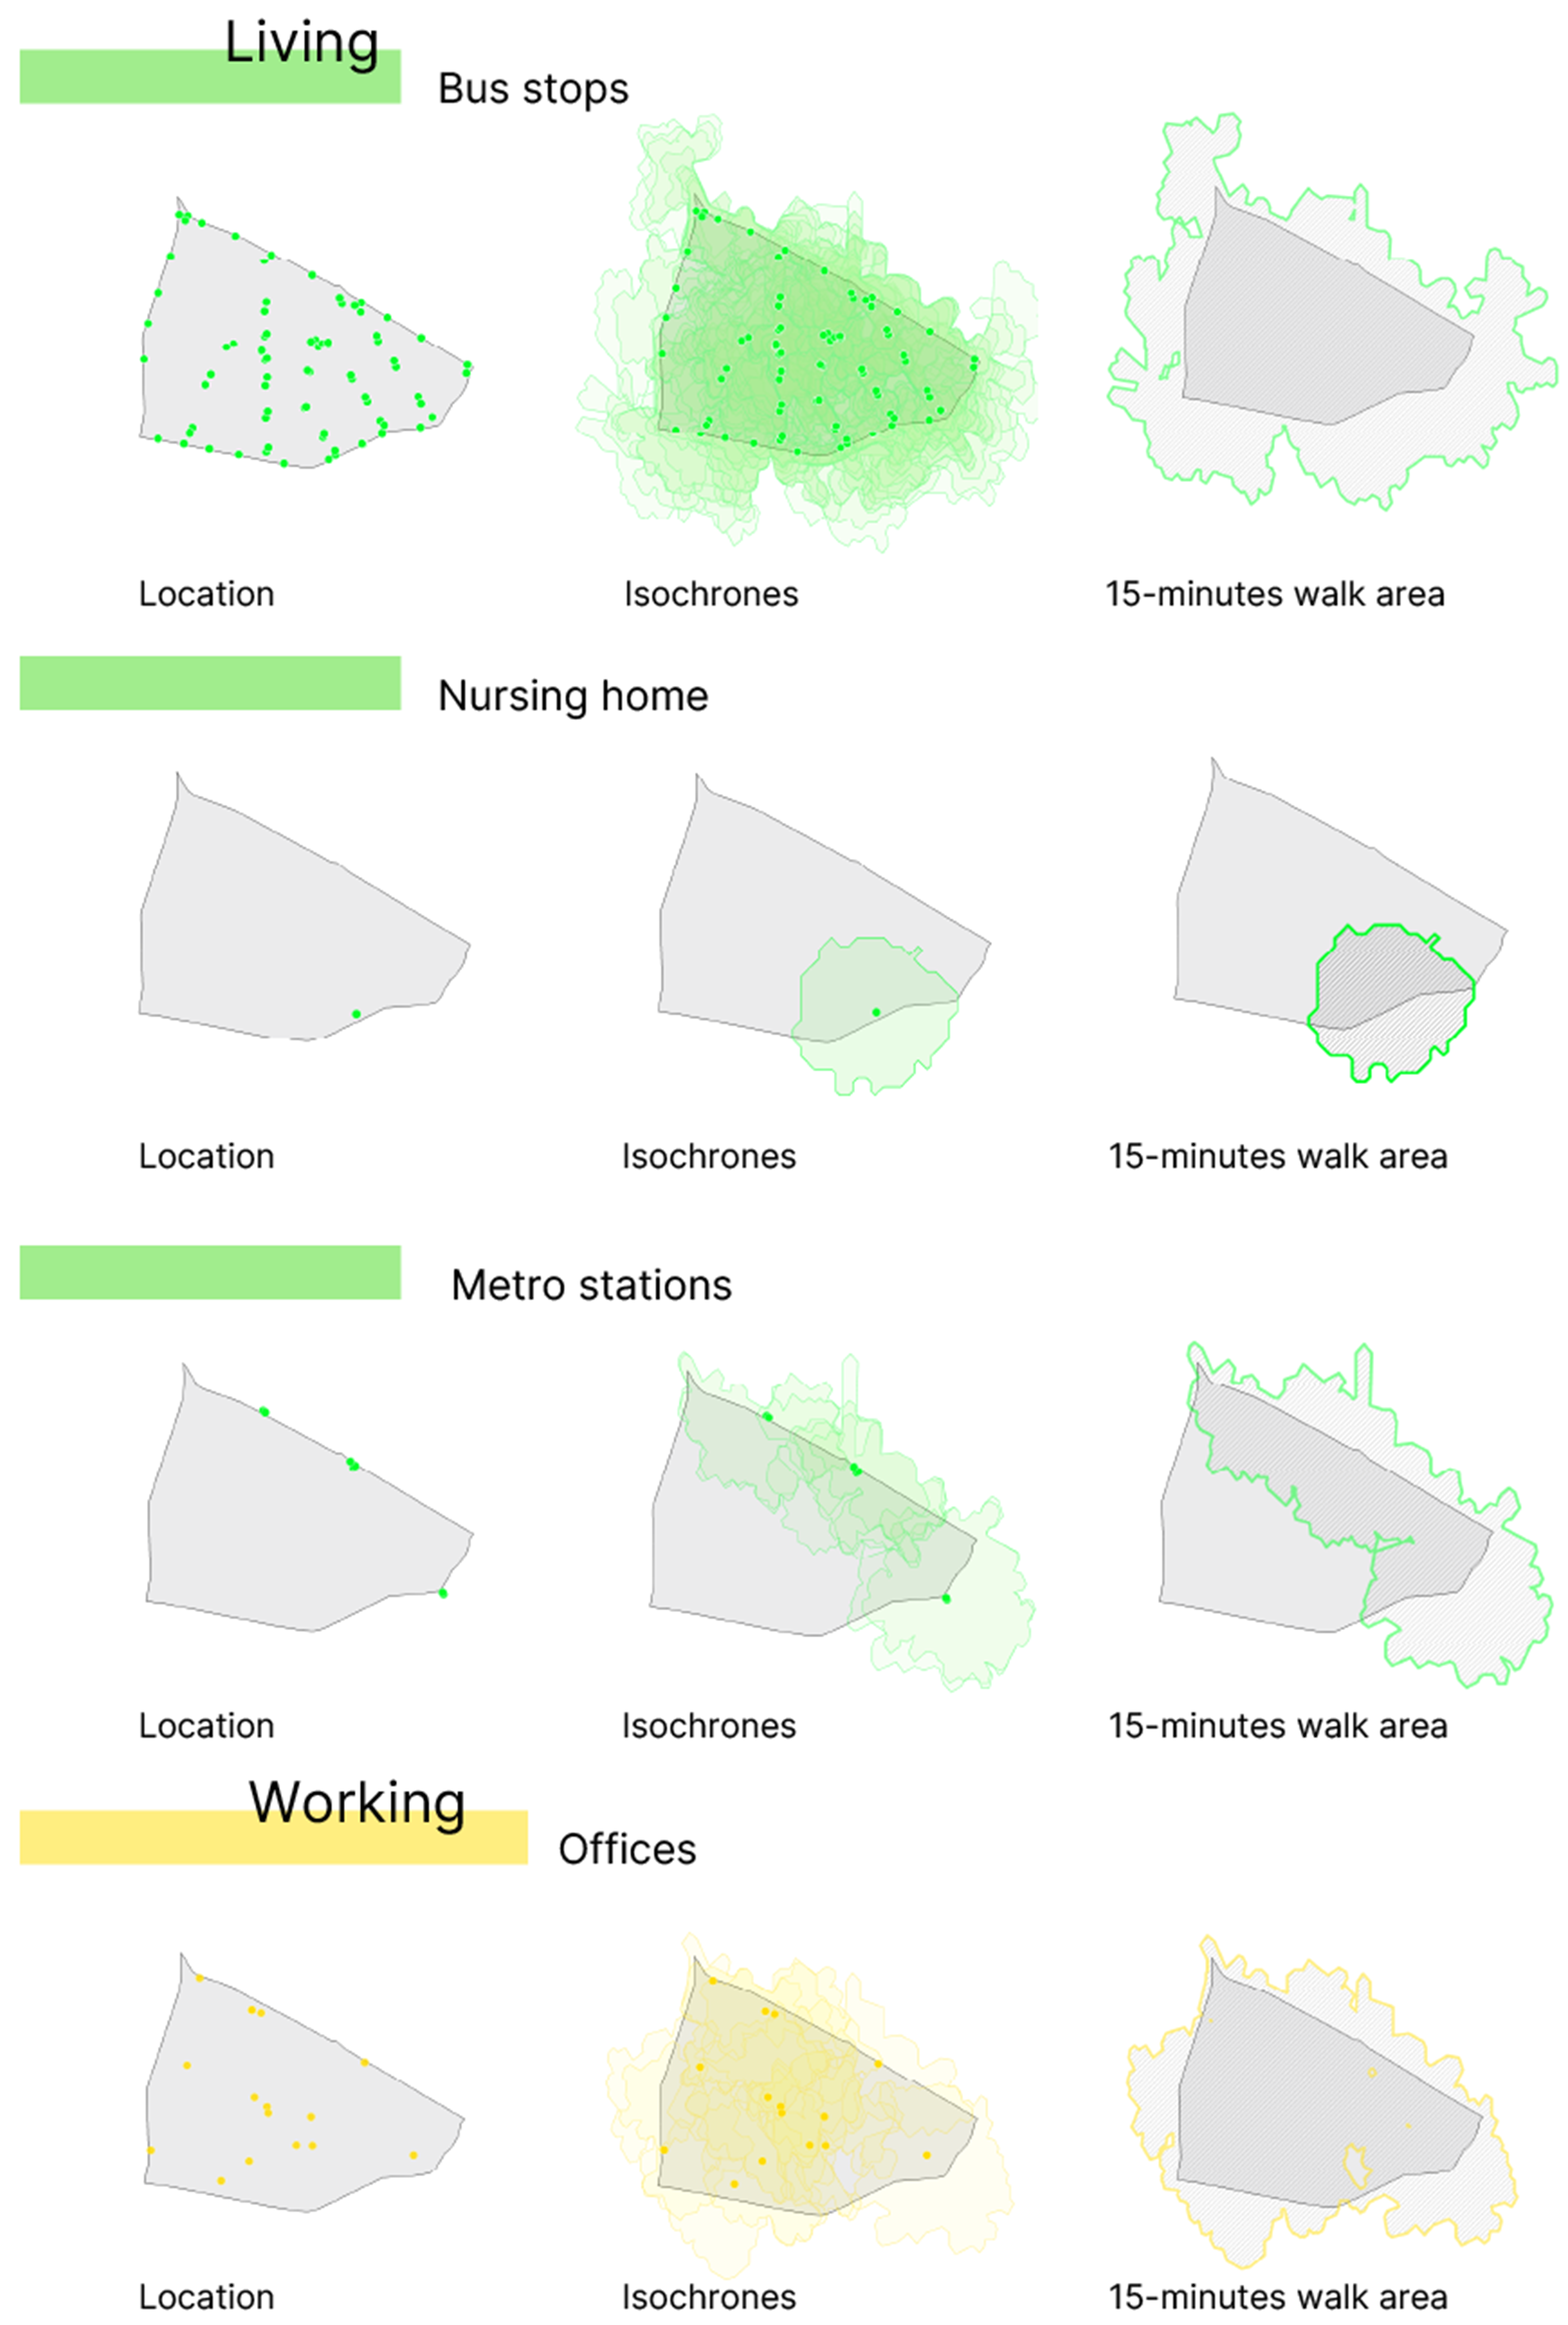
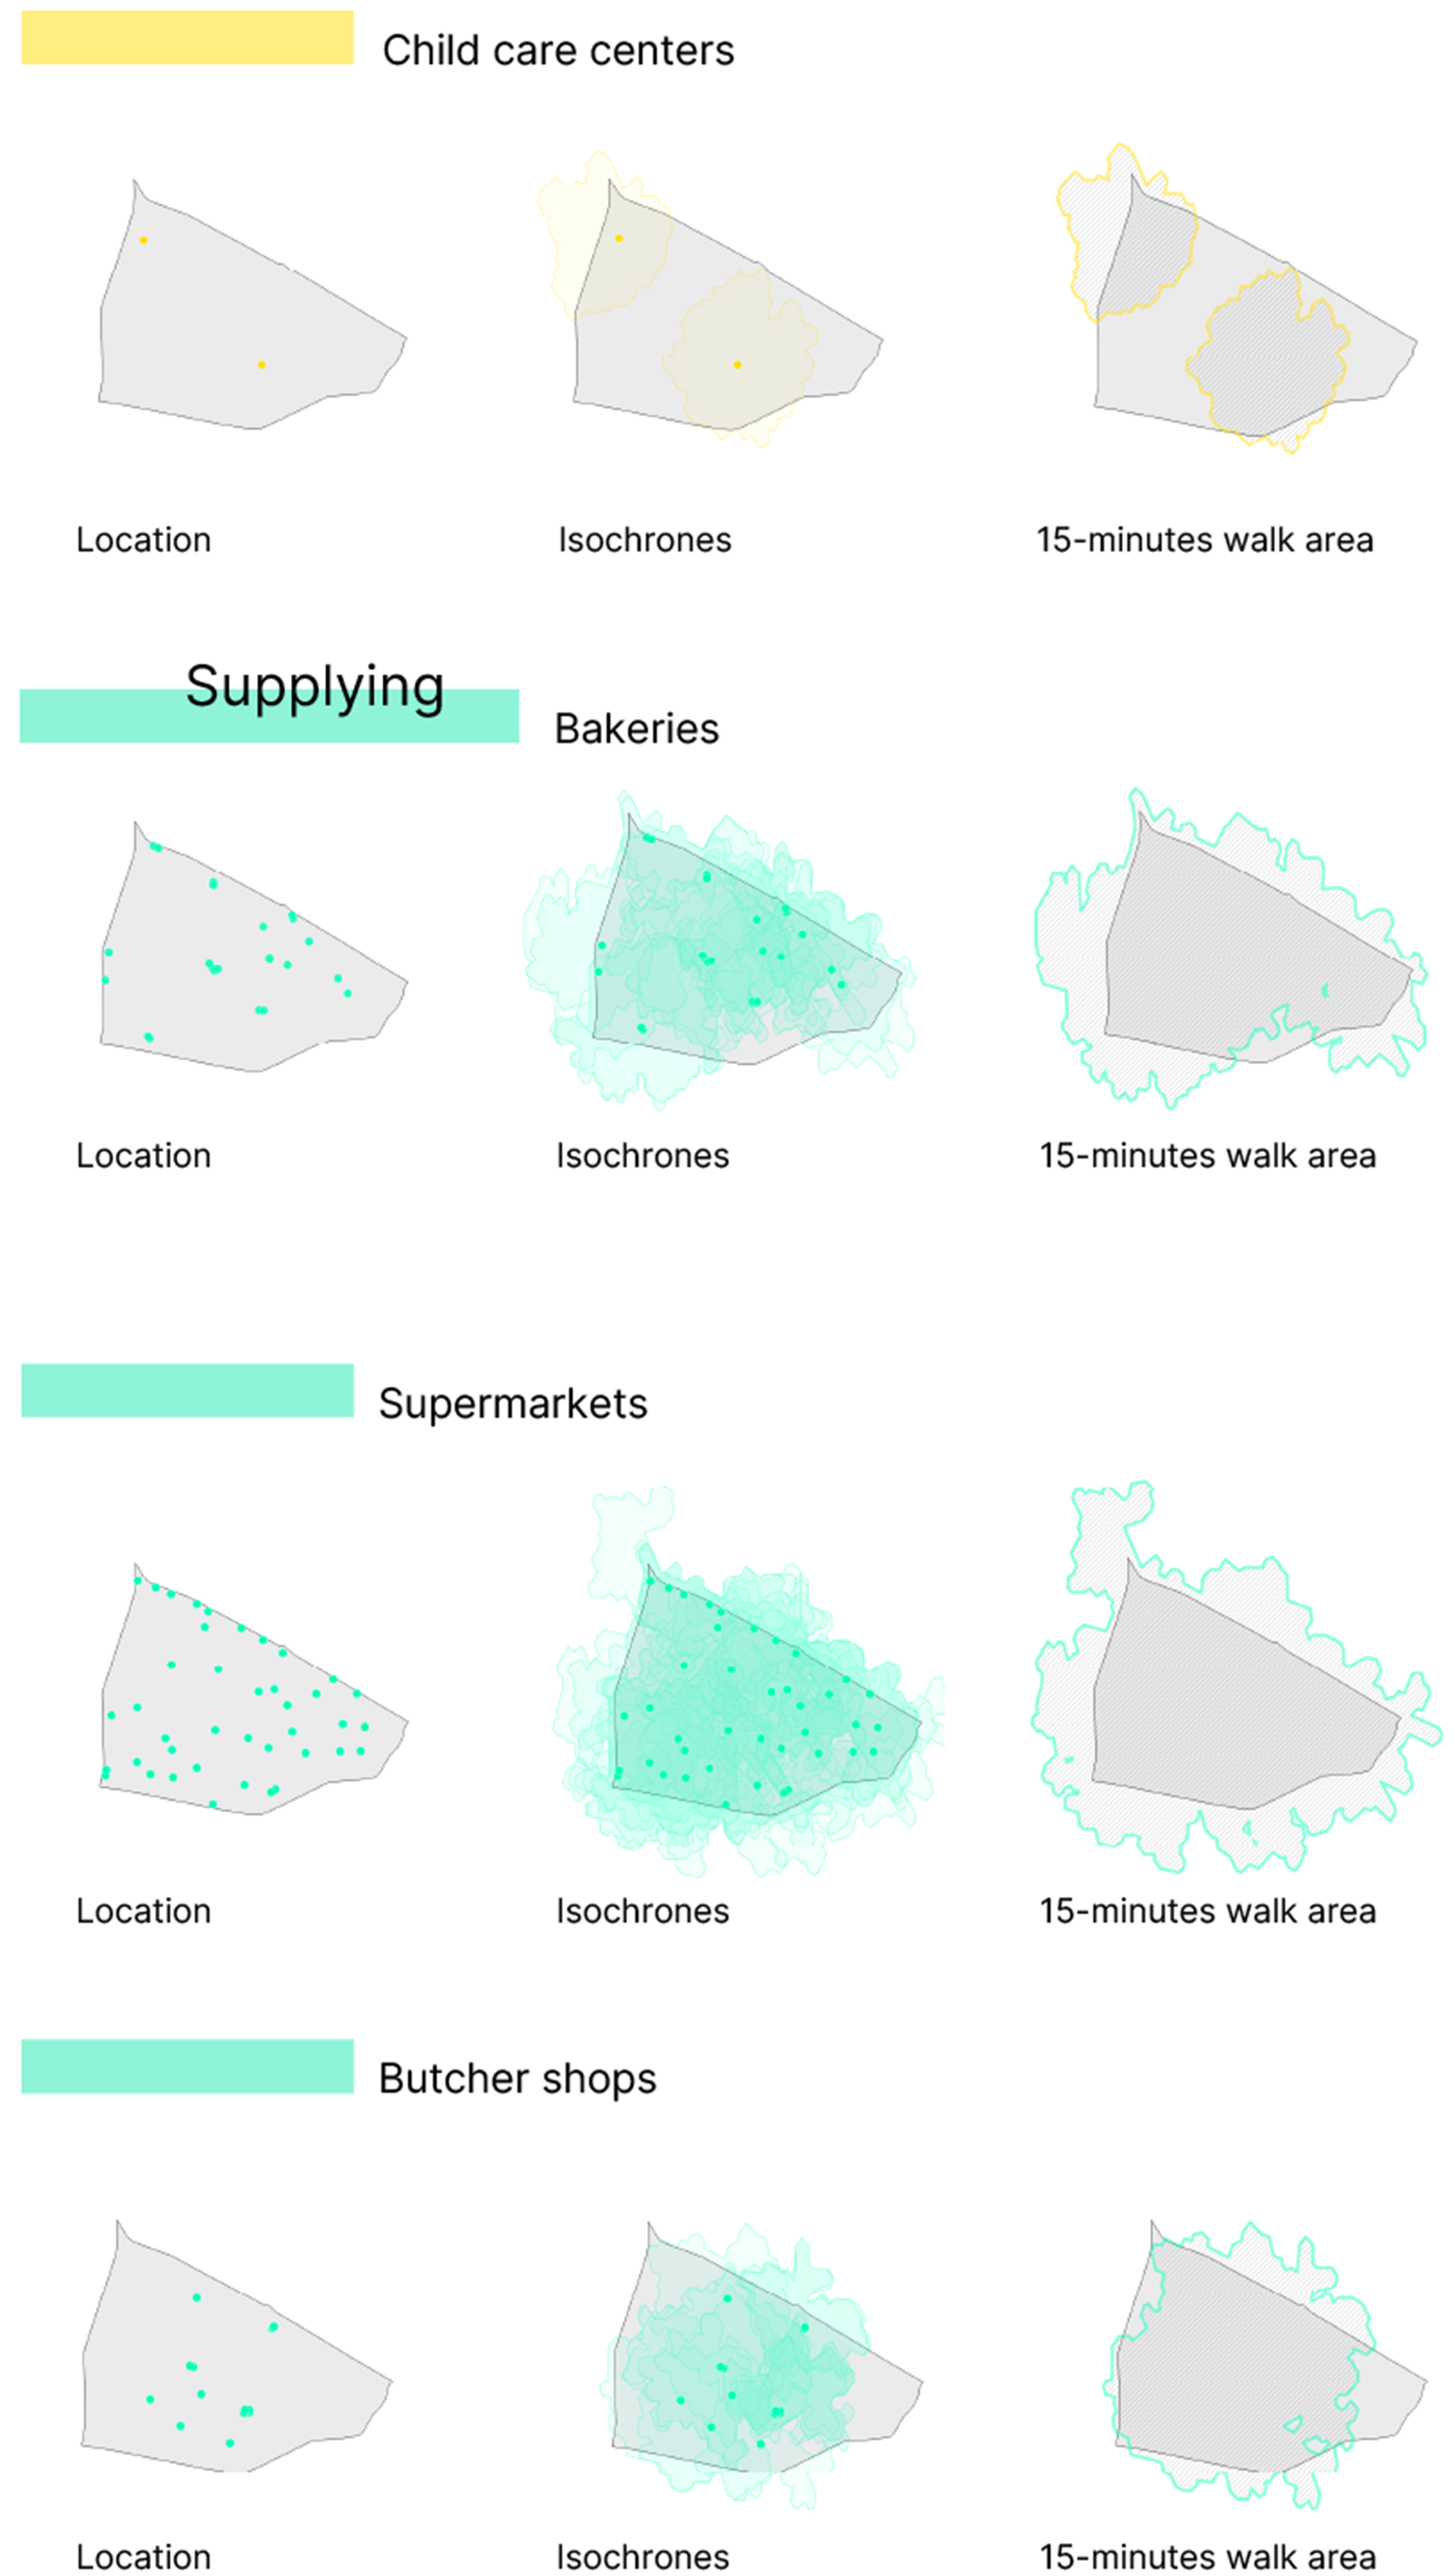
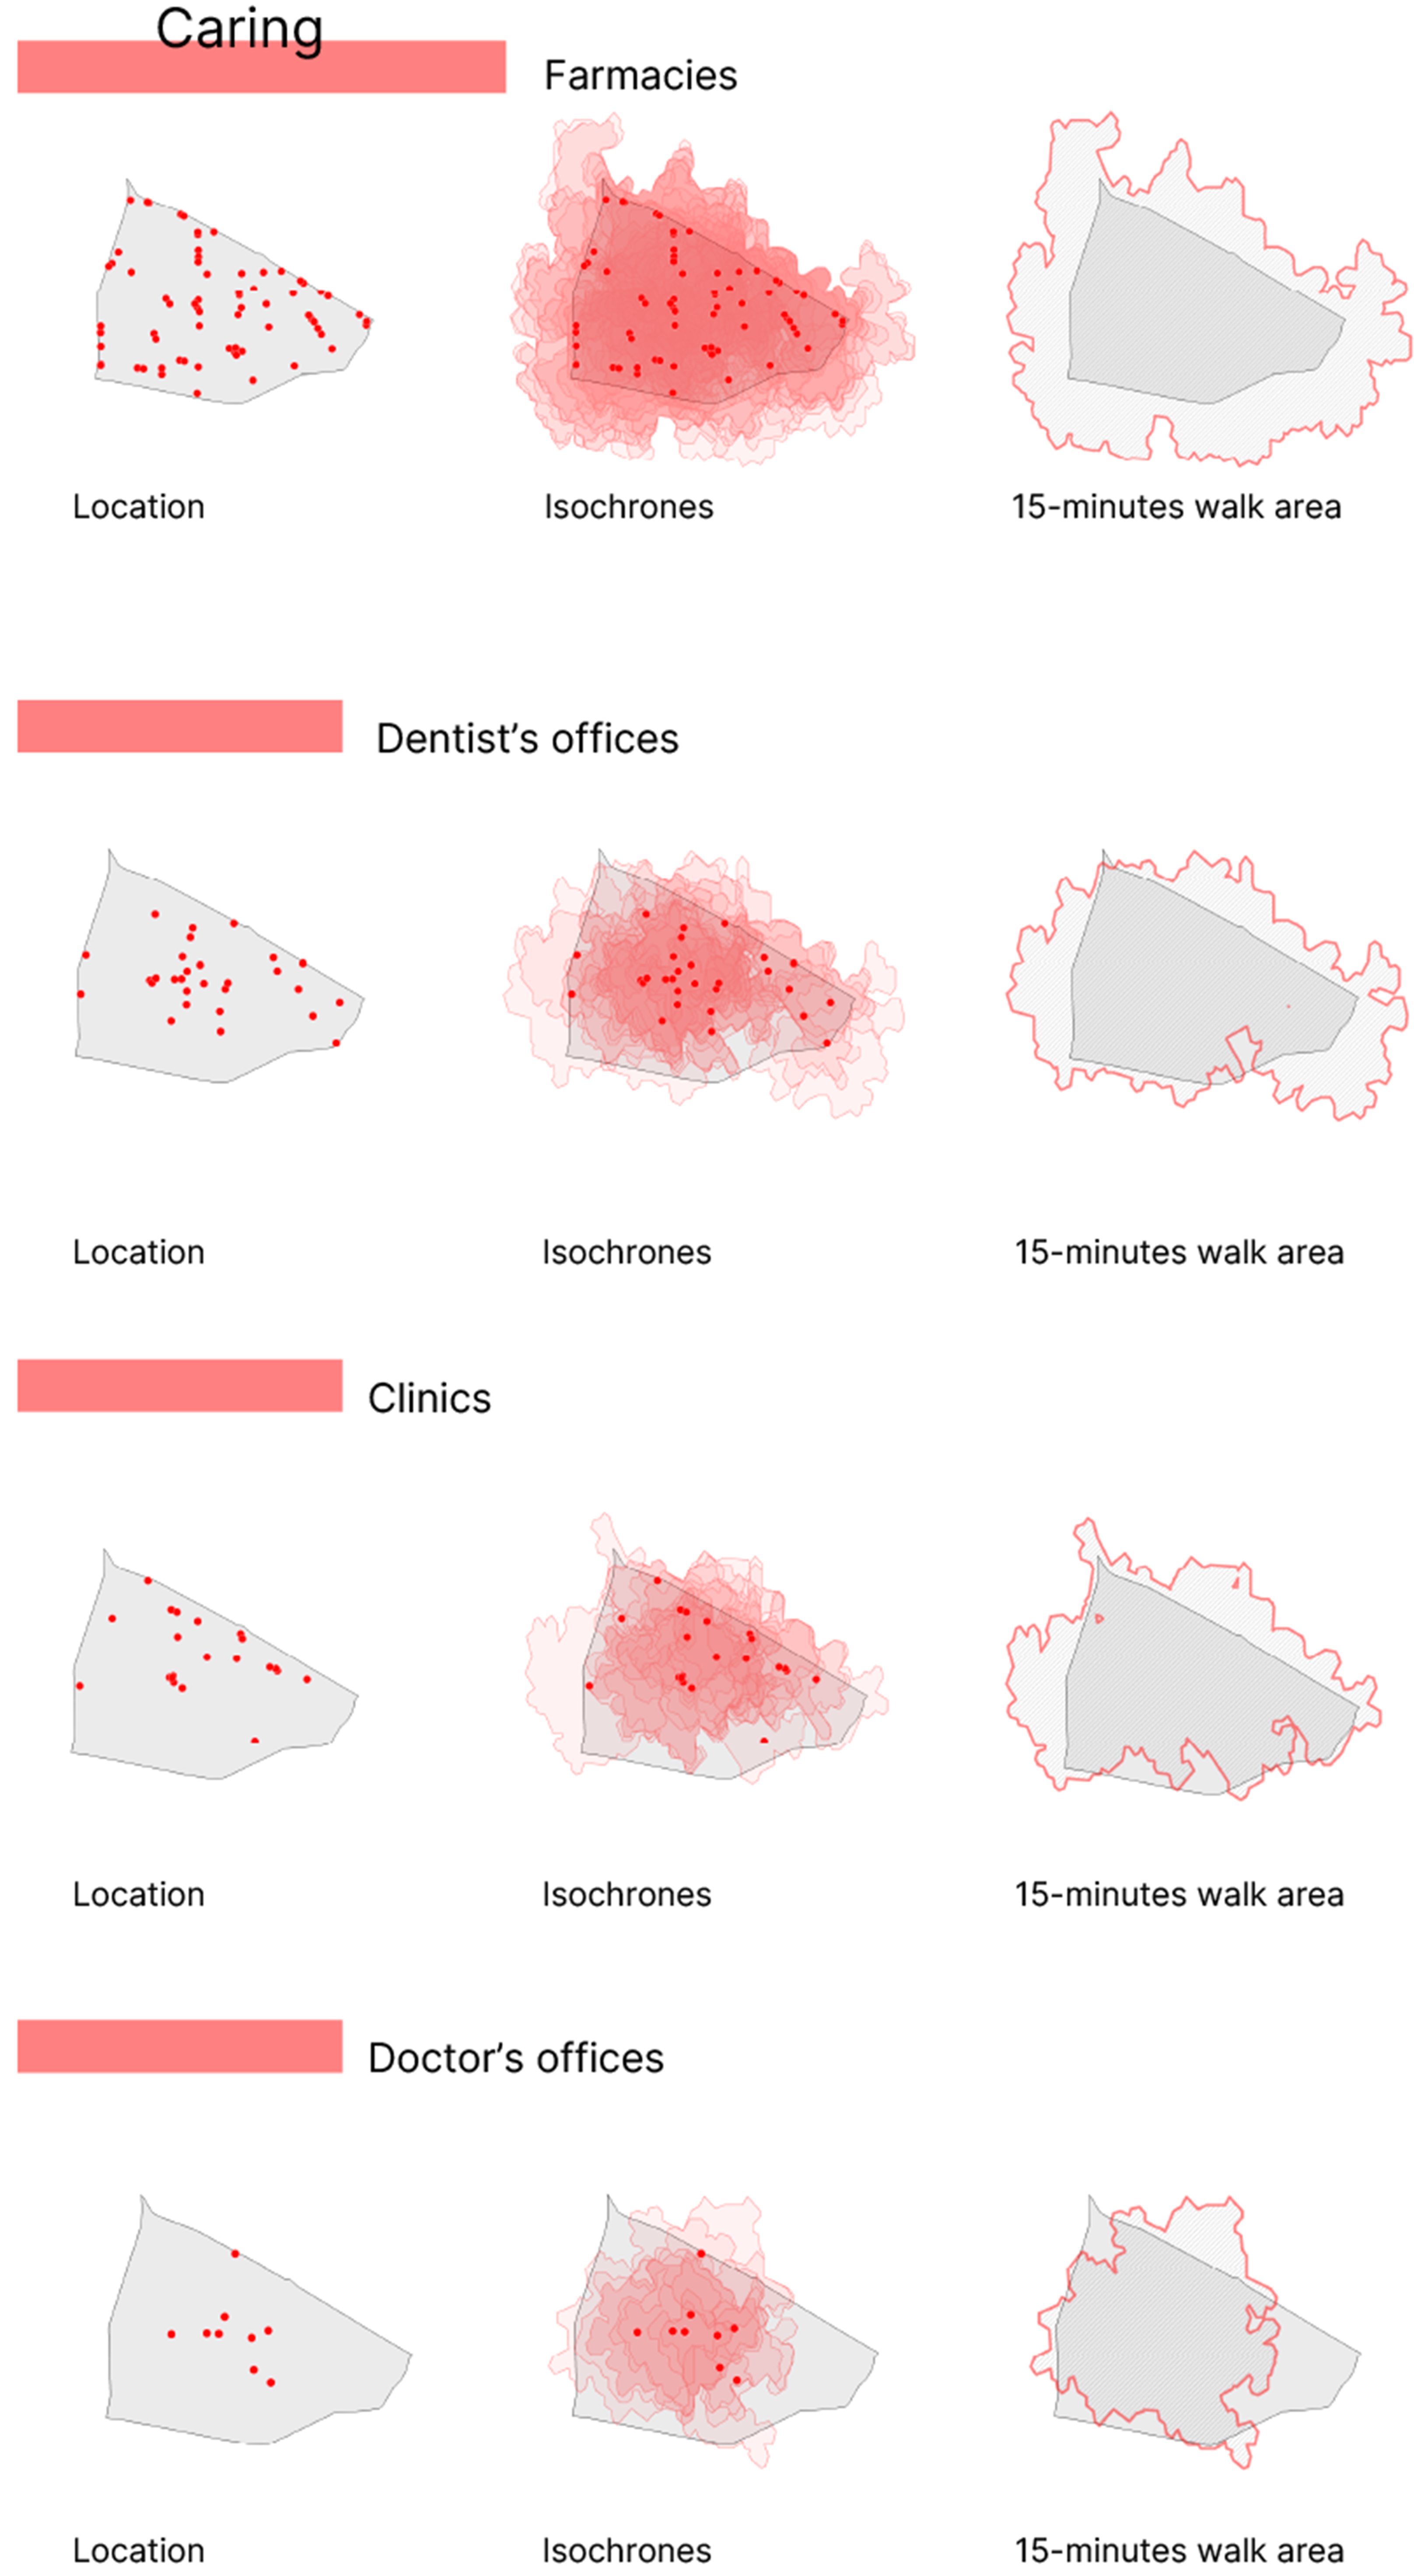
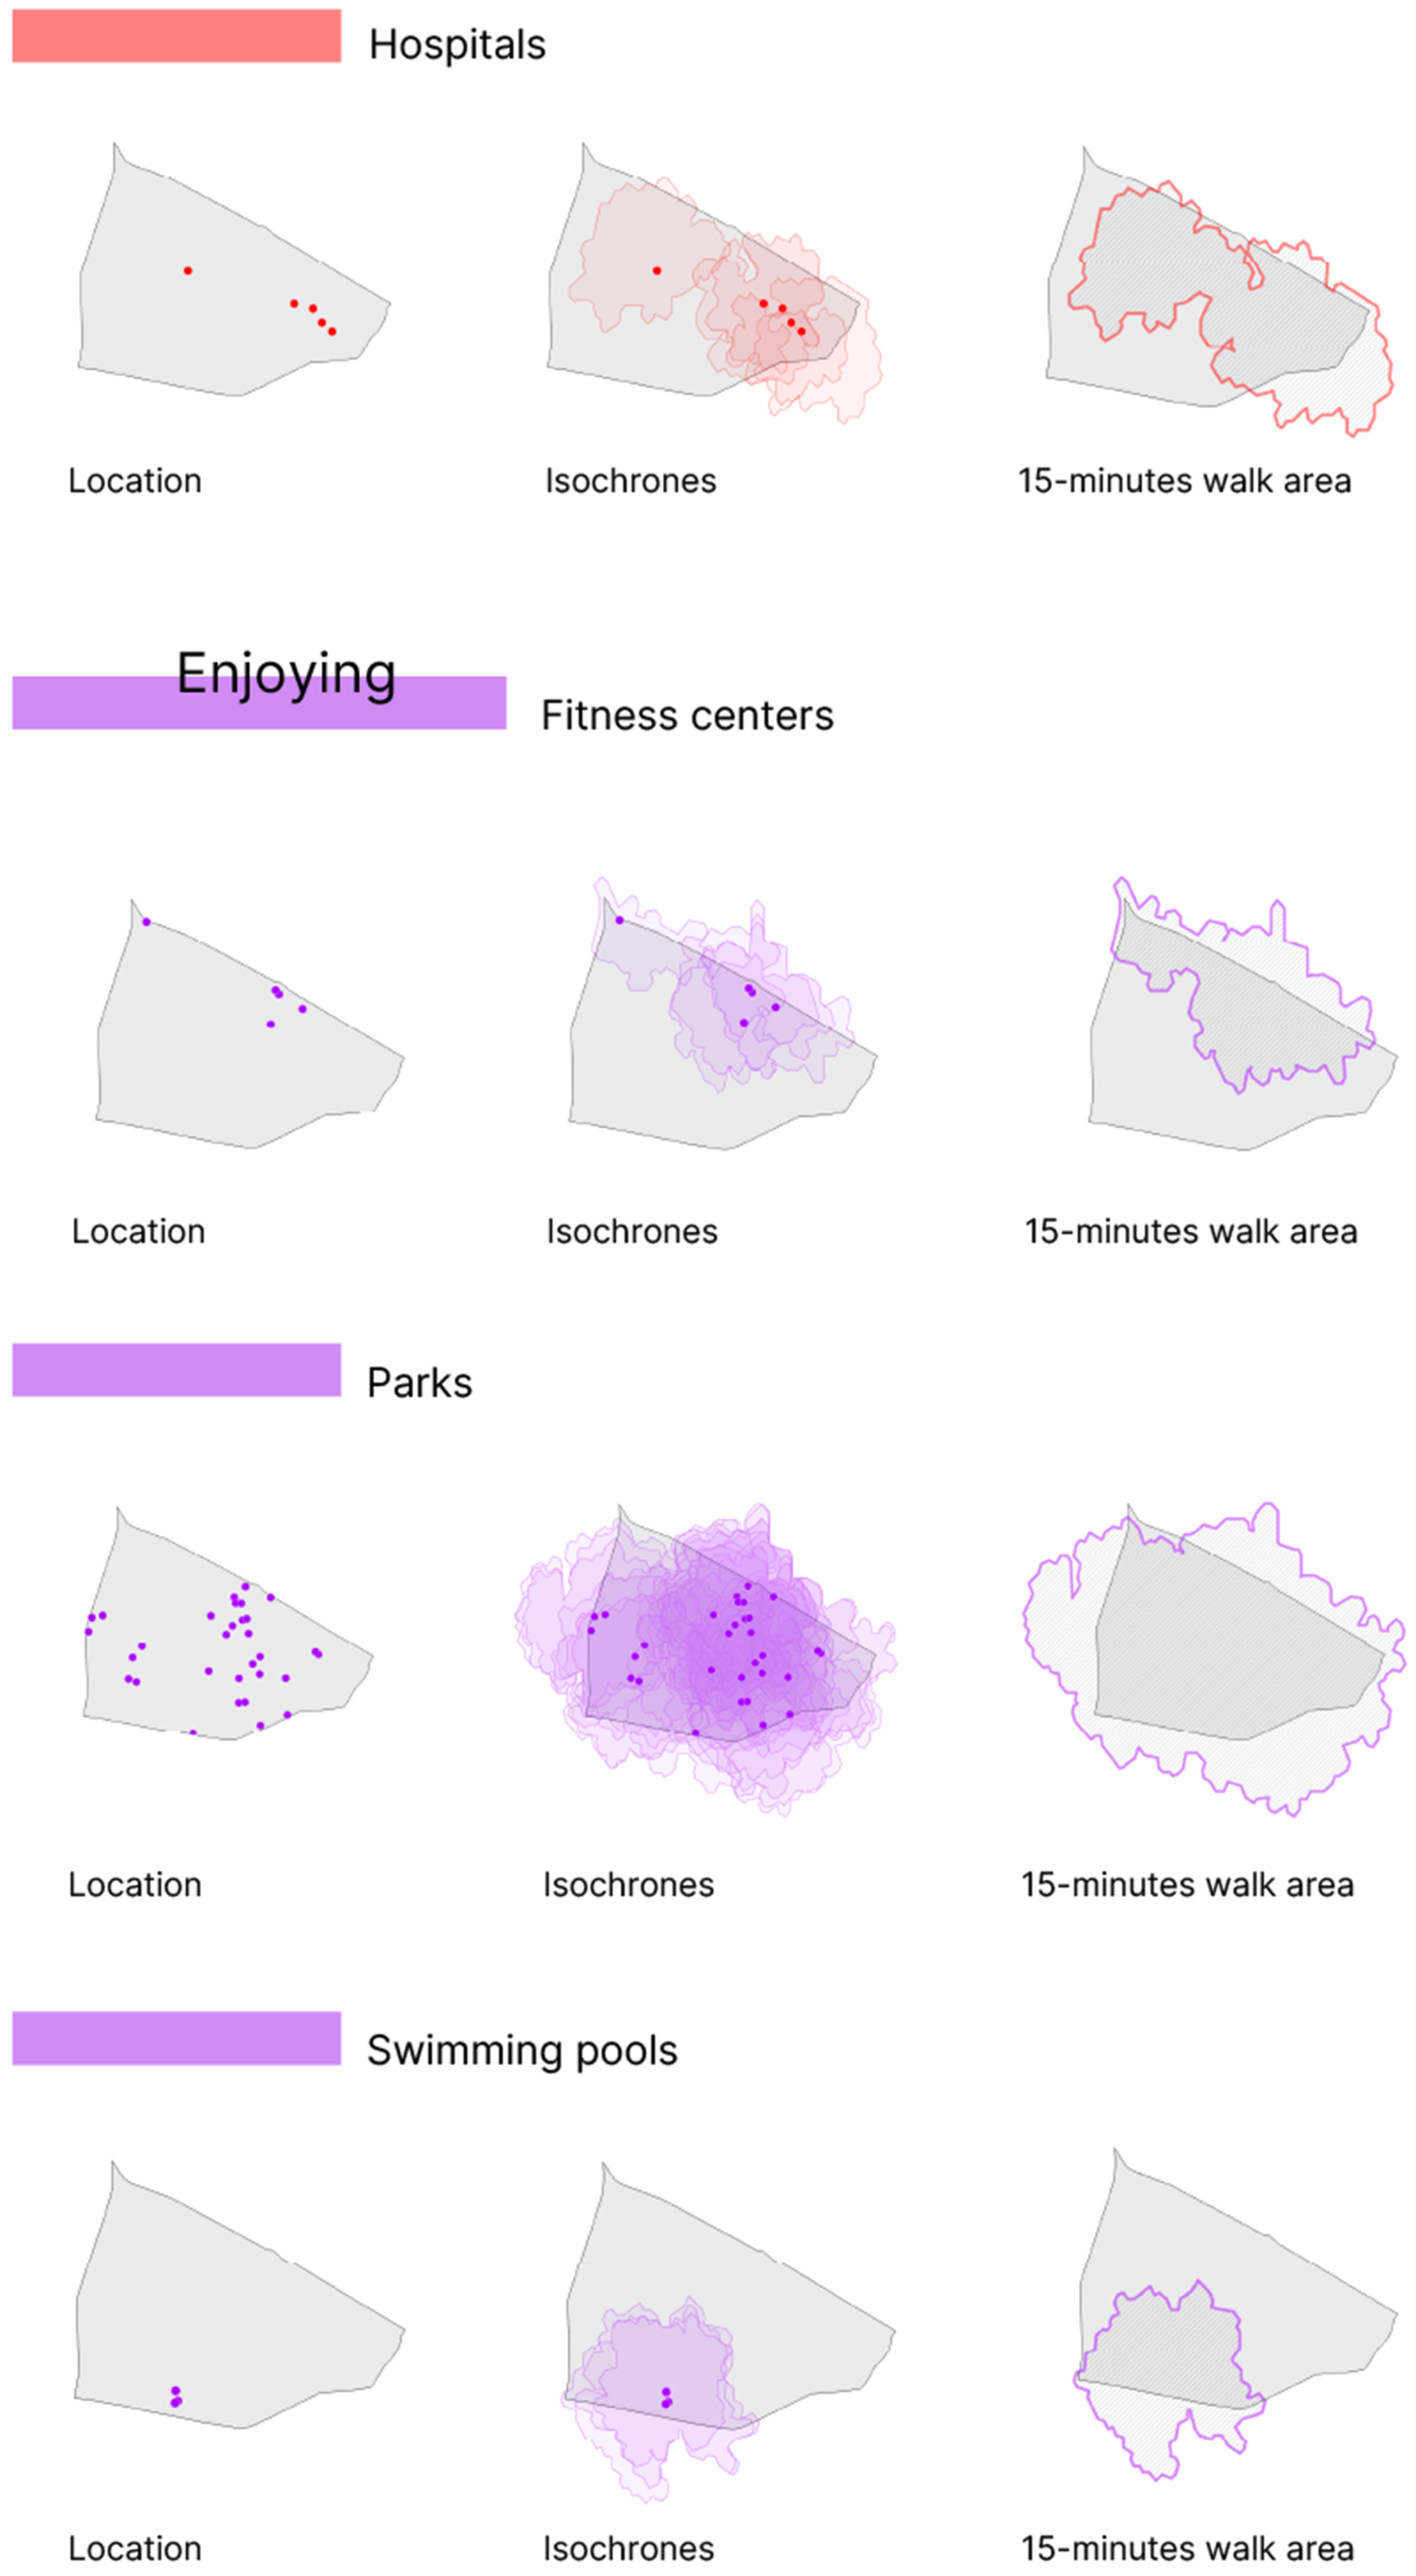
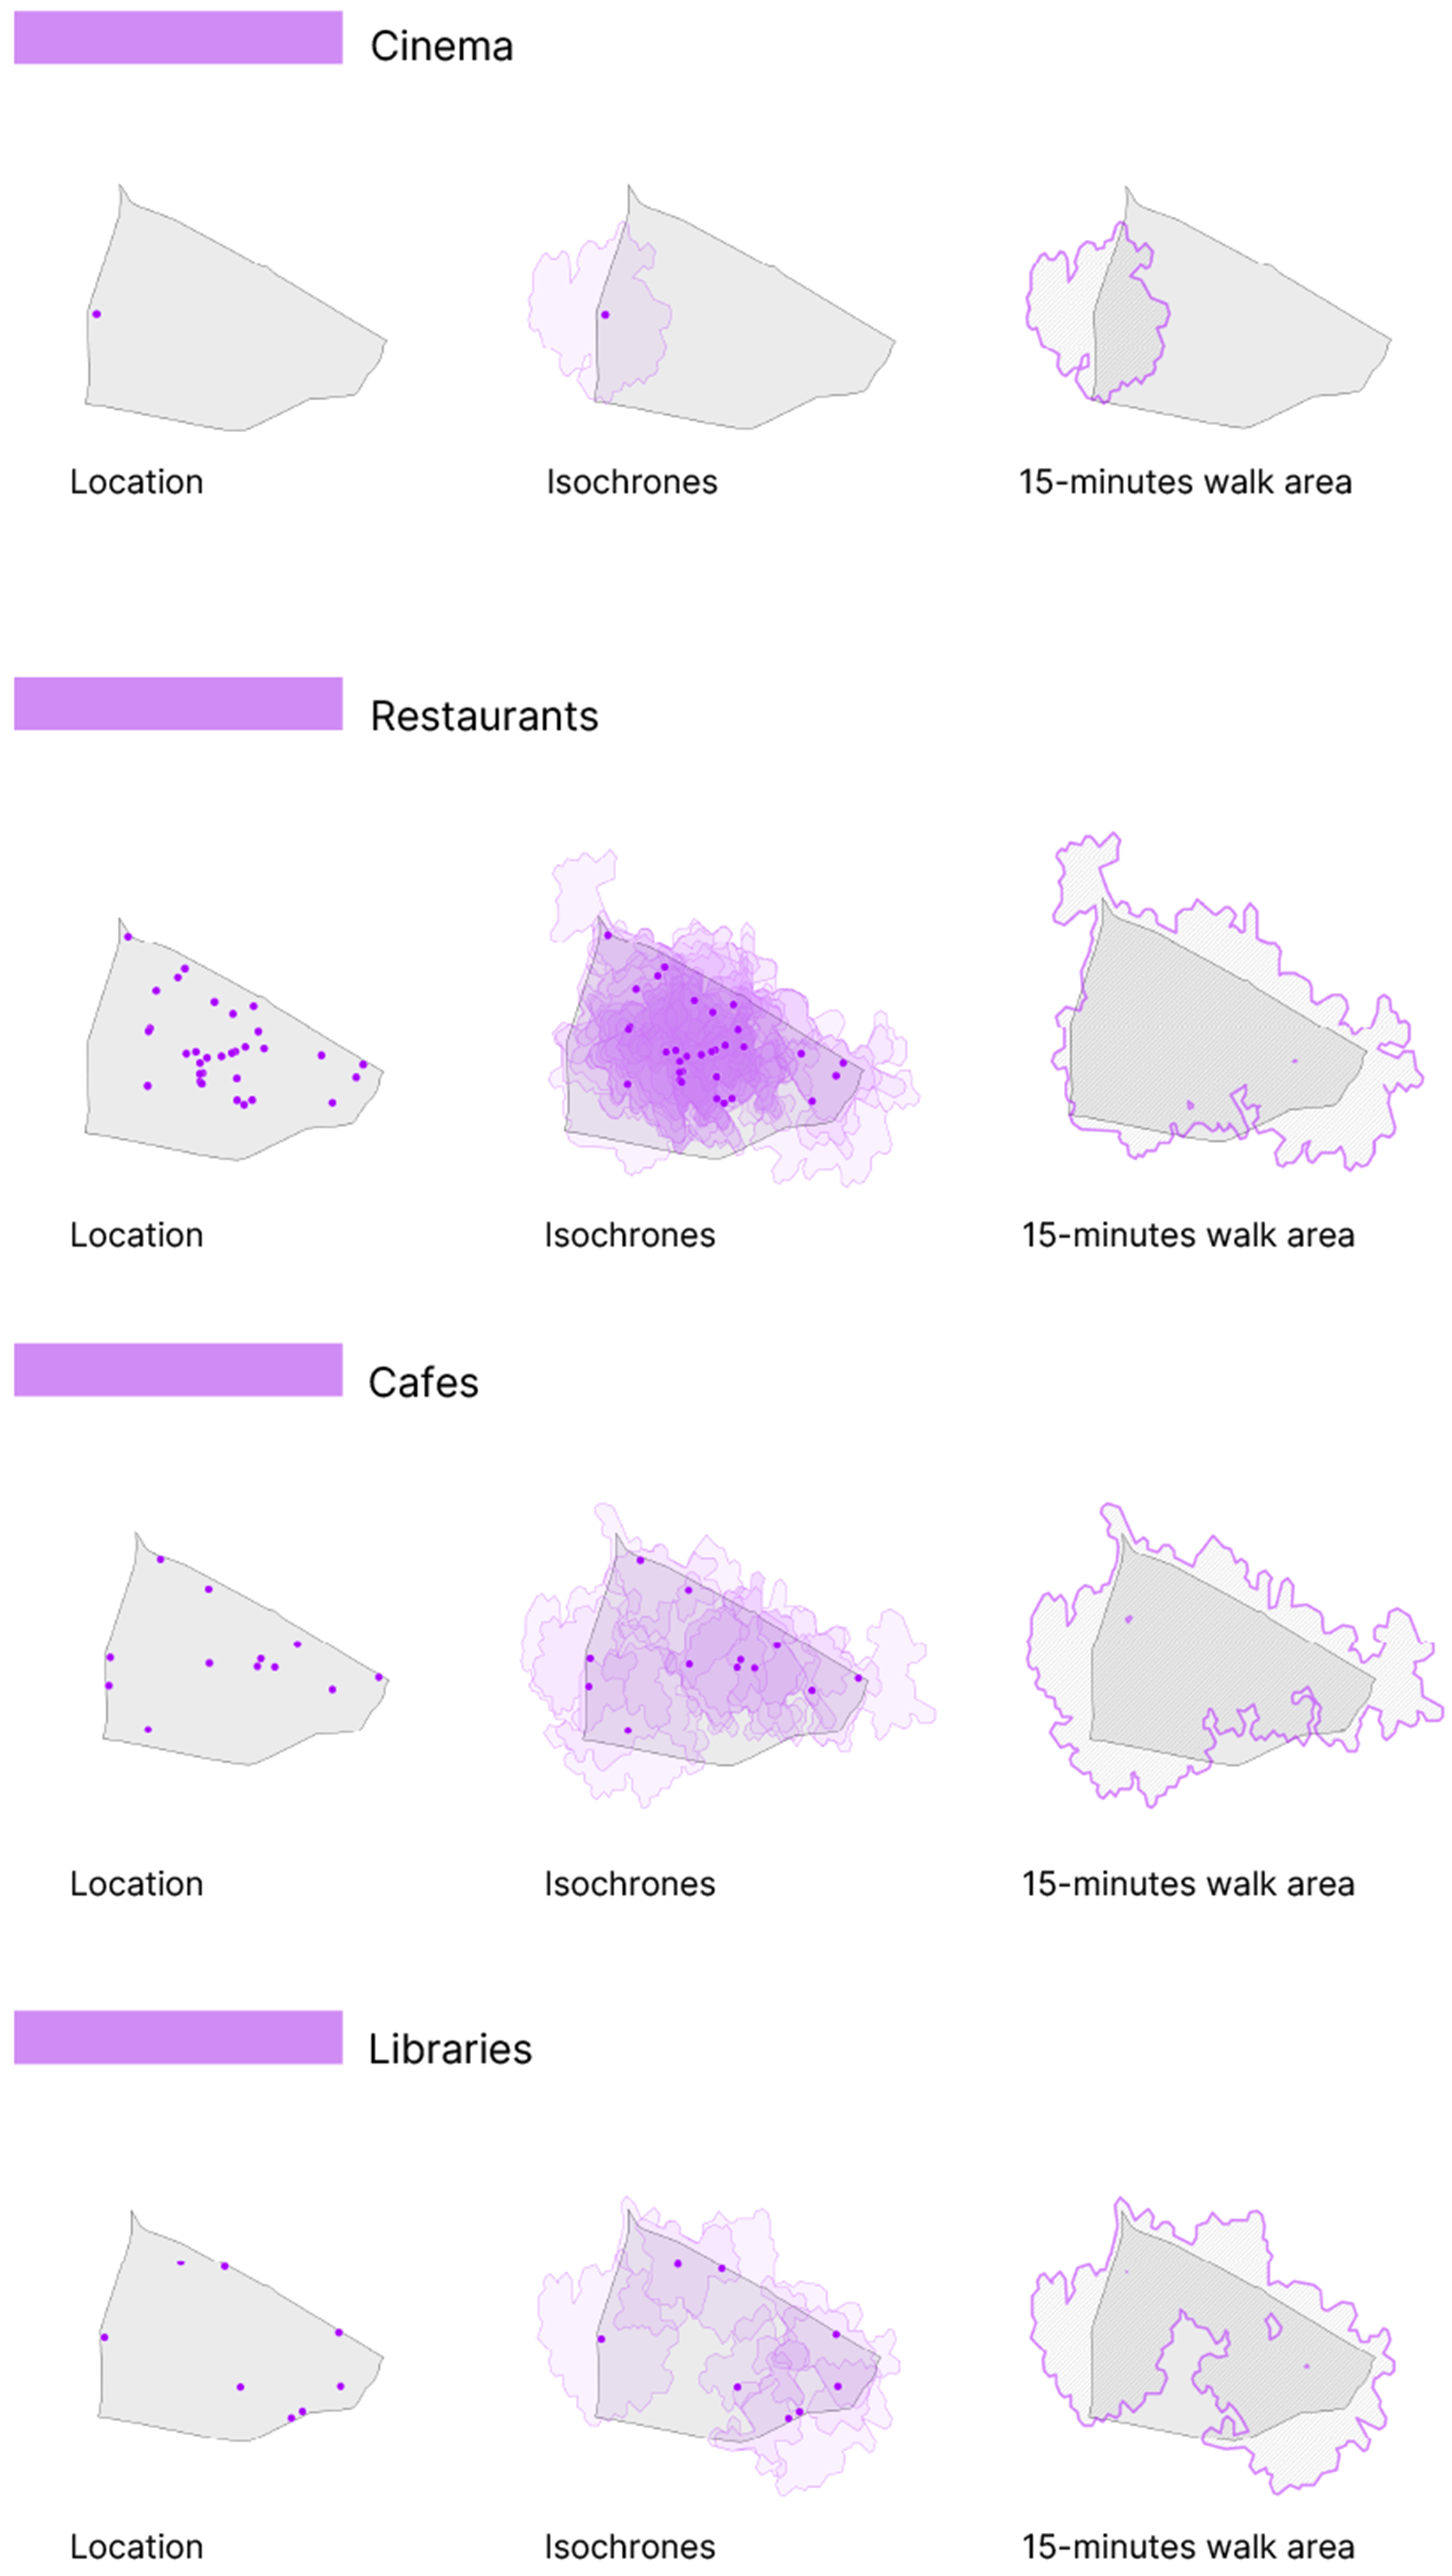
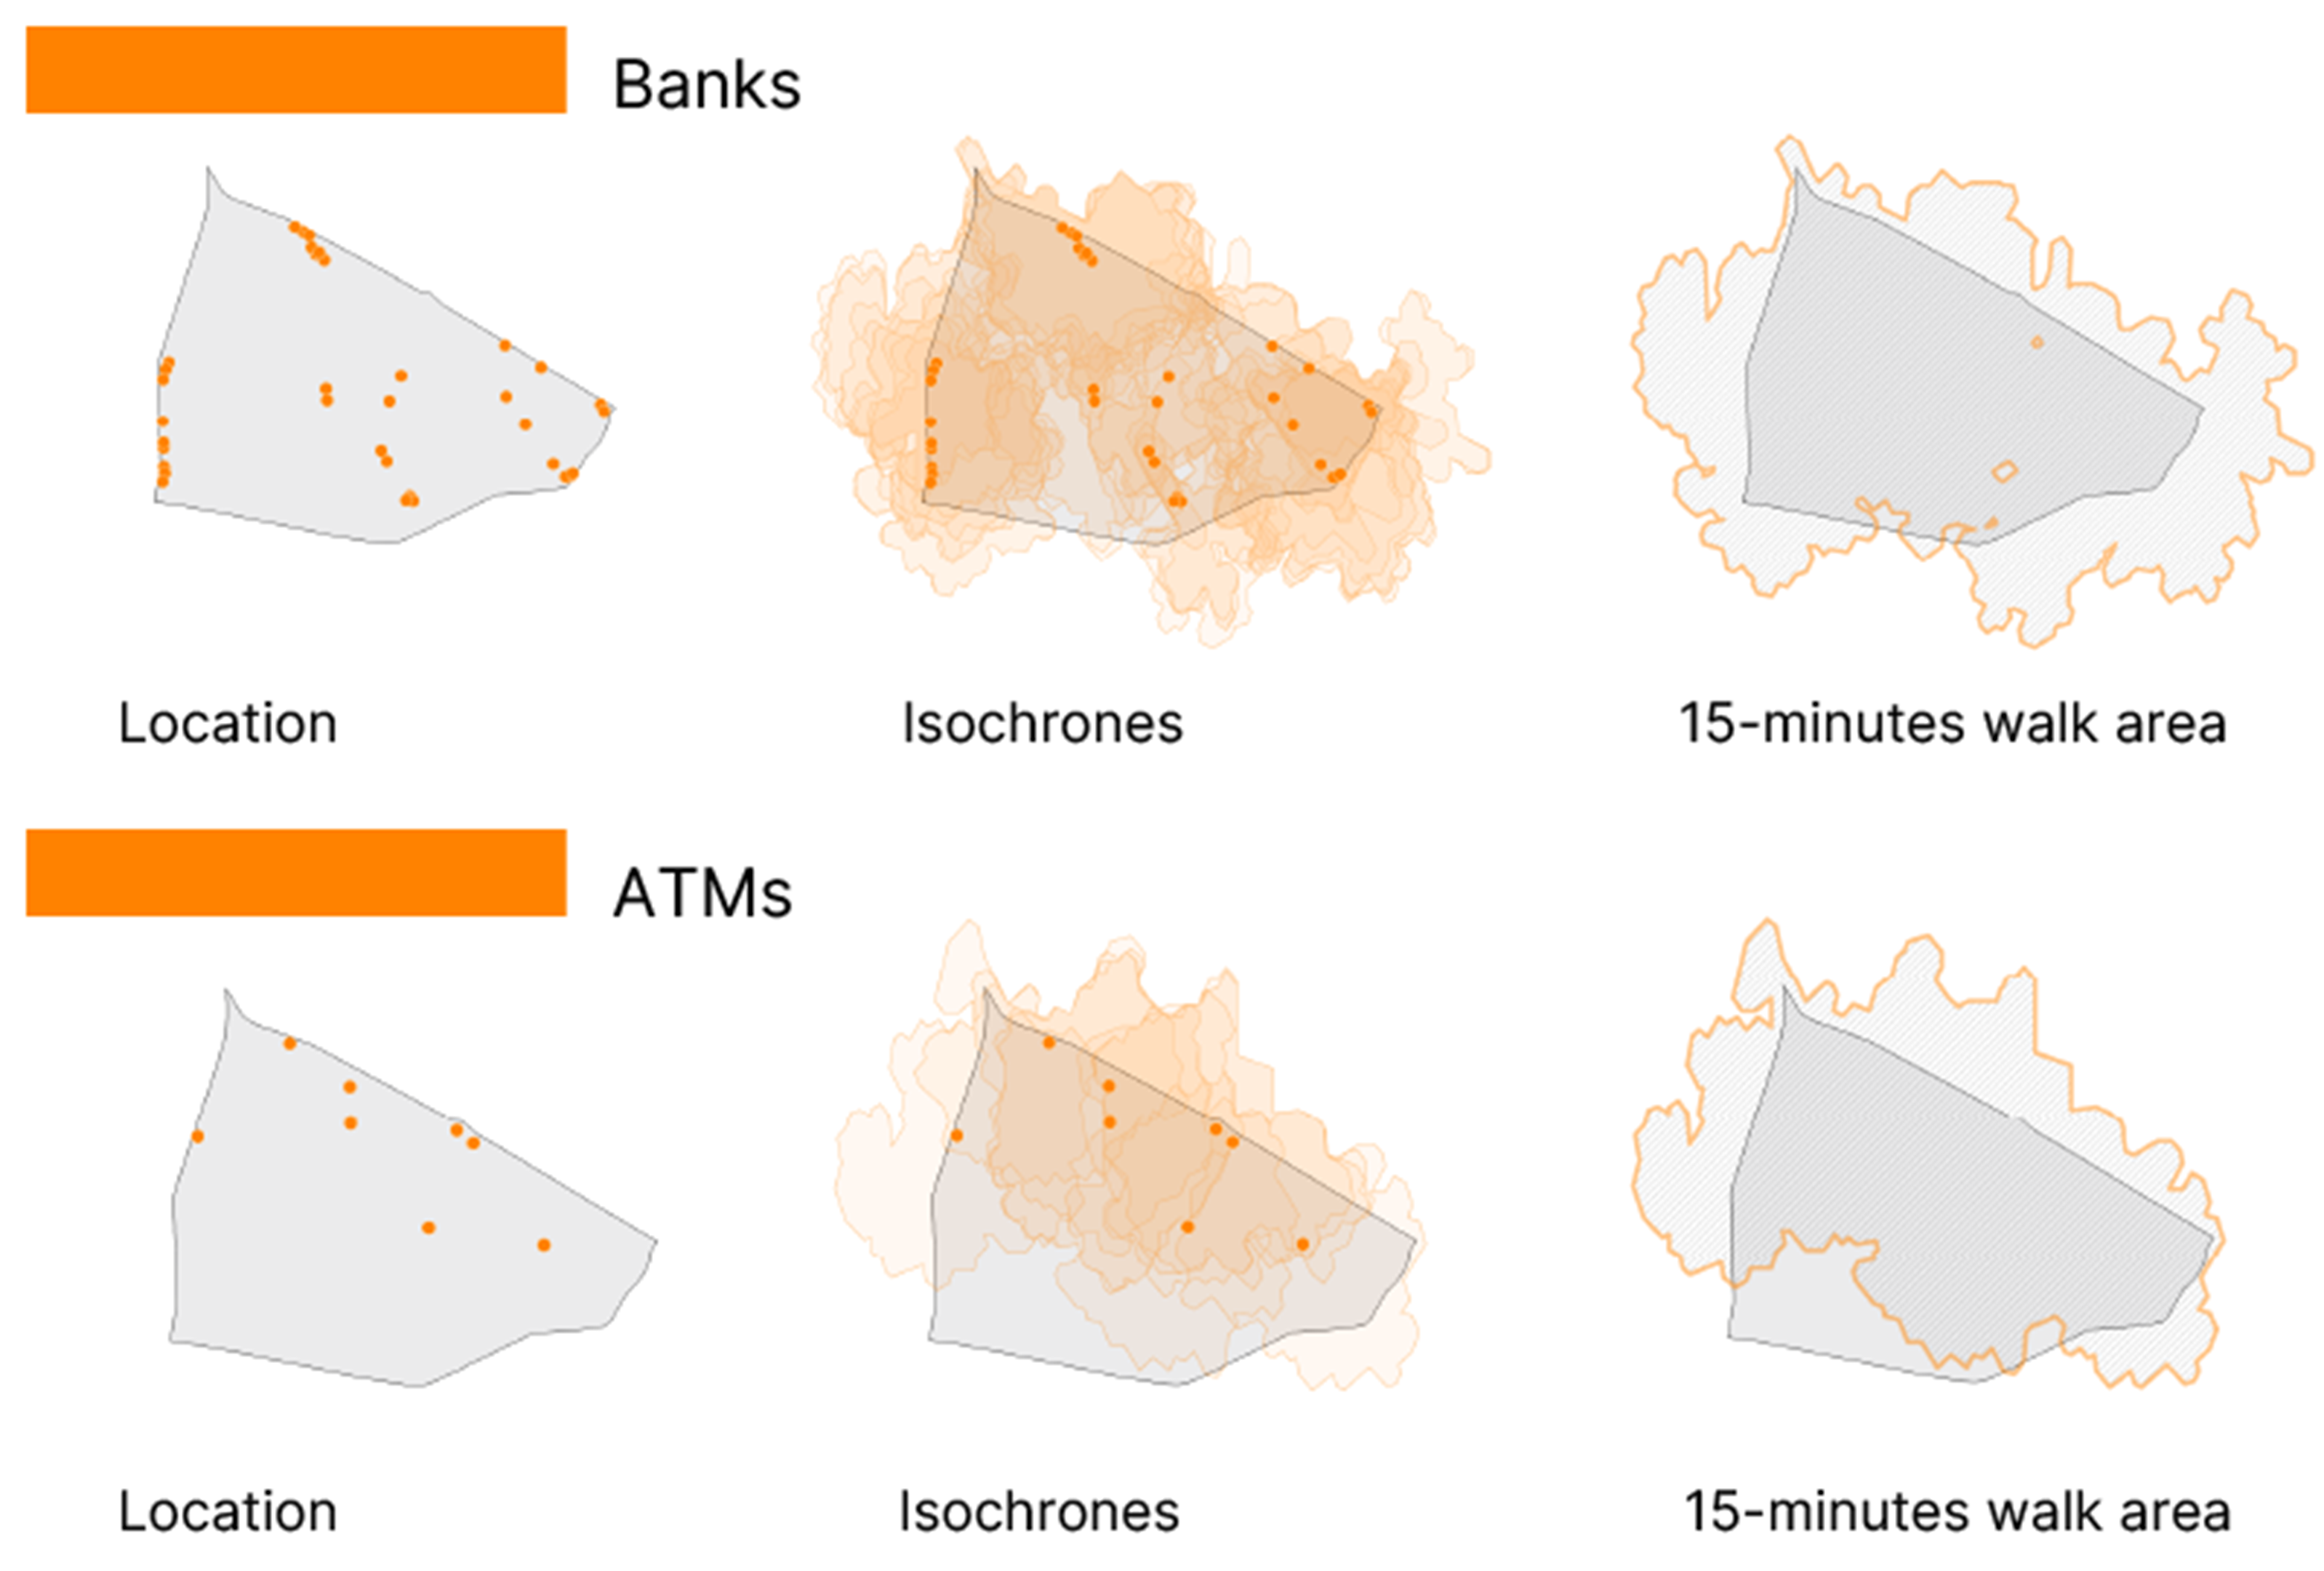
This section reports the results obtained through the methodological workflow described in the Materials and Methods section. The outcomes for the initial two phases of this case study are presented in Figure 6, Figure 7, Figure 8, Figure 9, Figure 10, Figure 11, Figure 12 and Figure 13.
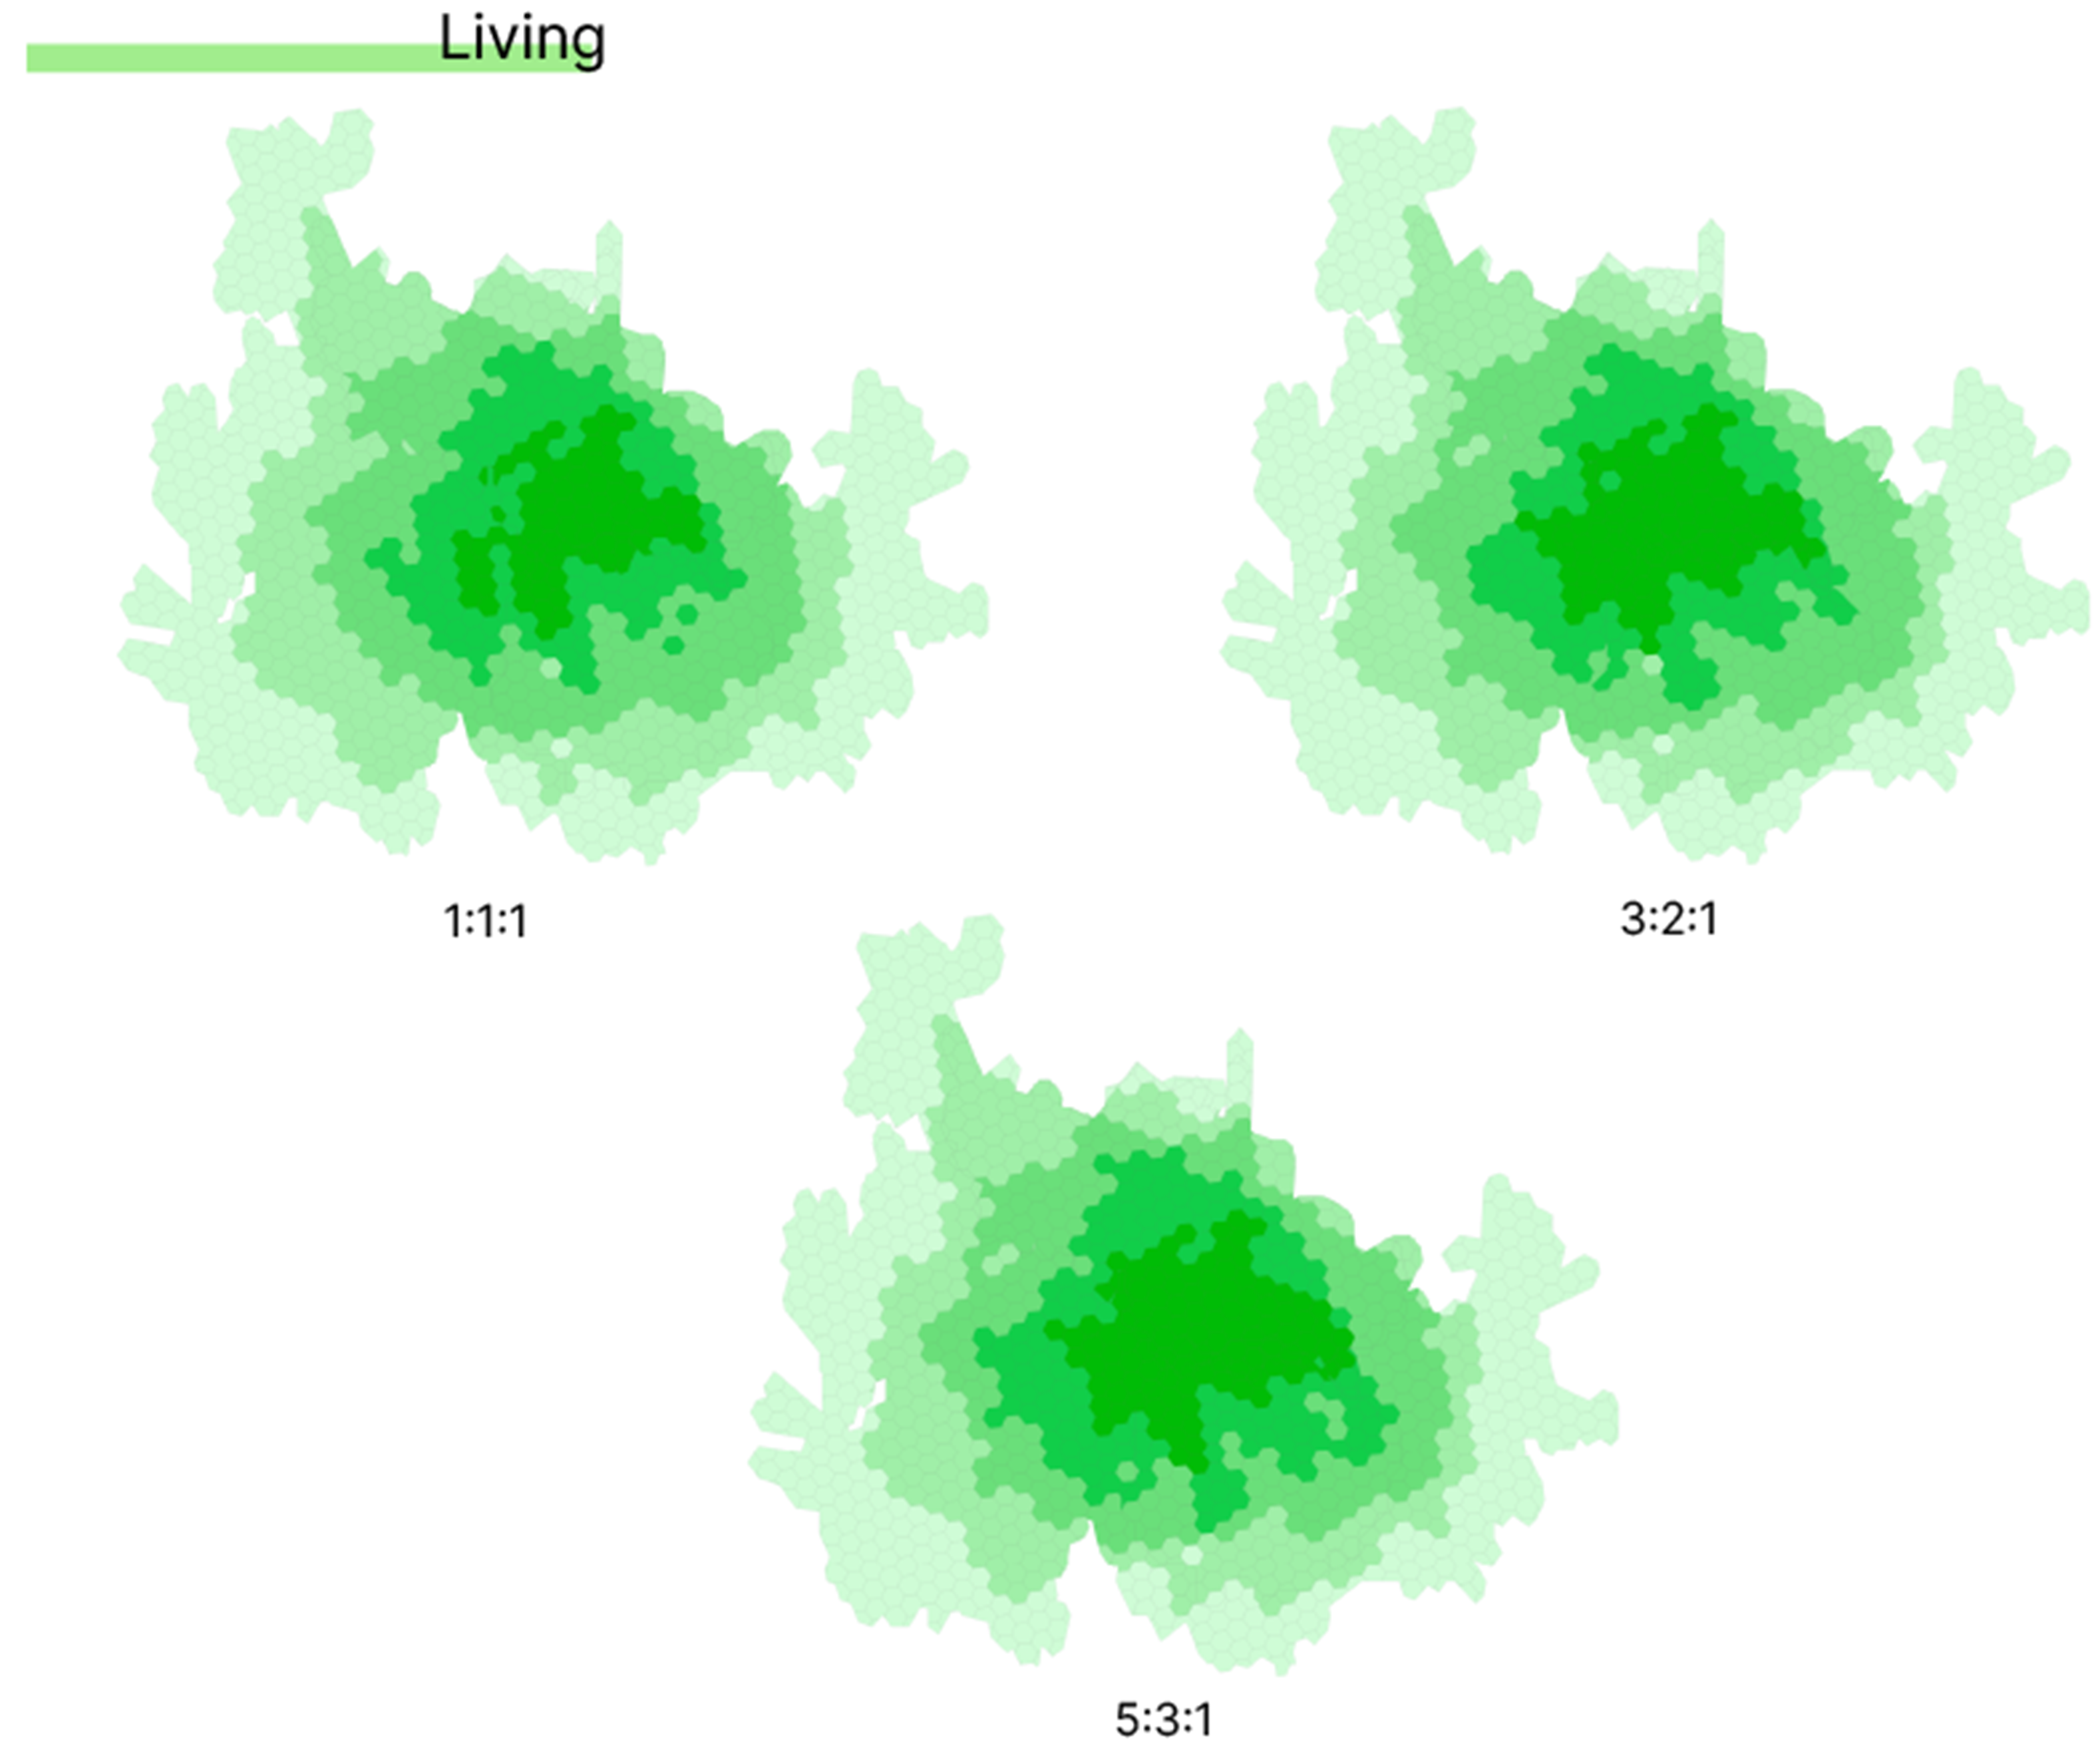
In the subsequent phase, the 1:1:1, 3:2:1, and 5:3:1 weighting specifications were applied to each social function and to the overall neighbourhood assessment.
Within the living category (Figure 14), public transport accessibility is primarily supported by the bus network, which comprises 79 stops distributed throughout the neighbourhood. By contrast, the metro line is located along the north-eastern boundary of the study area. Consequently, more than half of the neighbourhood lies beyond a 15-minute walking distance from a metro station. The presence of only one nursing home also indicates the limited representation of residential care services within the mapped POI dataset. These findings reveal an uneven internal composition of the living function: bus services provide comparatively broad spatial coverage, whereas access to metro stations and nursing homes remains more spatially restricted.
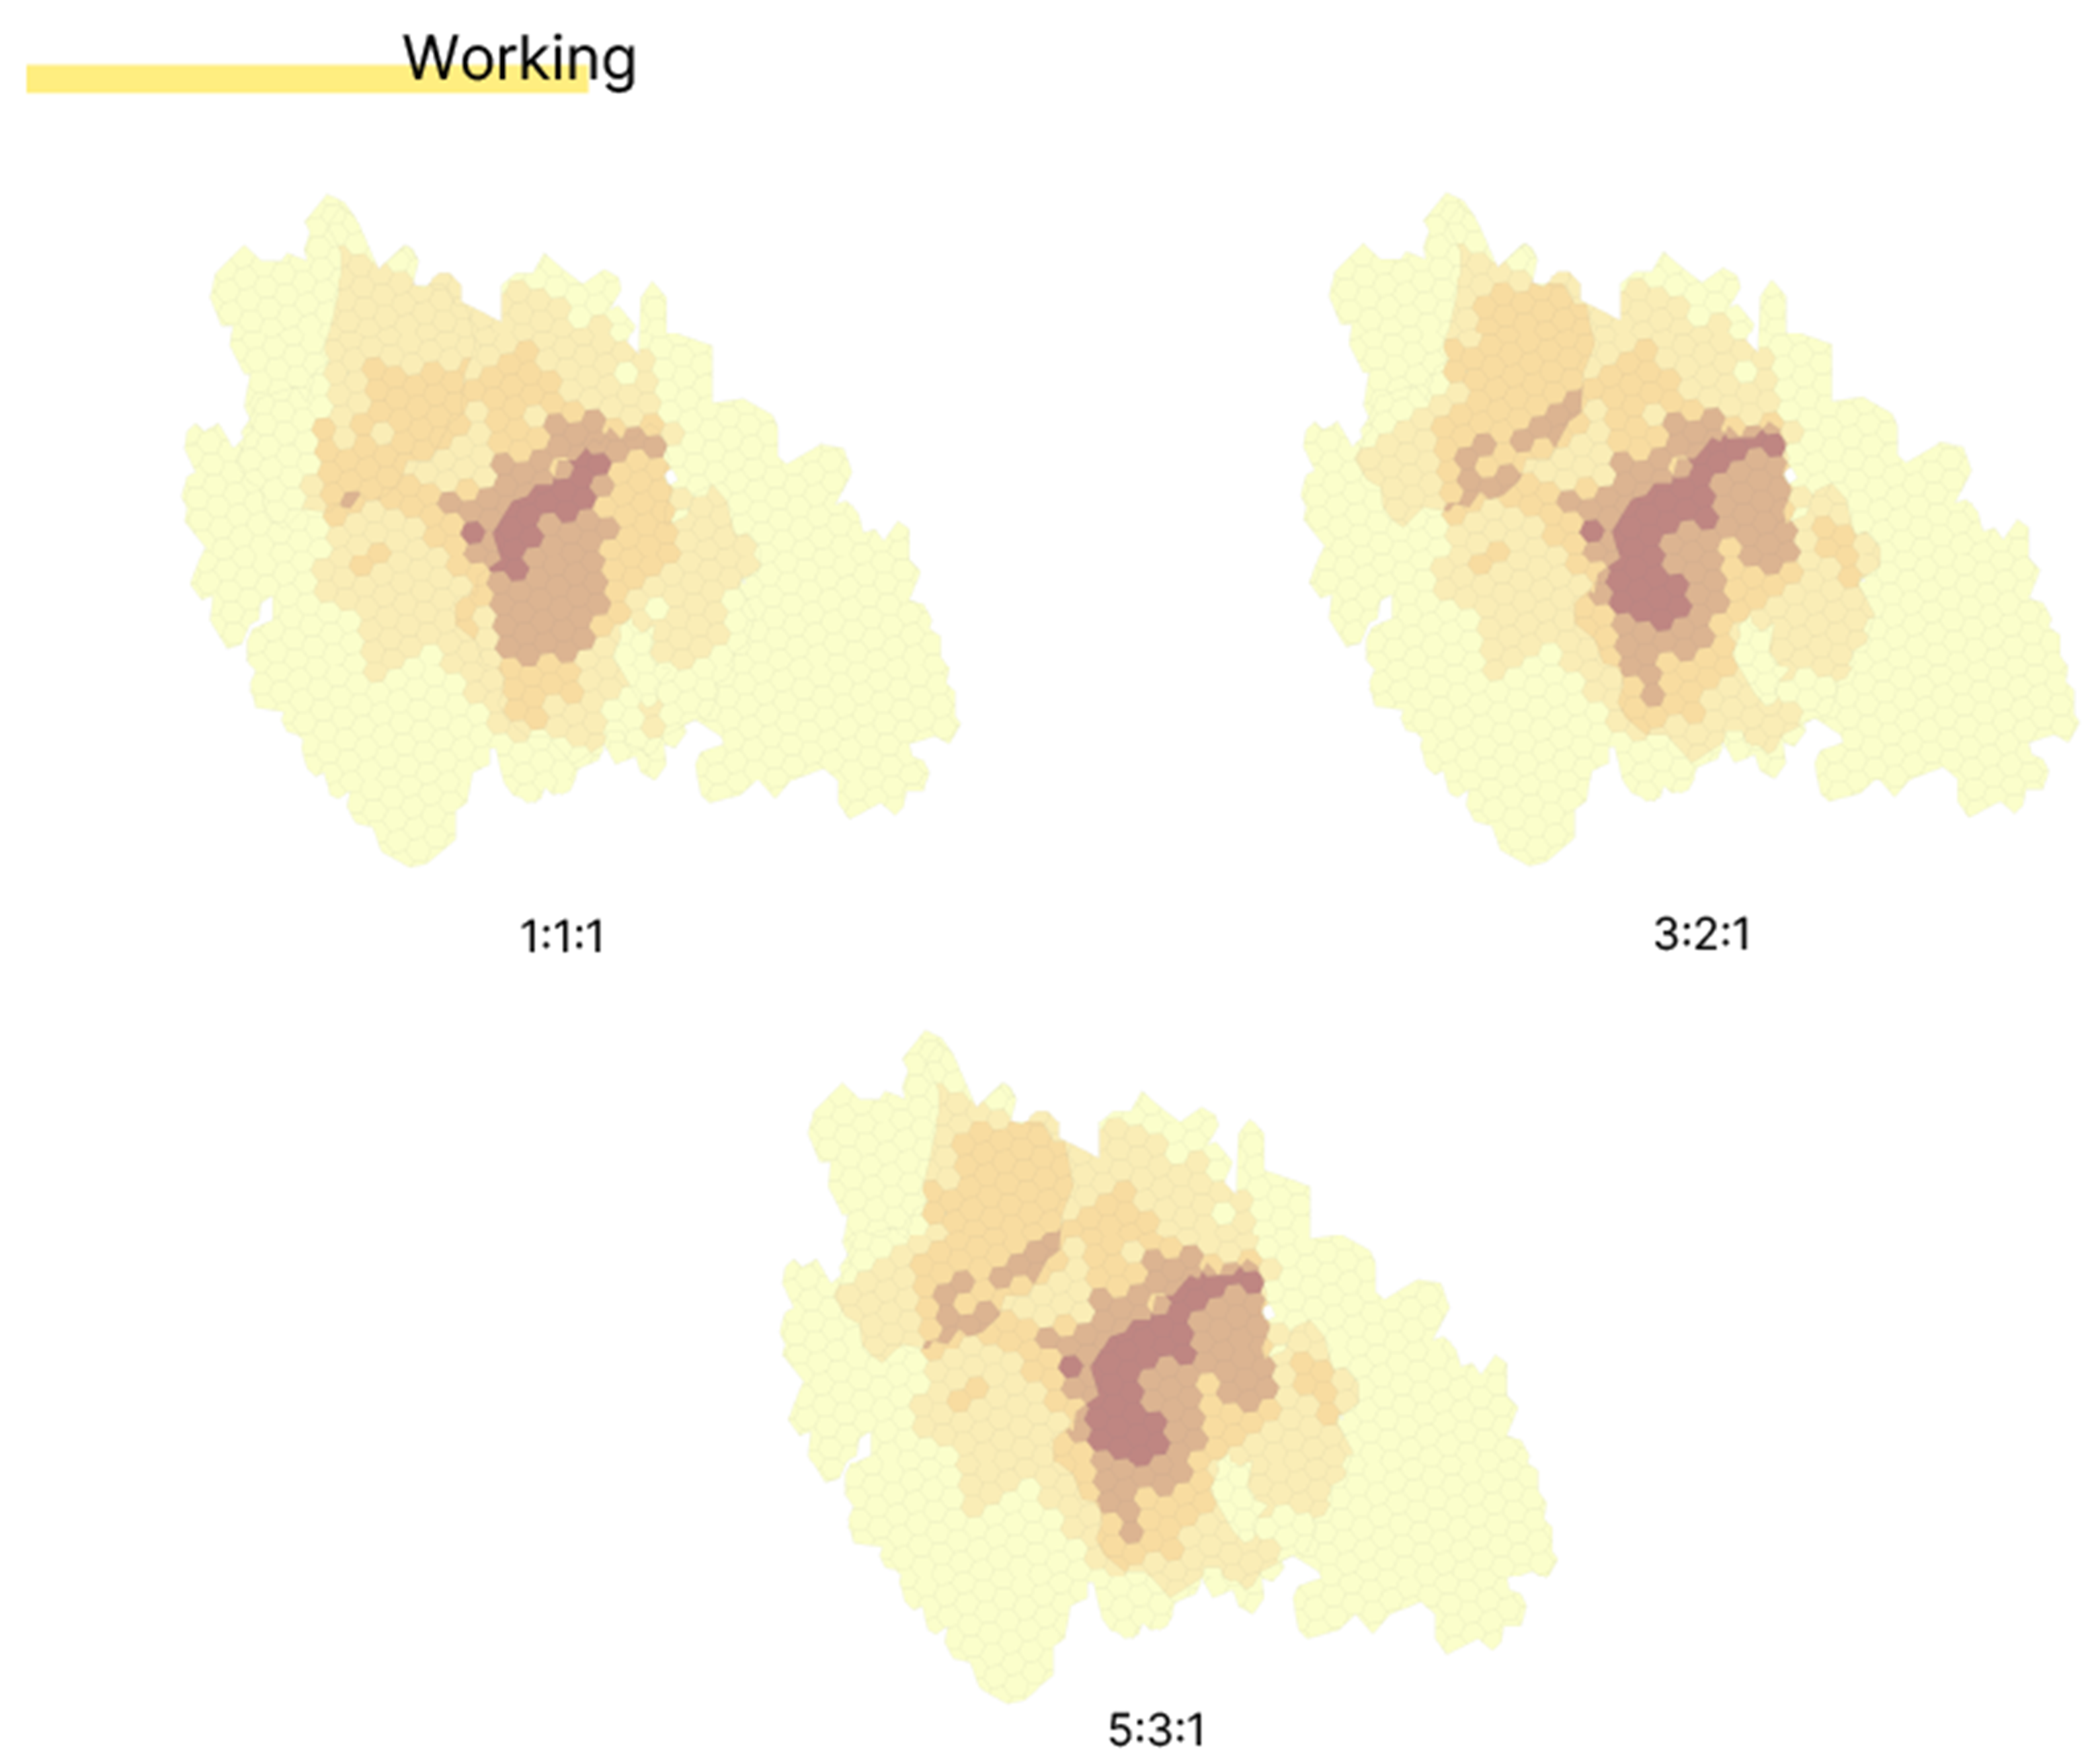
The working function is the least represented among the seven social functions examined in the study, comprising only two amenity types: offices and childcare centres (Figure 15). The mapped POI inventory also indicates a lack of co-working spaces, corporate offices, and other employment-related facilities within the Berceni neighbourhood. The spatial accessibility patterns remain largely unchanged across the 1:1:1, 3:2:1, and 5:3:1 weighting specifications. This stability results from the limited number and distribution of amenities assigned to the working function, which restrict the extent to which alternative proximity weights can modify the resulting accessibility surface.
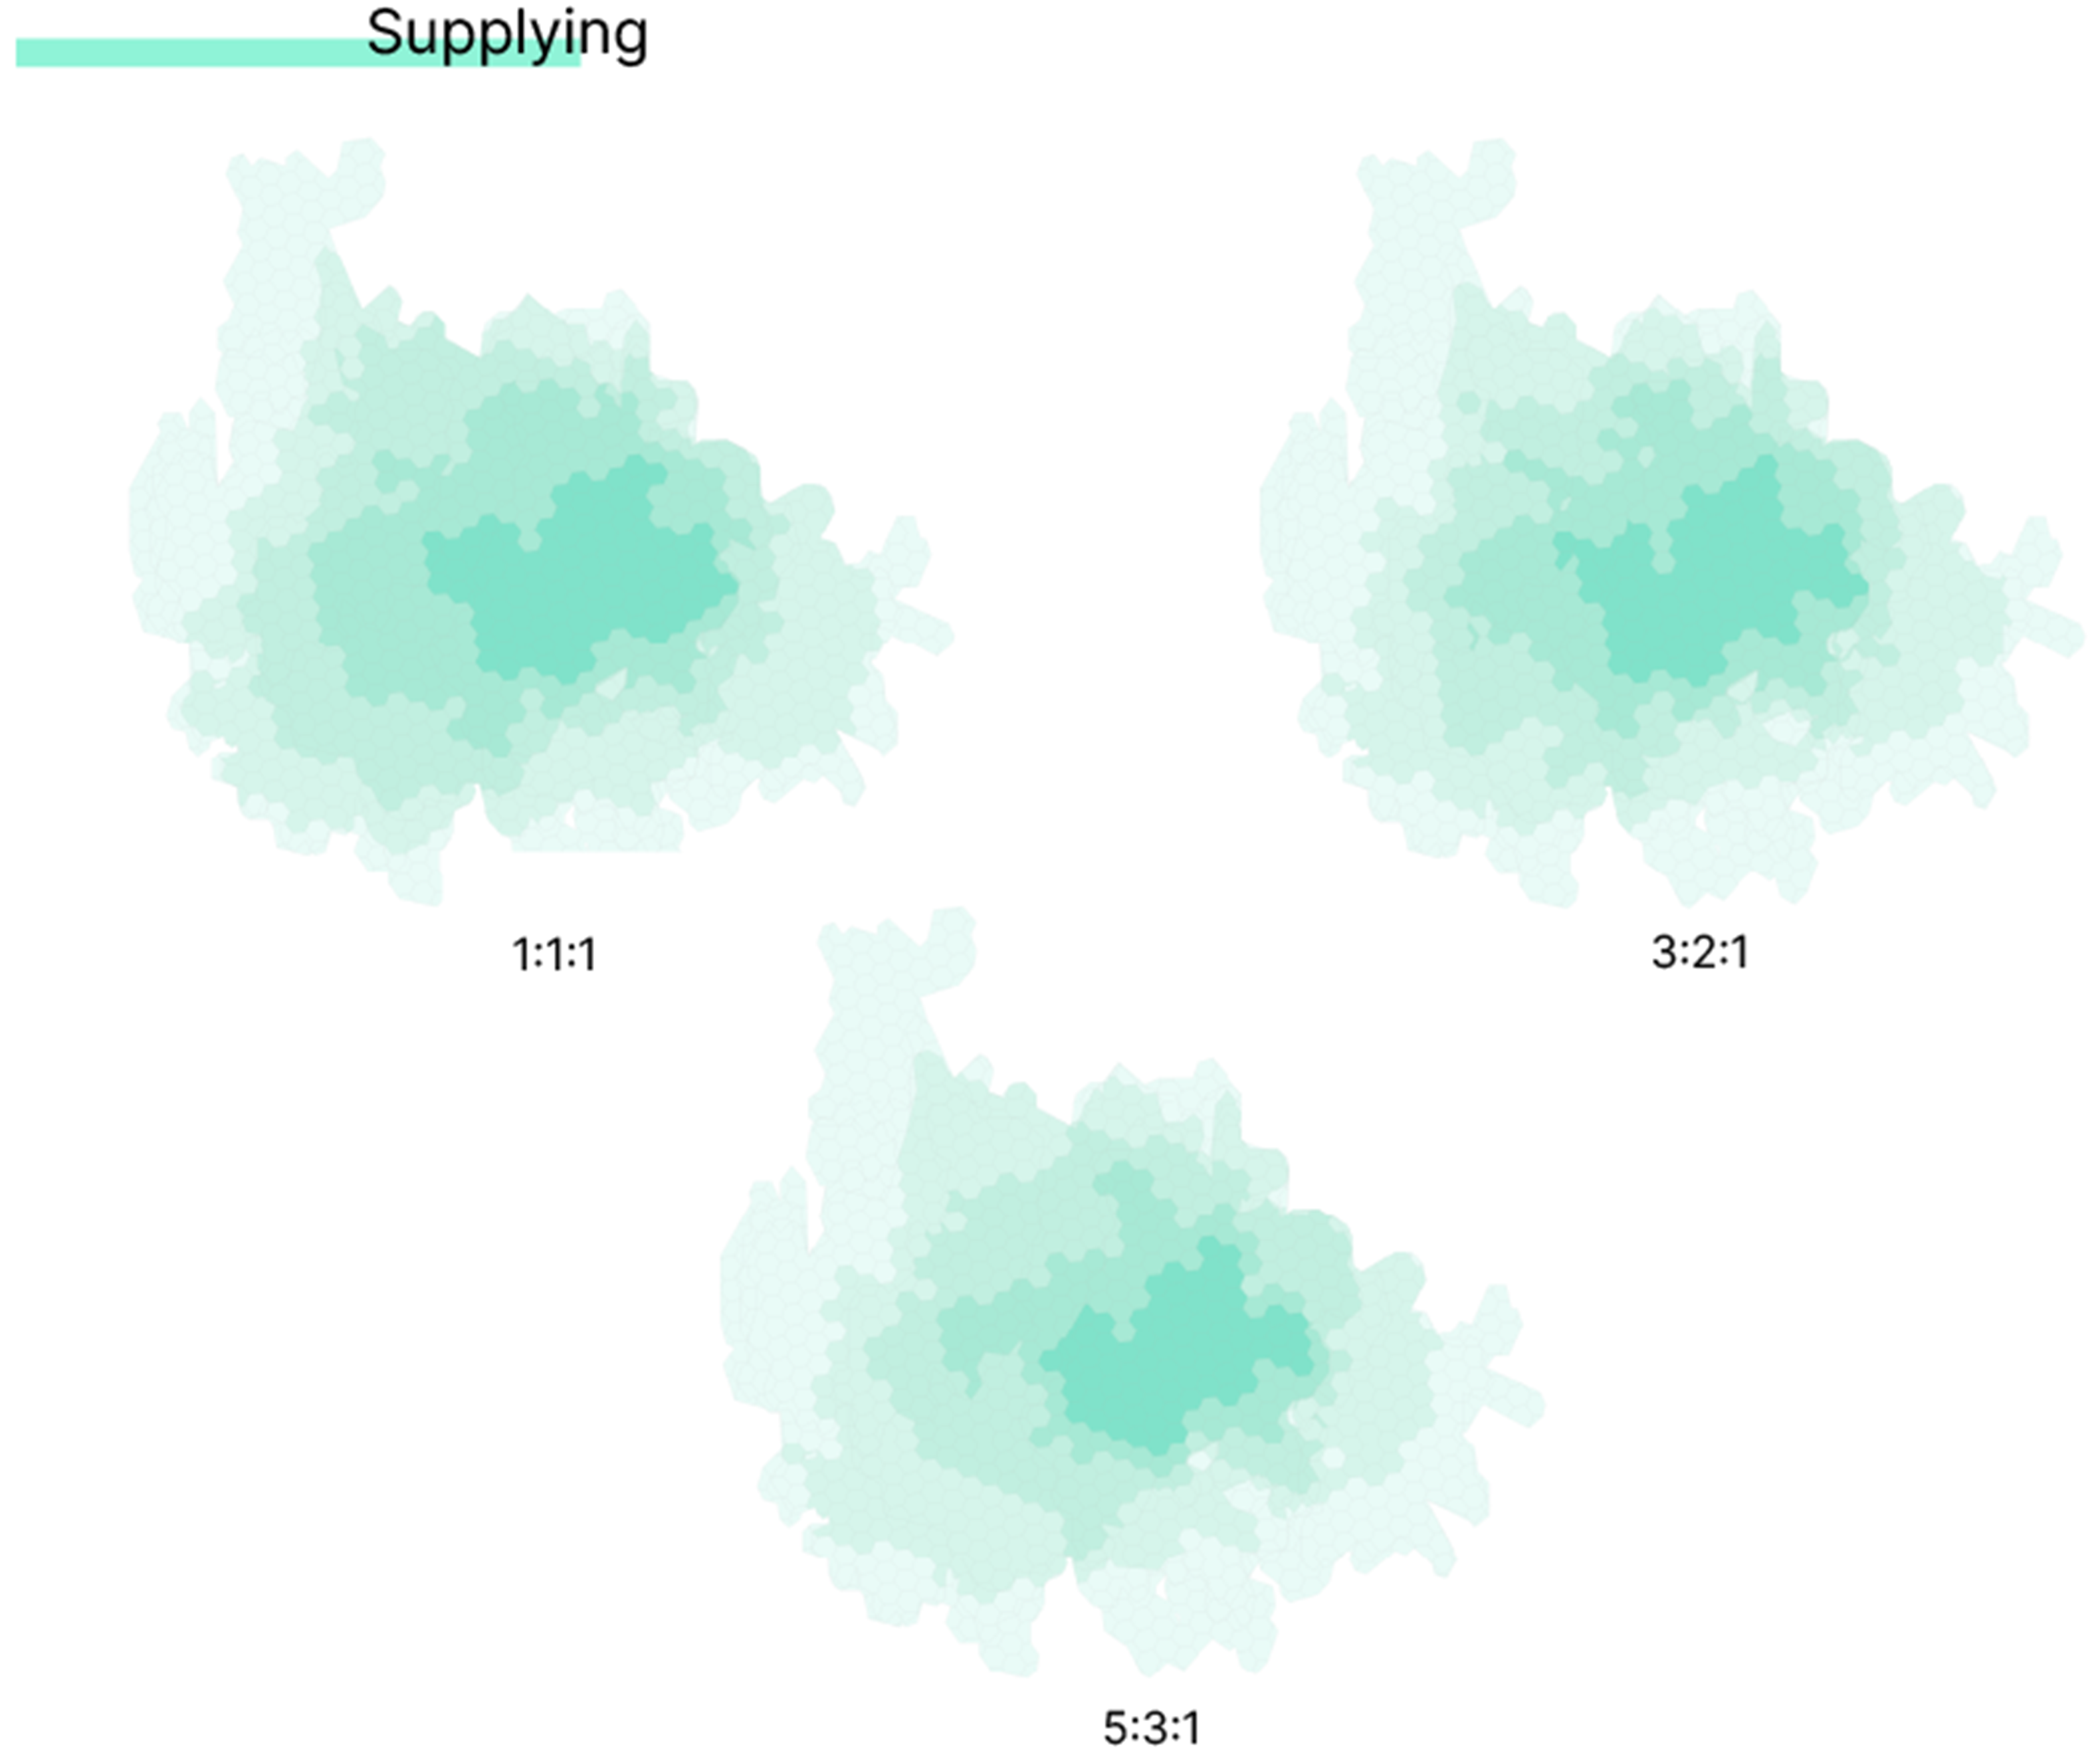
Amenities assigned to the supplying function are distributed relatively evenly across the study area (Figure 16), although their density gradually decreases towards the neighbourhood boundaries. Supermarkets and bakeries are particularly well represented in the mapped dataset and contribute substantially to the spatial coverage of this function. The three weighting specifications preserve the general distribution pattern, while producing limited local variations depending on the proximity level assigned to each amenity type.
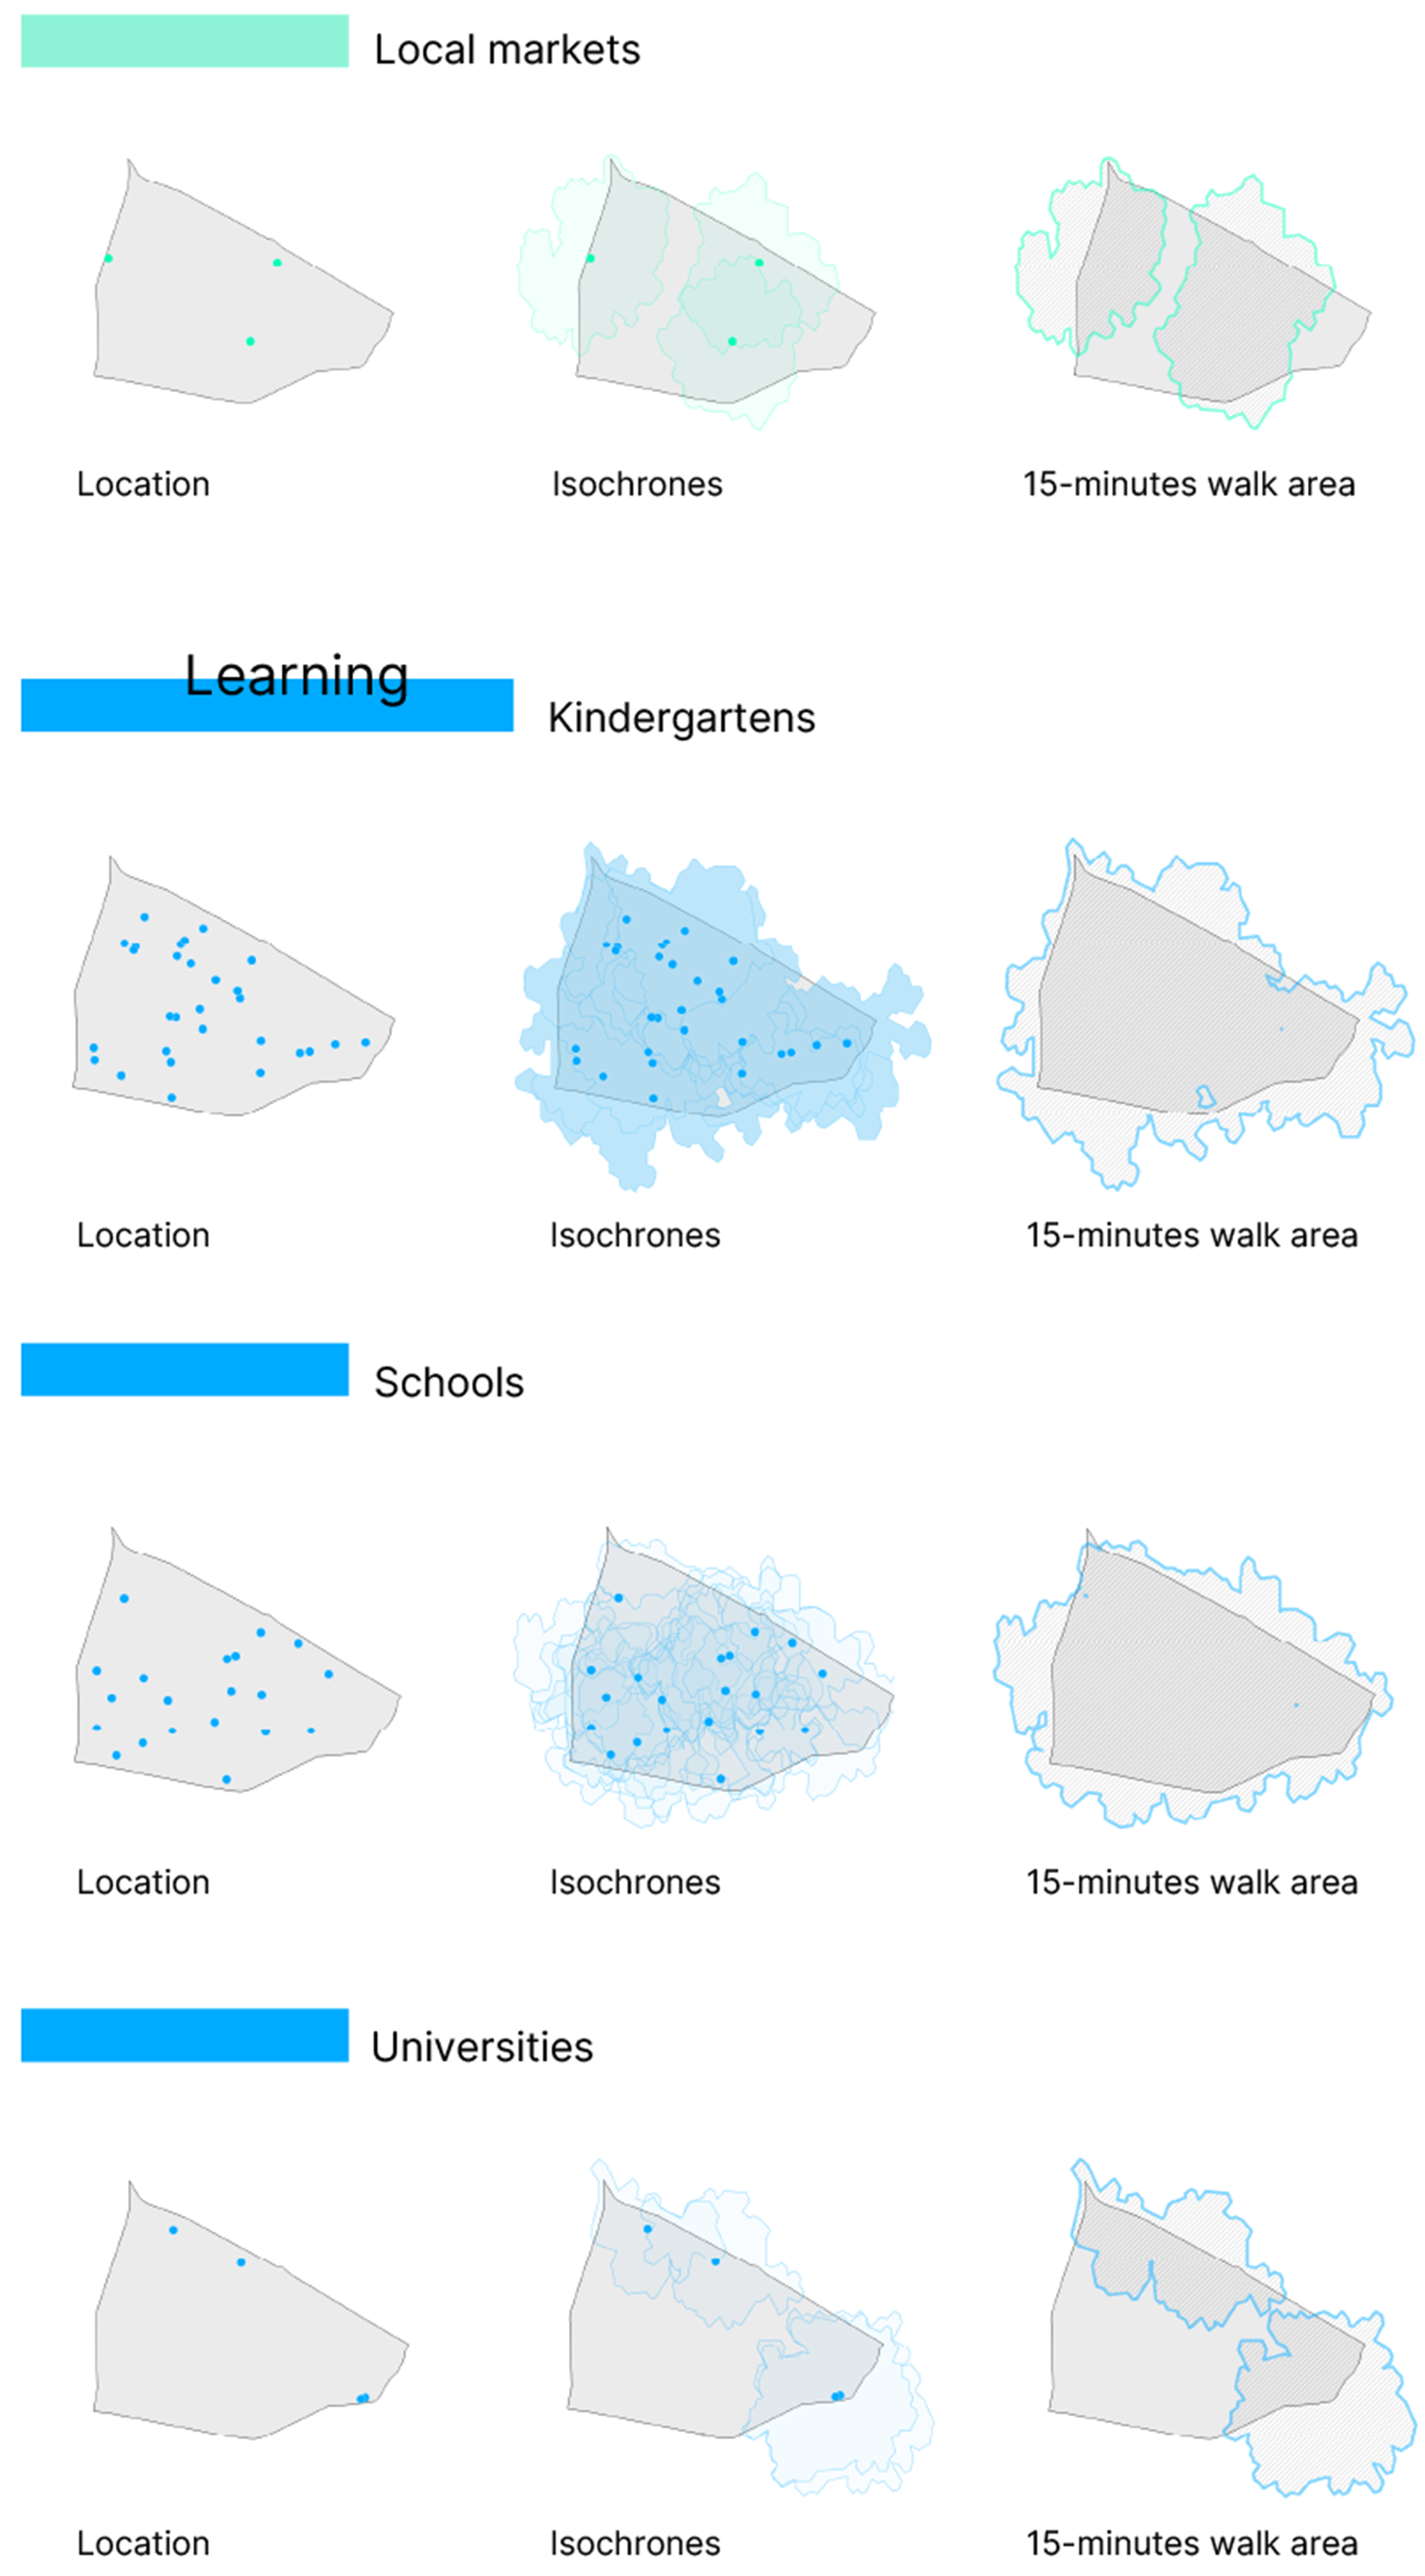
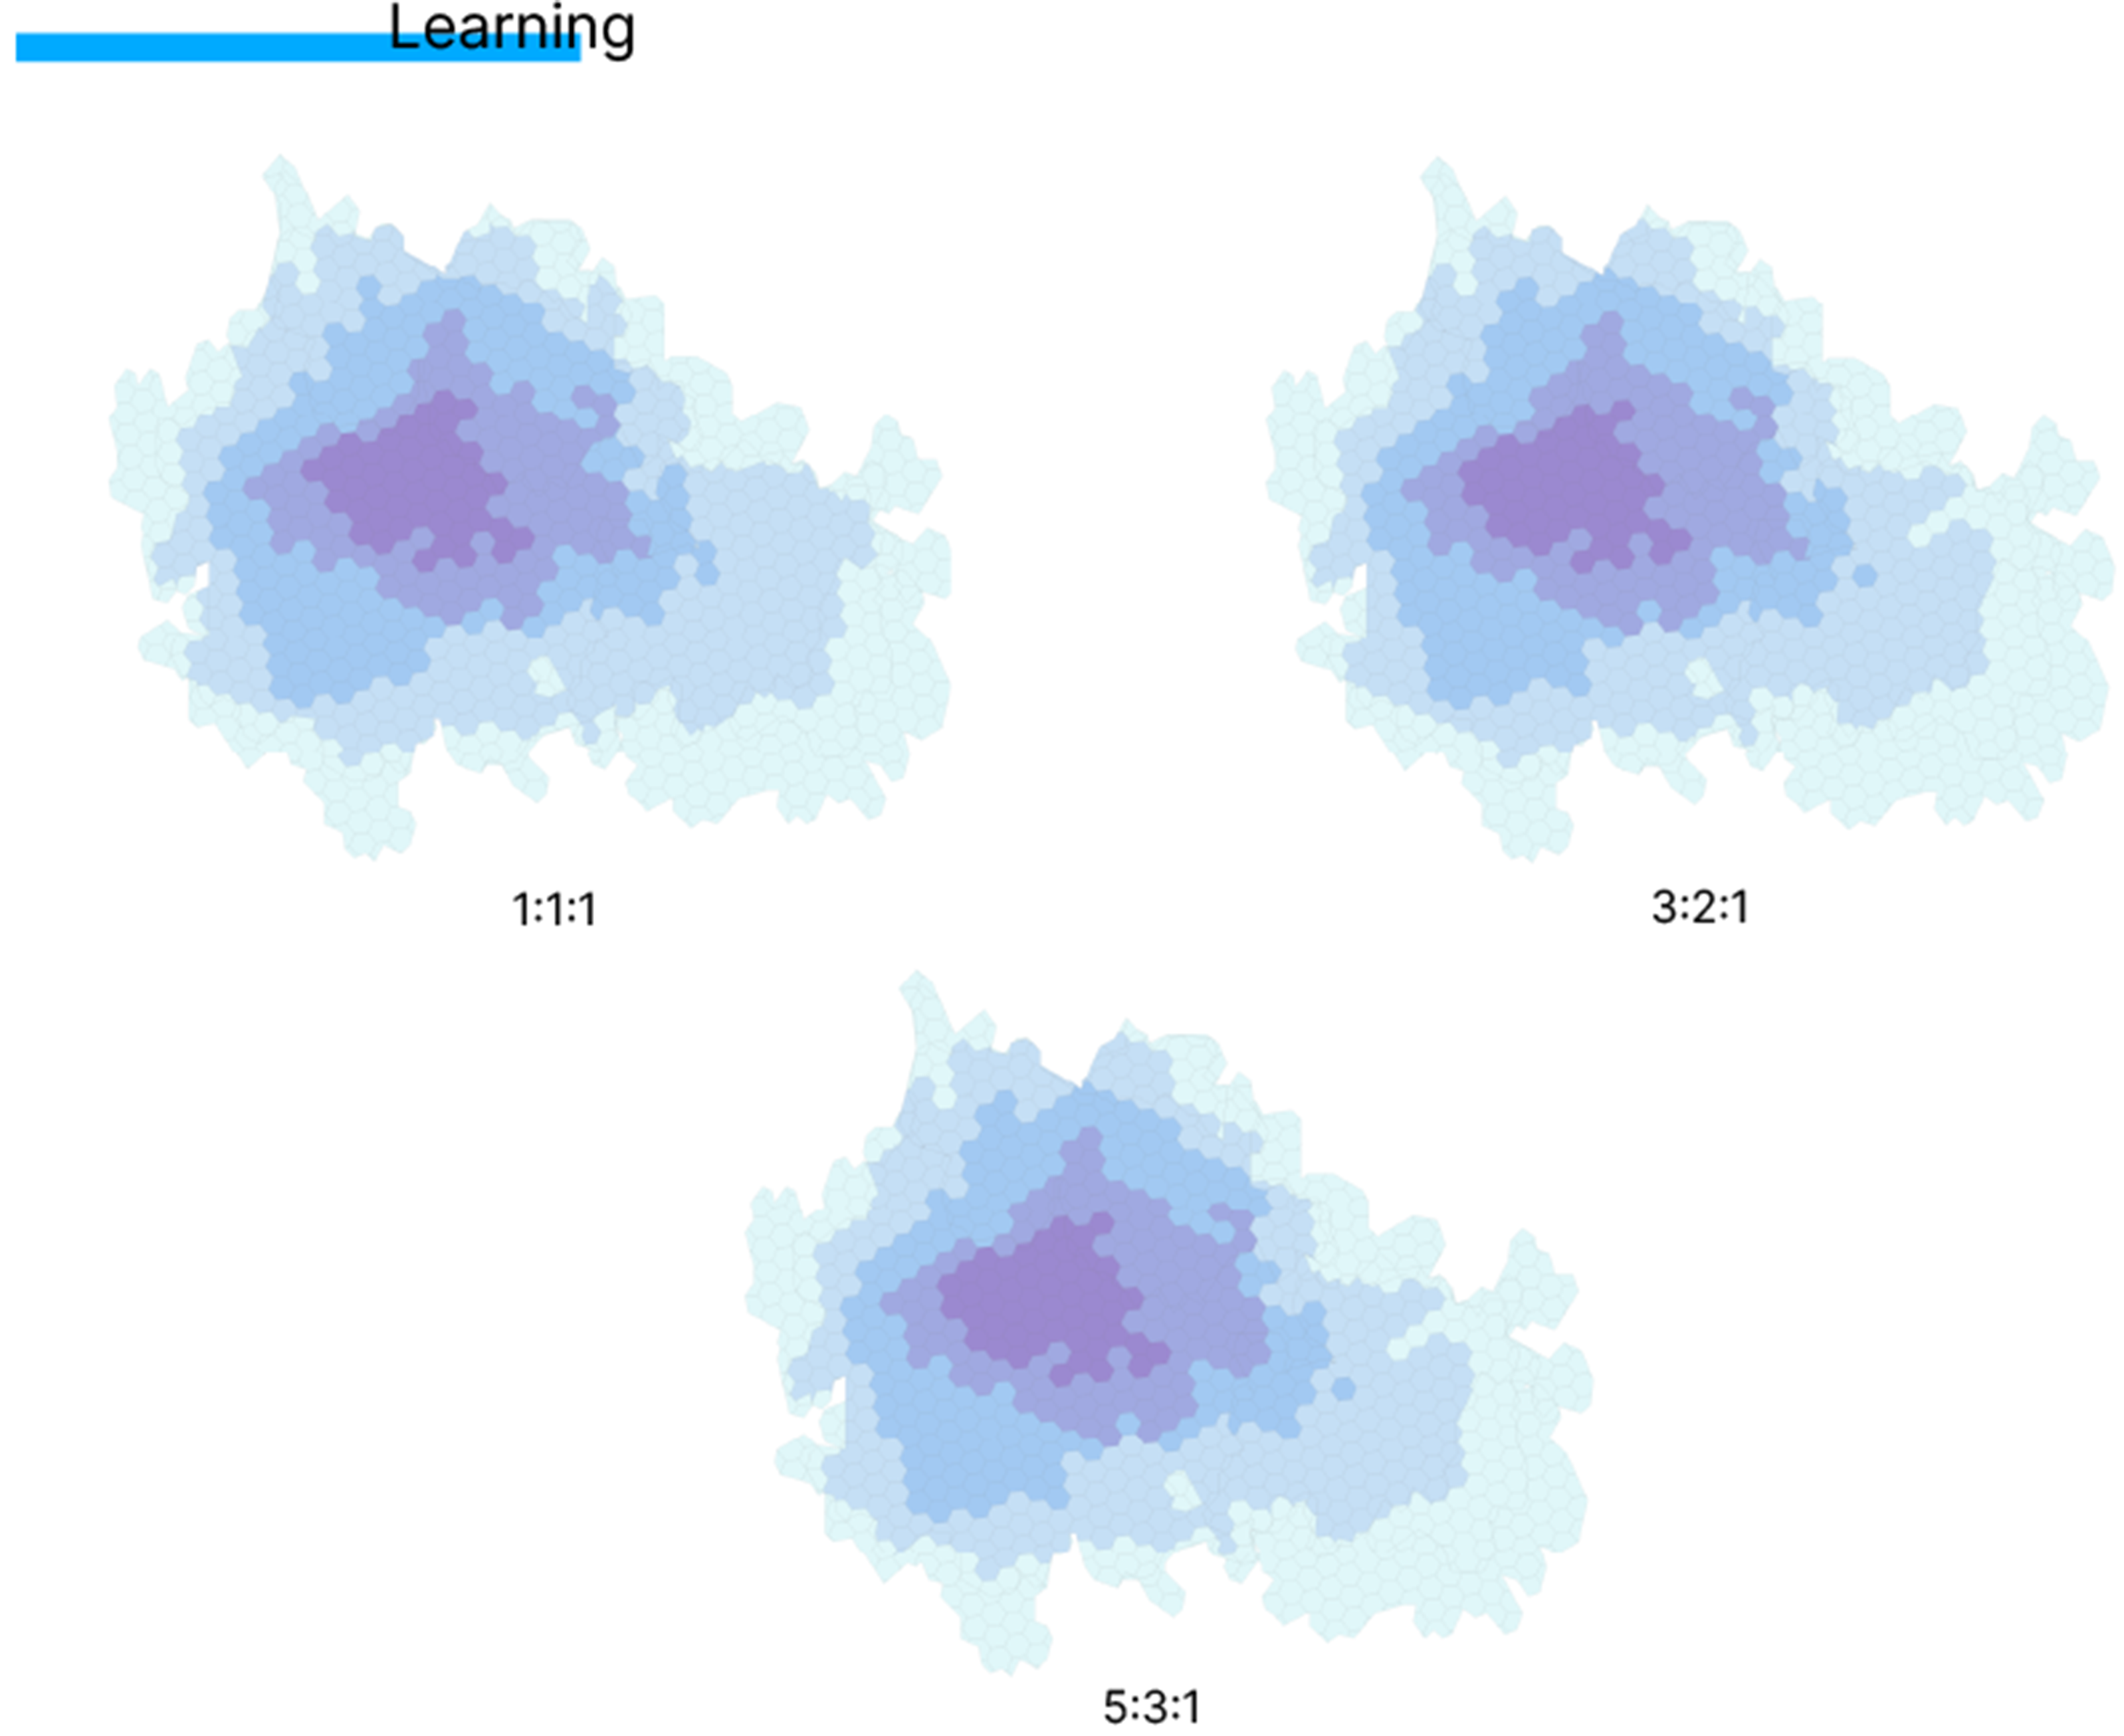
For the learning function, the highest accessibility values are concentrated in the central-western part of the study area (Figure 17), representing a spatial shift from the principal concentrations identified for the preceding functions. Kindergartens and primary and secondary schools are comparatively well represented in the mapped POI inventory, whereas higher-education facilities are limited in number. Moreover, the universities identified within the study area are privately operated institutions. Consequently, access to a broader range of higher-education opportunities may require travel beyond the neighbourhood and cannot generally be achieved within the modelled 15-minute walking threshold. The comparison of the 1:1:1, 3:2:1, and 5:3:1 specifications further illustrates how the relative prioritisation of kindergartens, schools, and universities influences the local distribution of learning-accessibility scores.
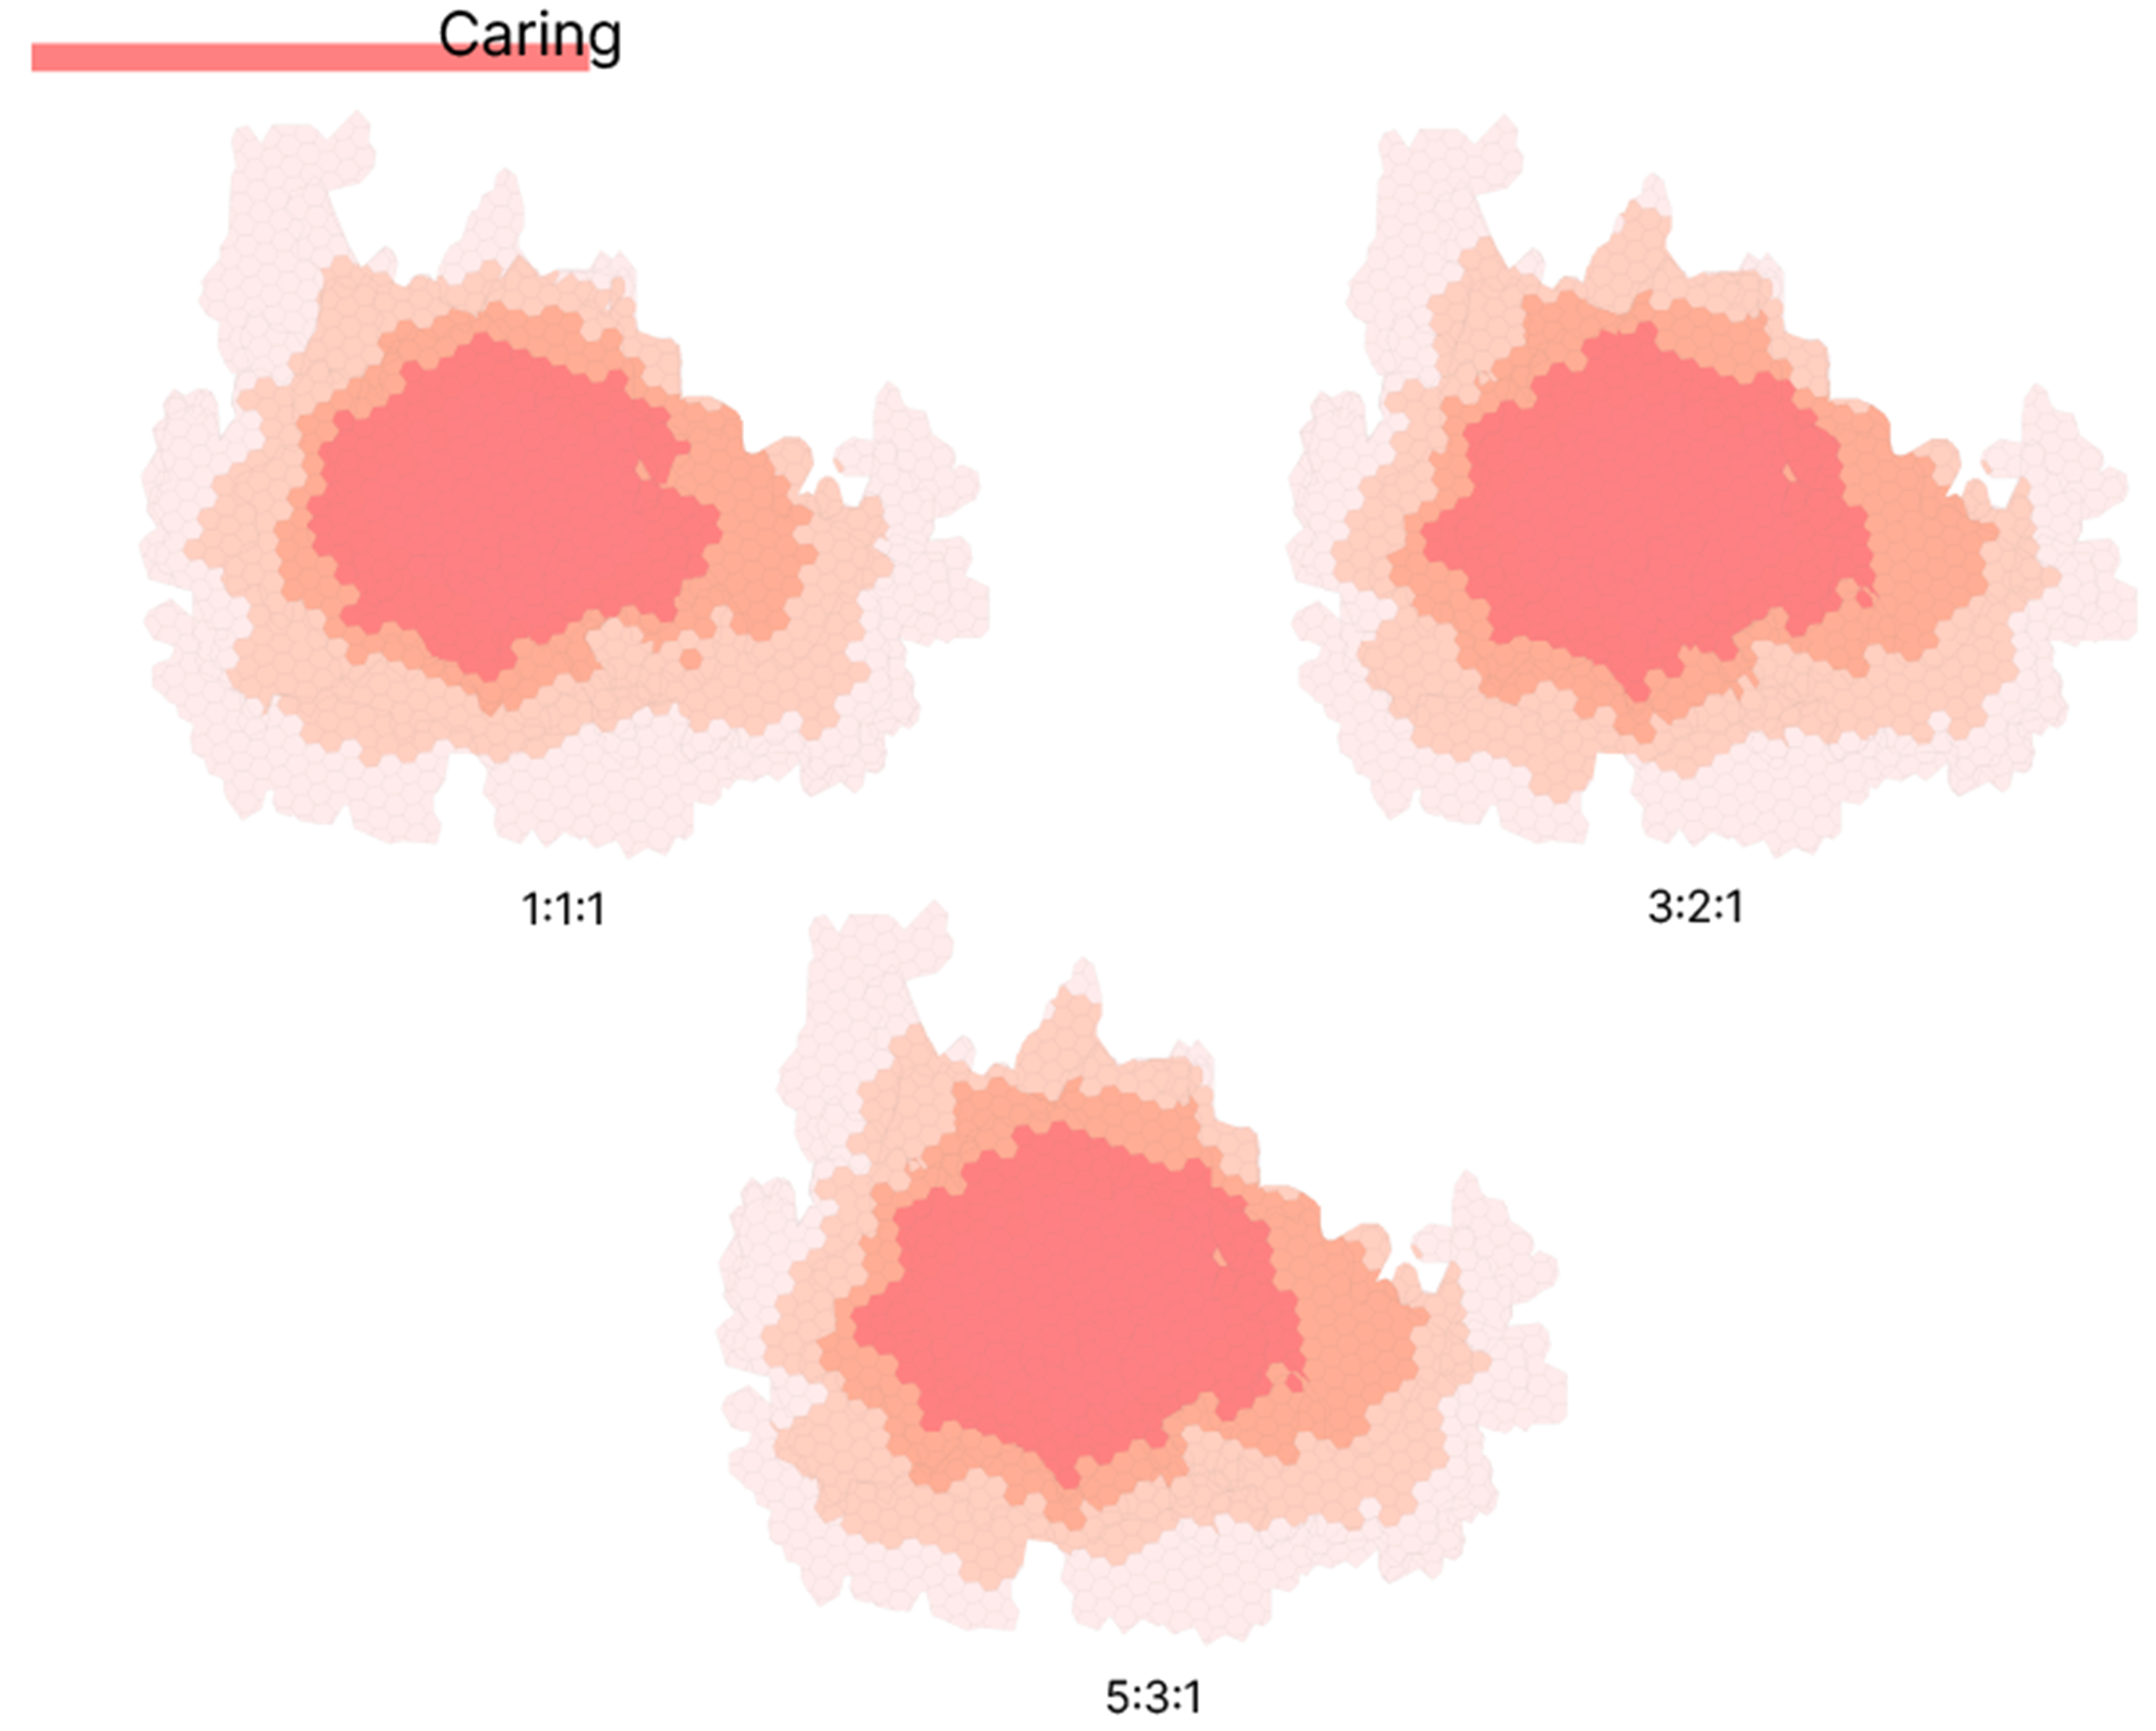
Among the social functions examined, caring has the largest number of mapped amenities, comprising 70 pharmacies, 29 dental practices, 13 medical clinics, 11 doctors’ offices, and five hospitals (Figure 18). The corresponding high-accessibility area is more extensive than those identified for the other social functions. Under the alternative weighting specifications, this area extends towards parts of the neighbourhood boundary, reflecting both the number and spatial distribution of the mapped healthcare-related amenities. The comparatively high caring scores reflect the number and spatial density of mapped amenities rather than facility capacity, service quality, opening hours, or the extent to which healthcare needs are met.
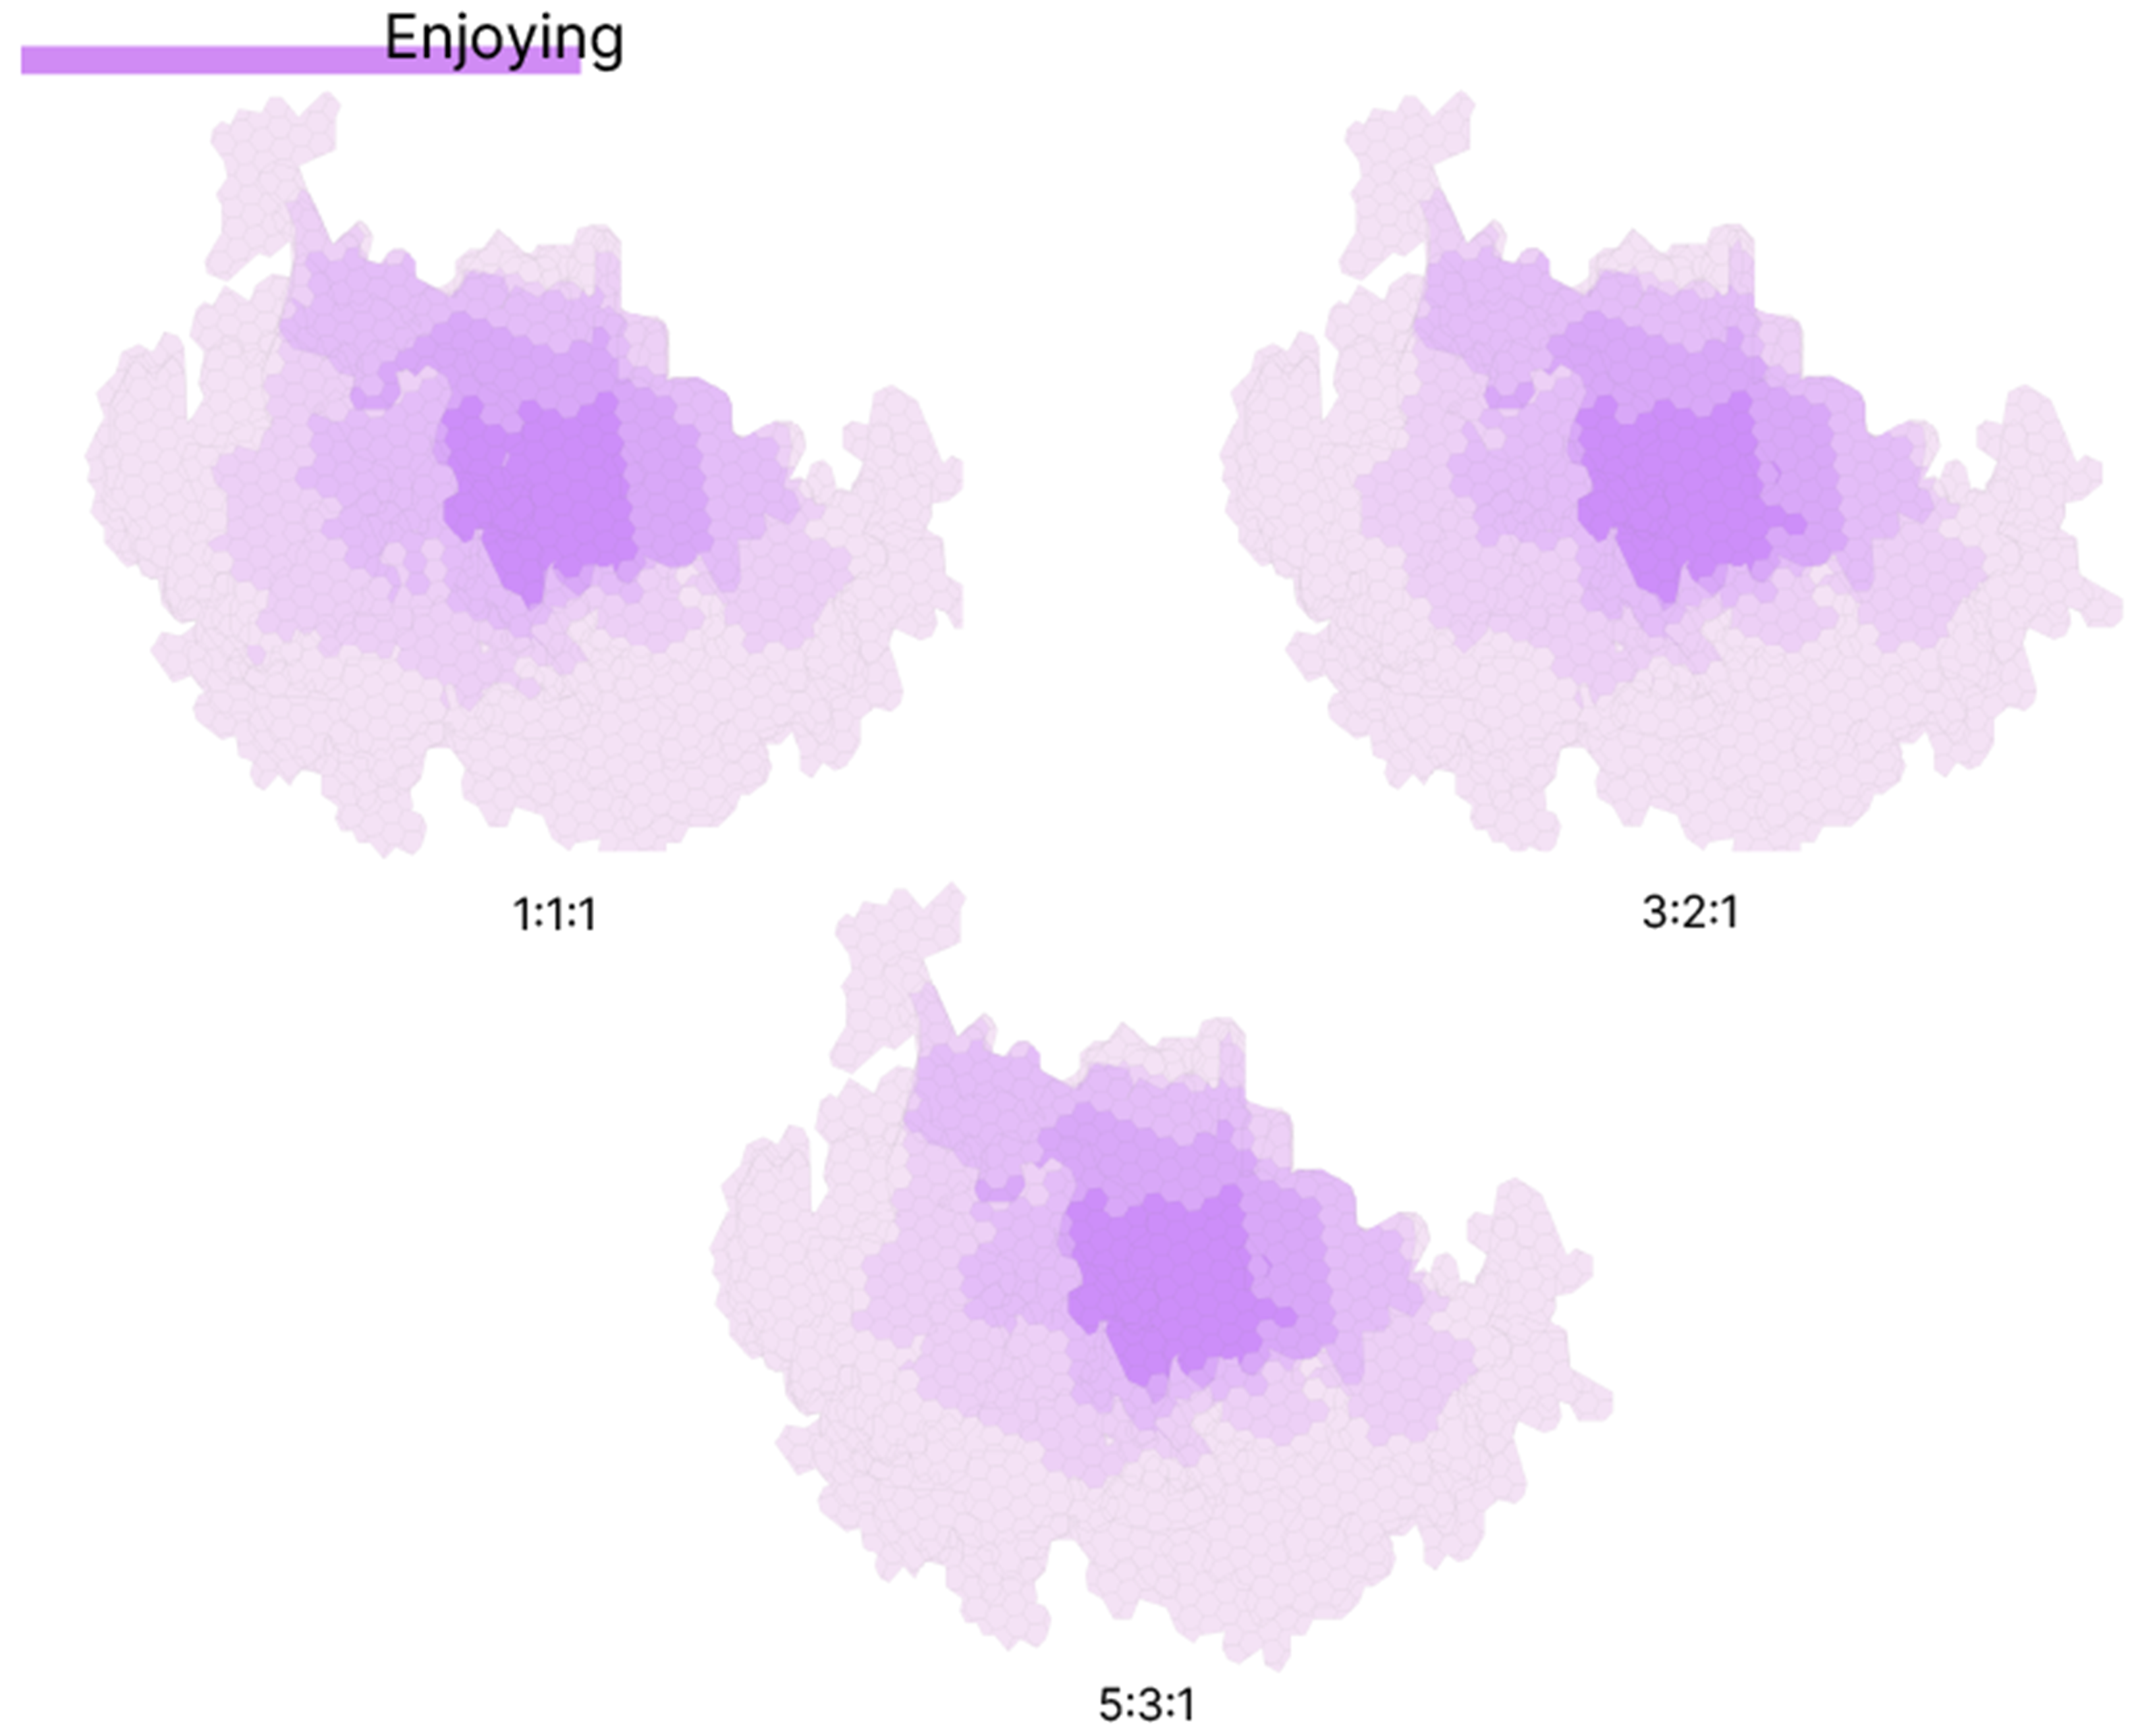
The enjoying function comprises a comparatively diverse range of amenities (Figure 19). Restaurants, cafés, and parks are widely represented in the mapped POI dataset, whereas cinemas, stadiums, and libraries occur less frequently. Although 31 parks were identified, many consist primarily of green spaces located adjacent to residential apartment blocks and contain few dedicated recreational facilities. Consequently, the number of mapped parks should not be interpreted as a direct indicator of the diversity or quality of recreational opportunities available within the neighbourhood.
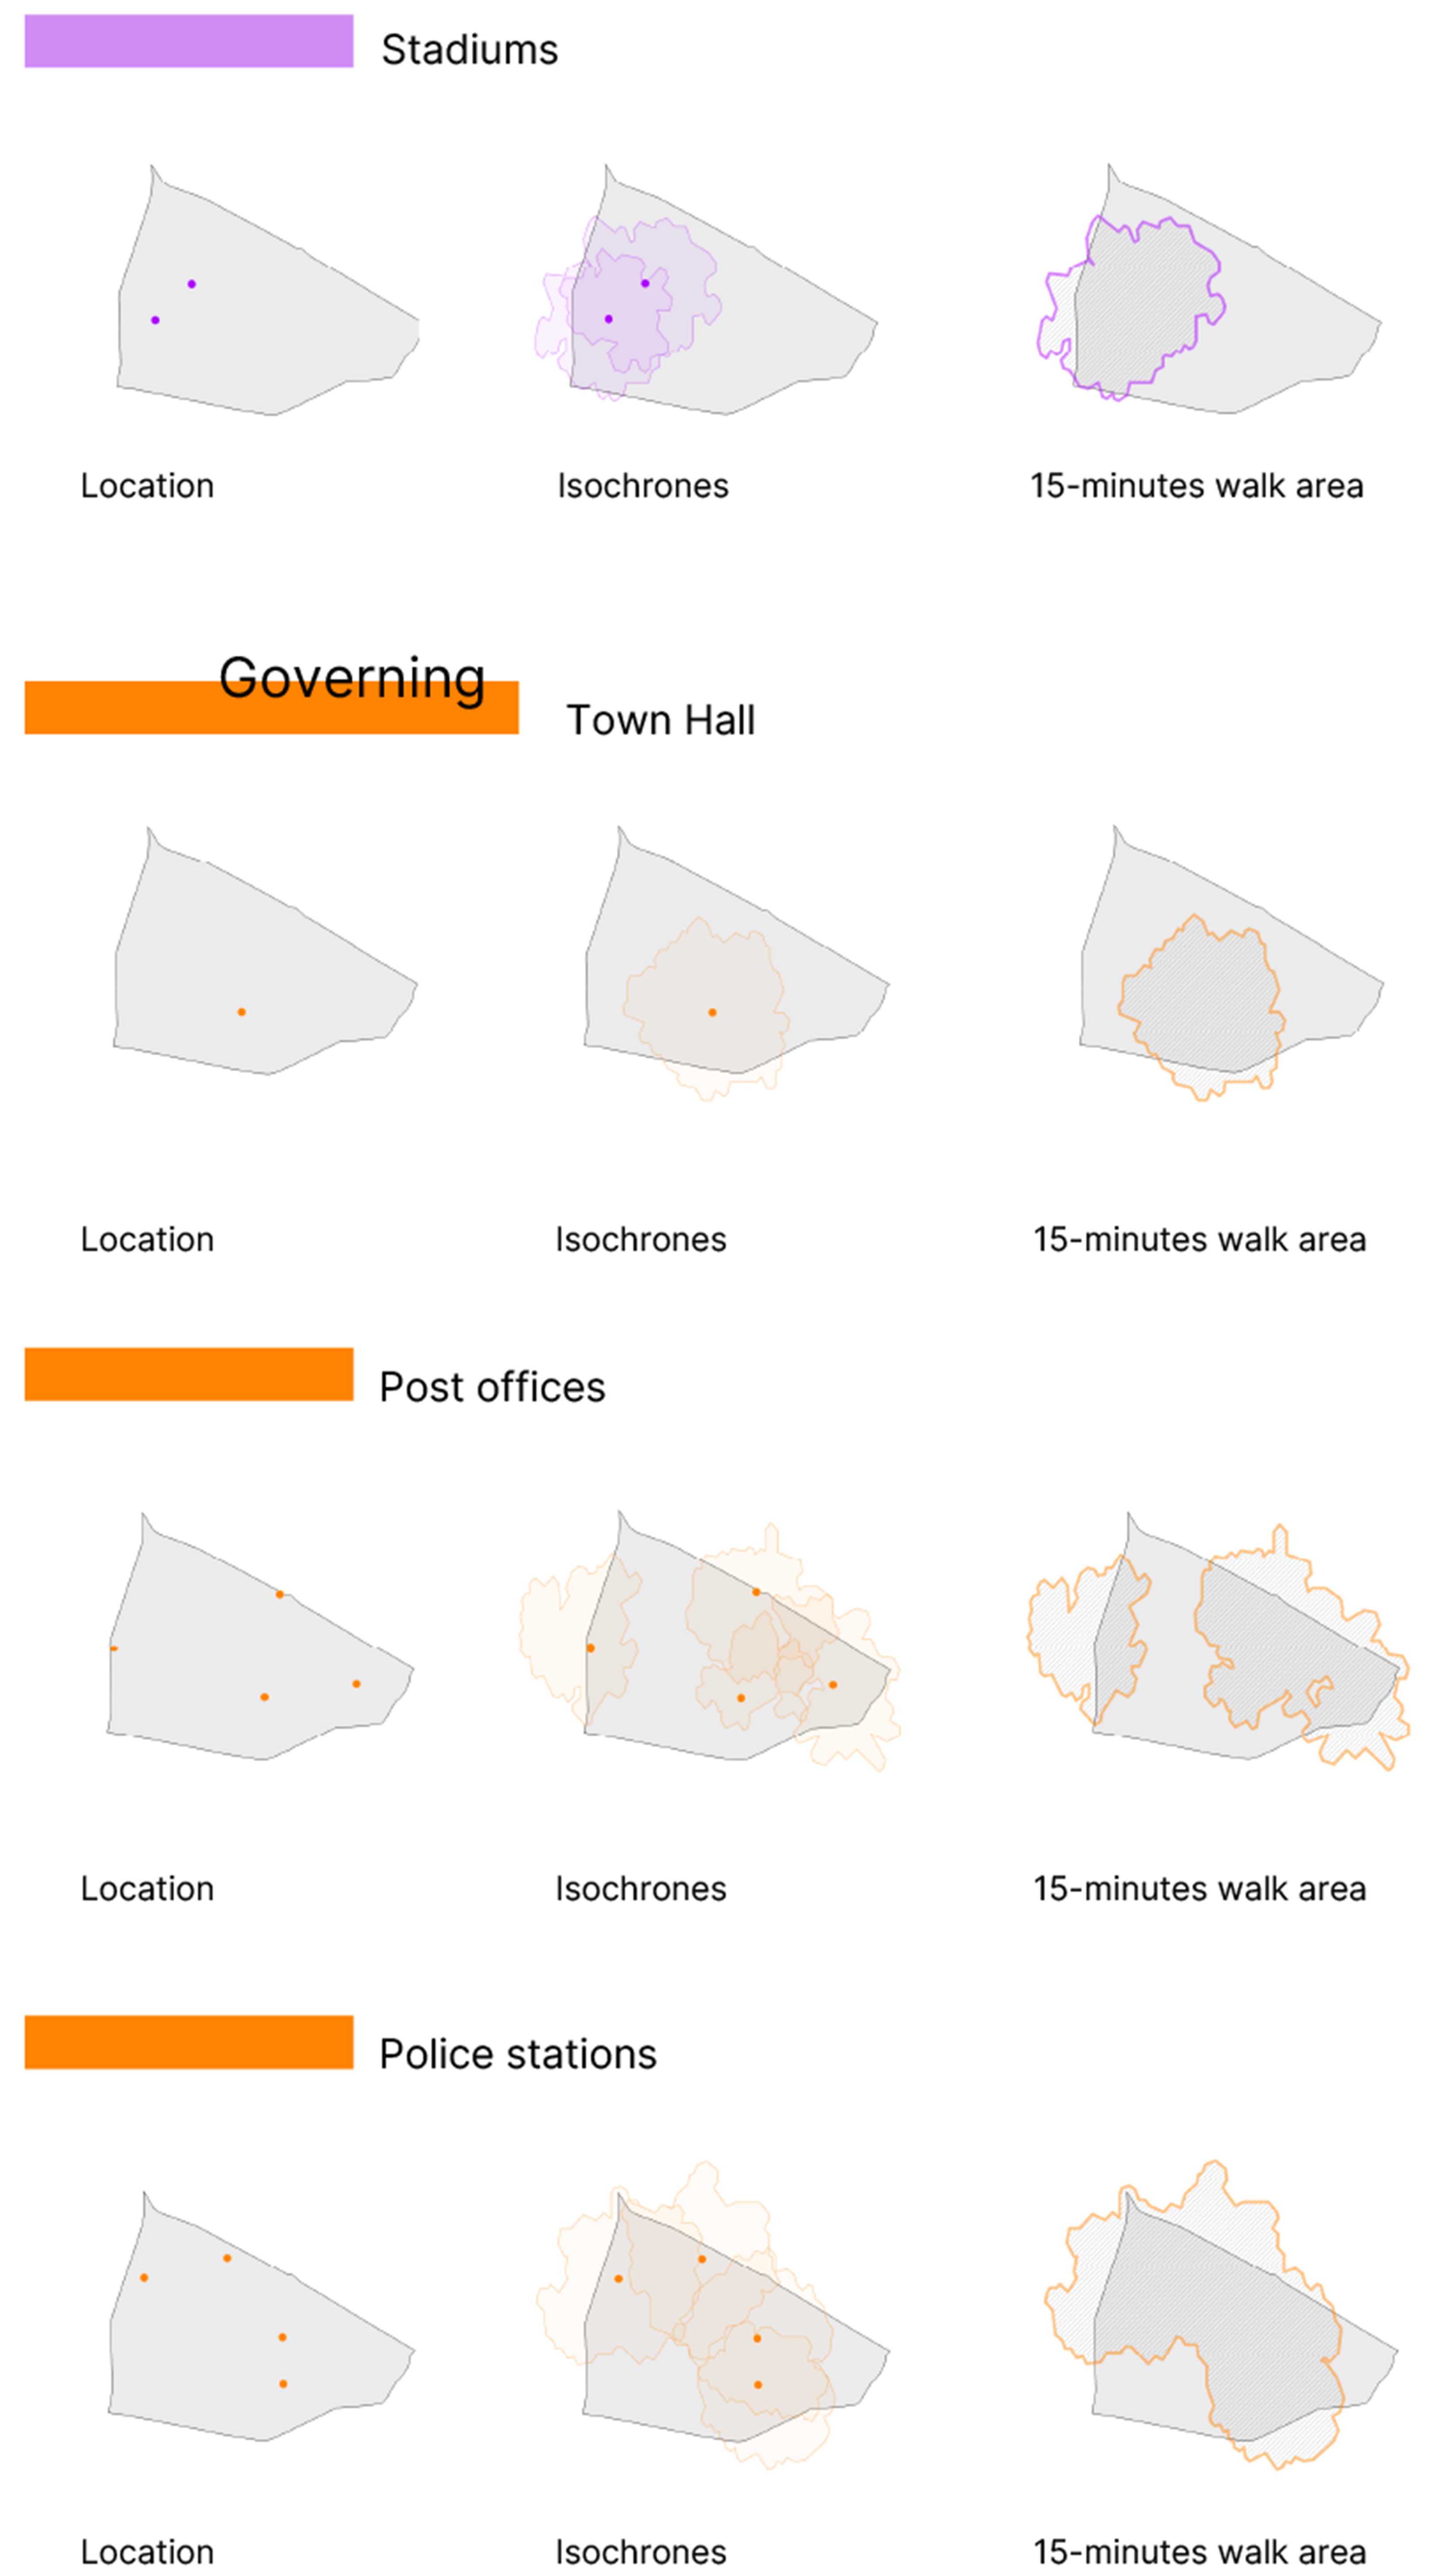
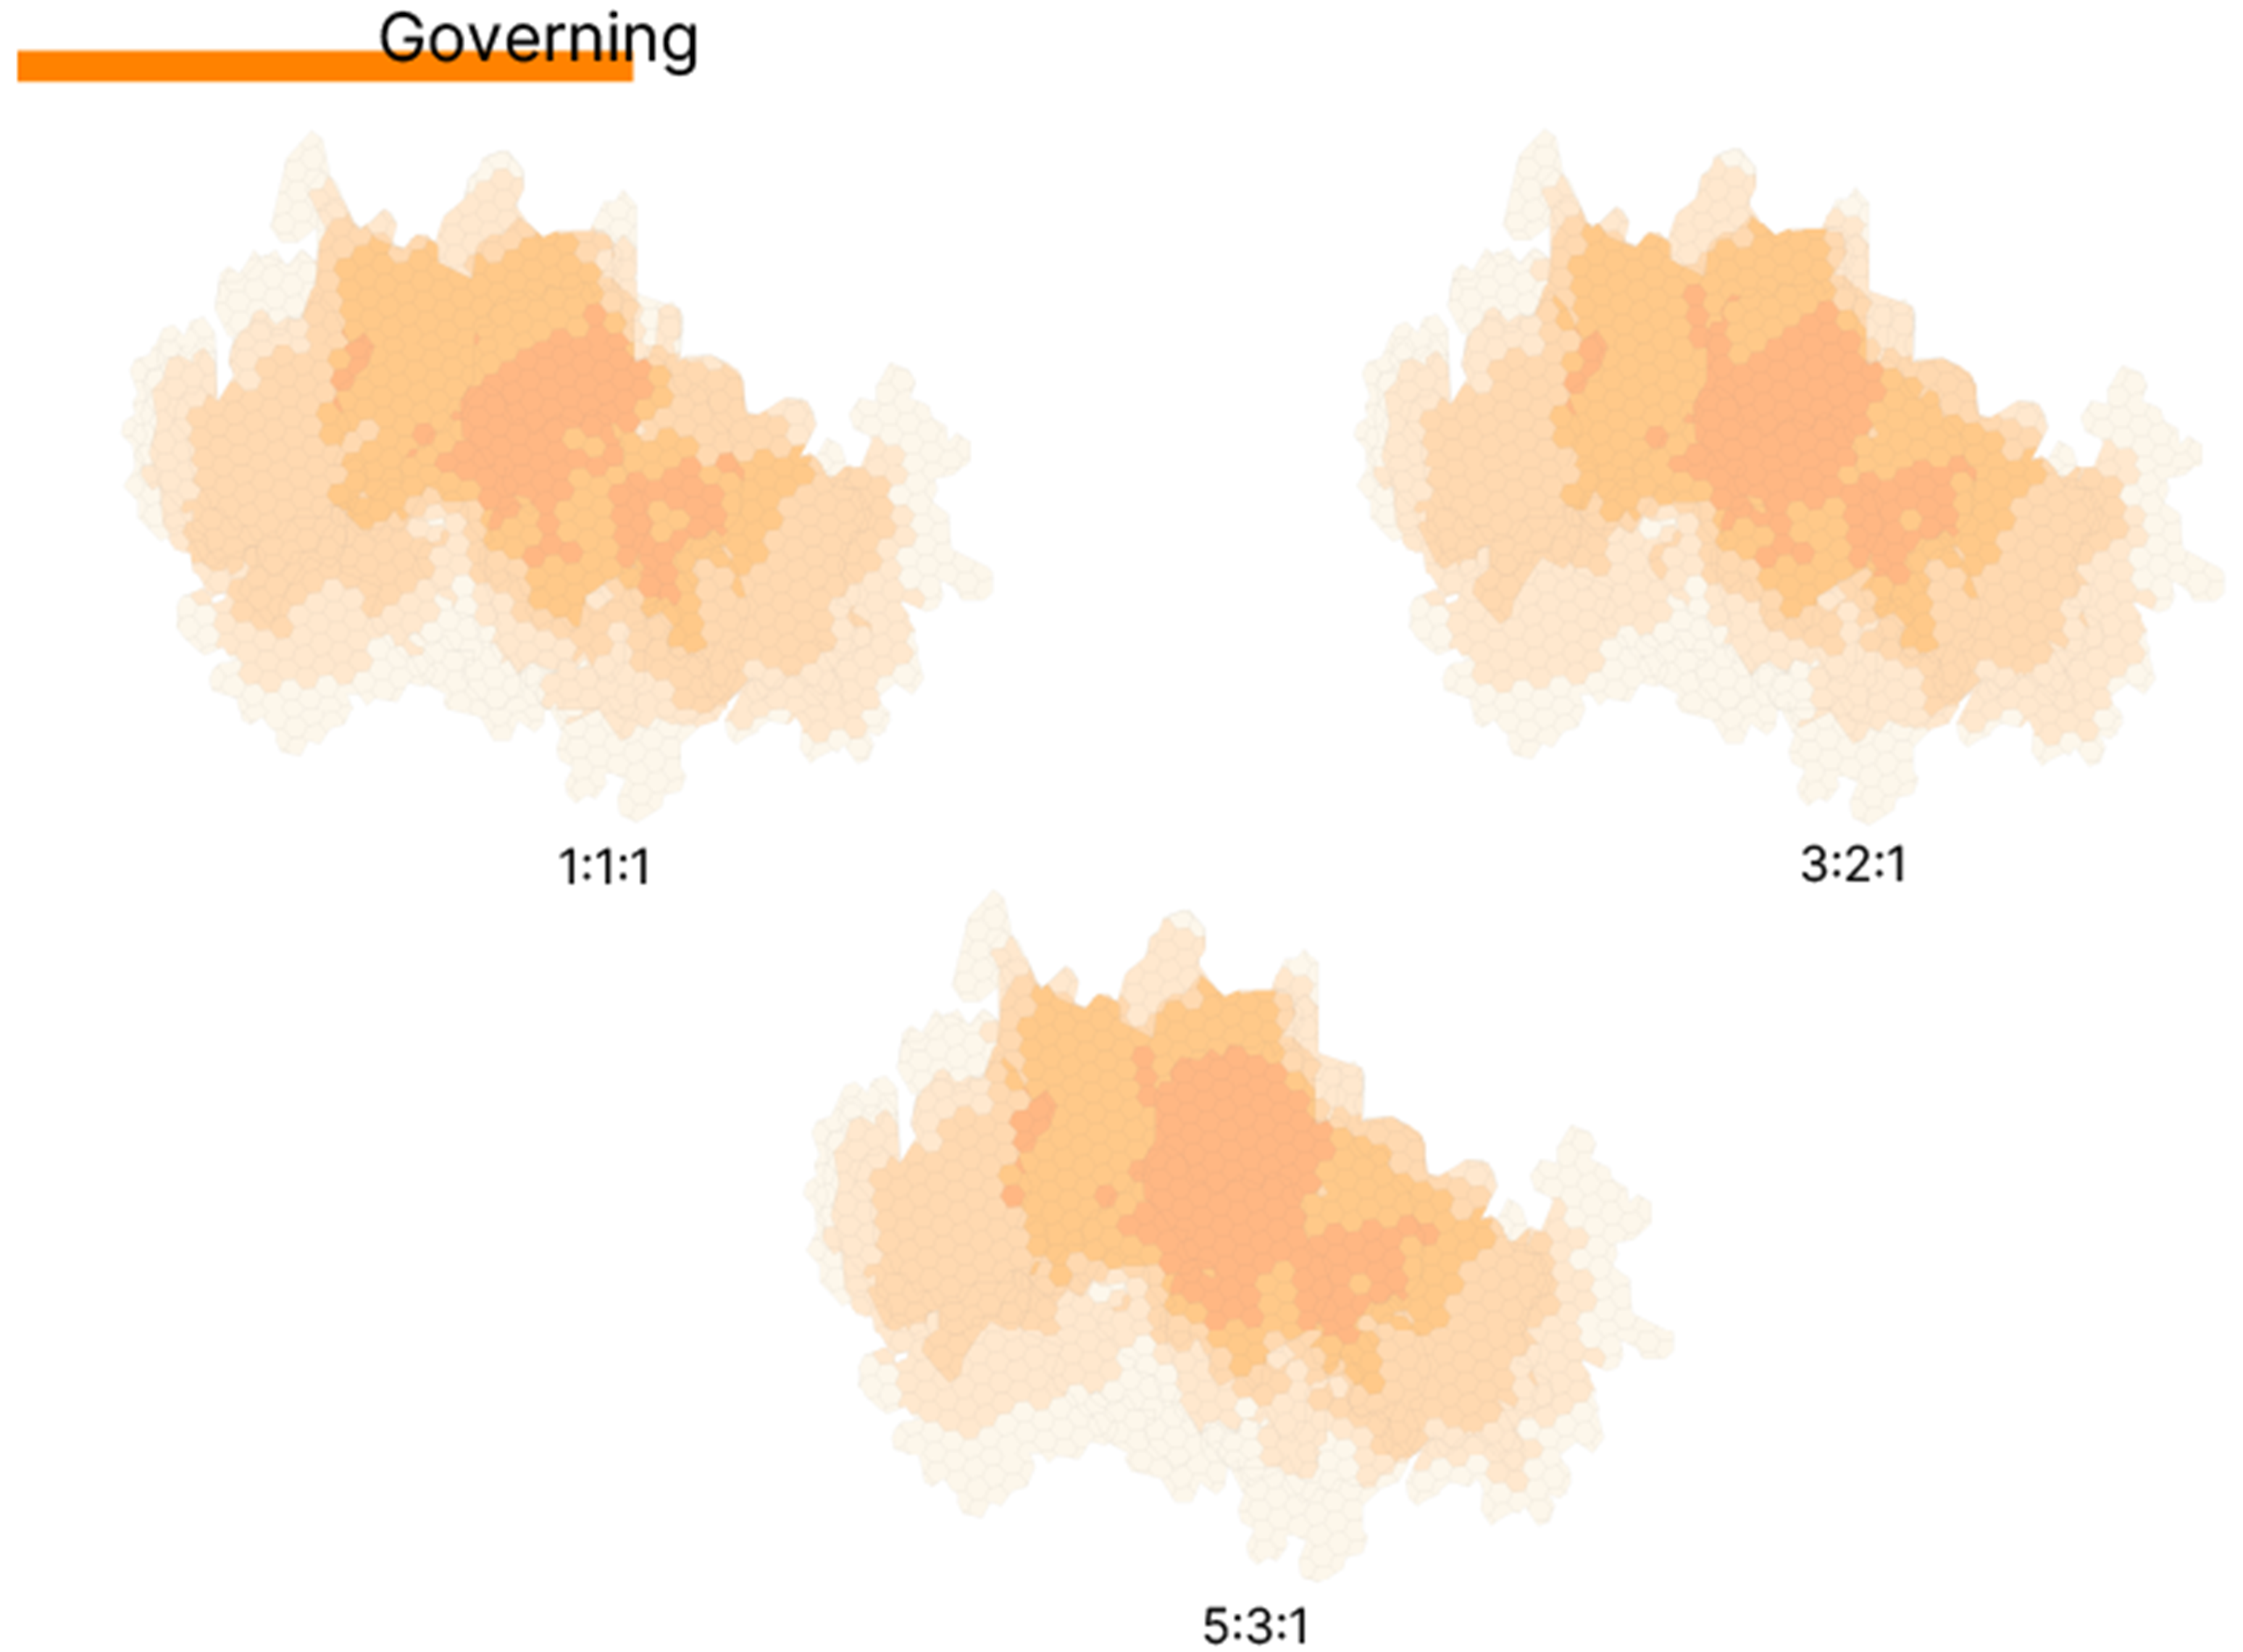
Amenities assigned to the governing function are concentrated primarily along the main roads of the Berceni neighbourhood (Figure 20), with many located on the ground floors of apartment buildings. The highest concentration occurs in the central-eastern part of the study area, following a pattern also observed for several other social functions. By contrast, the south-southeastern part of the neighbourhood exhibits comparatively limited potential spatial accessibility to governing amenities. Banks provide broader 15-minute walking coverage than the other amenity types included in this function; however, the remaining services are more sparsely distributed, resulting in lower accessibility values towards the neighbourhood boundary.
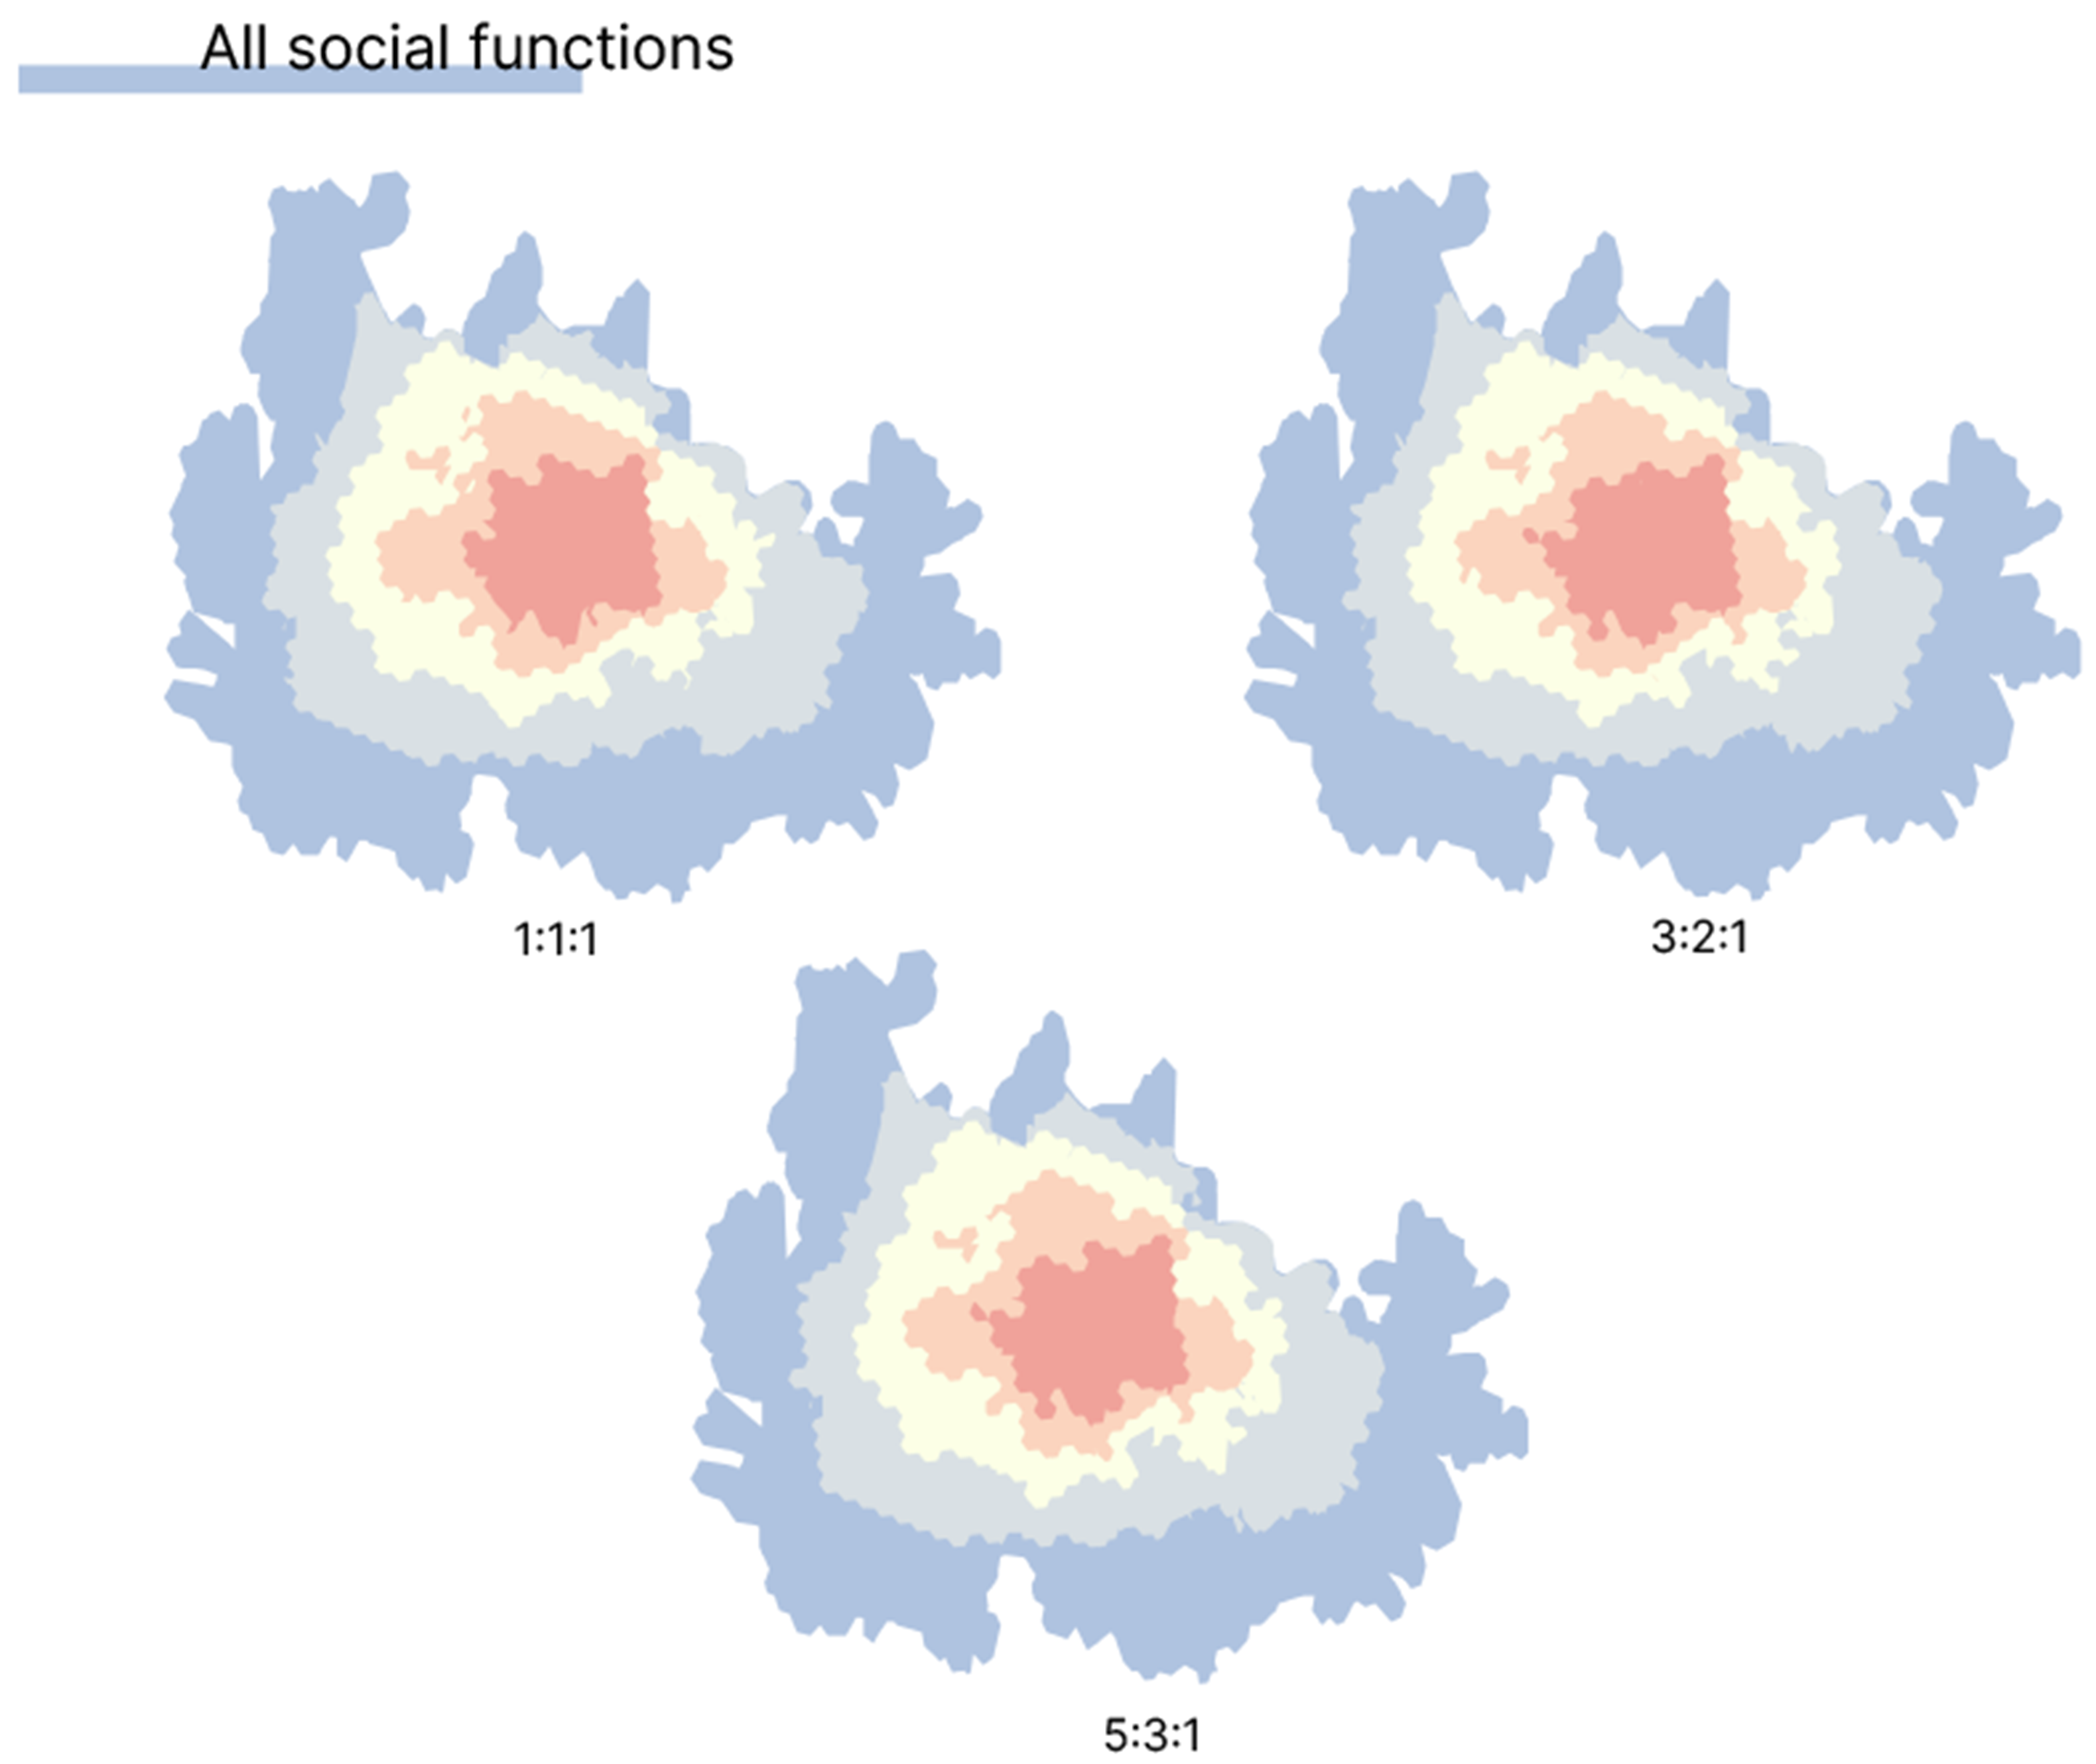
The overall accessibility results obtained under the three weighting specifications are presented in Figure 21, Table 4 and Table 5. The 1:1:1, 3:2:1, and 5:3:1 accessibility surfaces exhibit broadly similar spatial patterns, with the highest values concentrated primarily in the central part of the study area. Nevertheless, the surfaces are not identical. As the relative contribution of proximity, intermediate, and central amenities changes, the 3:2:1 and 5:3:1 specifications produce a progressively smaller high-accessibility hotspot than the equal-weight 1:1:1 baseline. The lowest values are concentrated along the eastern, southern, and western margins of the neighbourhood, as well as in parts of its northern section. These peripheral patterns should be interpreted cautiously because POIs located outside the Berceni boundary were excluded from the analysis. Consequently, the accessibility of boundary cells may be underestimated. The application of alternative weights and the subsequent normalisation also alter the relative ranking of some H3 cells, indicating that local accessibility patterns are sensitive to the adopted weighting and normalisation procedures.
The descriptive statistics reported in Table 4 indicate that the overall score distributions remain relatively stable across the three weighting specifications. The mean accessibility score decreases slightly from 0.125103 under the equal-weight 1:1:1 scheme to 0.124018 under the 3:2:1 scheme and 0.123603 under the 5:3:1 scheme. A similar pattern is observed for the median, which declines from 0.090083 to 0.089667 and 0.089450, respectively. The standard deviation also decreases marginally, from 0.116644 under 1:1:1 to 0.115259 under 3:2:1 and 0.114837 under 5:3:1. Furthermore, the maximum score decreases from 0.501611 under the equal-weight baseline to 0.497069 under 3:2:1 and 0.496299 under 5:3:1. The limited magnitude of these changes indicates broad distributional stability across the three specifications. However, skewness increases progressively from 1.245463 under 1:1:1 to 1.253866 under 5:3:1, suggesting a modest increase in the asymmetry of the distribution as greater relative priority is assigned to proximity-level amenities. Thus, although the alternative weighting specifications do not substantially alter the overall distribution of accessibility scores, they affect the concentration of higher values and the relative position of individual H3 cells.
To assess the sensitivity of the accessibility results to the weighting assumptions, a cell-level comparison was conducted for the 8465 H3 cells included in the analysis. The results reported in Table 5 indicate a high degree of consistency across the three weighting specifications. Spearman’s rank correlations range from 0.9986 for the comparison between 1:1:1 and 5:3:1 to 0.9999 for the comparison between 3:2:1 and 5:3:1, with all correlations statistically significant (p < 0.001). These results indicate that the relative ranking of H3 cells remains largely unchanged when greater weight is assigned to amenities classified as being in proximity. The differences in score magnitude are also limited. Mean absolute cell-level differences range from 0.0008 to 0.0037, while the maximum differences range from 0.0039 to 0.0180. The largest differences occur between the equal-weight 1:1:1 baseline and the 5:3:1 specification, which applies the strongest proximity-priority weighting. The percentage of H3 cells remaining in the same accessibility class ranges from 94.1% to 98.8%. Cells that do not remain in the same class shift by only one class, and no cell shifts by more than one accessibility class. The Jaccard overlap of the highest-accessibility class ranges from 97.1% to 99.5%, indicating that the spatial extent of the highest-scoring areas remains highly consistent across the three specifications. Overall, the weighting assumptions produce limited local changes in score magnitude and classification but do not substantially alter the principal spatial pattern of accessibility.
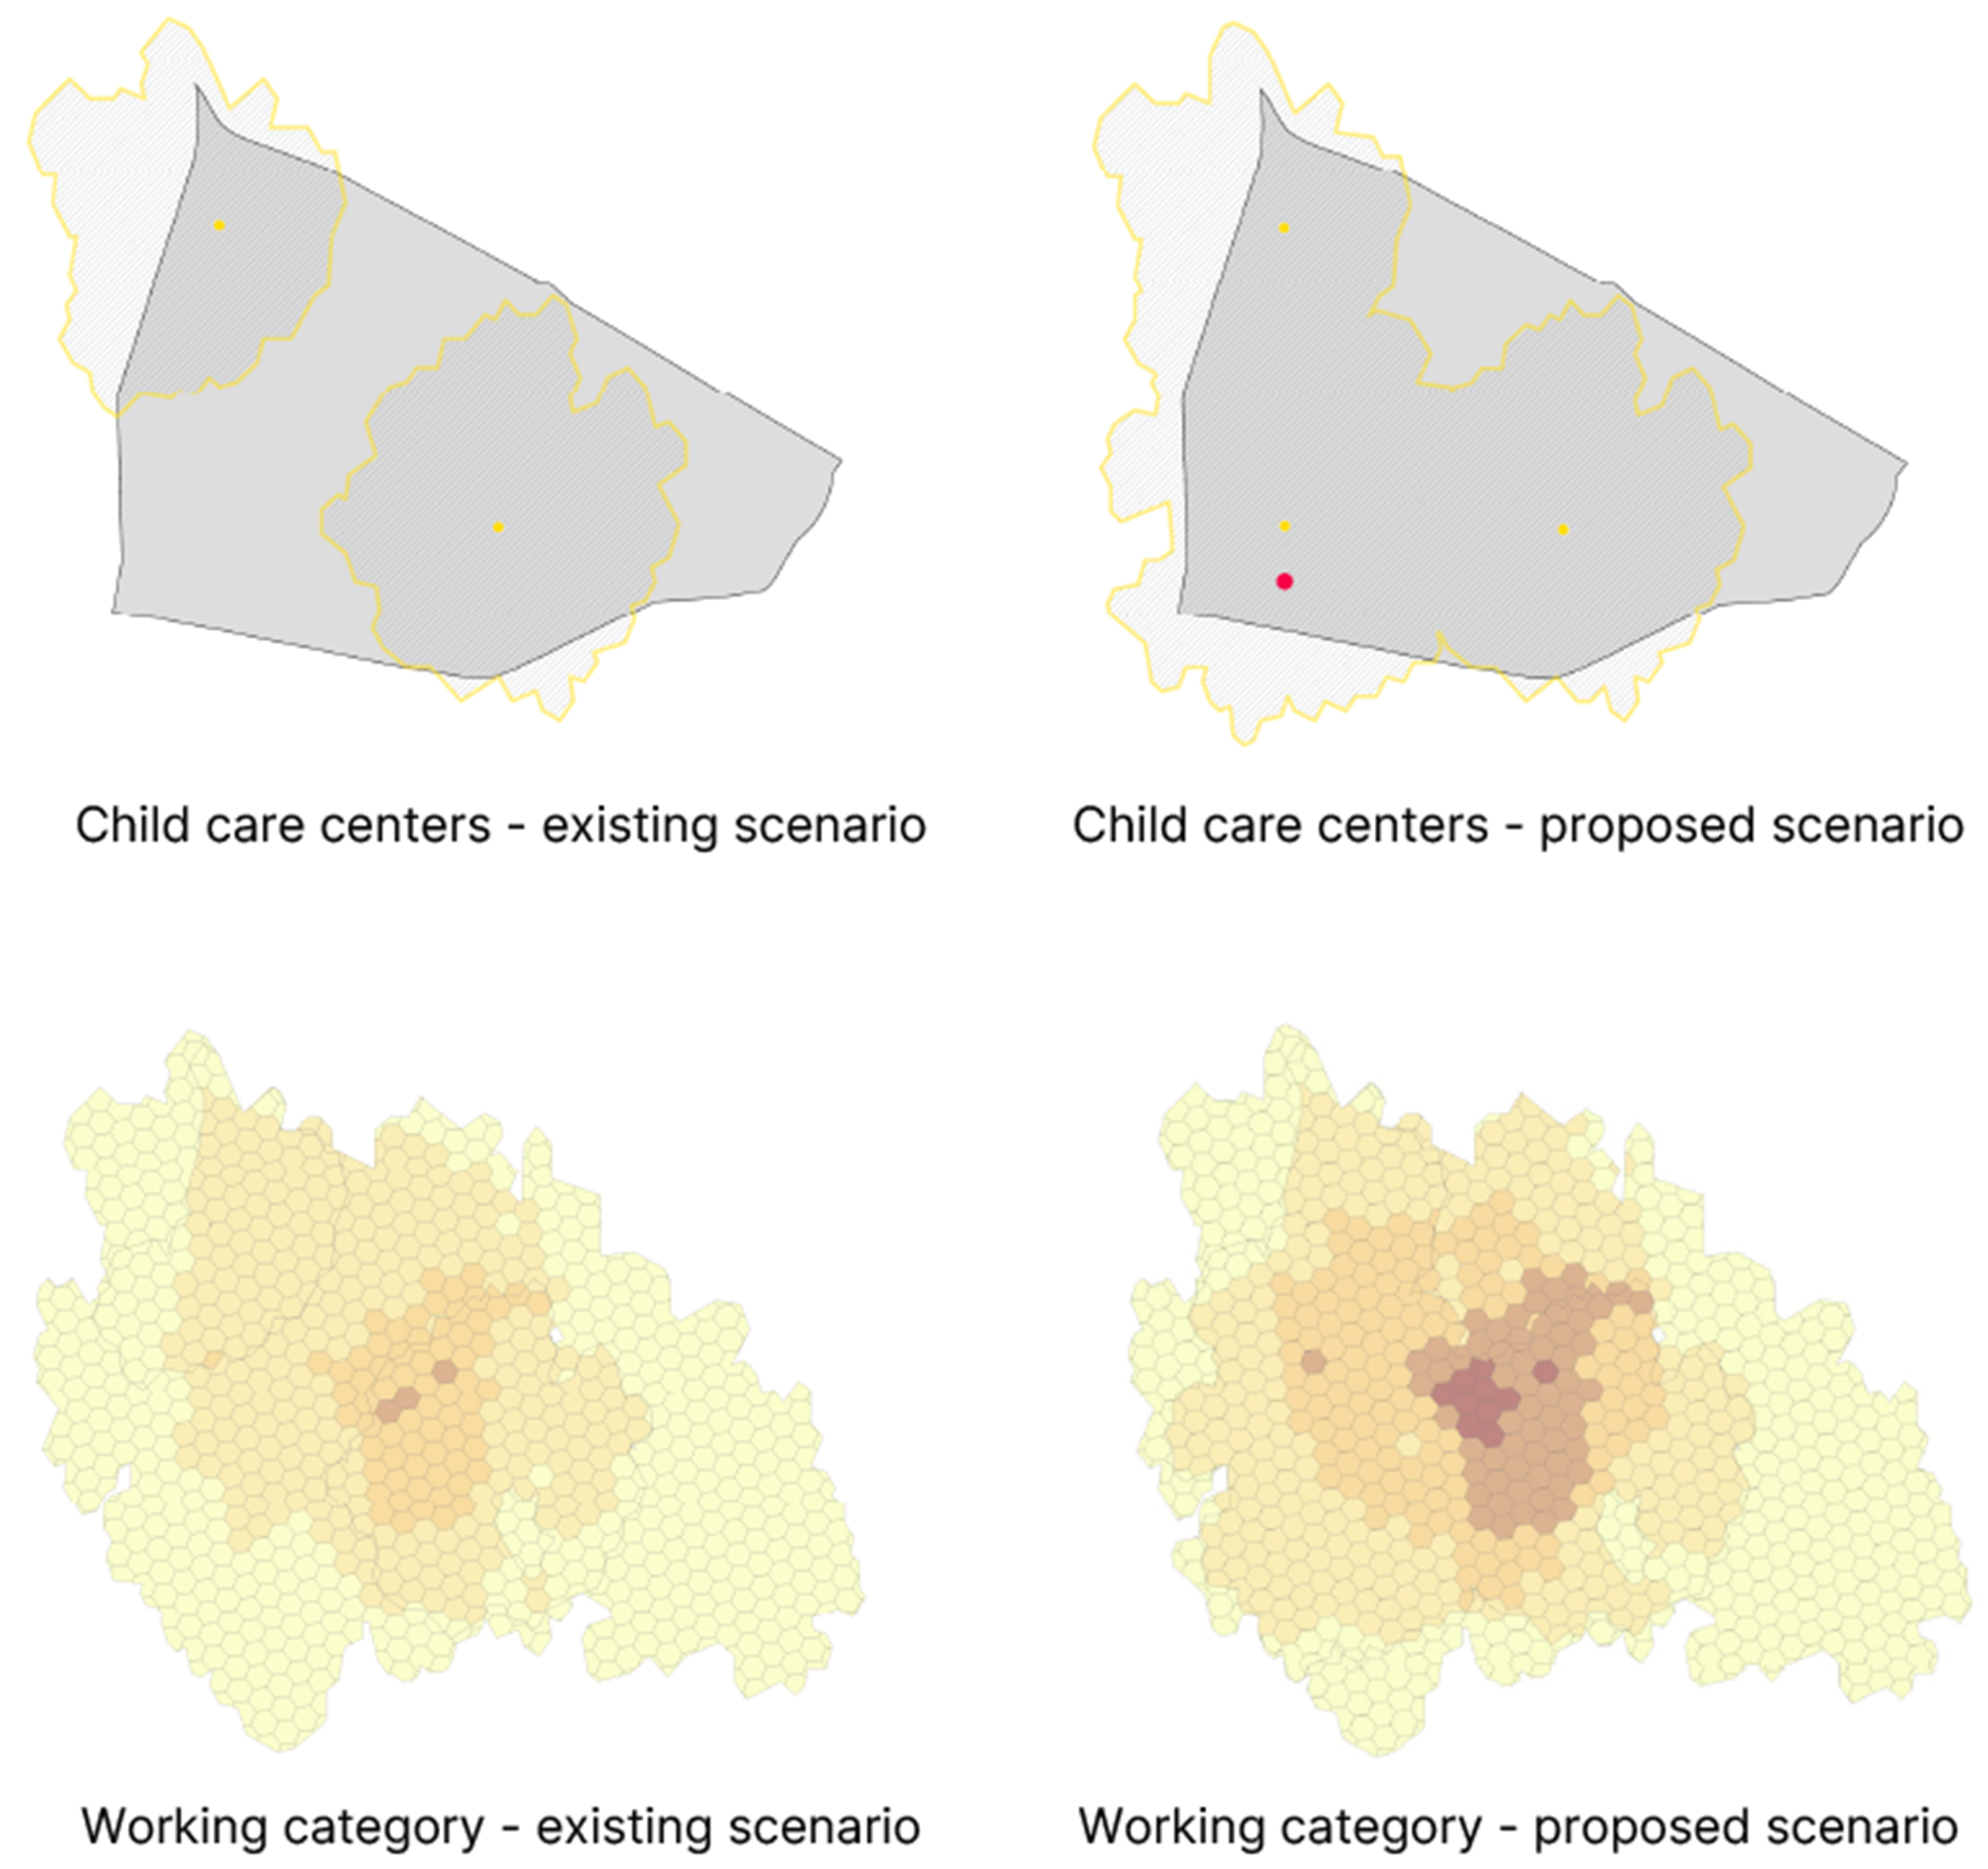
To assess whether the H3-based workflow can also support function-targeted planning, an intervention scenario was developed for the working function. The scenario introduces one additional childcare centre in the south-western part of Berceni, where the existing accessibility surface indicates a persistent cluster of comparatively low values. All other analytical parameters, including the existing POI dataset, pedestrian network, 15-minute travel time threshold, H3 resolution 10 grid, and scoring procedure, were held constant. The comparison therefore isolates the spatial effect of the proposed facility without modifying the underlying case-study design.
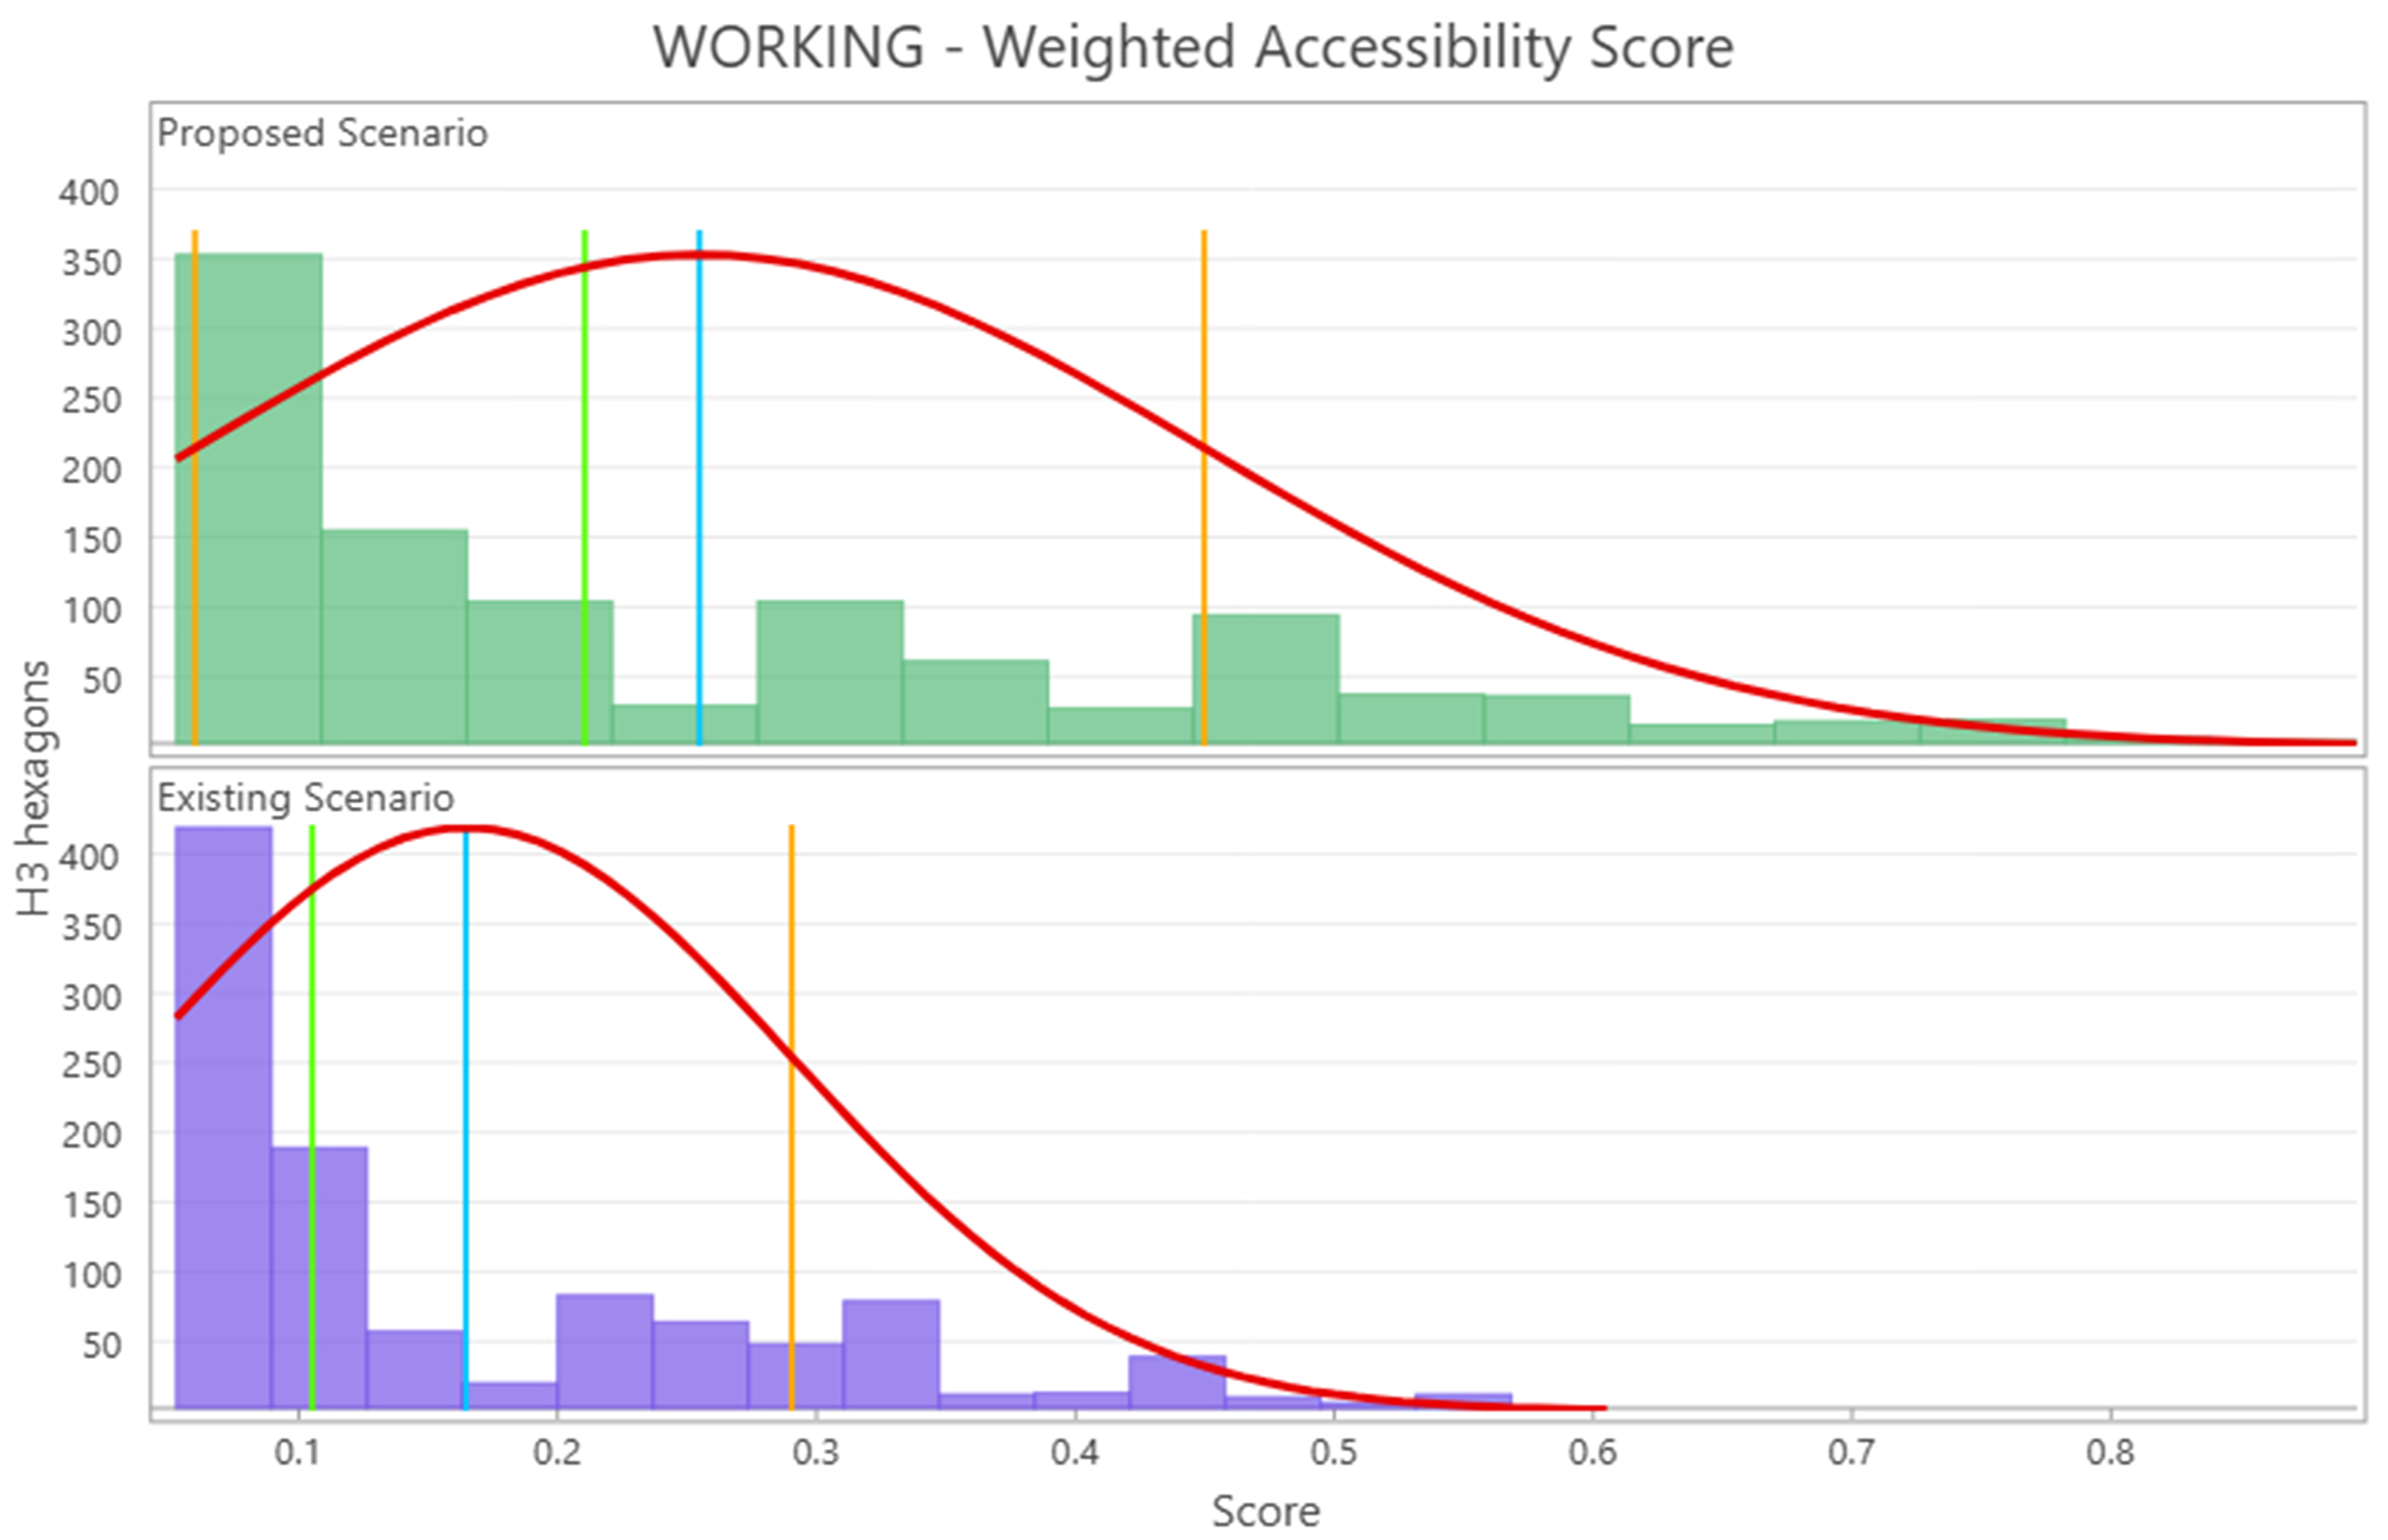
Compared with the existing scenario, the proposed intervention extends the 15-minute walking coverage of the working function and increases the accessibility scores of the H3 cells intersecting the new facility’s network-based isochrone (Figure 22). The histogram presented in Figure 23 indicates a partial redistribution of affected cells from the lowest accessibility classes towards higher classes, while cells outside the new facility’s catchment retain their existing values. The improvement is therefore spatially concentrated in the south-western intervention area rather than distributed across the entire neighbourhood. The proposed facility reduces the local concentration of low-accessibility cells but does not eliminate the broader deficit associated with the working function.
The proposed intervention should be interpreted as a planning-oriented screening scenario rather than as a definitive location-allocation solution. The analysis evaluates the potential change in network-based spatial accessibility but does not incorporate population demand, facility capacity, land availability, affordability, implementation costs, or competition among service providers.

5. Discussion

The results reveal uneven patterns of potential spatial accessibility to mapped points of interest across Berceni’s seven social functions. Caring records the highest cumulative opportunity count and the broadest spatial coverage, whereas working and governing are the least represented functions in the mapped POI inventory and display comparatively low accessibility in several parts of the neighbourhood. These findings are influenced by the adopted amenity taxonomy, as the categories differ in both composition and number of POIs. For example, caring comprises five amenity types, among which pharmacies are particularly numerous, whereas working includes only offices and childcare facilities. Consequently, the comparatively high caring score primarily reflects the number and spatial density of mapped opportunities rather than service capacity, quality, opening hours, or the extent to which healthcare needs are met.
The comparatively low potential accessibility of working and governing is consistent with the functional structure historically associated with socialist residential planning, in which housing, local supply, and basic care services were organised differently from employment and administrative functions. However, the current distribution cannot be attributed exclusively to this planning legacy. Post-socialist deindustrialisation, employment relocation, land-use change, the conversion of former industrial sites, and incomplete representation of offices and services in OpenStreetMap may also have contributed to the observed pattern [39]. The findings therefore describe a contemporary spatial distribution of potential accessibility and do not establish the relative causal influence of individual historical processes.
The Berceni case supports a recurrent finding in proximity-based urban research: a neighbourhood may provide comparatively good access to certain daily functions while retaining significant deficits in others [14,40]. The analysis also demonstrates the importance of methodological specification. Although the accessibility surfaces generated under the three weighting specifications preserve a broadly similar central pattern, the alternative weights modify the spatial extent of high-accessibility areas and the relative ranking of some H3 cells. The results should therefore be interpreted as measures of potential spatial accessibility to mapped opportunities rather than as indicators of residents’ experienced accessibility, service quality, or minimum service sufficiency [40].
The cell-level sensitivity analysis indicates that the principal accessibility pattern is robust to the weighting assumptions examined in this study. Spearman’s rank correlations exceed 0.998, between 94.1% and 98.8% of the H3 cells remain in the same accessibility class, and the Jaccard overlap of the highest-accessibility class exceeds 97%. The greatest sensitivity occurs between the 1:1:1 and 5:3:1 specifications, as expected from the stronger priority assigned to in-proximity amenities under the latter. However, all reclassified cells shift by only one class, indicating that the alternative weights produce limited local changes without altering the main spatial interpretation.
Methodologically, the study integrates two distinct components. ArcGIS Online network analysis is used to generate walking isochrones based on the pedestrian network, while H3 resolution 10 provides a consistent hierarchical spatial index for assigning and aggregating the resulting accessibility values. This distinction is important because H3 does not generate network accessibility but provides a common spatial framework for reporting and comparing the isochrone-derived results across the seven social functions.
H3 resolution 10 enabled the identification of local differences in potential accessibility among housing-block clusters while remaining suitable for neighbourhood-scale aggregation and interpretation. The hexagonal structure provides six edge-sharing neighbours and a uniform centroid-to-centroid distance between adjacent cells, supporting consistent local comparisons. However, the present study does not compare H3 empirically with square grids, raster cells, administrative units, or alternative indexing systems. The results therefore demonstrate the applicability of H3 as an aggregation and reporting framework rather than its general analytical superiority over other spatial units. Similarly, although the hierarchical structure of H3 permits analysis at multiple resolutions, the suitability of lower resolutions for district-level policy assessment was not tested empirically in the present study and should be examined in future multiresolution analyses.
The findings extend the application of the 15-minute city framework to a peripheral post-socialist residential district rather than a compact Western European urban core. Berceni cannot be characterised as uniformly deficient. Mapped opportunities associated with living, supplying, and caring are comparatively widespread, whereas working and governing remain less represented and spatially uneven. This differentiated pattern indicates that accessibility strategies should address specific functional deficits rather than rely exclusively on general densification or mixed-use development. The proposed childcare scenario illustrates this principle by targeting a low-accessibility area within the working function.
Several limitations need to be considered when interpreting the results. The analysis relies on OpenStreetMap data, whose completeness and positional or thematic accuracy may vary across geographic areas and amenity categories [41]. The POI inventory represents the amenities mapped and appropriately tagged at the time of data extraction. An amenity absent from the dataset may therefore be genuinely unavailable in Berceni or may exist but remain unmapped, incompletely tagged, or unreported in OpenStreetMap. This limitation may be particularly relevant to small offices, informal businesses, ground-floor commercial activities, and other services that are less consistently represented in volunteered geographic datasets.
The accessibility indicators are derived from modelled network travel times and do not incorporate qualitative characteristics of the pedestrian environment. Sidewalk availability and condition, lighting, crossing safety, pedestrian congestion, physical barriers, and seasonal conditions may influence residents’ ability and willingness to walk to particular destinations. Because sufficiently detailed data describing these characteristics were unavailable for the study area, the calculated scores should be understood as measures of potential network accessibility rather than representations of residents’ actual walking experiences. Future research could integrate pedestrian-environment indicators and survey-based evidence to develop a more comprehensive measure combining potential accessibility with experienced walkability.
The classification of amenities involves an interpretive component because certain POIs may support more than one social function. For example, nursing homes may be associated with both living and caring, while childcare facilities may be related to working, caring, or learning. The present analysis follows the selected seven-function framework to maintain internal consistency, but alternative classifications could produce different category-level results. The findings should therefore be interpreted in relation to the taxonomy adopted in this study rather than as a universally applicable classification of urban functions.
The weighting specifications applied in this study represent transparent ordinal analytical assumptions rather than empirically estimated measures of residents’ preferences. A user-derived specification was not implemented because the study did not include a resident survey, stakeholder consultation, or participatory preference-elicitation procedure from which context-specific weights could be estimated reliably. The 1:1:1, 3:2:1, and 5:3:1 specifications should therefore be interpreted as a sensitivity framework for testing alternative proximity-priority assumptions. Future research should compare these analytical specifications with weights derived from residents or relevant stakeholders.
Population distribution was not incorporated because sufficiently detailed demographic data were unavailable at the spatial resolution required for the analysis. The Romanian National Institute of Statistics publishes population data for Bucharest primarily at the city and administrative-sector levels, which are substantially larger than the neighbourhood-scale H3 resolution 10 cells used in this study. As a result, all H3 cells were treated equally, irrespective of residential population, building occupancy, or land use. Some cells may contain densely populated apartment buildings, whereas others may include roads, parks, commercial areas, or relatively little residential activity. The resulting surfaces therefore represent location-based potential accessibility rather than population exposure or equity of accessibility. Future research should incorporate fine-resolution population data, building occupancy, residential entrances, age structure, and other demographic characteristics when such data become available.
Finally, a boundary-sensitivity analysis was not conducted because the study followed an inside-out analytical design based on a fixed neighbourhood-level POI inventory. Amenities located within Berceni were used as origins for the generation of network-based walking travel areas, and the resulting isochrones were allowed to extend beyond the neighbourhood boundary without being clipped to the Berceni polygon. This procedure avoided the geometric truncation of the 15-minute travel areas generated from internal amenities. However, POIs located outside Berceni were not included in the opportunity set. Potential accessibility may therefore still be underestimated for H3 cells near the study-area boundary, as residents in these locations may reach schools, shops, workplaces, or other amenities situated in adjacent neighbourhoods within the modelled 15-minute walking threshold. The remaining boundary-related limitation consequently concerns the omission of external destinations rather than the clipping of the isochrones generated from internal POIs. Accordingly, low values observed in peripheral cells should not be attributed exclusively to insufficient service provision within Berceni. A future boundary-sensitivity analysis should incorporate POIs situated beyond the neighbourhood boundary and compare the resulting accessibility scores with those obtained from the internal-only opportunity set. Extending the analysis to the entire city of Bucharest would further reduce the influence of artificial neighbourhood boundaries and support a more comprehensive assessment of cross-boundary accessibility.

6. Conclusions

This study integrated network-derived walking isochrones with H3 spatial indexing to assess potential spatial accessibility to mapped points of interest associated with seven social functions in the Berceni neighbourhood. The results reveal an uneven functional and spatial distribution of accessible opportunities. Caring records the largest cumulative number of mapped amenities and the broadest coverage, whereas working and governing are comparatively less represented and exhibit more substantial spatial gaps. These findings are conditional on the adopted amenity taxonomy and the completeness of the POI dataset. They describe the availability and distribution of mapped opportunities rather than facility capacity, service quality, functional completeness, or population-weighted access.
From a methodological perspective, the study demonstrates the applicability of using H3 as a hierarchical indexing and aggregation framework for accessibility values derived from pedestrian-network isochrones. The workflow generates comparable spatial surfaces across multiple amenity categories and identifies local variations among residential building clusters that may remain obscured at the level of large administrative units. H3 resolution 10 provides sufficient spatial detail for neighbourhood-scale interpretation while retaining the possibility of aggregation to coarser resolutions for broader planning applications.
The comparison of the 1:1:1, 3:2:1, and 5:3:1 weighting specifications indicates a high degree of cell-level consistency. Spearman’s rank correlations exceed 0.998, at least 94.1% of the H3 cells remain in the same accessibility class, and the overlap of the highest-accessibility class exceeds 97%. The equal-weight 1:1:1 specification provides a transparent baseline, while the 3:2:1 and 5:3:1 specifications test progressively stronger prioritisation of in-proximity amenities. Although the alternative weights produce limited local changes, the principal accessibility pattern remains stable. These specifications represent analytical assumptions rather than empirically validated measures of residents’ preferences.
The findings also contribute to the application of the 15-minute city framework in post-socialist urban environments. Berceni cannot be characterised as uniformly deficient, as mapped opportunities associated with caring, supplying, and some components of living are comparatively widespread. The main accessibility gaps concern specific functions, particularly working and governing. Although this pattern is compatible with the inherited functional structure of a socialist residential district, the contemporary distribution of amenities may also reflect post-socialist deindustrialisation, employment relocation, land-use conversion, suburbanisation, and the incomplete representation of small-scale services in OpenStreetMap.
These results support a function-targeted approach to urban intervention. Instead of relying exclusively on general densification or broad mixed-use strategies, planning measures should prioritise areas in which specific daily functions remain poorly represented or difficult to reach. The proposed childcare scenario illustrates this approach by showing that an additional facility in the south-western part of Berceni improves potential accessibility within its 15-minute pedestrian catchment and reduces the local concentration of low-scoring cells.
Several limitations define the scope of the findings. The accessibility measures are based on network travel time and a uniform walking-speed assumption and do not incorporate the quality of pedestrian infrastructure, crossing safety, lighting, physical barriers, seasonal conditions, or differences among population groups. The analysis also relies on OpenStreetMap, whose completeness and tagging consistency may vary among amenity categories. In addition, POIs located outside the Berceni boundary were excluded, which may lead to an underestimation of accessibility in peripheral cells. The absence of sufficiently detailed demographic data prevented the calculation of population-weighted indicators, while the additive scoring approach does not account for service capacity, quality, affordability, competition, or minimum sufficiency.
Future research should extend the workflow to other neighbourhoods and to the entire city of Bucharest, reducing the influence of internal study-area boundaries and enabling comparison among different urban forms. Further developments should incorporate multiple transport modes, alternative walking speeds, population and age-group distributions, service capacity, and qualitative characteristics of the pedestrian environment. Testing additional weighting schemes and validating modelled results through resident surveys, field observations, and behavioural data would provide a more comprehensive understanding of accessibility and support the context-sensitive application of the 15-minute city framework in post-socialist cities.

Author Contributions

Conceptualization, A.E. and A.-C.B.; methodology, A.E. and A.-C.B.; software, A.-C.B.; validation, A.E., A.-C.B., G.B., A.-P.G., and C.A.V.; formal analysis, A.E.; investigation, A.E. and A.-C.B.; resources, A.E., A.-C.B. and G.B.; data curation, A.E.; writing—original draft preparation, A.E.; writing—review and editing, A.E., A.-C.B., G.B. and A.-P.G.; visualization, A.E., A.-C.B., and G.B.; supervision, A.-C.B. and G.B.; project administration, A.-C.B. and C.A.V. All authors have read and agreed to the published version of the manuscript.

Funding

This research was partially supported by the National Building Registry Project, funded through Romania’s National Recovery and Resilience Plan (NRRP), under Component 5, “The Renovation Wave”, Investment I2, Milestone 107, and by the Horizon Europe project ReGreeneration (Grant Agreement No. 101139636), “The Next Generation of Green, Resilient and Socially Inclusive Smart Cities”. This research received UTCB funding for publication.

Data Availability Statement

The data presented in this study are available from the corresponding author upon request due to institutional data-management and software-licensing restrictions.

Acknowledgments

This study was conducted using Esri software(ArcGIS Online, ArcGIS Pro v3.6.3) licenses provided by the Doctoral School of the Technical University of Civil Engineering Bucharest. This study was conducted within the Geodetic Engineering Measurements and Spatial Data Infrastructures Research Centre, Faculty of Geodesy, Technical University of Civil Engineering Bucharest.

Conflicts of Interest

The authors declare no conflicts of interest.

Abbreviations

The following abbreviations are used in this manuscript:
GISGeographic Information System
POIPoints of Interest

References

  1. Moreno, C.; Allam, Z.; Gall, C. Implementing the 15-Minute City: A Case Study of Paris; Cambridge University Press: Cambridge, UK, 2025. [Google Scholar] [CrossRef]
  2. Abdelfattah, L.; Albashir, A.; Ceccarelli, G.; Gorrini, A.; Messa, F.; Presicce, D. The Right to the Night City: Exploring the Temporal Variability of the 15-min City in Milan and Its Implications for Nocturnal Communities. Computers 2025, 14, 22. [Google Scholar] [CrossRef] [Scilit]
  3. Chiaradia, F.; Lelo, K.; Monni, S.; Tomassi, F. The 15-Minute City: An Attempt to Measure Proximity to Urban Services in Rome. Sustainability 2024, 16, 9432. [Google Scholar] [CrossRef] [Scilit]
  4. Morley, M.; Pafka, E. “Density Done Well” in the Pursuit of 20-Minute Neighbourhoods: Navigating Fluid Discourses in Melbourne. Urban Policy Res. 2023, 41, 148–163. [Google Scholar] [CrossRef] [Scilit]
  5. Allam, Z.; Khavarian-Garmsir, A.R.; Lassaube, U.; Chabaud, D.; Moreno, C. Mapping the Implementation Practices of the 15-Minute City. Smart Cities 2024, 7, 2094–2109. [Google Scholar] [CrossRef] [Scilit]
  6. Moreno, C. La ville du quart d’heure: Pour un nouveau chrono-urbanisme. La Tribune, 4 October 2016.
  7. Martinuzzi, C.; Moreno, C.; Gall, C.; Chabaud, D. Sustainable Proximities for a High Quality of Societal Life: A Global and Integrated Urban Planning Methodology for Local Governments; Chaire ETI, UN-Habitat, and United Cities and Local Governments: Paris, France, 2025; ISBN 978-2-492794-02-5. [Google Scholar]
  8. Woźniak, S.; Szymański, P. Context-Aware Embedding H3 Hexagons with OpenStreetMap Tags. In Proceedings of the 4th ACM SIGSPATIAL International Workshop on AI for Geographic Knowledge Discovery; Association for Computing Machinery (ACM): New York, NY, USA, 2021; pp. 61–71. [Google Scholar]
  9. Sadeghi, O.; Di Marzo Serugendo, G. Assessing Walkability in Urban Environments: A Comprehensive Overview. Preprints 2024. Epub ahead of printing. [Google Scholar] [CrossRef] [Scilit]
  10. Zhao, J.; Sun, G.; Webster, C. Walkability scoring: Why and how does a three-dimensional pedestrian network matter? Environ. Plan. B Urban Anal. City Sci. 2021, 48, 2418–2435. [Google Scholar] [CrossRef] [Scilit]
  11. Guzman, L.A.; Oviedo, D.; Cantillo-Garcia, V.A. Is proximity enough? A critical analysis of a 15-minute city considering individual perceptions. Cities 2024, 148, 104882. [Google Scholar] [CrossRef] [Scilit]
  12. Mañago, C.A.R.; Nasalita, M.G.; Saveron, C.V.; Sunga, Y.A.D.; Claridades, A.R.C. Development of a Fifteen-Minute City Index Using Walkability Scores and Age-Classified Population: The Case of Pasig City, Metro Manila, Philippines. ISPRS Int. J. Geo-Inf. 2025, 14, 78. [Google Scholar] [CrossRef] [Scilit]
  13. Knap, E. Developing a Composite Indicator for the 15-Minute City Concept Based on Accessibility Measures and Assessment of Spatial Inequalities of Different Sociodemographic Groups. Master’s Thesis, University of Twente, Enschede, The Netherlands, 2022. [Google Scholar]
  14. Moreno, C.; Allam, Z.; Chabaud, D.; Gall, C.; Pratlong, F. Introducing the “15-Minute City”: Sustainability, Resilience and Place Identity in Future Post-Pandemic Cities. Smart Cities 2021, 4, 93–111. [Google Scholar] [CrossRef] [Scilit]
  15. Graells-Garrido, E.; Serra-Burriel, F.; Rowe, F.; Cucchietti, F.M.; Reyes, P. A city of cities: Measuring how 15-minutes urban accessibility shapes human mobility in Barcelona. PLoS ONE 2021, 16, e0250080. [Google Scholar] [CrossRef] [Scilit]
  16. Huang, Y.; Hui, E.C.; Lang, W.; Chen, T.; Yang, J. Embedding local culture into chrono-urbanism: Insights from the urban regeneration in Xiamen’s Lujiang old town, China. Cities 2025, 165, 106175. [Google Scholar] [CrossRef] [Scilit]
  17. Langmaack, H. Nordhavn—A Sustainable City the Copenhagen Way? Exploring the Ambiguity of Sustainable Urban Development. Master’s Thesis, Aalborg University Copenhagen, Copenhagen, Denmark, 2019. [Google Scholar]
  18. Allam, Z.; Bibri, S.E.; Chabaud, D.; Moreno, C. The ‘15-Minute City’ concept can shape a net-zero urban future. Humanit. Soc. Sci. Commun. 2022, 9, 126. [Google Scholar] [CrossRef] [Scilit]
  19. Capasso Da Silva, D.; King, D.A.; Lemar, S. Accessibility in Practice: 20-Minute City as a Sustainability Planning Goal. Sustainability 2019, 12, 129. [Google Scholar] [CrossRef] [Scilit]
  20. Iqbal, A.; Nazir, H.; Qazi, A.W. Exploring the 15-Minutes City Concept: Global Challenges and Opportunities in Diverse Urban Contexts. Urban Sci. 2025, 9, 252. [Google Scholar] [CrossRef] [Scilit]
  21. Zan, C.; Bhatia, R.; Samant, S. Reimagining the High-Density, Vertical 15-Minute City. Buildings 2025, 15, 1629. [Google Scholar] [CrossRef] [Scilit]
  22. Chen, Y.; Yang, X.; Li, X.; Yang, L.; Cheng, S.; Tang, G.; Biljecki, F. Vertical 15-minute city: Modeling urban density and functional mix with multi-source geospatial data. Cities 2026, 169, 106516. [Google Scholar] [CrossRef] [Scilit]
  23. Ma, Y.; Xu, M.; Qin, X.; Zeng, Y. Dynamic isochrones development and analysis for the time-effective performances evaluation of road networks. J. Urban Manag. 2025, 14, 1311–1327. [Google Scholar] [CrossRef] [Scilit]
  24. Cambridge Dictionary. Available online: https://dictionary.cambridge.org/ (accessed on 1 August 2026).
  25. Dharmawan, R.D.; Suharyadi; Fard, N.M. Geovisualization Using Hexagonal Tessellation for Spatiotemporal Earthquake Data Analysis in Indonesia. In Soft Computing in Data Science; Mohamed, A., Berry, M.W., Yap, B.W., Eds.; Springer: Singapore, 2017; pp. 177–187. [Google Scholar]
  26. Kuo, S.-W. Construction Archimedean tiling patterns based on soft materials from block copolymers and covalent organic frameworks. Giant 2023, 15, 100170. [Google Scholar] [CrossRef] [Scilit]
  27. Abdalla, M.; Nagy, B. Dilation and Erosion on the Triangular Tessellation: An Independent Approach. IEEE Access 2018, 6, 23108–23119. [Google Scholar] [CrossRef] [Scilit]
  28. Avkan, A.; Nagy, B.; Saadetoğlu, M. Digitized rotations of 12 neighbors on the triangular grid. Ann. Math. Artif. Intell. 2020, 88, 833–857. [Google Scholar] [CrossRef] [Scilit]
  29. Why Hexagons? Available online: https://pro.arcgis.com/en/pro-app/3.6/tool-reference/spatial-statistics/h-whyhexagons.htm (accessed on 1 August 2026).
  30. Shelton, T.; Poorthuis, A.; Graham, M.; Zook, M. Mapping the data shadows of Hurricane Sandy: Uncovering the sociospatial dimensions of ‘big data’. Geoforum 2014, 52, 167–179. [Google Scholar] [CrossRef] [Scilit]
  31. Pye, H. Use H3 Hexagons for Spatial Analysis in ArcGIS Online. ArcGIS Blog. Available online: https://www.esri.com/arcgis-blog/products/arcgis-online/analytics/use-h3-hexagons-for-spatial-analysis-in-arcgis-online (accessed on 1 August 2026).
  32. Overview of the H3 Geospatial Indexing System. Available online: https://h3geo.org/docs/core-library/overview (accessed on 1 August 2026).
  33. Brodsky, I. H3: Uber’s Hexagonal Hierarchical Spatial Index. Available online: https://www.uber.com/us/en/blog/h3/ (accessed on 1 August 2026).
  34. Tables of Cell Statistics Across Resolutions. Available online: https://h3geo.org/docs/core-library/restable (accessed on 1 August 2026).
  35. ArcGIS Online. Available online: https://doc.arcgis.com/en/arcgis-online/analyze/travel-modes-analysis-mv.htm (accessed on 1 August 2026).
  36. Páez, A.; Scott, D.M.; Morency, C. Measuring accessibility: Positive and normative implementations of various accessibility indicators. J. Transp. Geogr. 2012, 25, 141–153. [Google Scholar] [CrossRef] [Scilit]
  37. Kapatsila, B.; Palacios, M.S.; Grisé, E.; El-Geneidy, A. Resolving the accessibility dilemma: Comparing cumulative and gravity-based measures of accessibility in eight Canadian cities. J. Transp. Geogr. 2023, 107, 103530. [Google Scholar] [CrossRef] [Scilit]
  38. Tomasiello, D.B.; Herszenhut, D.; Oliveira, J.L.A.; Braga, C.K.V.; Pereira, R.H. A time interval metric for cumulative opportunity accessibility. Appl. Geogr. 2023, 157, 103007. [Google Scholar] [CrossRef] [Scilit]
  39. Nae, M.; Dumitrache, L. Exploring the urban geography of online grocery shopping in Romania: Trends and transformations. Hum. Geogr. 2025, 19, 1–18. [Google Scholar] [CrossRef] [Scilit]
  40. Vale, D.S.; Saraiva, M.; Pereira, M. Active accessibility: A review of operational measures of walking and cycling accessibility. J. Transp. Land Use 2015, 9, 209–235. [Google Scholar] [CrossRef] [Scilit]
  41. Carmès, A.; Catteau, L.; Sonta, A.; Tavakoli, A. Urban Forms Across Continents: A Data-Driven Comparison of Lausanne and Philadelphia. Transp. Res. Interdiscip. Perspect. 2025, 36, 101823. [Google Scholar] [CrossRef] [Scilit]
Figure 1. (a) Isochrone for a 15-minute walk; (b) multiple isochrones generated for an amenity; (c) the accessible area within a 15-minute walk.
Land 15 01728 g001
Figure 2. Connectivity and boundary analysis for triangular, square, and hexagonal grids.
Land 15 01728 g002
Figure 3. Berceni neighbourhood, Bucharest, Romania.
Land 15 01728 g003
Figure 4. Comparison of H3 resolutions 9, 10, and 11 with walking isochrones representing travel times of 1 min (cyan), 2 mins (violet), 3 mins (purple), and 4 mins (magenta).
Land 15 01728 g004
Figure 5. Workflow overview.
Land 15 01728 g005
Figure 6. Location, isochrones, and 15-minute walking area for the following amenities: bus stops, nursing homes, metro stations, and offices.
Land 15 01728 g006
Figure 7. Location, isochrones, and 15-minute walking area for the following amenities: childcare, bakeries, supermarkets, and butcher shops.
Land 15 01728 g007
Figure 8. Location, isochrones, and 15-minute walking area for the following amenities: local markets, kindergartens, schools, and universities.
Land 15 01728 g008
Figure 9. Location, isochrones, and 15-minute walking areas for the following amenities: pharmacies, dentists’ offices, clinics, and doctors’ offices.
Land 15 01728 g009
Figure 10. Location, isochrones, and 15-minute walking areas for the following amenities: hospitals, fitness centres, parks, and swimming pools.
Land 15 01728 g010
Figure 11. Location, isochrones, and 15-minute walking areas for the following amenities: cinemas, restaurants, cafes, and libraries.
Land 15 01728 g011
Figure 12. Location, isochrones, and 15-minute walking areas for the following amenities: stadiums, town hall, post offices, and police stations.
Land 15 01728 g012
Figure 13. Location, isochrones, and 15-minute walking area for the following amenities: banks and ATMs.
Land 15 01728 g013
Figure 14. Living function—H3 isochrones for the 1:1:1, 3:2:1, and 5:3:1 accessibility scores.
Land 15 01728 g014
Figure 15. Working function—H3 isochrones for the 1:1:1, 3:2:1, and 5:3:1 accessibility scores.
Land 15 01728 g015
Figure 16. Supplying function—H3 isochrones for the 1:1:1, 3:2:1, and 5:3:1 accessibility scores.
Land 15 01728 g016
Figure 17. Learning function—H3 isochrones for the 1:1:1, 3:2:1, and 5:3:1 accessibility scores.
Land 15 01728 g017
Figure 18. Caring function—H3 isochrones for the 1:1:1, 3:2:1, and 5:3:1 accessibility scores.
Land 15 01728 g018
Figure 19. Enjoying function—H3 isochrones for the 1:1:1, 3:2:1, and 5:3:1 accessibility scores.
Land 15 01728 g019
Figure 20. Governing function—H3 isochrones for the 1:1:1, 3:2:1, and 5:3:1 accessibility scores.
Land 15 01728 g020
Figure 21. Overall H3 isochrones for the 1:1:1, 3:2:1, and 5:3:1 accessibility scores.
Land 15 01728 g021
Figure 22. Working function accessibility: comparison of the existing and proposed scenarios, with red POI indicating the added childcare centre
Land 15 01728 g022
Figure 23. Working-function accessibility score distributions for the existing and proposed scenarios, showing the normal distribution in red, the median in green, the mean in blue, and the standard deviation in orange.
Land 15 01728 g023
Table 1. H3 resolution.
ResolutionTotal Number of CellsAverage Hexagon Area (m2)Average Edge Length (m)
01224,357,449,416,078.3921,281,256.011
1842609,788,441,794.134483,056.839
2588286,801,780,398.997182,512.957
341,16212,393,434,655.08868,979.222
4288,1221,770,347,654.49126,071.760
52,016,842252,903,858.1829,854.091
614,117,88236,129,062.1643,724.533
798,825,1625,161,293.3601,406.476
8691,776,122737,327.598531.414
94,842,432,842105,332.513200.786
1033,897,029,88215,047.50275.864
11237,279,209,1622149.64328.664
121,660,954,464,122307.09210.830
1311,626,681,248,84243.8704.092
1481,386,768,741,8826.2671.546
15569,707,381,193,1620.8950.584
Table 2. Services selected for proximity analysis.
Social FunctionIn ProximityIntermediateCentral
LivingBus stopNursing home, metro stop-
WorkingChildcare centerOffices-
SupplyingBakery, butcher shop, local marketSupermarket-
LearningKindergartenSchoolUniversity
CaringDoctor’s office, pharmacyDentistHospital, clinic
EnjoyingParkFitness centre, library, restaurant, cafeCinema, swimming pool, stadium
GoverningPost office, ATMBank, police stationTown hall
Table 3. Services and H3 hexagons included in the analysis.
Social FunctionAmenityNumber of POIsNumber of H3 Cells Covered per AmenityNumber of H3 Cells Covered per Function
LivingBus stop7911921388
Nursing home1182
Metro stop8317
WorkingChildcare center23691037
Office16838
SupplyingBakery228051602
Butcher shop16555
Local market3556
Supermarket40968
LearningKindergarten298231326
School20718
University4497
CaringDoctor’s office114601946
Pharmacy701162
Dentist29839
Hospital5420
Clinic13699
EnjoyingPark318942288
Fitness centre5314
Library8728
Restaurant34794
Café12827
Cinema1201
Swimming pool3245
Stadium2253
GoverningPost office45021702
ATM10698
Bank37963
Police station4542
Town hall1238
Table 4. Statistics for the 1:1:1, 3:2:1, and 5:3:1 weighting specifications.
Descriptive Statistic1:1:13:2:15:3:1
Mean0.1251030.1240180.123603
Median0.0900830.0896670.089450
Standard deviation0.1166440.1152590.114837
Minimum0.0014010.0013430.001116
Maximum0.5016110.4970690.496299
Skewness1.2454631.2516761.253866
Kurtosis3.9675873.9913343.999152
Table 5. Cell-level sensitivity of accessibility results to alternative weighting specifications.
Comparison1:1:1 vs. 3:2:11:1:1 vs. 5:3:13:2:1 vs. 5:3:1
Spearman’s ρ0.99910.99860.9999
Mean absolute difference0.00290.00370.0008
Maximum absolute difference0.01410.01800.0039
Same class (%)95.394.198.8
One-class shift (%)4.75.91.2
Highest-class Jaccard overlap (%)97.697.199.5
Disclaimer/Publisher’s Note: The statements, opinions and data contained in all publications are solely those of the individual author(s) and contributor(s) and not of MDPI and/or the editor(s). MDPI and/or the editor(s) disclaim responsibility for any injury to people or property resulting from any ideas, methods, instructions or products referred to in the content.