A System Dynamics Model and Analytic Network Process: An Integrated Approach to Investigate Urban Resilience


Abstract
1. Introduction
2. Method
2.1. Analytic Network Process
2.1.1. Properties and State of the Art
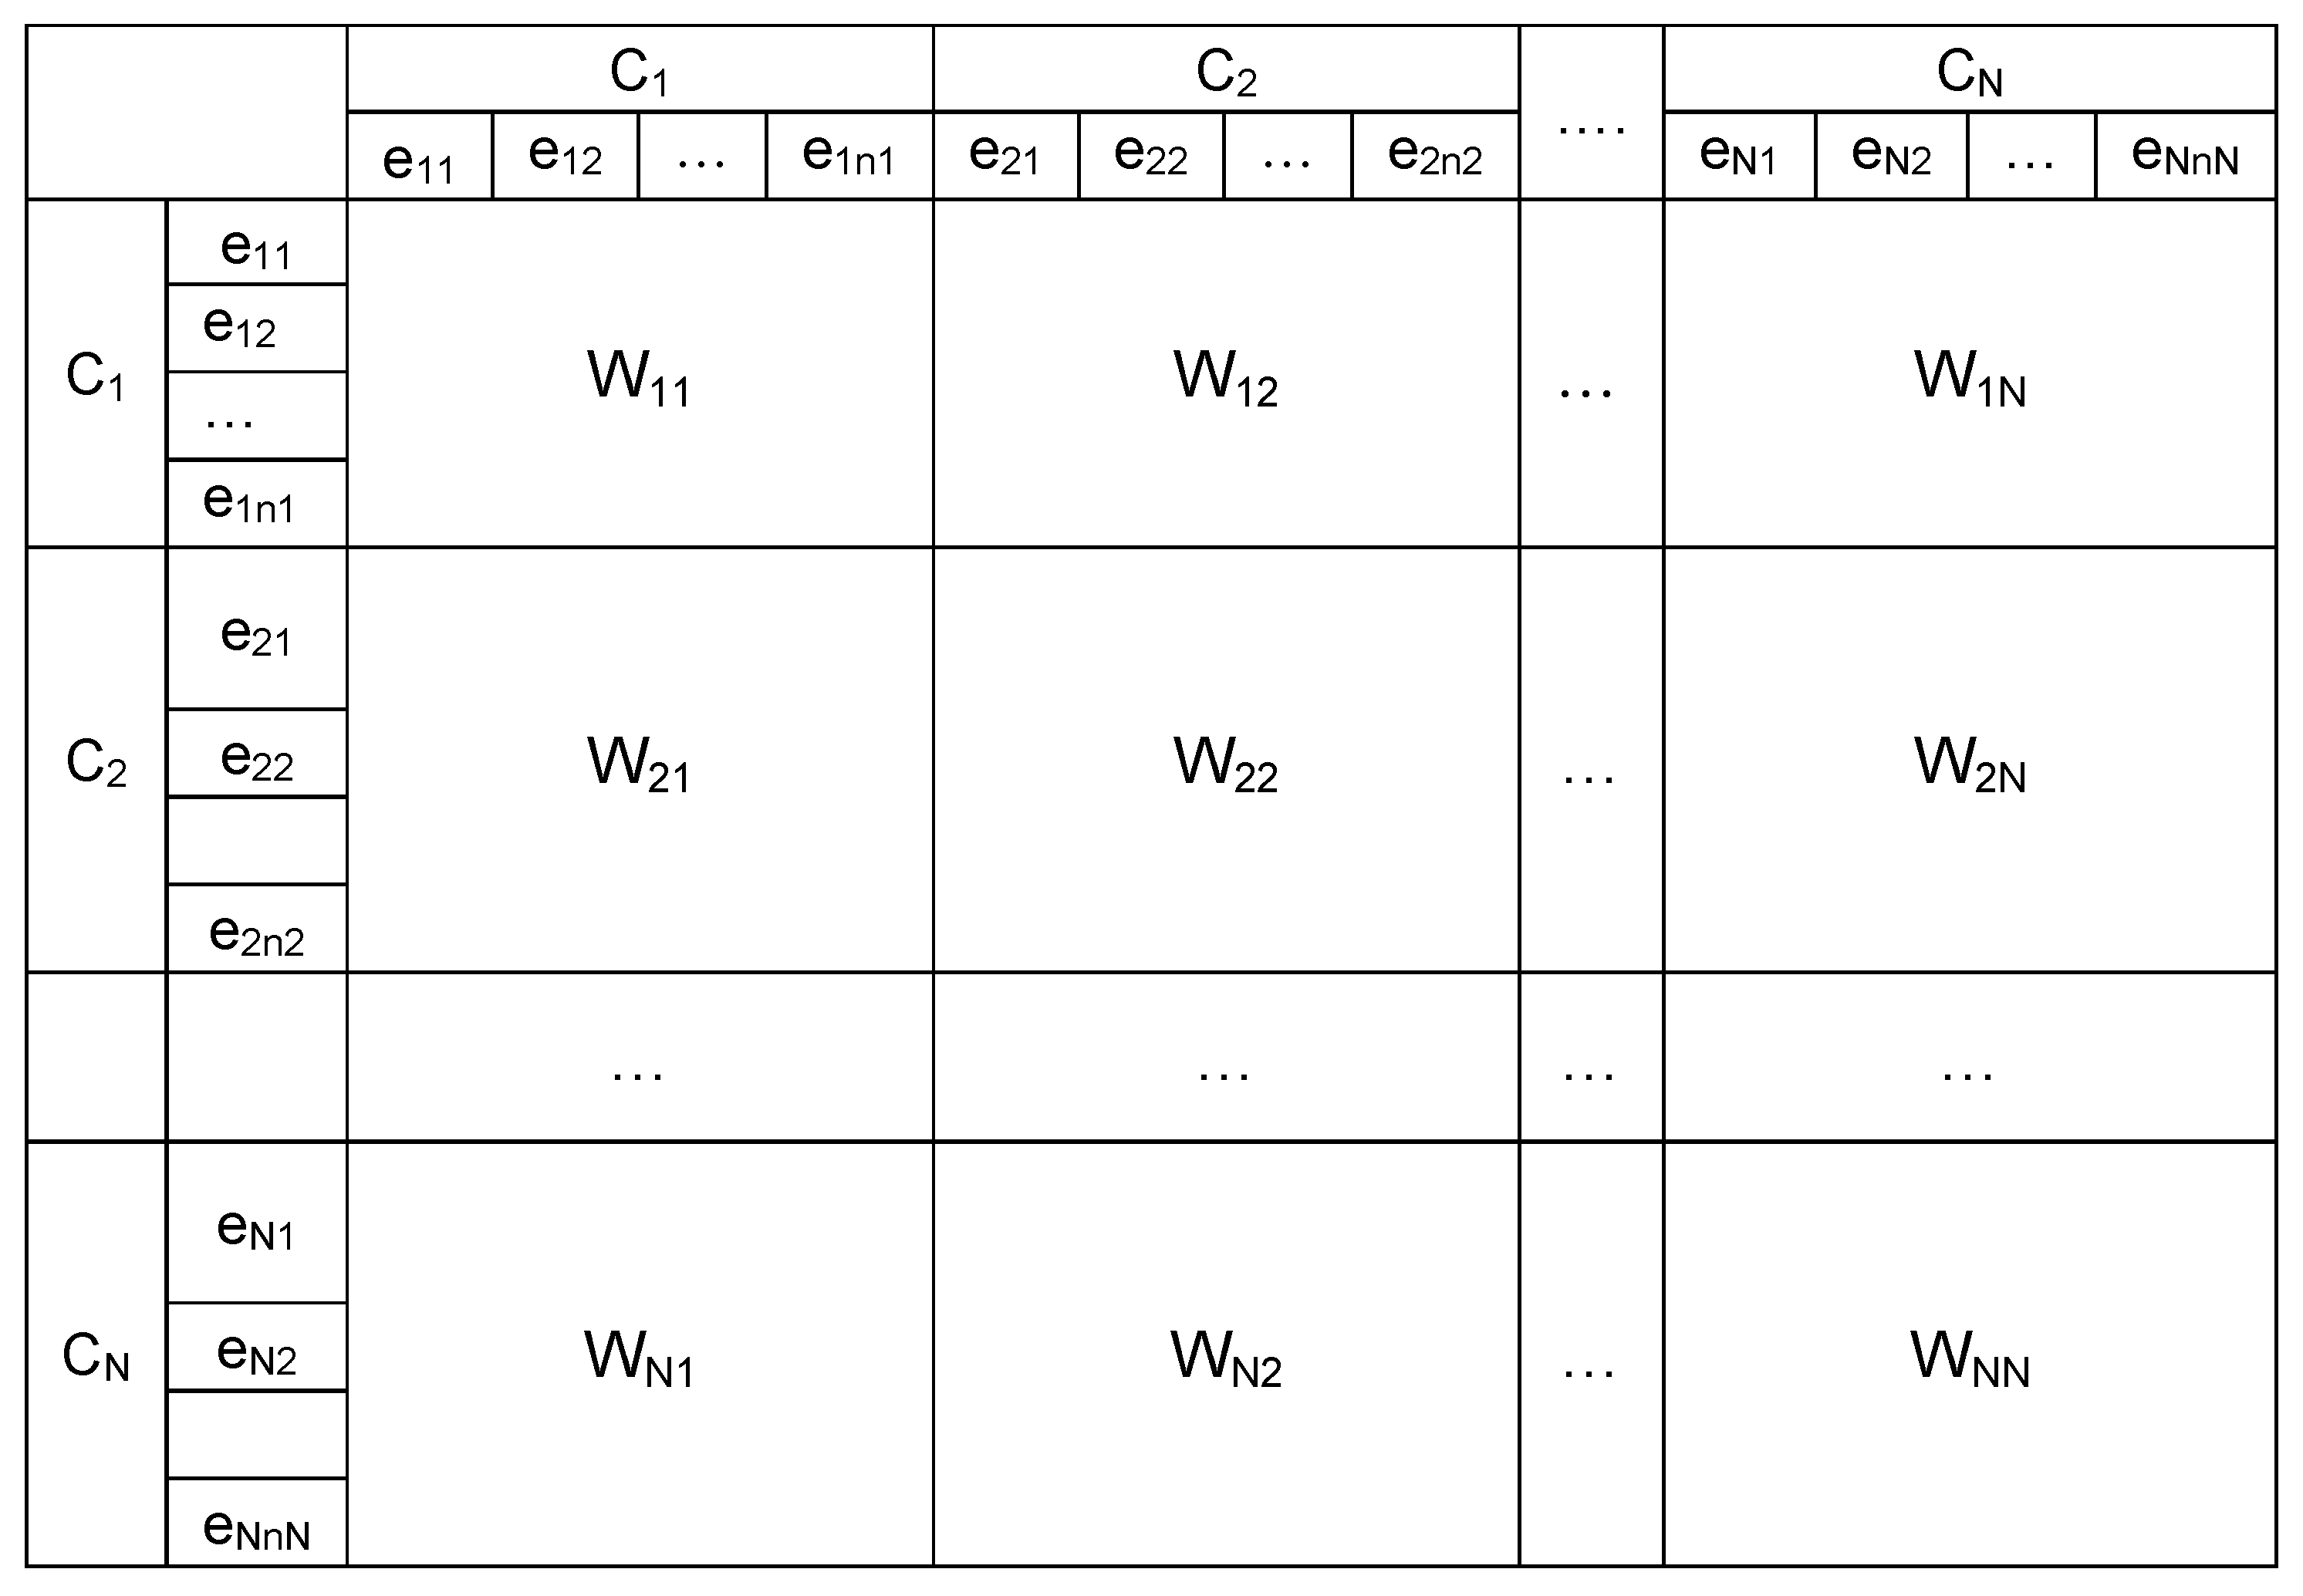
2.1.2. Methodology
2.2. System Dynamics Model
2.2.1. Properties and State of the Art
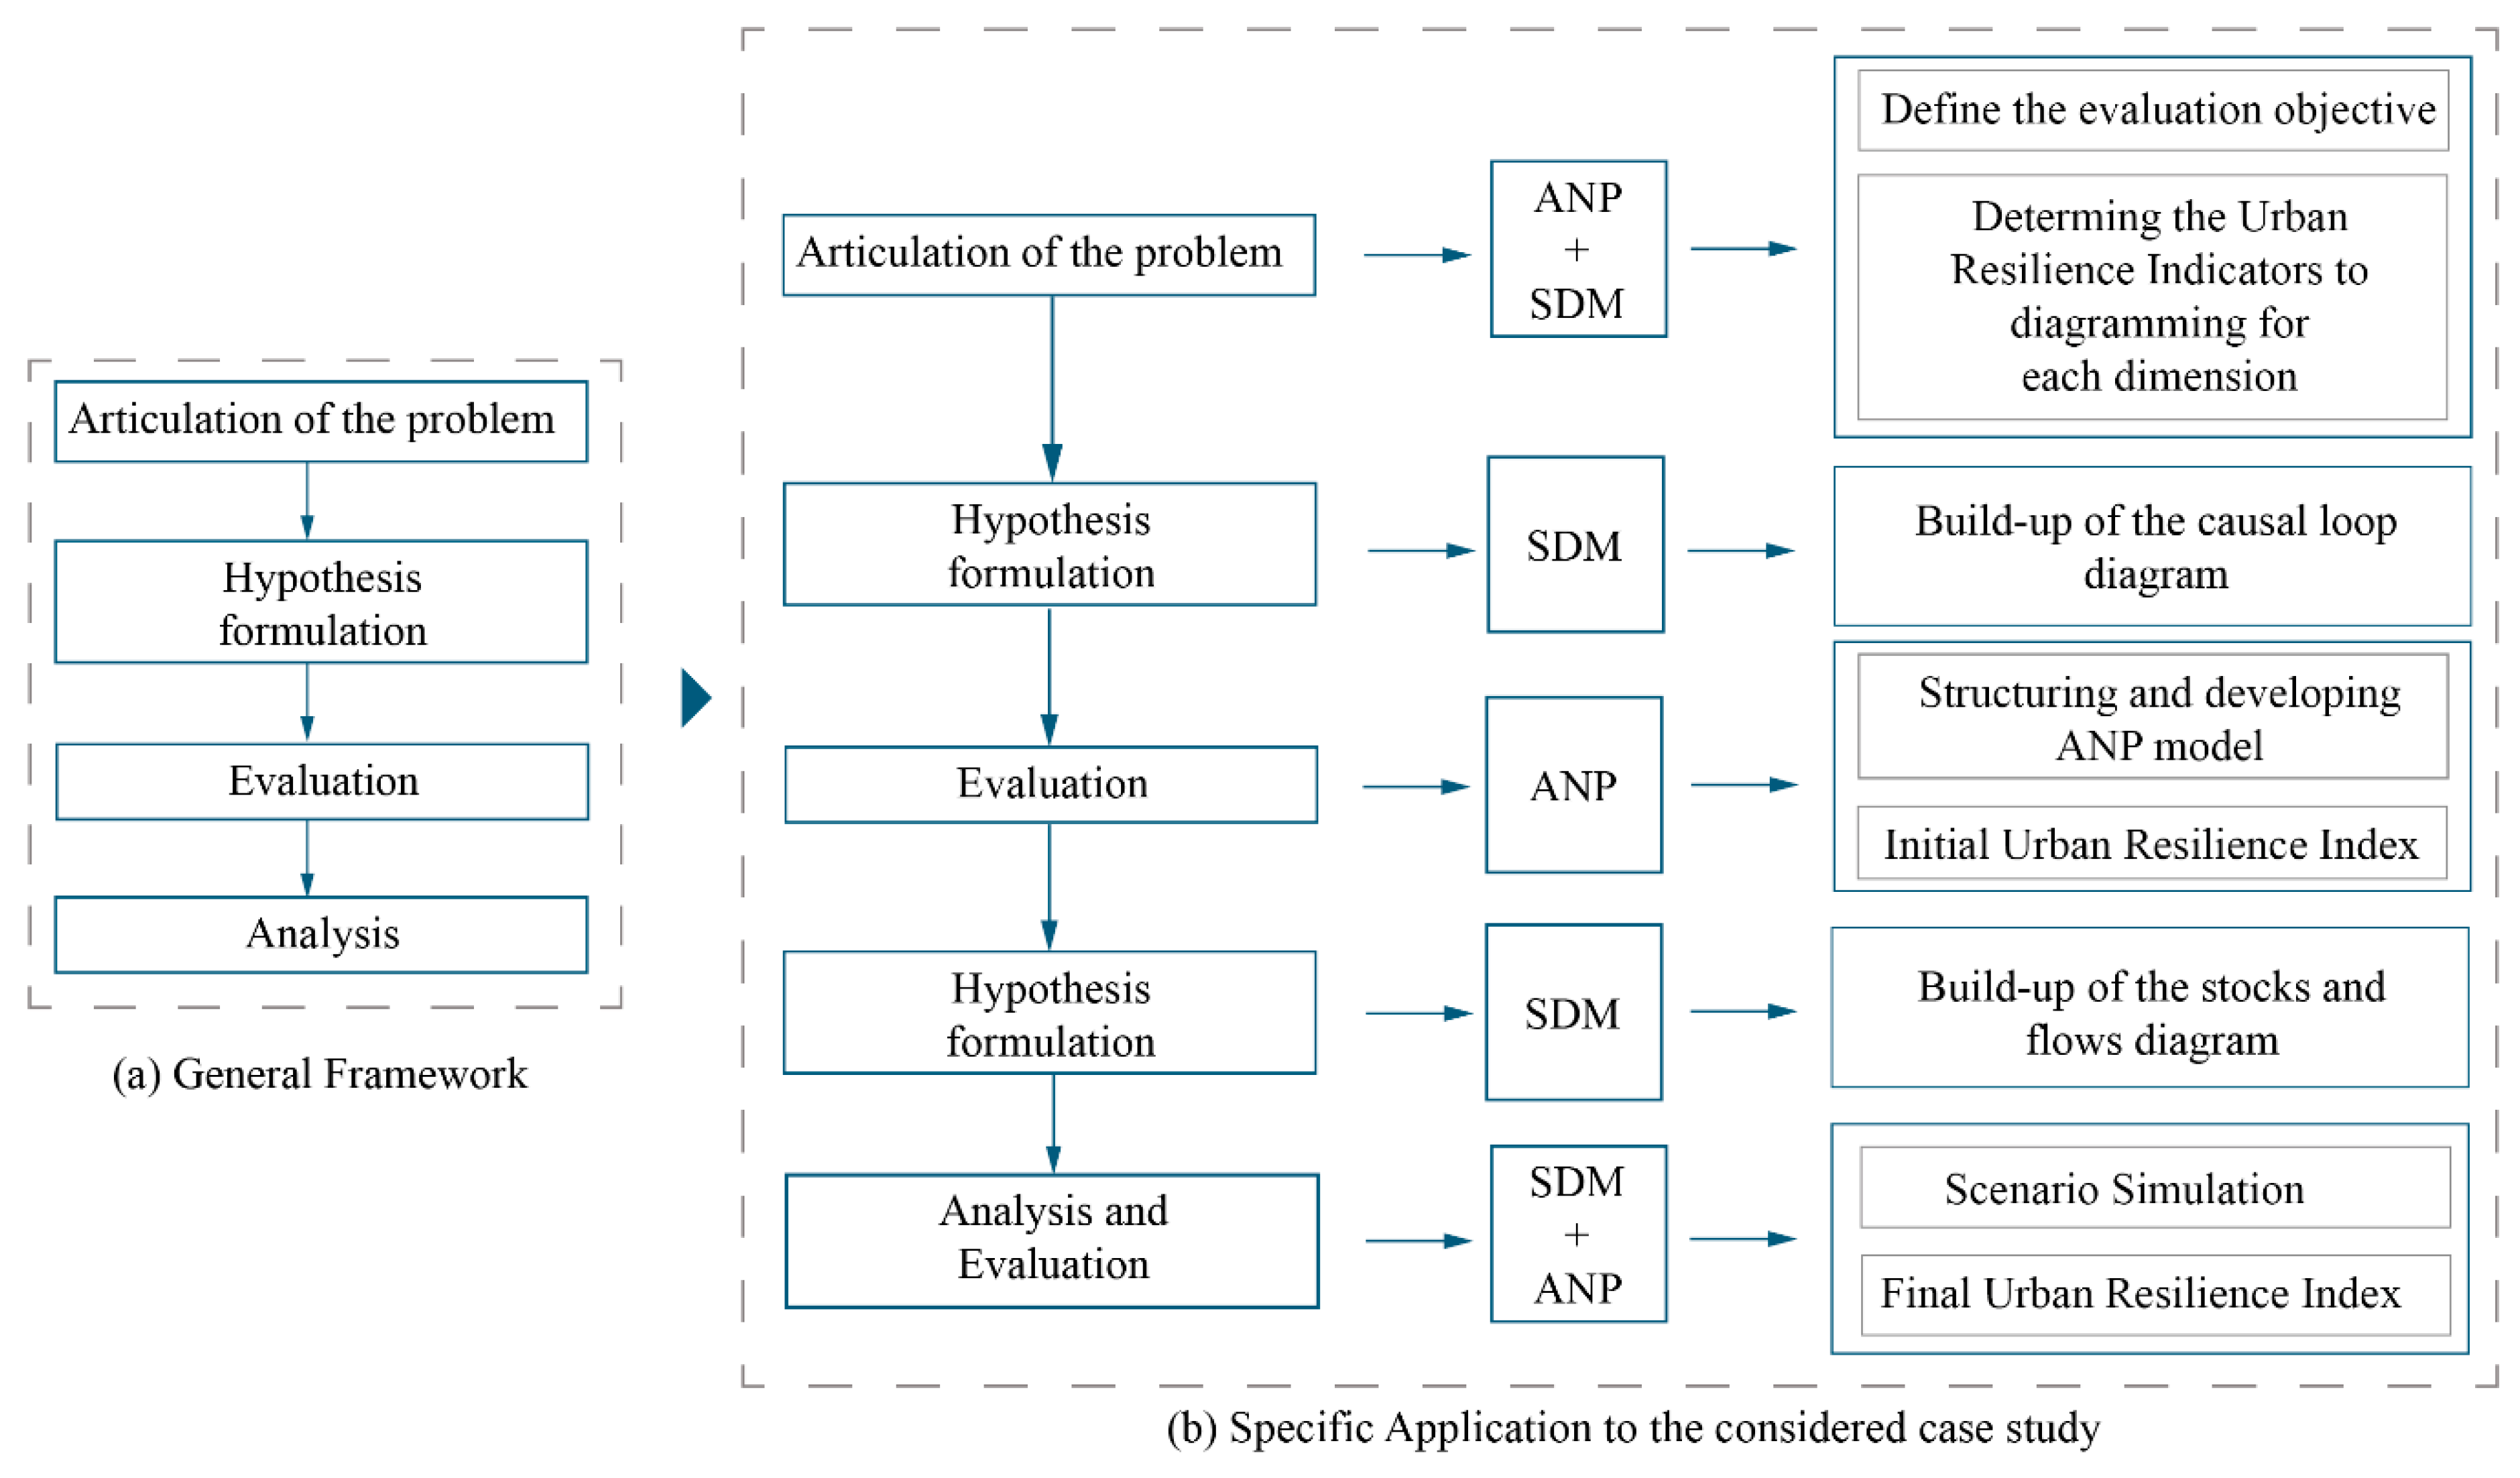
2.2.2. Methodology
- Identify the problem. This is the first step to implement the SDM. This phase concerns the identification of the problem, in order to set the boundaries of the system and define the specific objective;
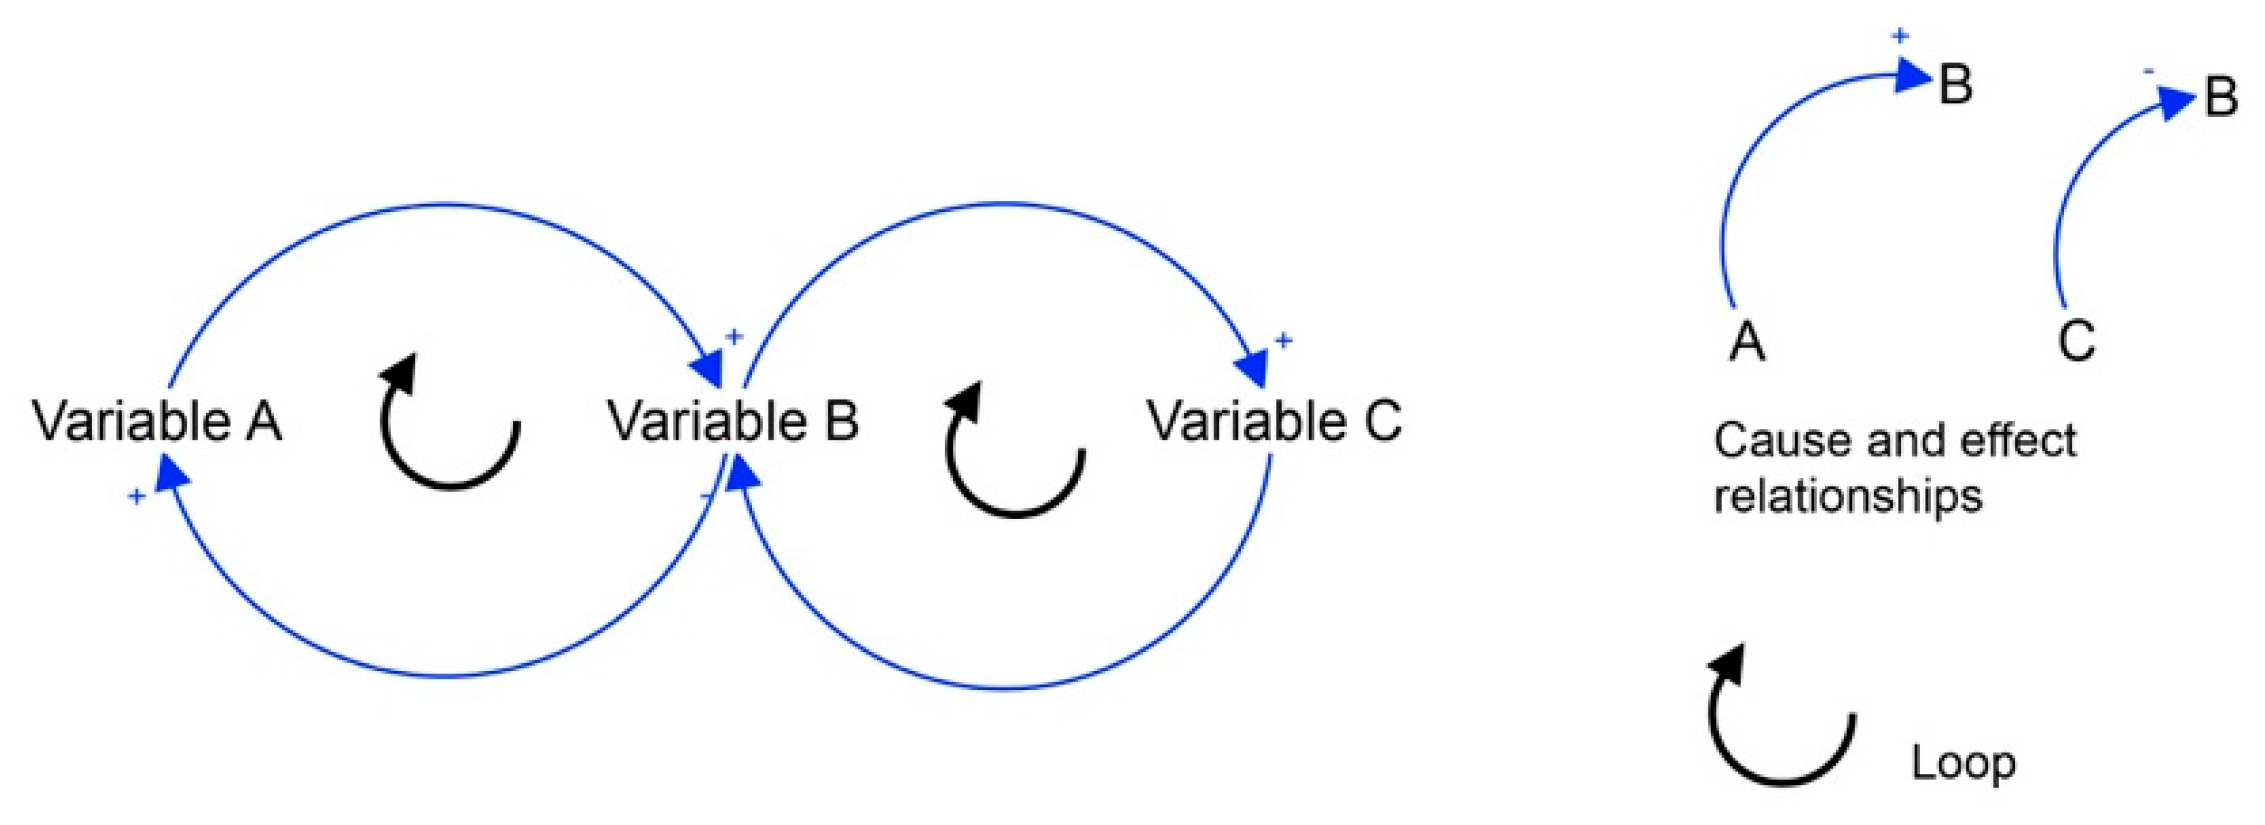
- Develop a dynamic hypothesis. This step is referred to a theory that allows us to consider the mode behavior over time. In detail, the dynamic hypothesis is a conceptual model that consists of a causal loop diagram, stock and flow diagram or their combination;
- Create the basic structure of a causal graph. This phase concerns the processing of the causal loop diagram with the identification of the most important elements of the system and the relationships that occur among them;
- Augment the causal graph with more information. In this step, secondary and tertiary elements of the system are identified, in order to describe it in accurately;
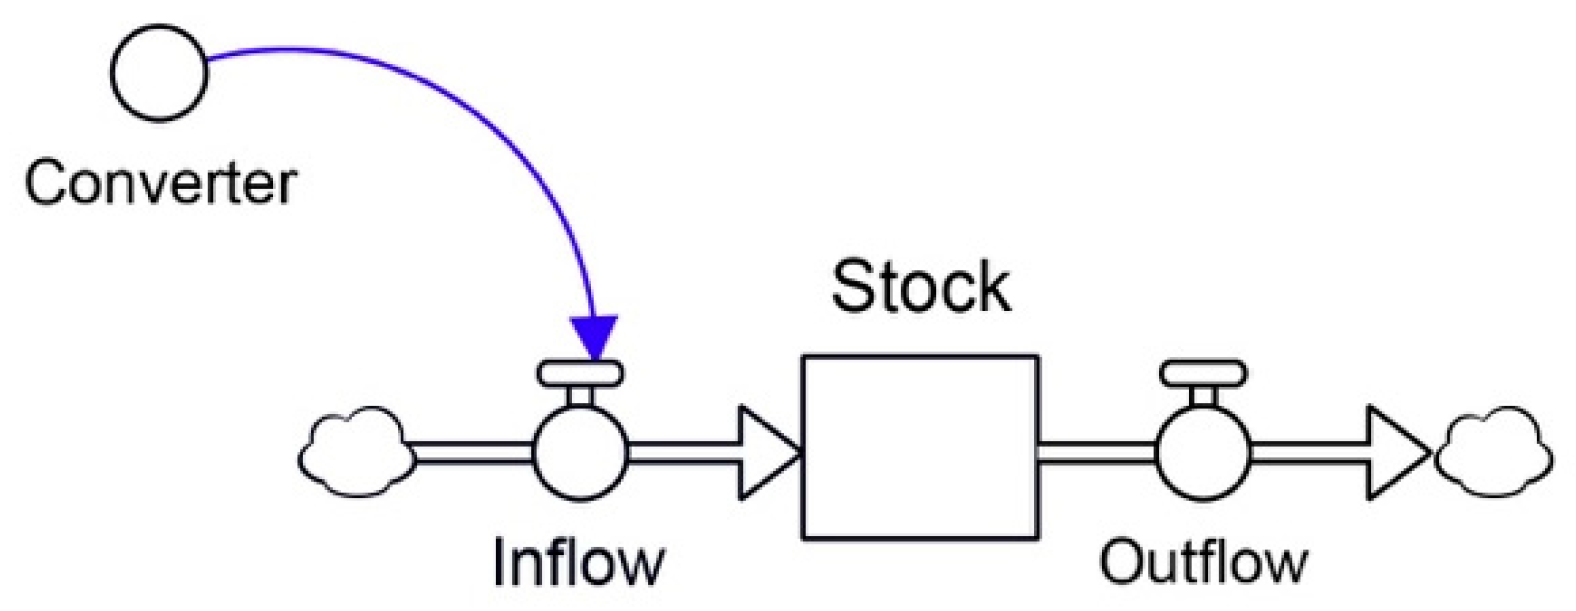
- Convert the augmented causal graph to a system dynamics flow graph. This step refers to the translation of the causal loop diagram into the stock and flow diagram that is used to simulate the dynamic behavior of the system over time;
- Translate a system dynamics flow graph into programs or equations. This phase is fundamental to get the representation of the dynamic behavior of the system over time.
3. Case Study
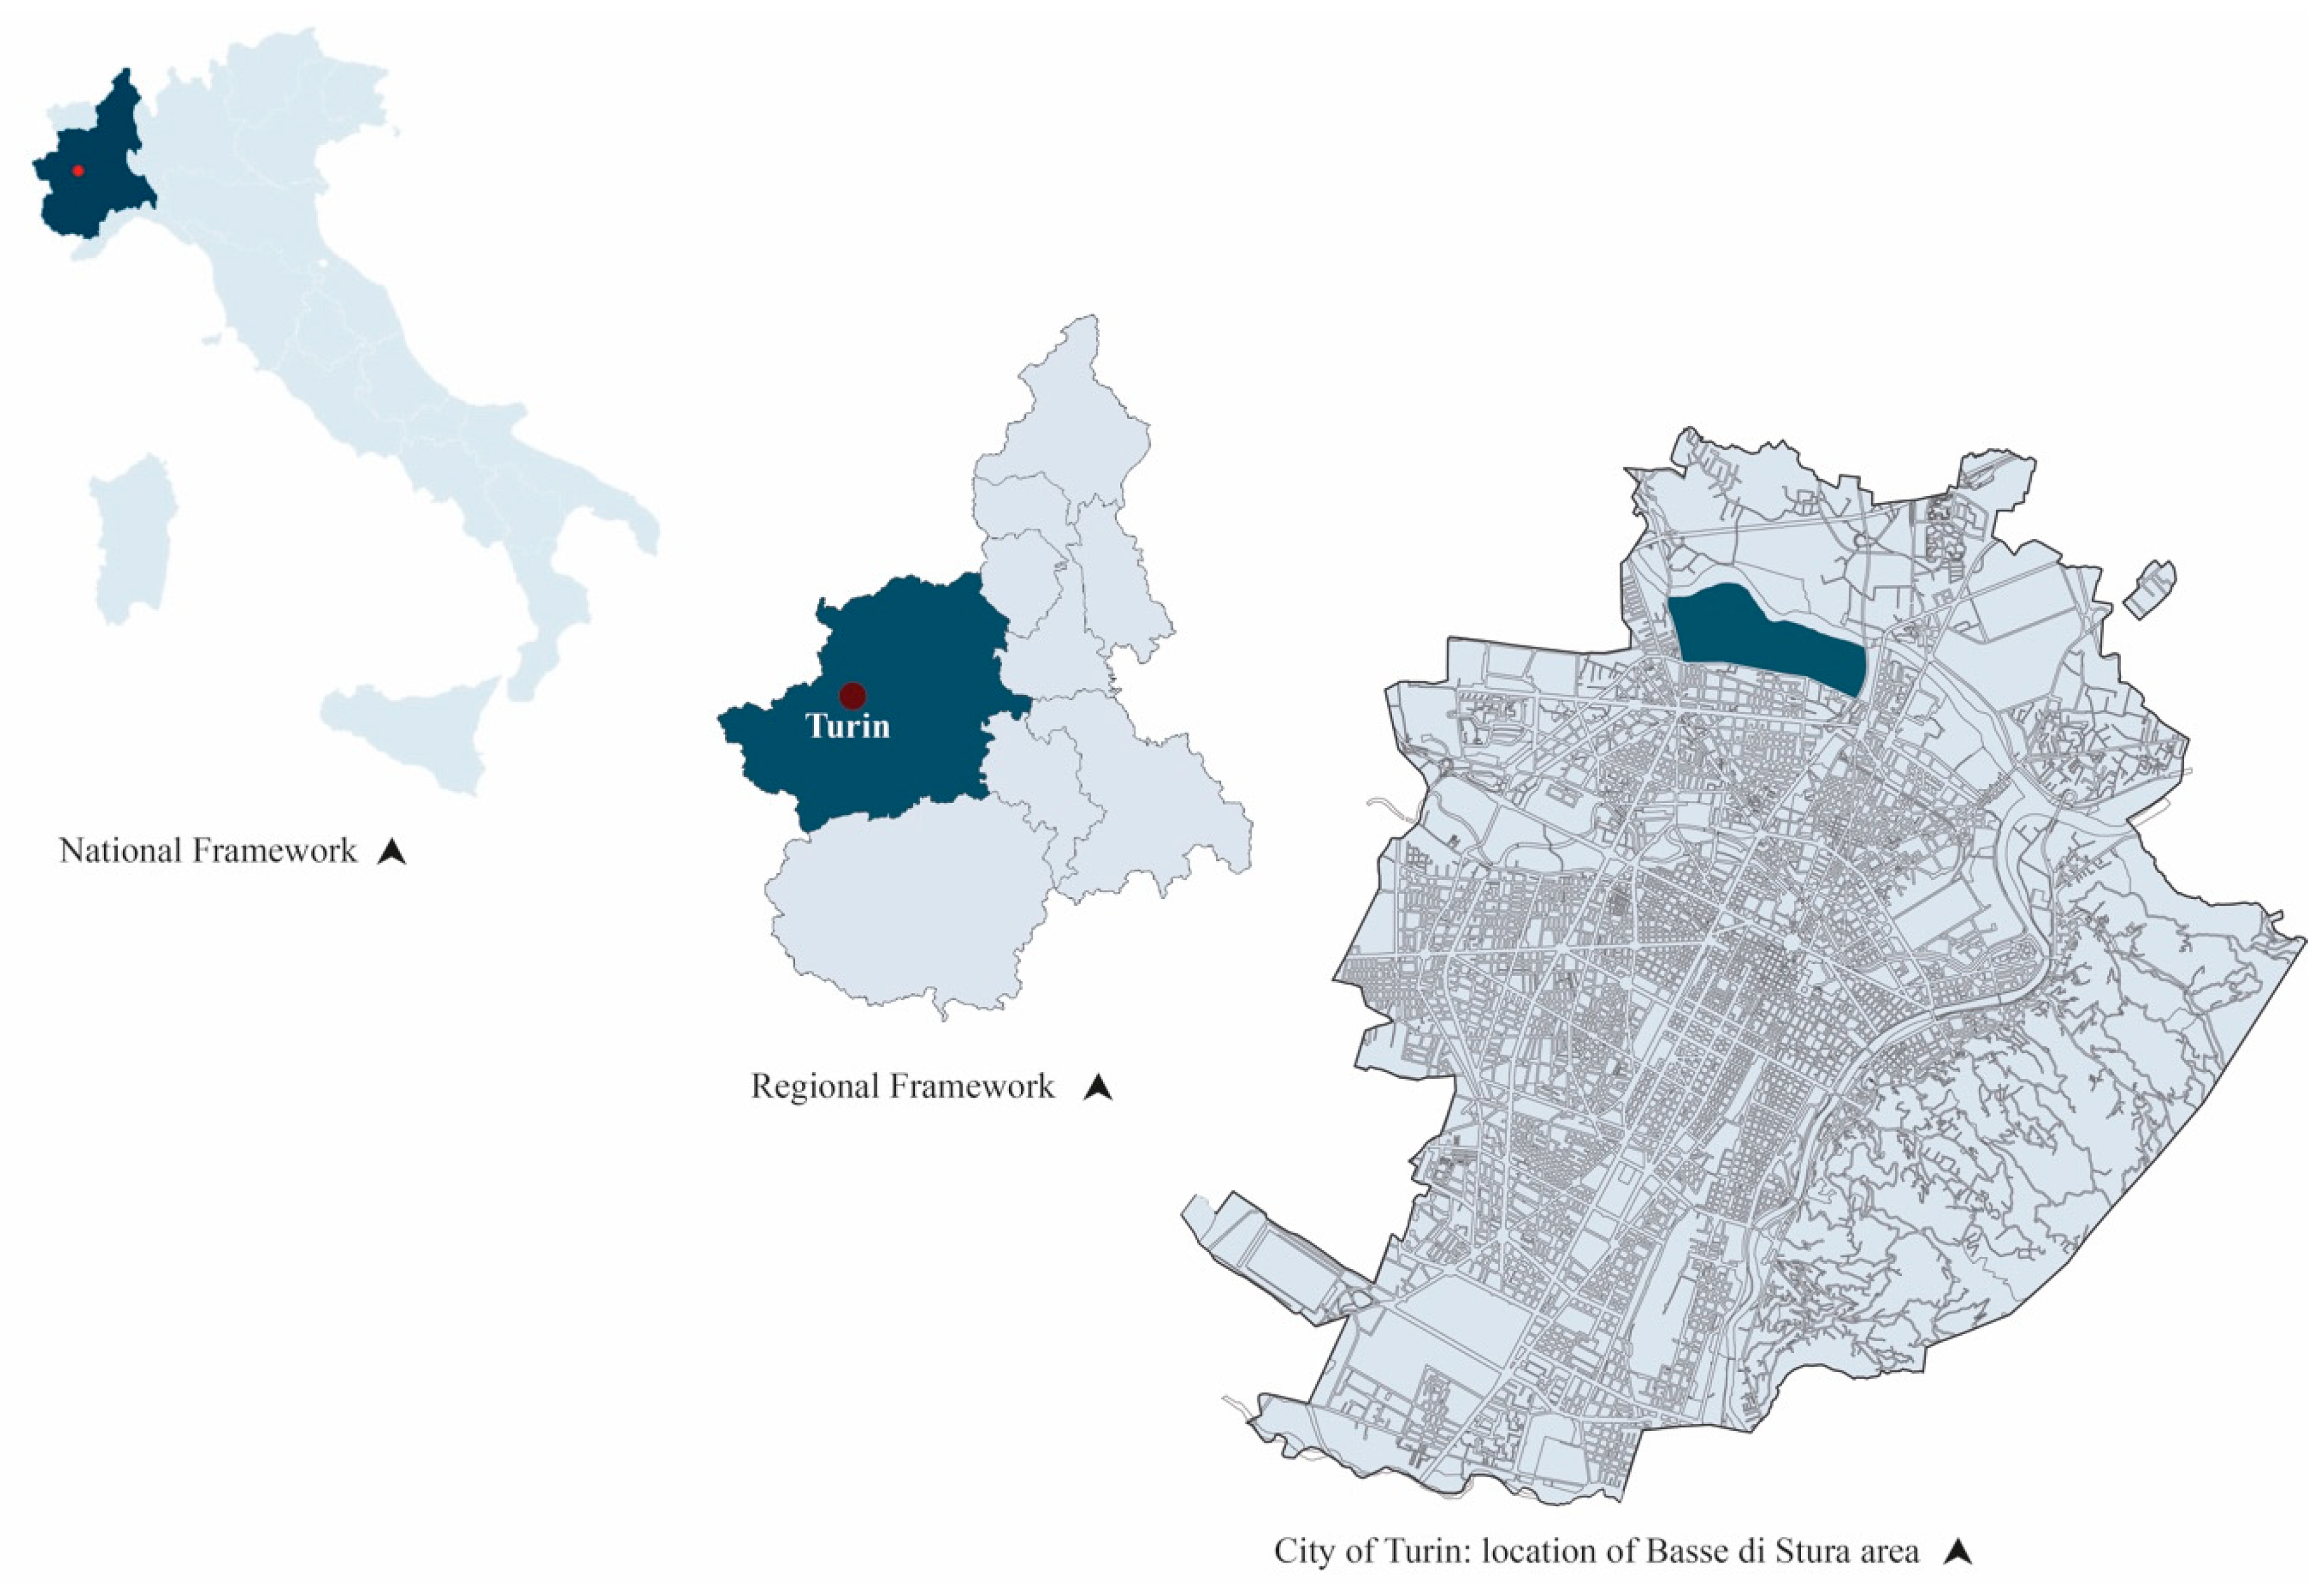
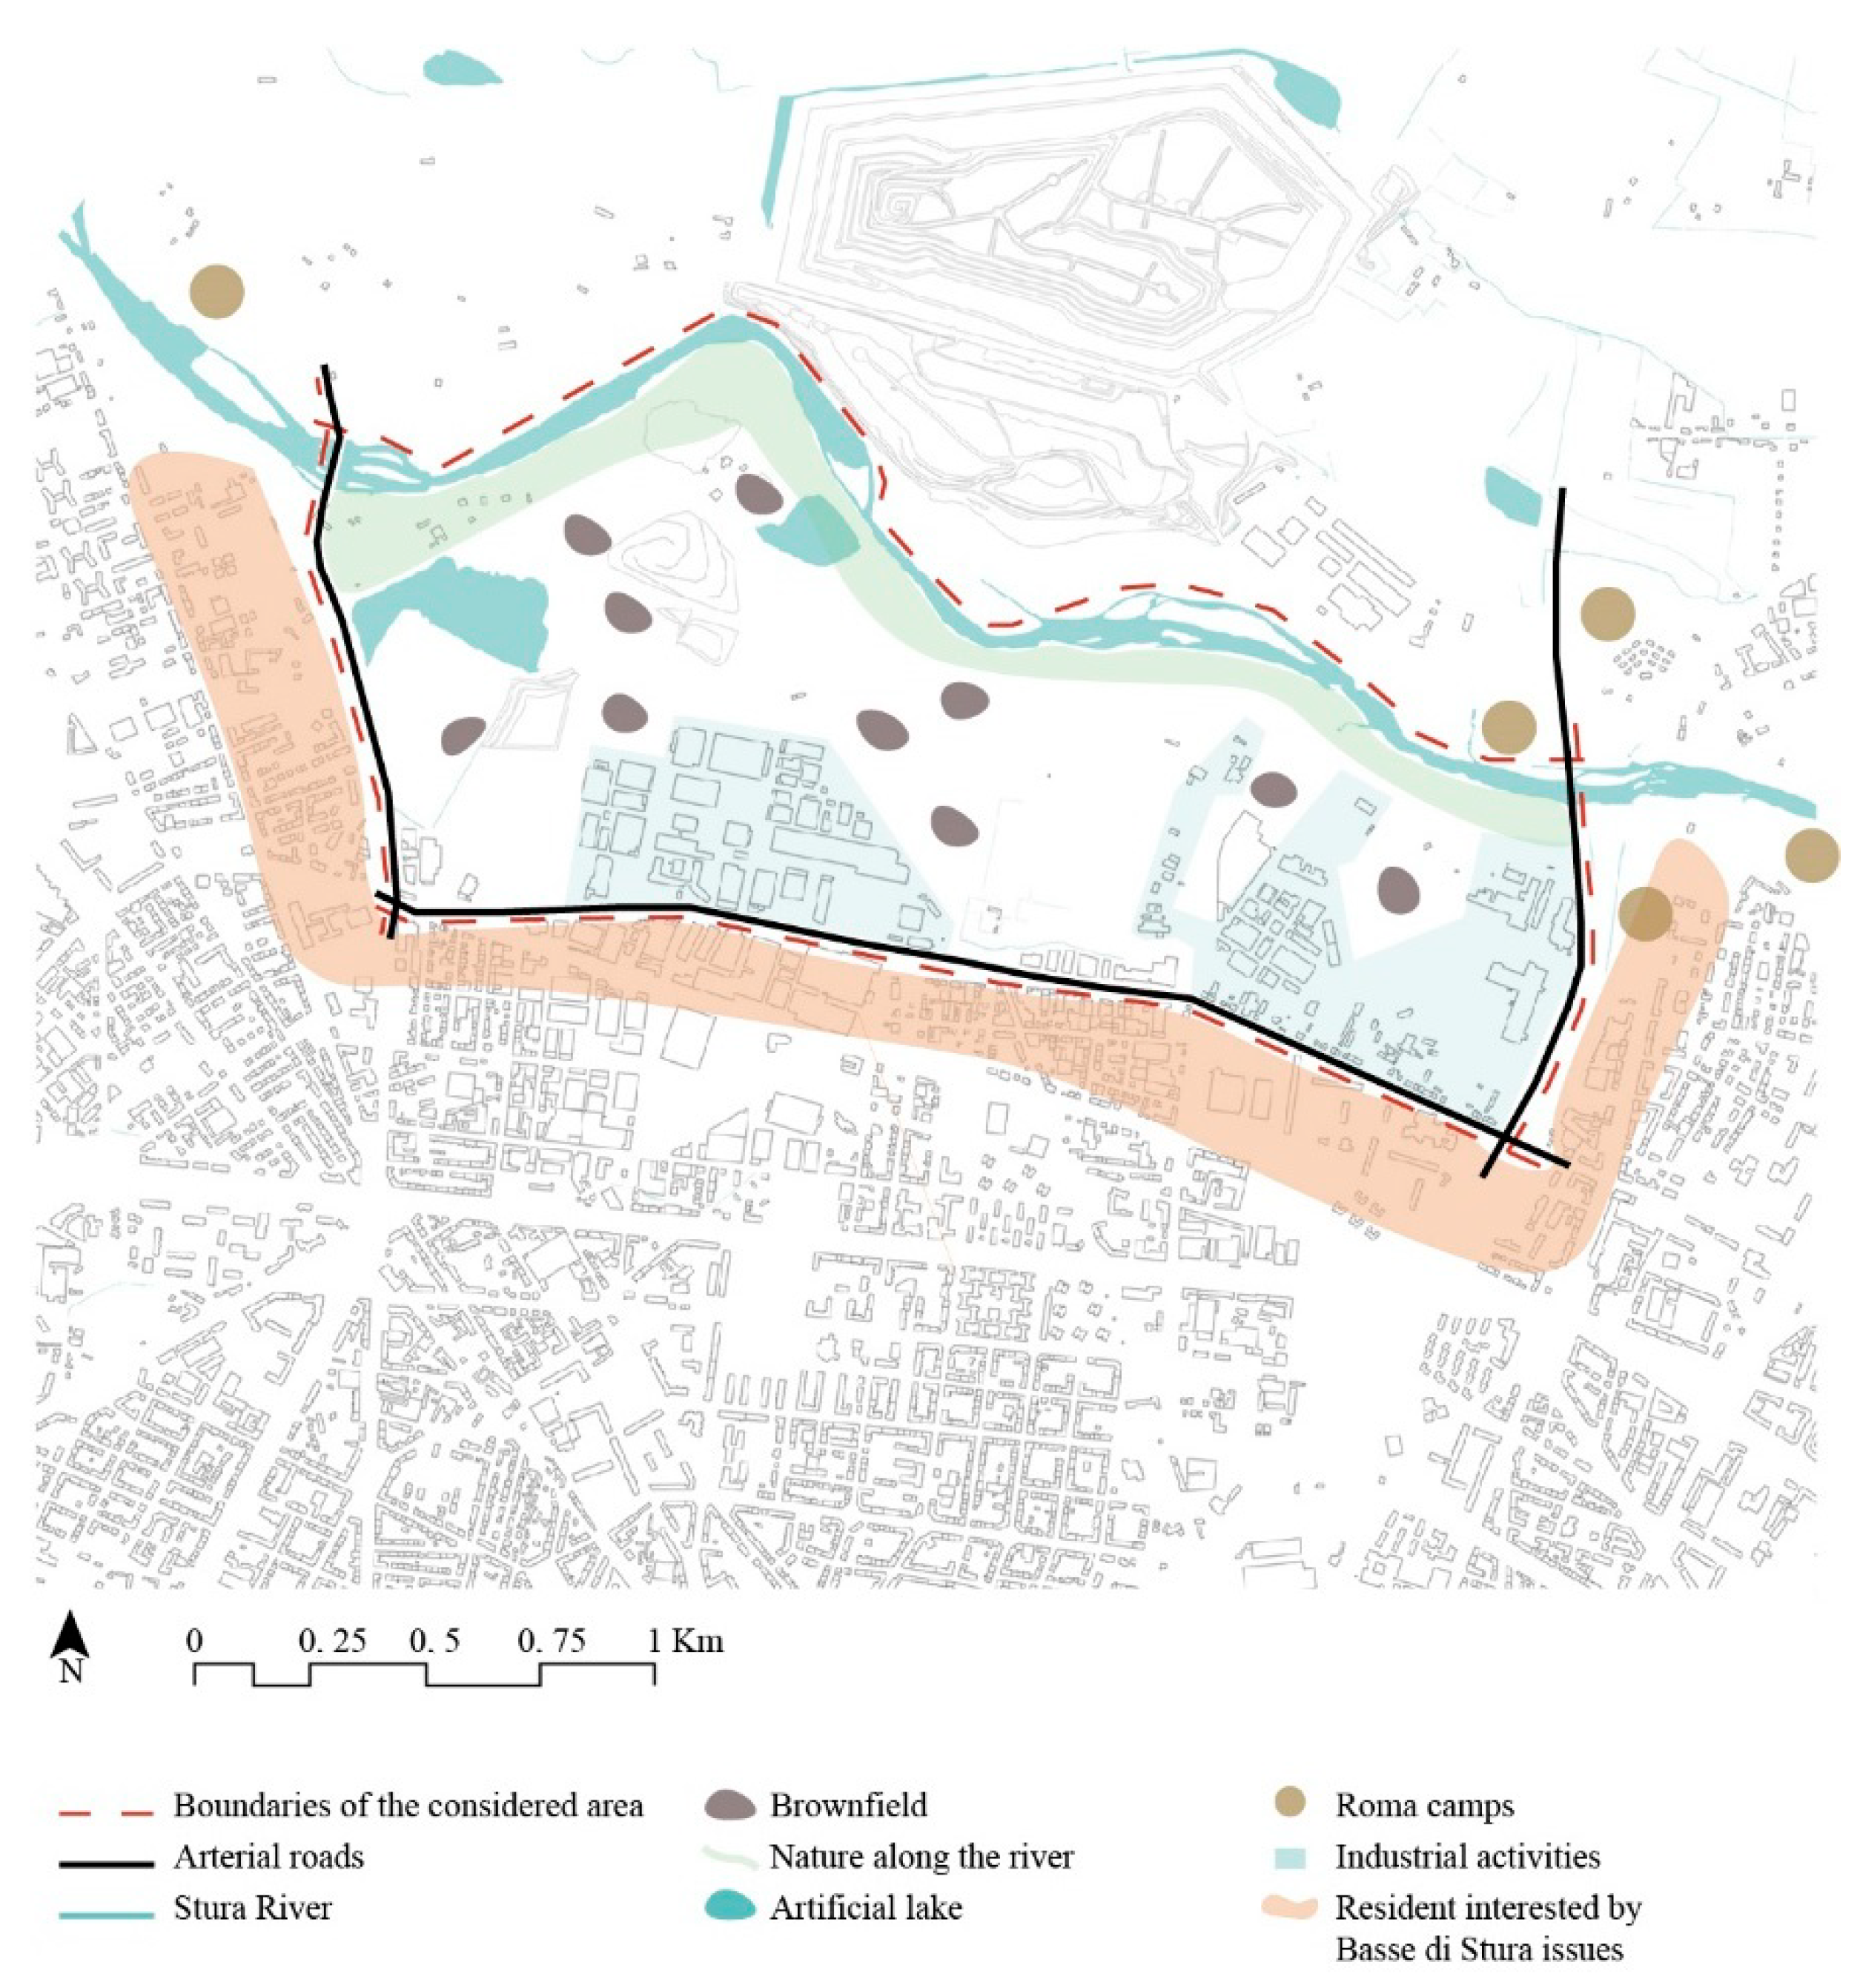
3.1. Basse Di Stura Area
- Industrial activities. A total of 40% of the entire area is covered by industrial buildings. Furthermore, most of them are actually abandoned and their bad state of conservation exposes them to several risks, such as collapse and fire;
- Brownfields. This is the main issue for the area of Basse di Stura. The high level of contamination (around 25% of the entire area) is due to the high presence of industrial activities in the past and the illegal disposal of industrial waste. For this reason, until 2013 this area has been classified as one of the contaminated sites of national interest by Italian Ministry of Environment and Sea [82];
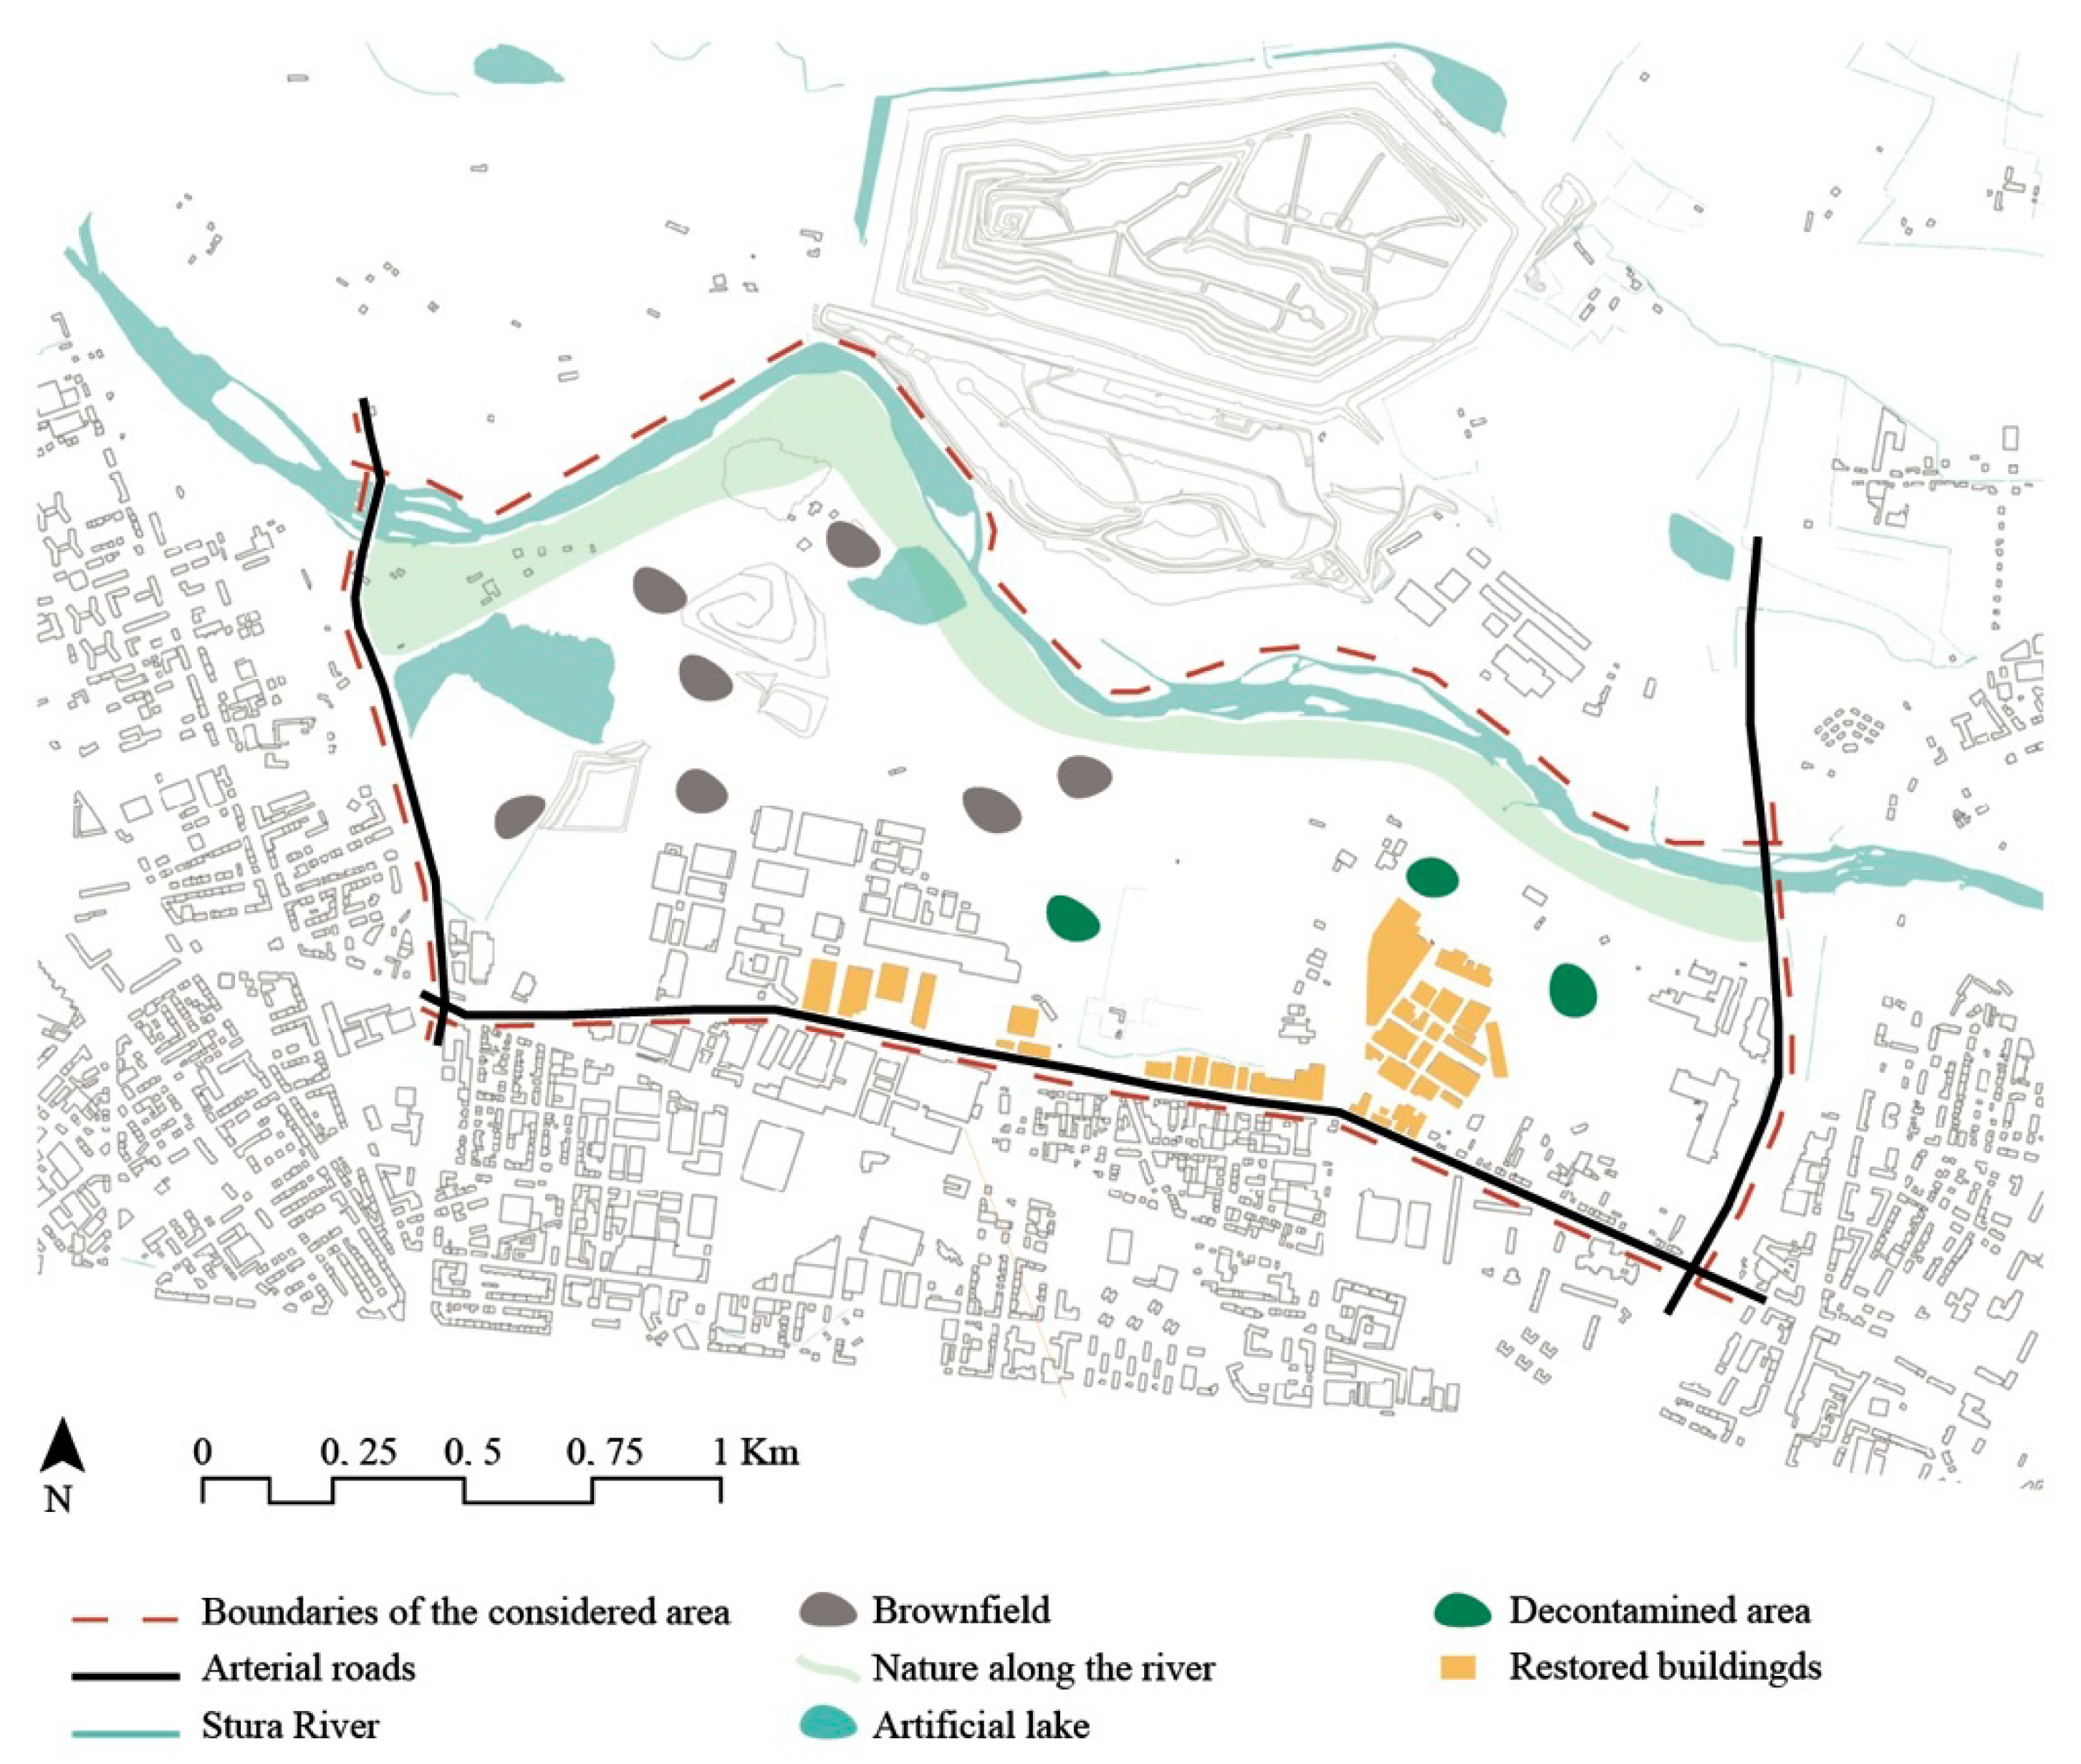
3.2. Strategic Scenario
- Retrieve the brownfield areas. The target is reclaiming some of the brownfield areas (Figure 7);
- Restoring some of the abandoned existing buildings, to insert some new activities to improve both social and economic conditions (Figure 7);
- Reducing the soil consumption. The main aim is trying to maintain minimum extensions of the permeable surface. This objective is mainly due to the proximity of this area to the Stura river, while also considering its environmental potentiality;
- Enhancing better conditions for the socio-economic dimension, through the hypothesis of creating new businesses in the restored buildings.
4. Application
4.1. Structuring of the Model
4.2. Identification of Indicators
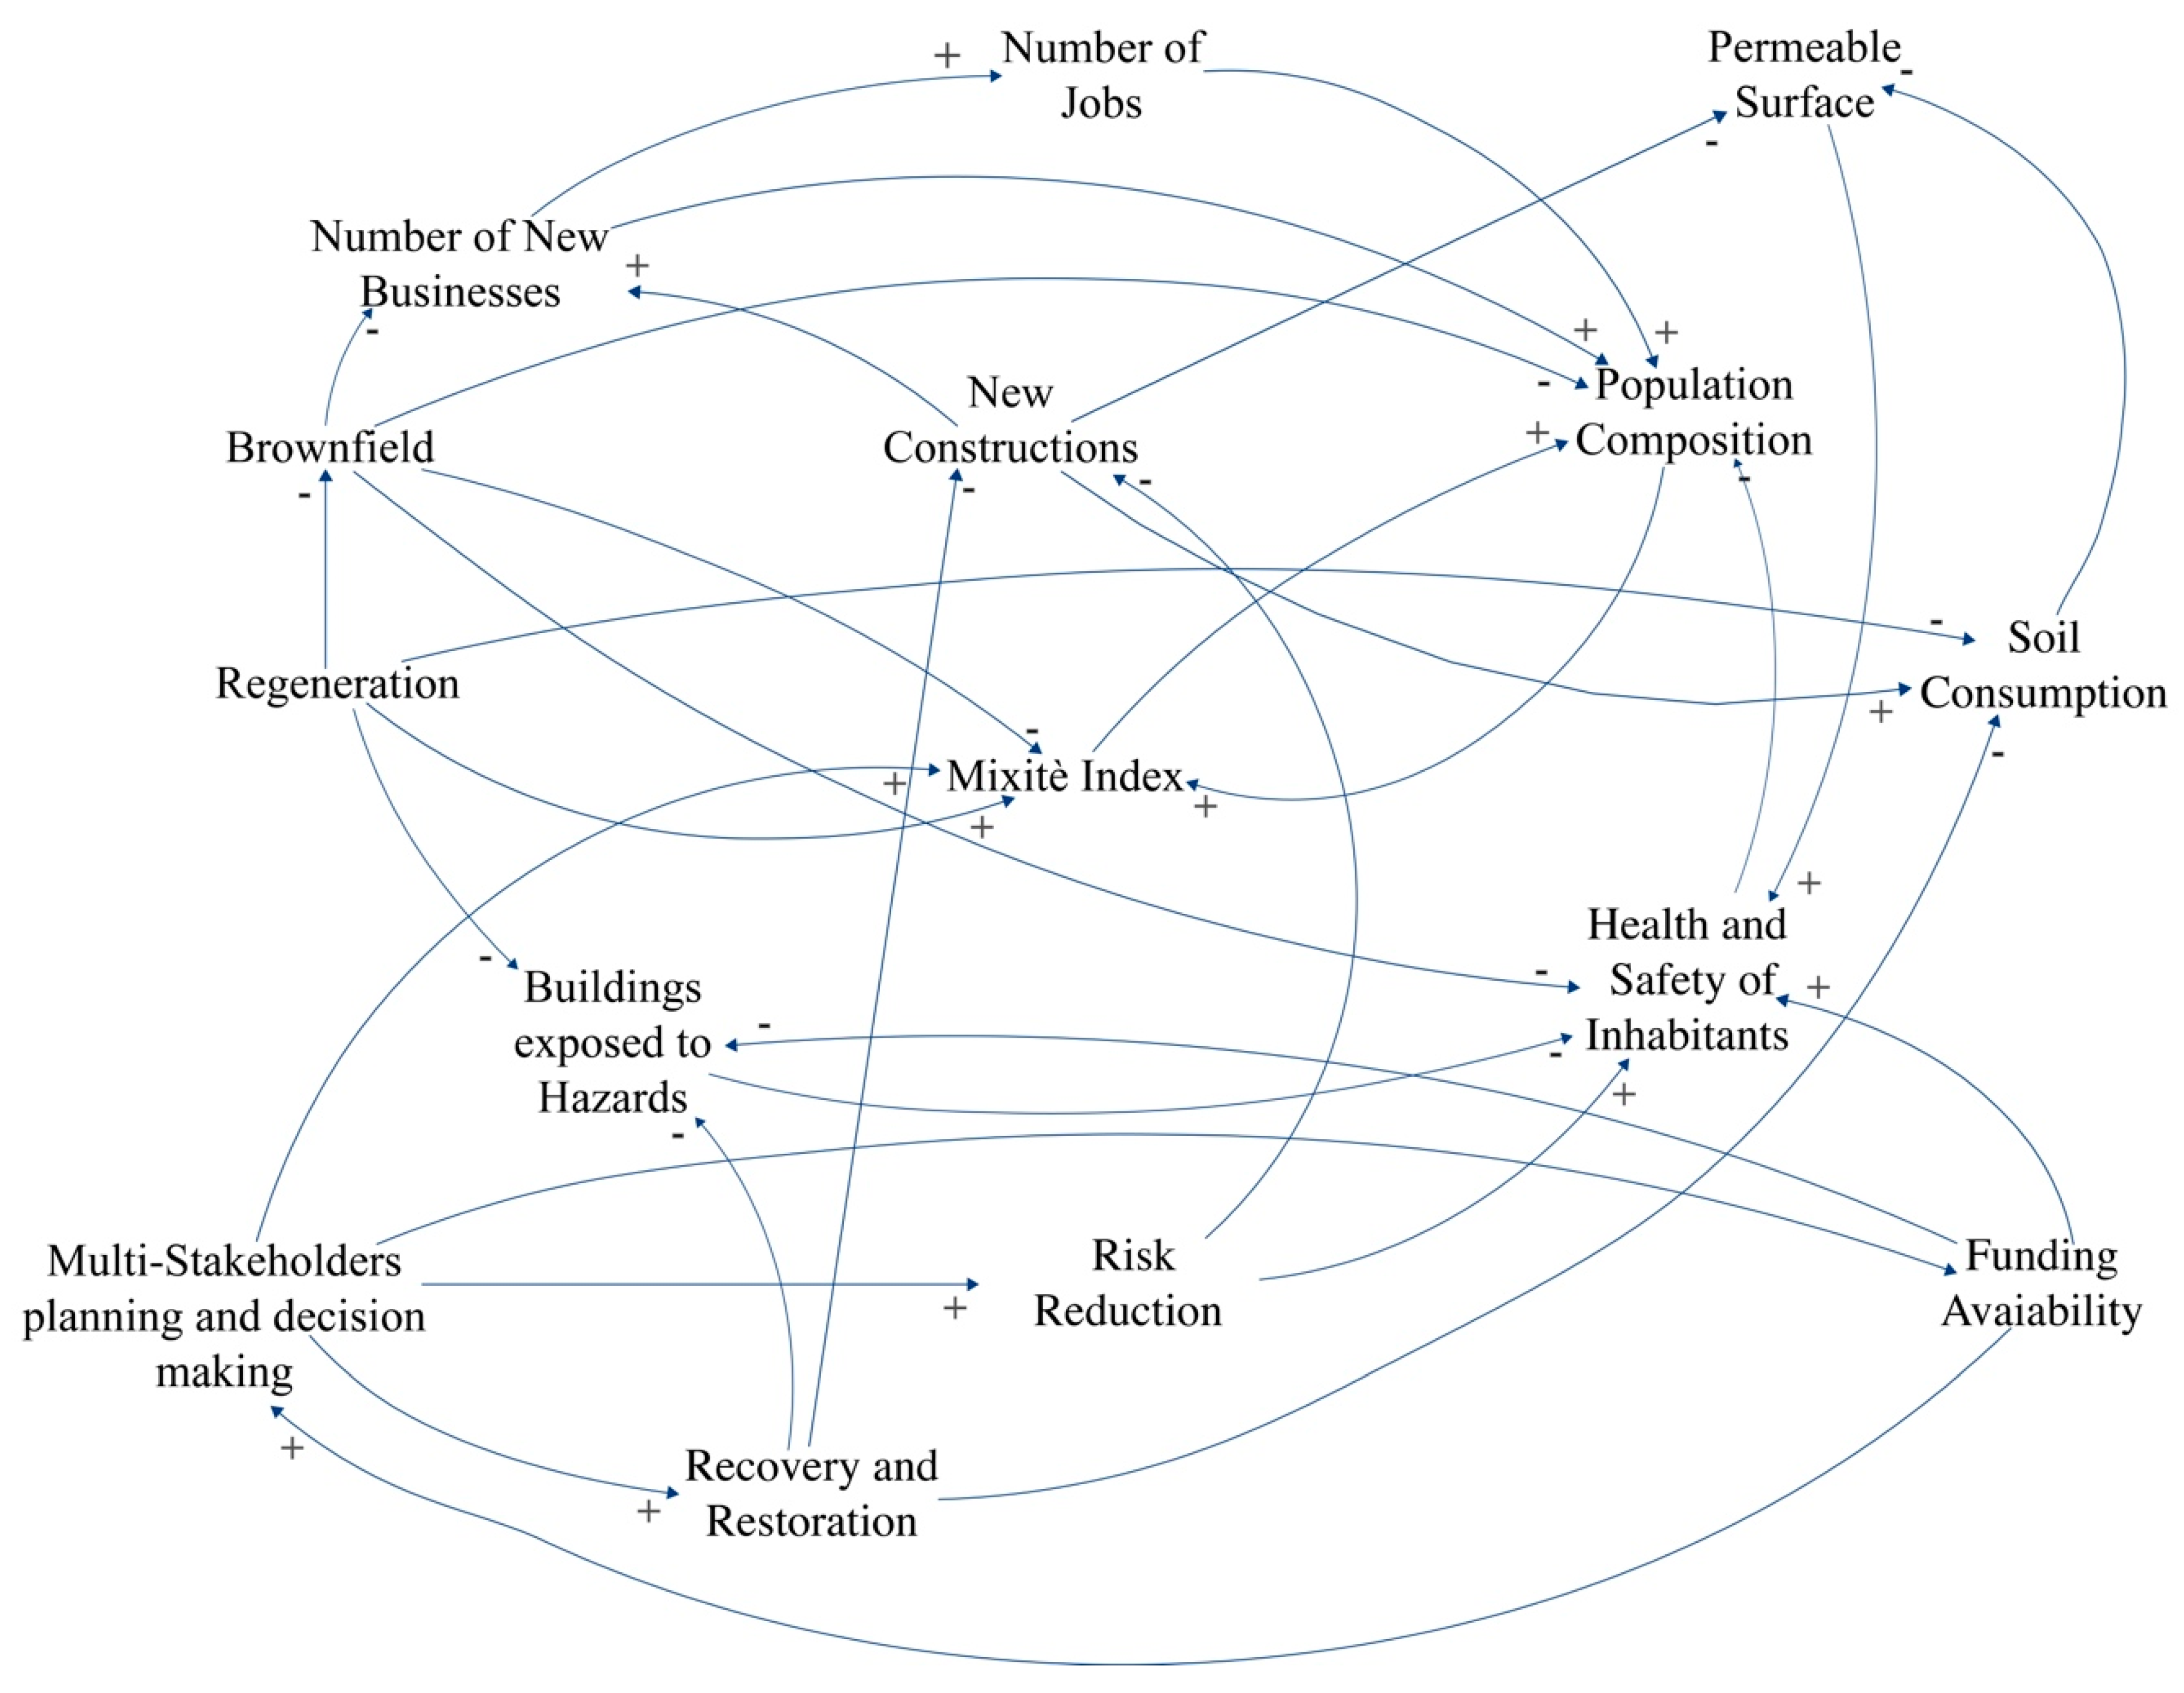
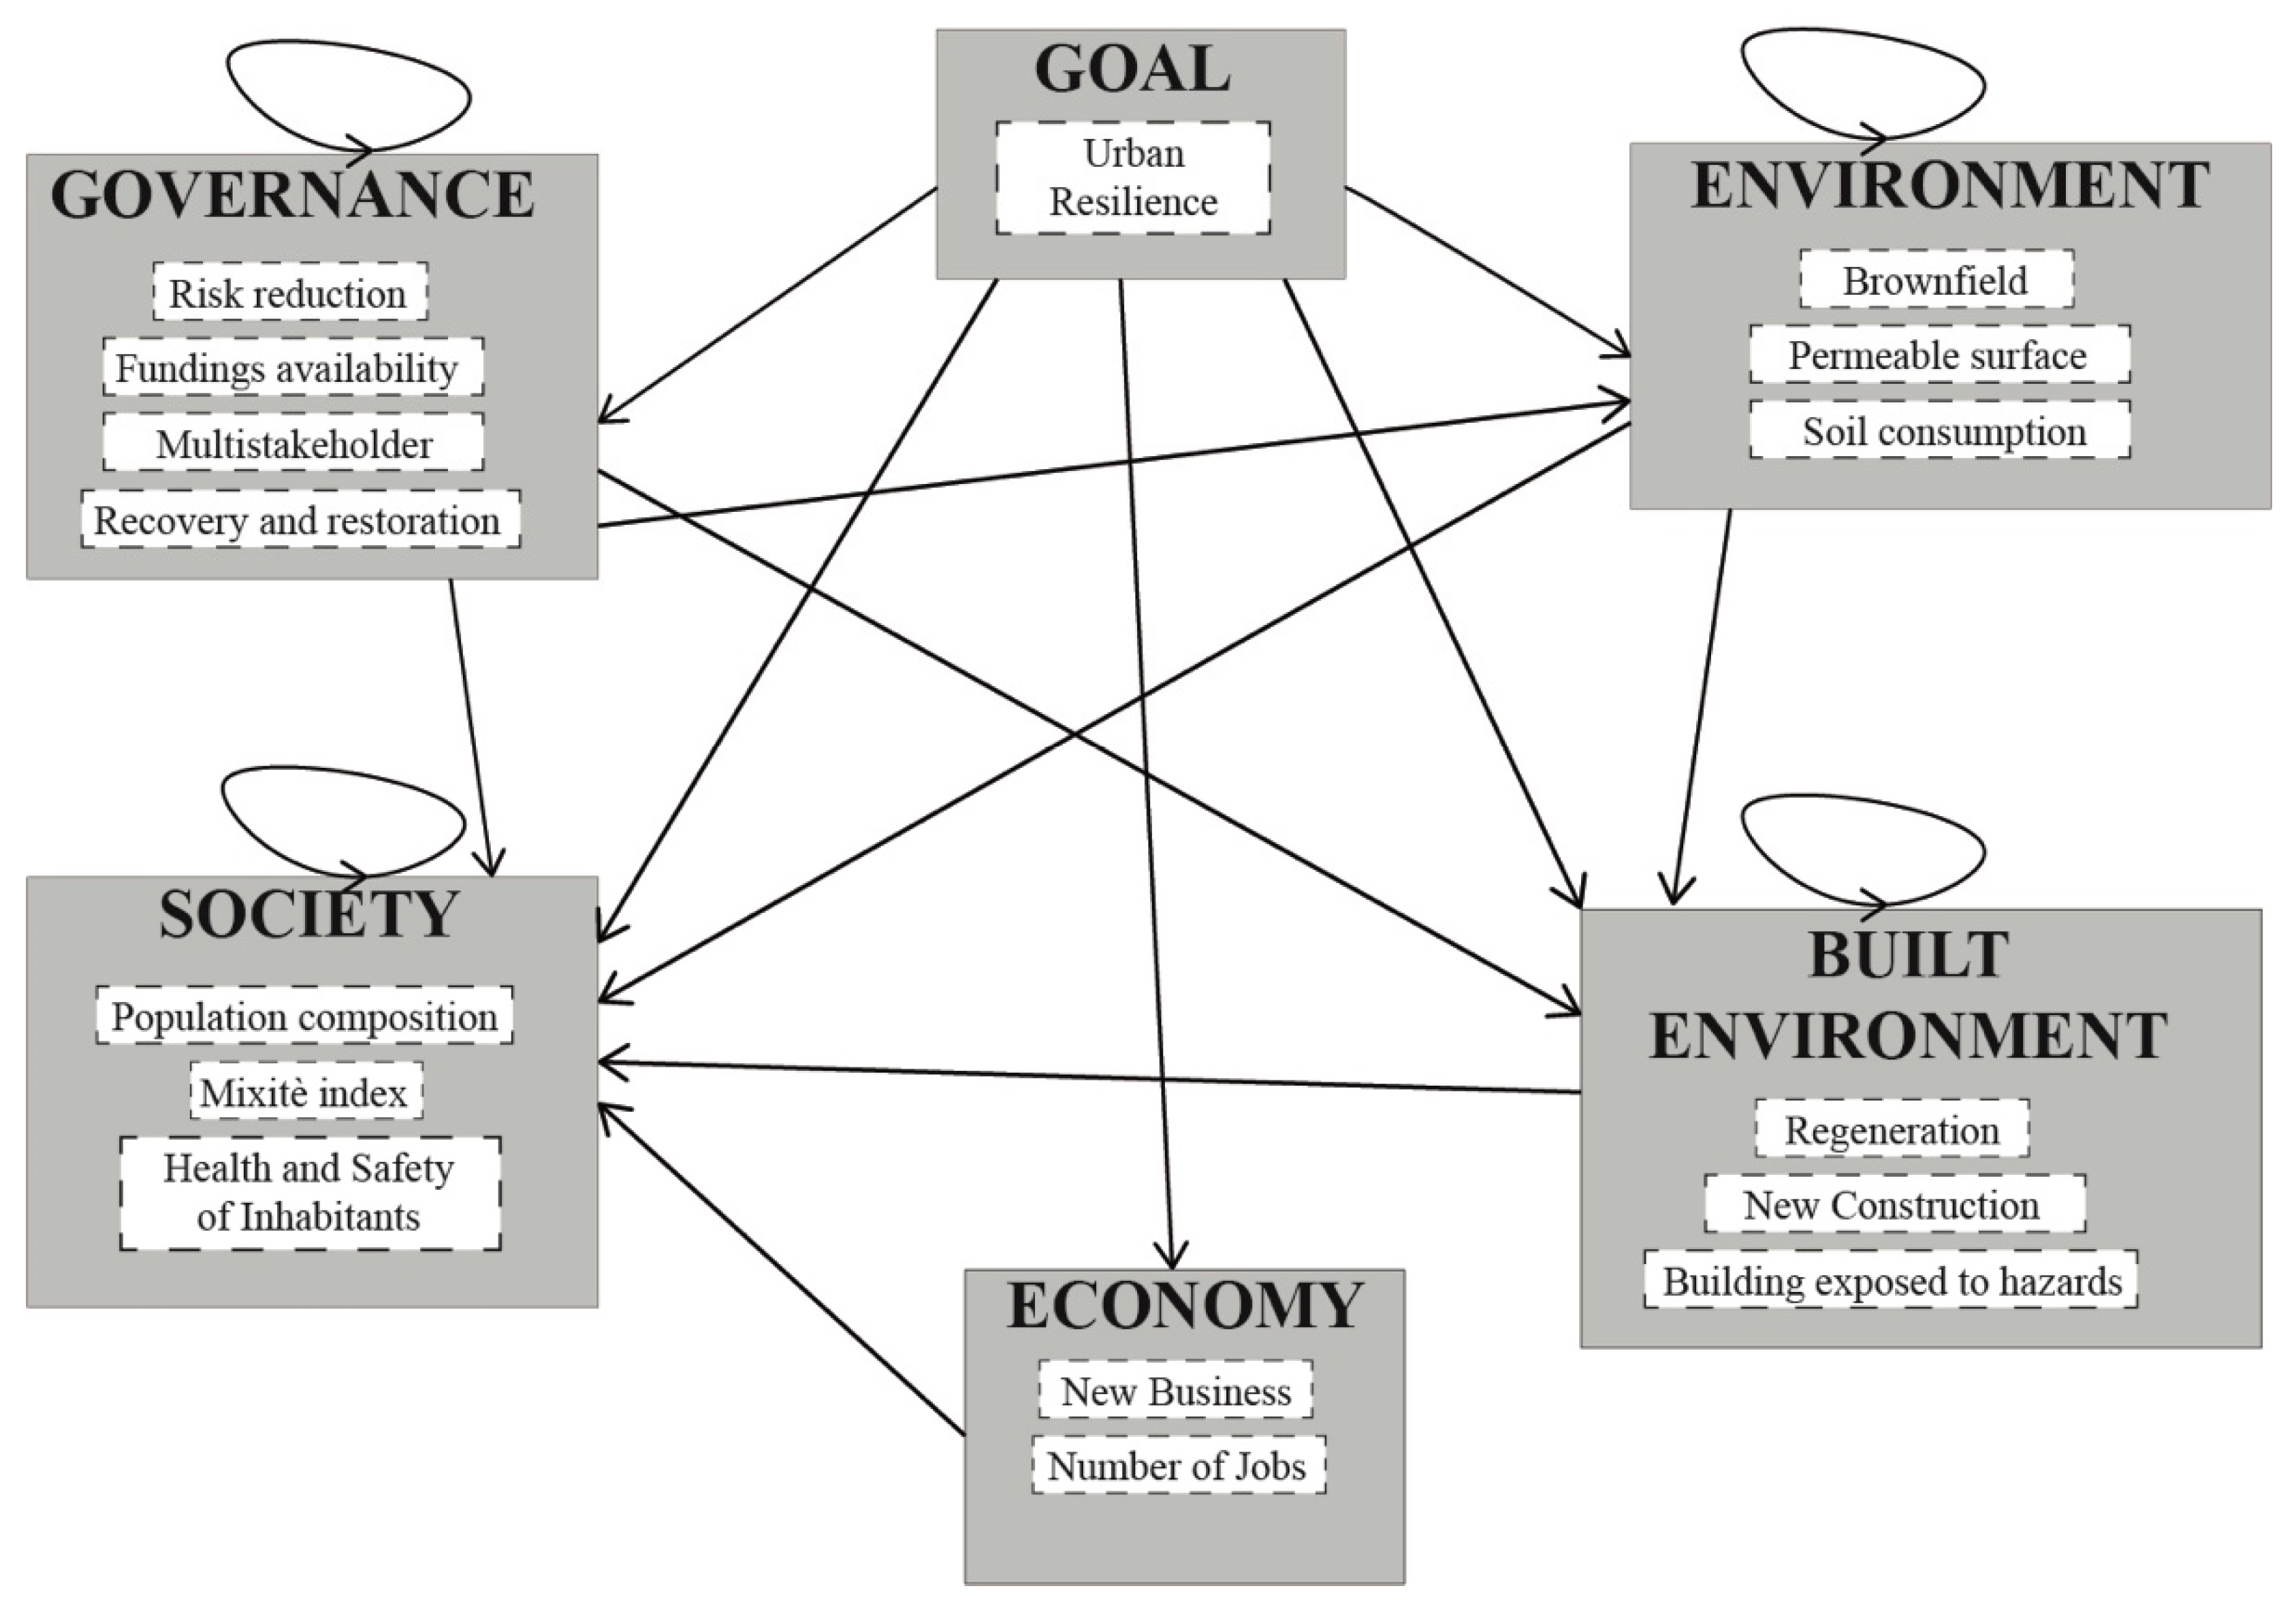
4.3. Causal Loop Diagram
4.4. Structuring the ANP Model
4.5. Determination of the Weights of Indicators
4.5.1. Supermatrix Formulation and Final Priorities
4.5.2. Current Urban Resilience Index
- Si stands for the final score;
- eij represents the normalized value of each indicator;
- wi represents the weight of each criterion
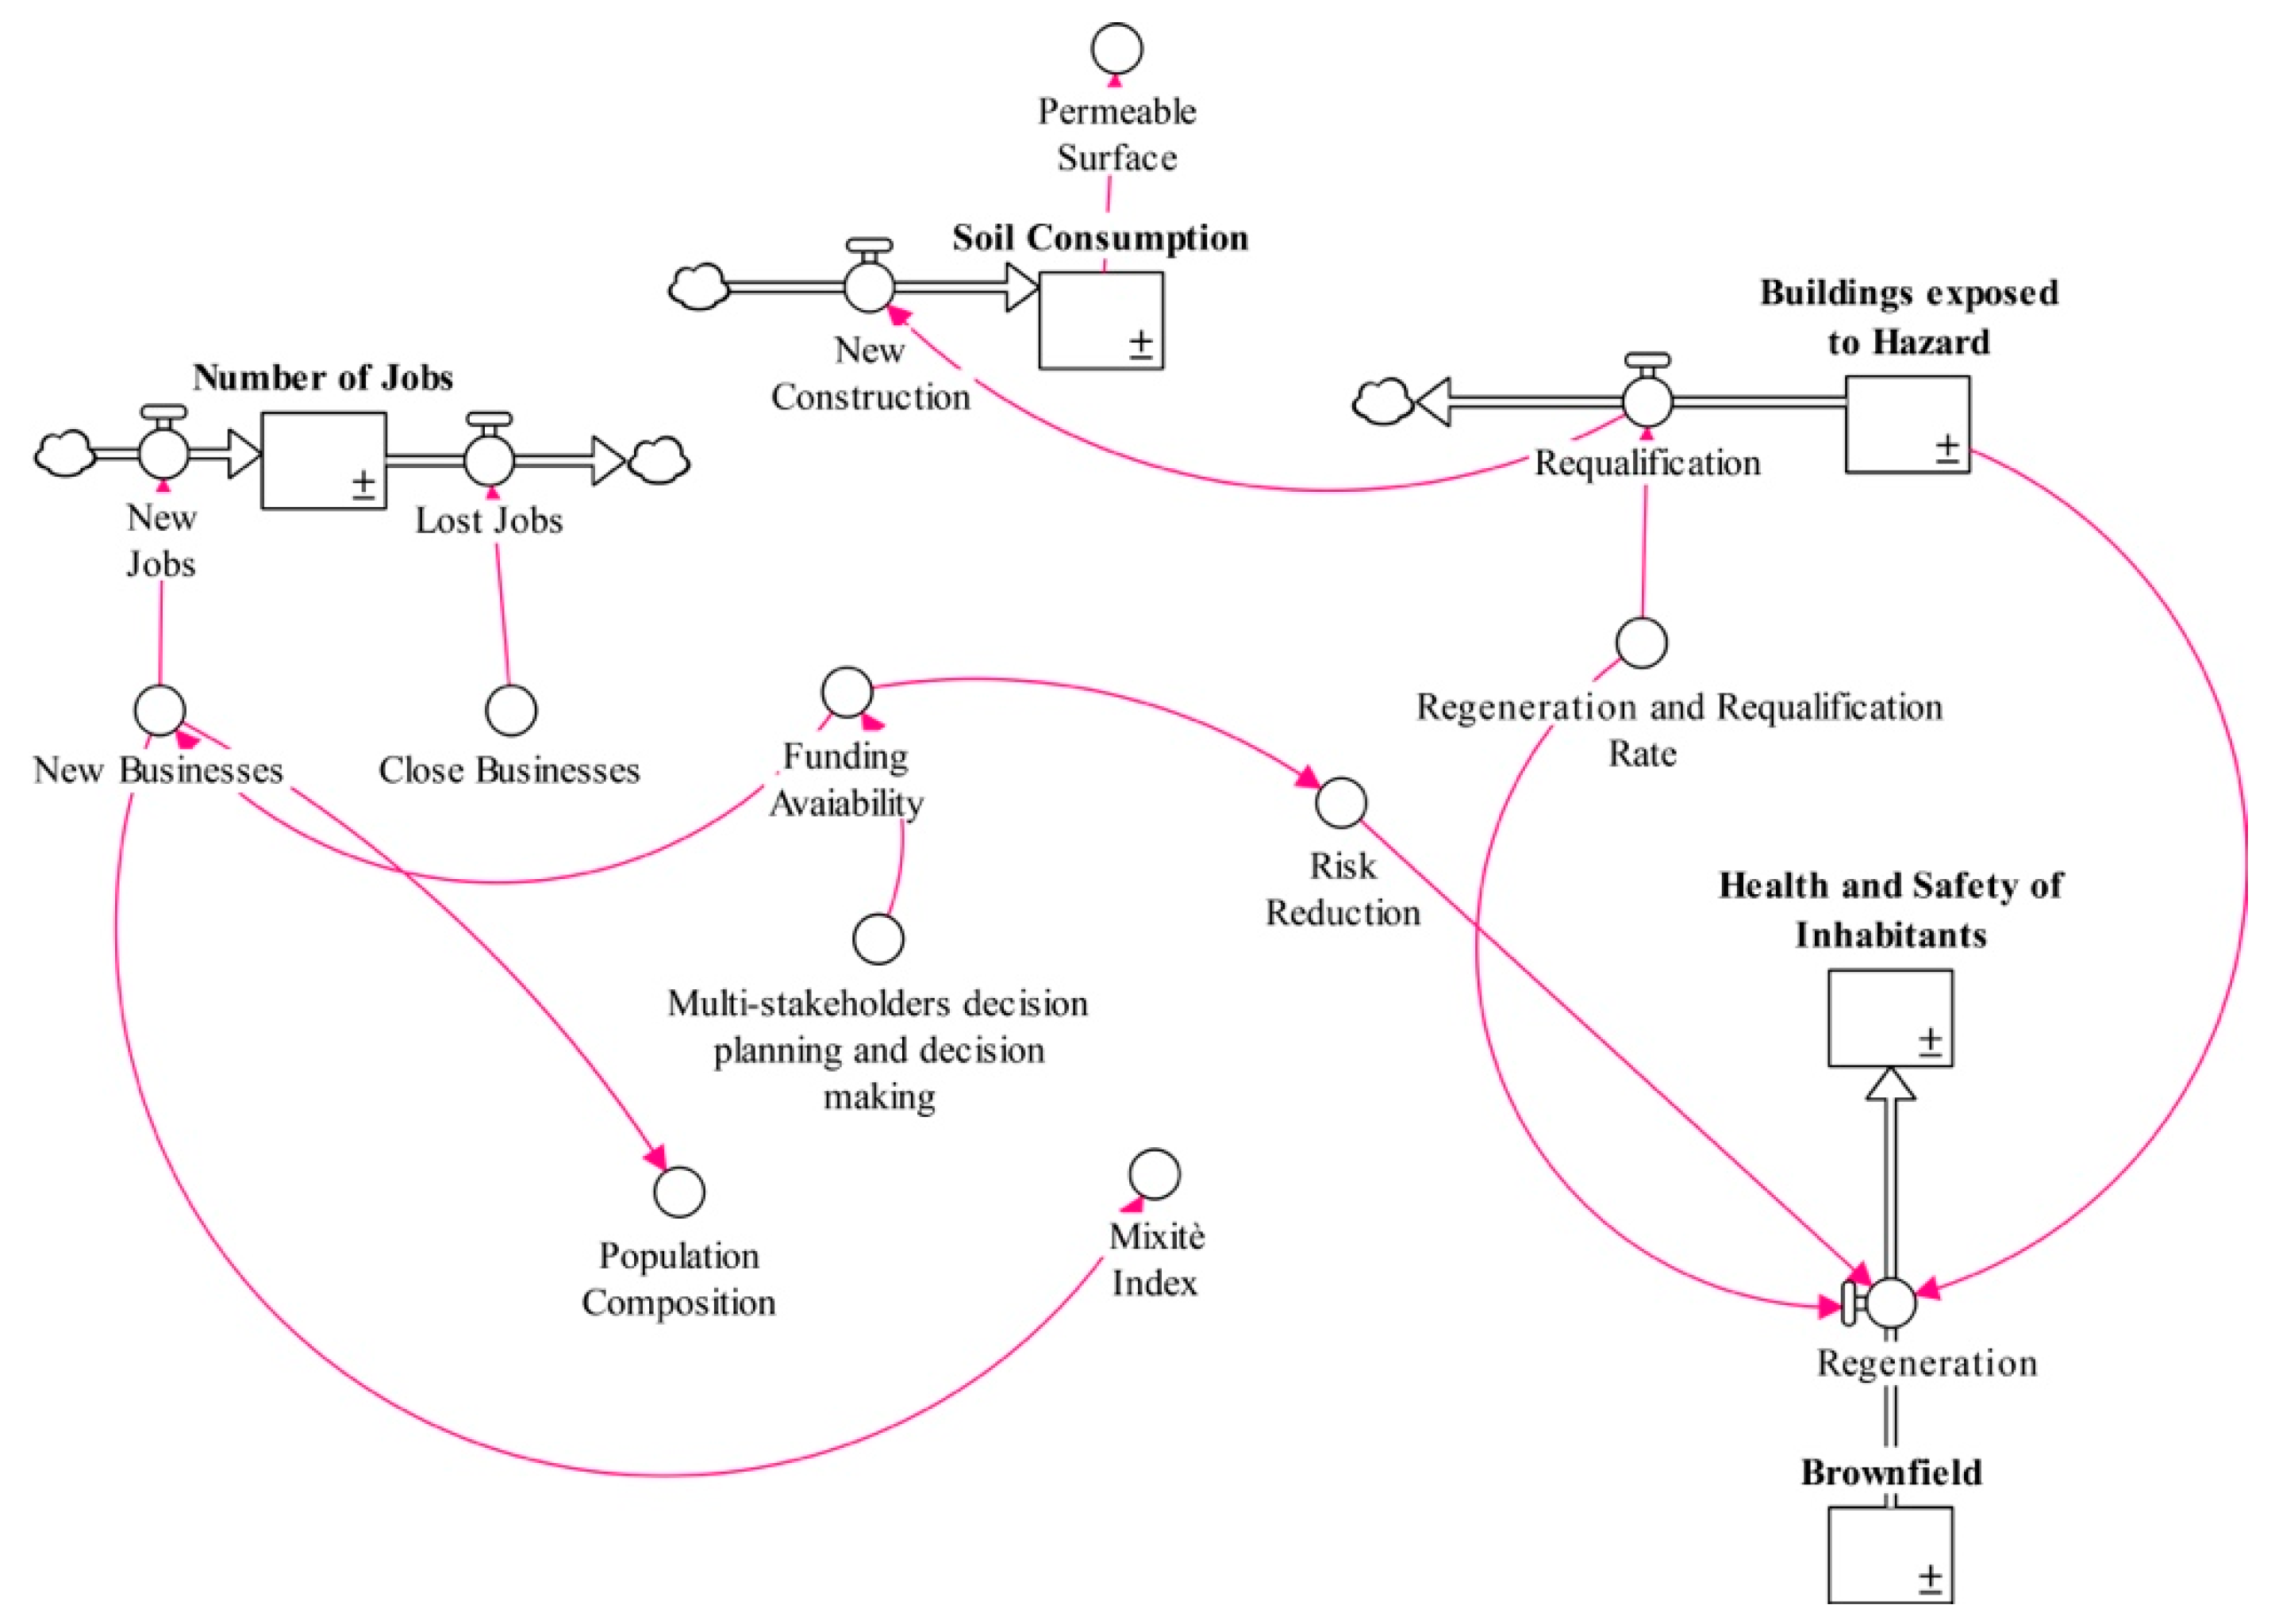
4.6. Stock and Flow Diagram
5. Results
6. Discussion
7. Conclusions
- (1)
- They both examine the nature of the decision problems under analysis. Both SDM and ANP are applied to describe (SDM) and analyze (ANP) complex and dynamic decision problems in many different fields, such as urban transformation.
- (2)
- They both assess the typology of mutual relationships. In real-world decision making, some problems have to be investigated considering the non-linear and feedback relationships between the variables involved. Both SDM and ANP are used based on this principle and for this reason they have been integrated to create a unique framework to analyze complex decision processes;
- (3)
- They both assess data in similar ways. Both SDM and ANP consider both qualitative and quantitative data.
- The causal loop diagram can be considered as a suitable supporting tool in finding the relationships between the criteria to include in the ANP network. Experts were able to determine how the system functioned during the causal loop development (Figure 9).
- The integrated approach based on the combination of SDM and ANP can be considered suitable to respond to the need of an evaluation tool that is able to consider urban resilience based on its complexity, multidimensionality and dynamical behavior over time. In fact, it was possible to analyze the urban system as a complex and adaptive system, in which interventions on a specific urban area can elicit impacts (either positive or negative) on a city in a wide perspective.
Author Contributions
Funding
Acknowledgments
Conflicts of Interest
Appendix A

| Dimension | Criterion | Unit | Inertial Scenario (t0) | Strategic Scenario (t0) | Inertial Scenario (t15) | Strategic Scenario (t15) |
|---|---|---|---|---|---|---|
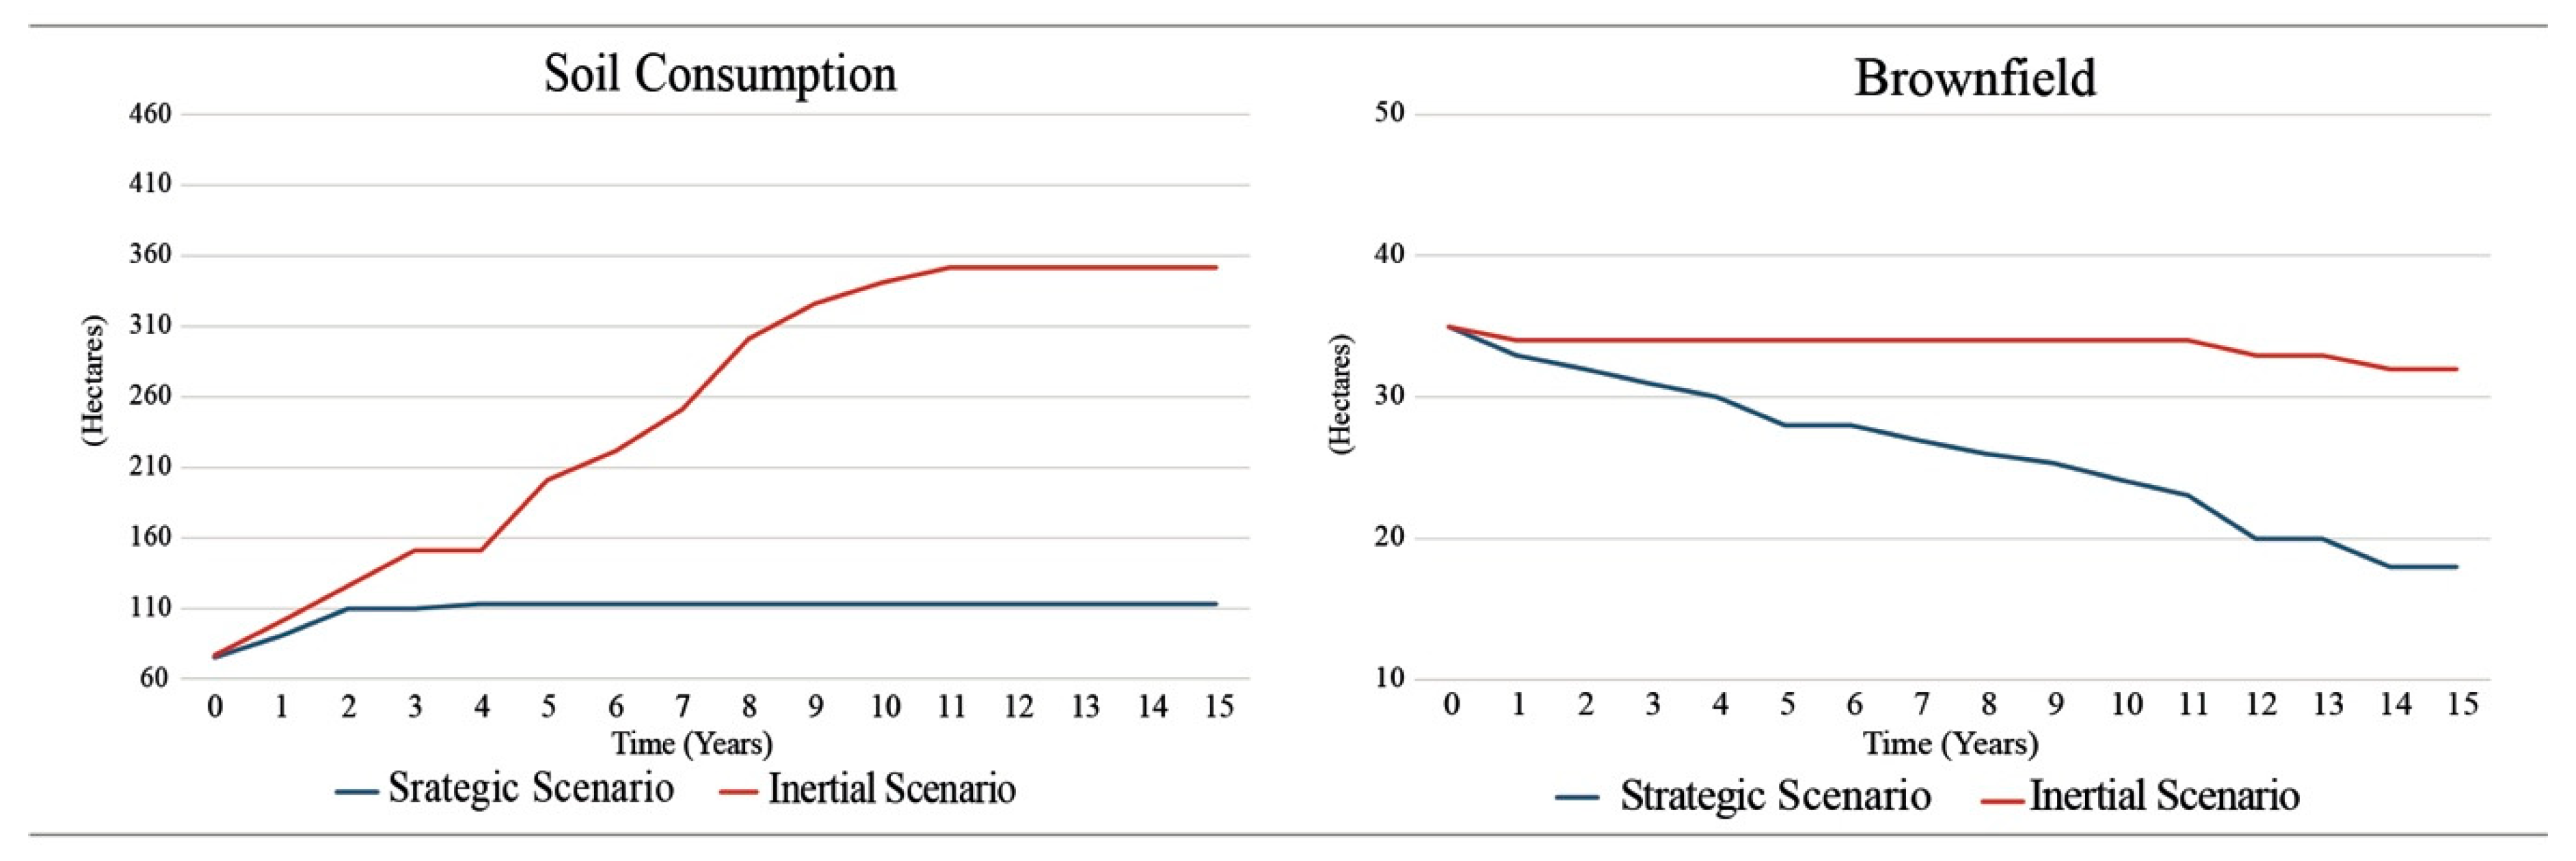
| Environment | Soil Consumption | Hectares | 65 | 65 | 350 | 110 |
| Permeable Surface | Hectares | 75 | 75 | 0 | 340 | |
| Brownfield | Hectares | 35 | 35 | 33 | 18 | |
| Society | Population composition | % | 0 | 0 | 0 | 0 |
| Mixitè index | [0–1] | 0 | 0 | 0 | 0.20 | |
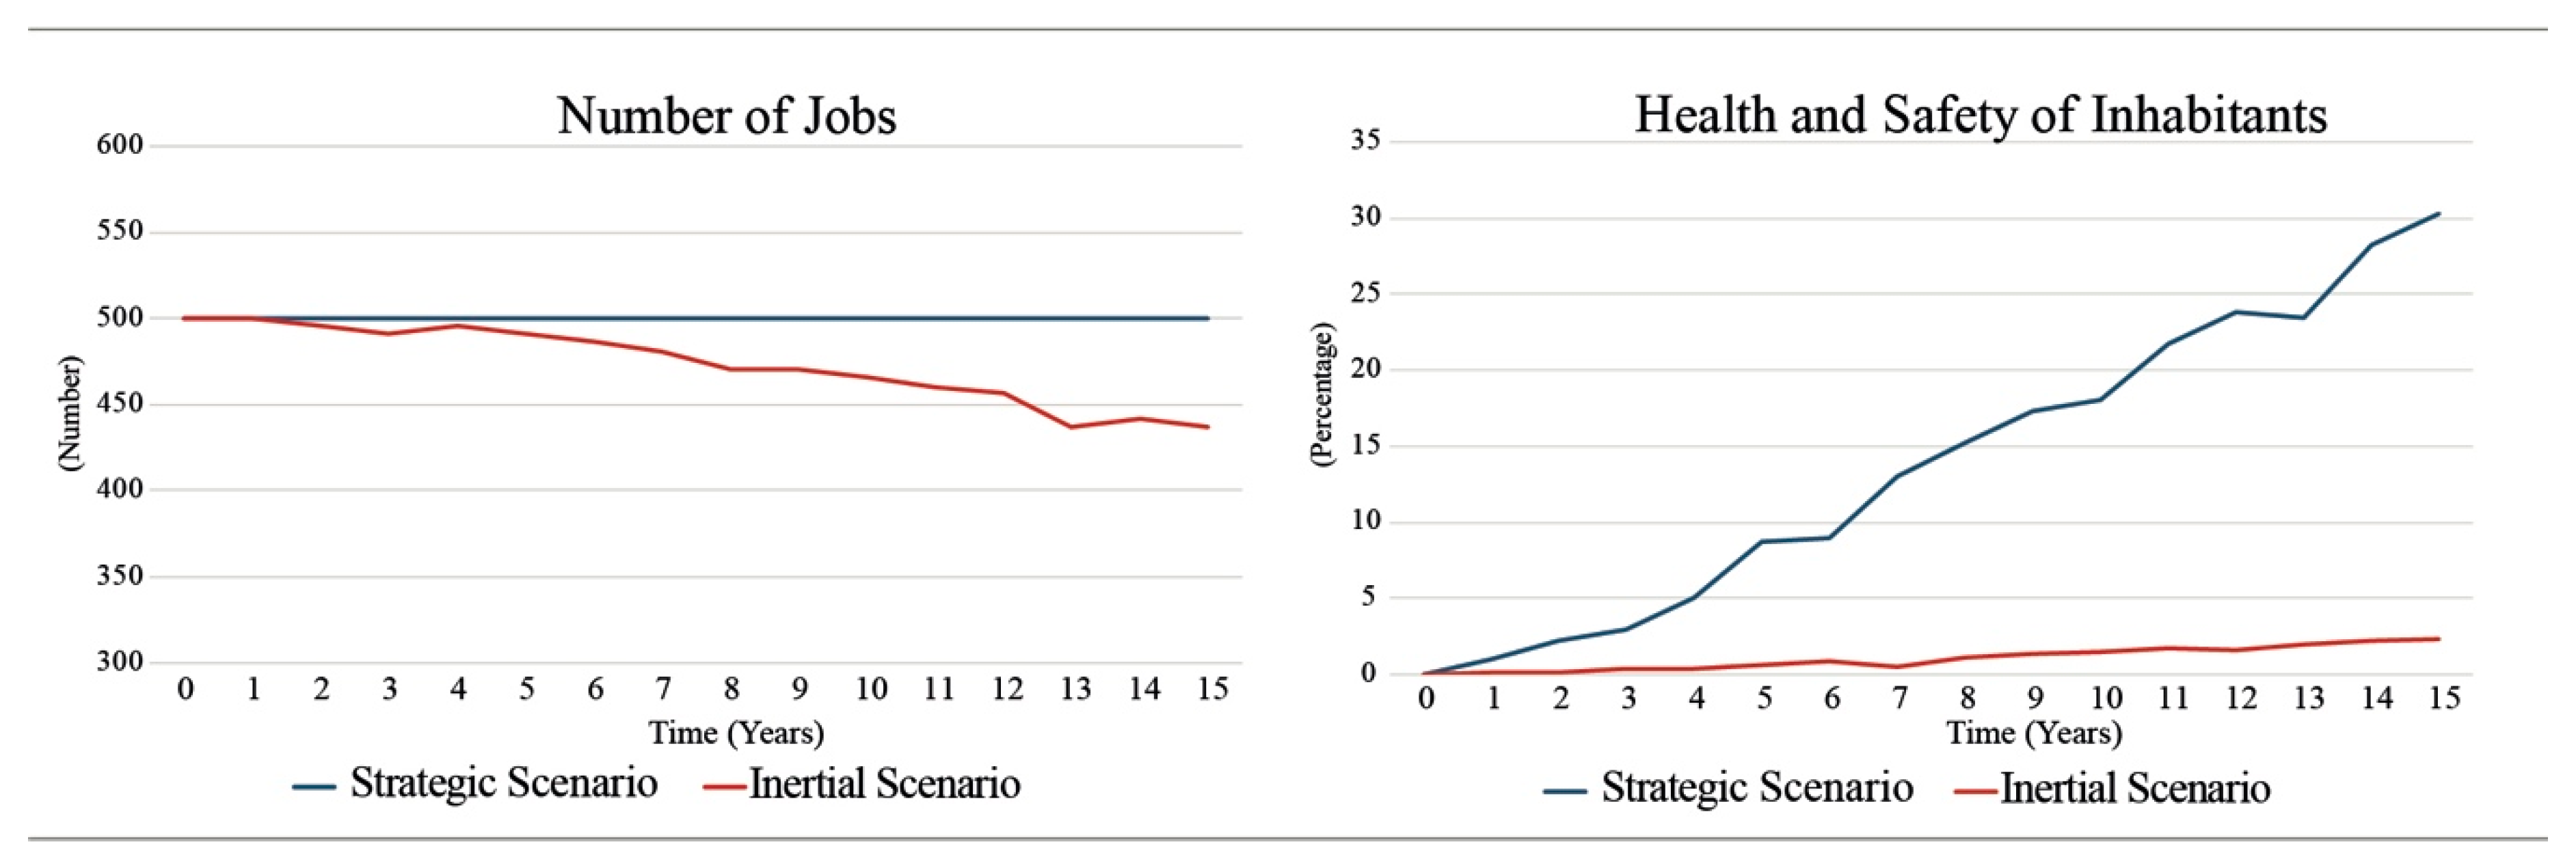
| Health and safety of inhabitants | % | 0 | 0 | 3% | 30% | |
| Economy | New Business | Num. | 10 | 10 | 0 | 25 |
| Number of jobs | Num. | 500 | 500 | 440 | 500 | |
| Built environment | Regeneration | Hectares | 10 | 10 | 10 | 500 |
| New Construction | Hectares | 55 | 55 | 68 | 30 | |
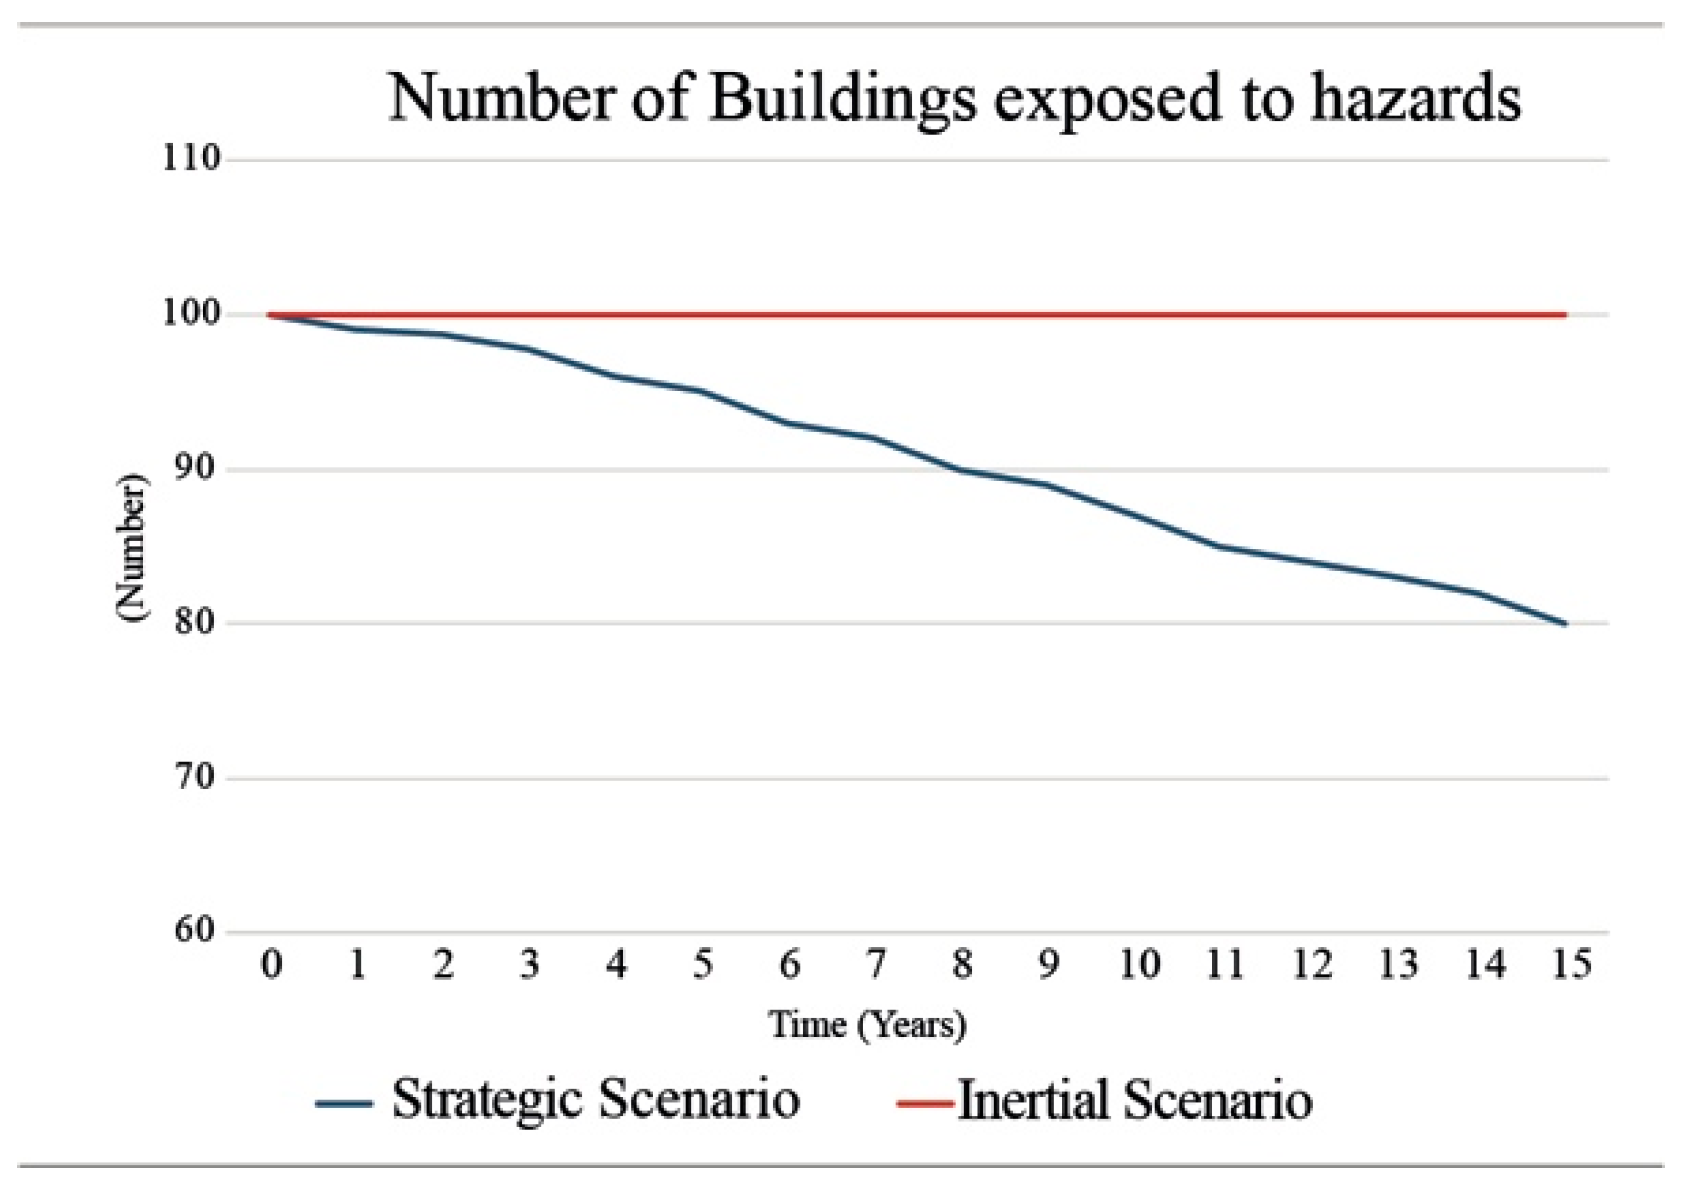
| Number of Building exposed to hazards | Num. | 100 | 100 | 100 | 80 | |
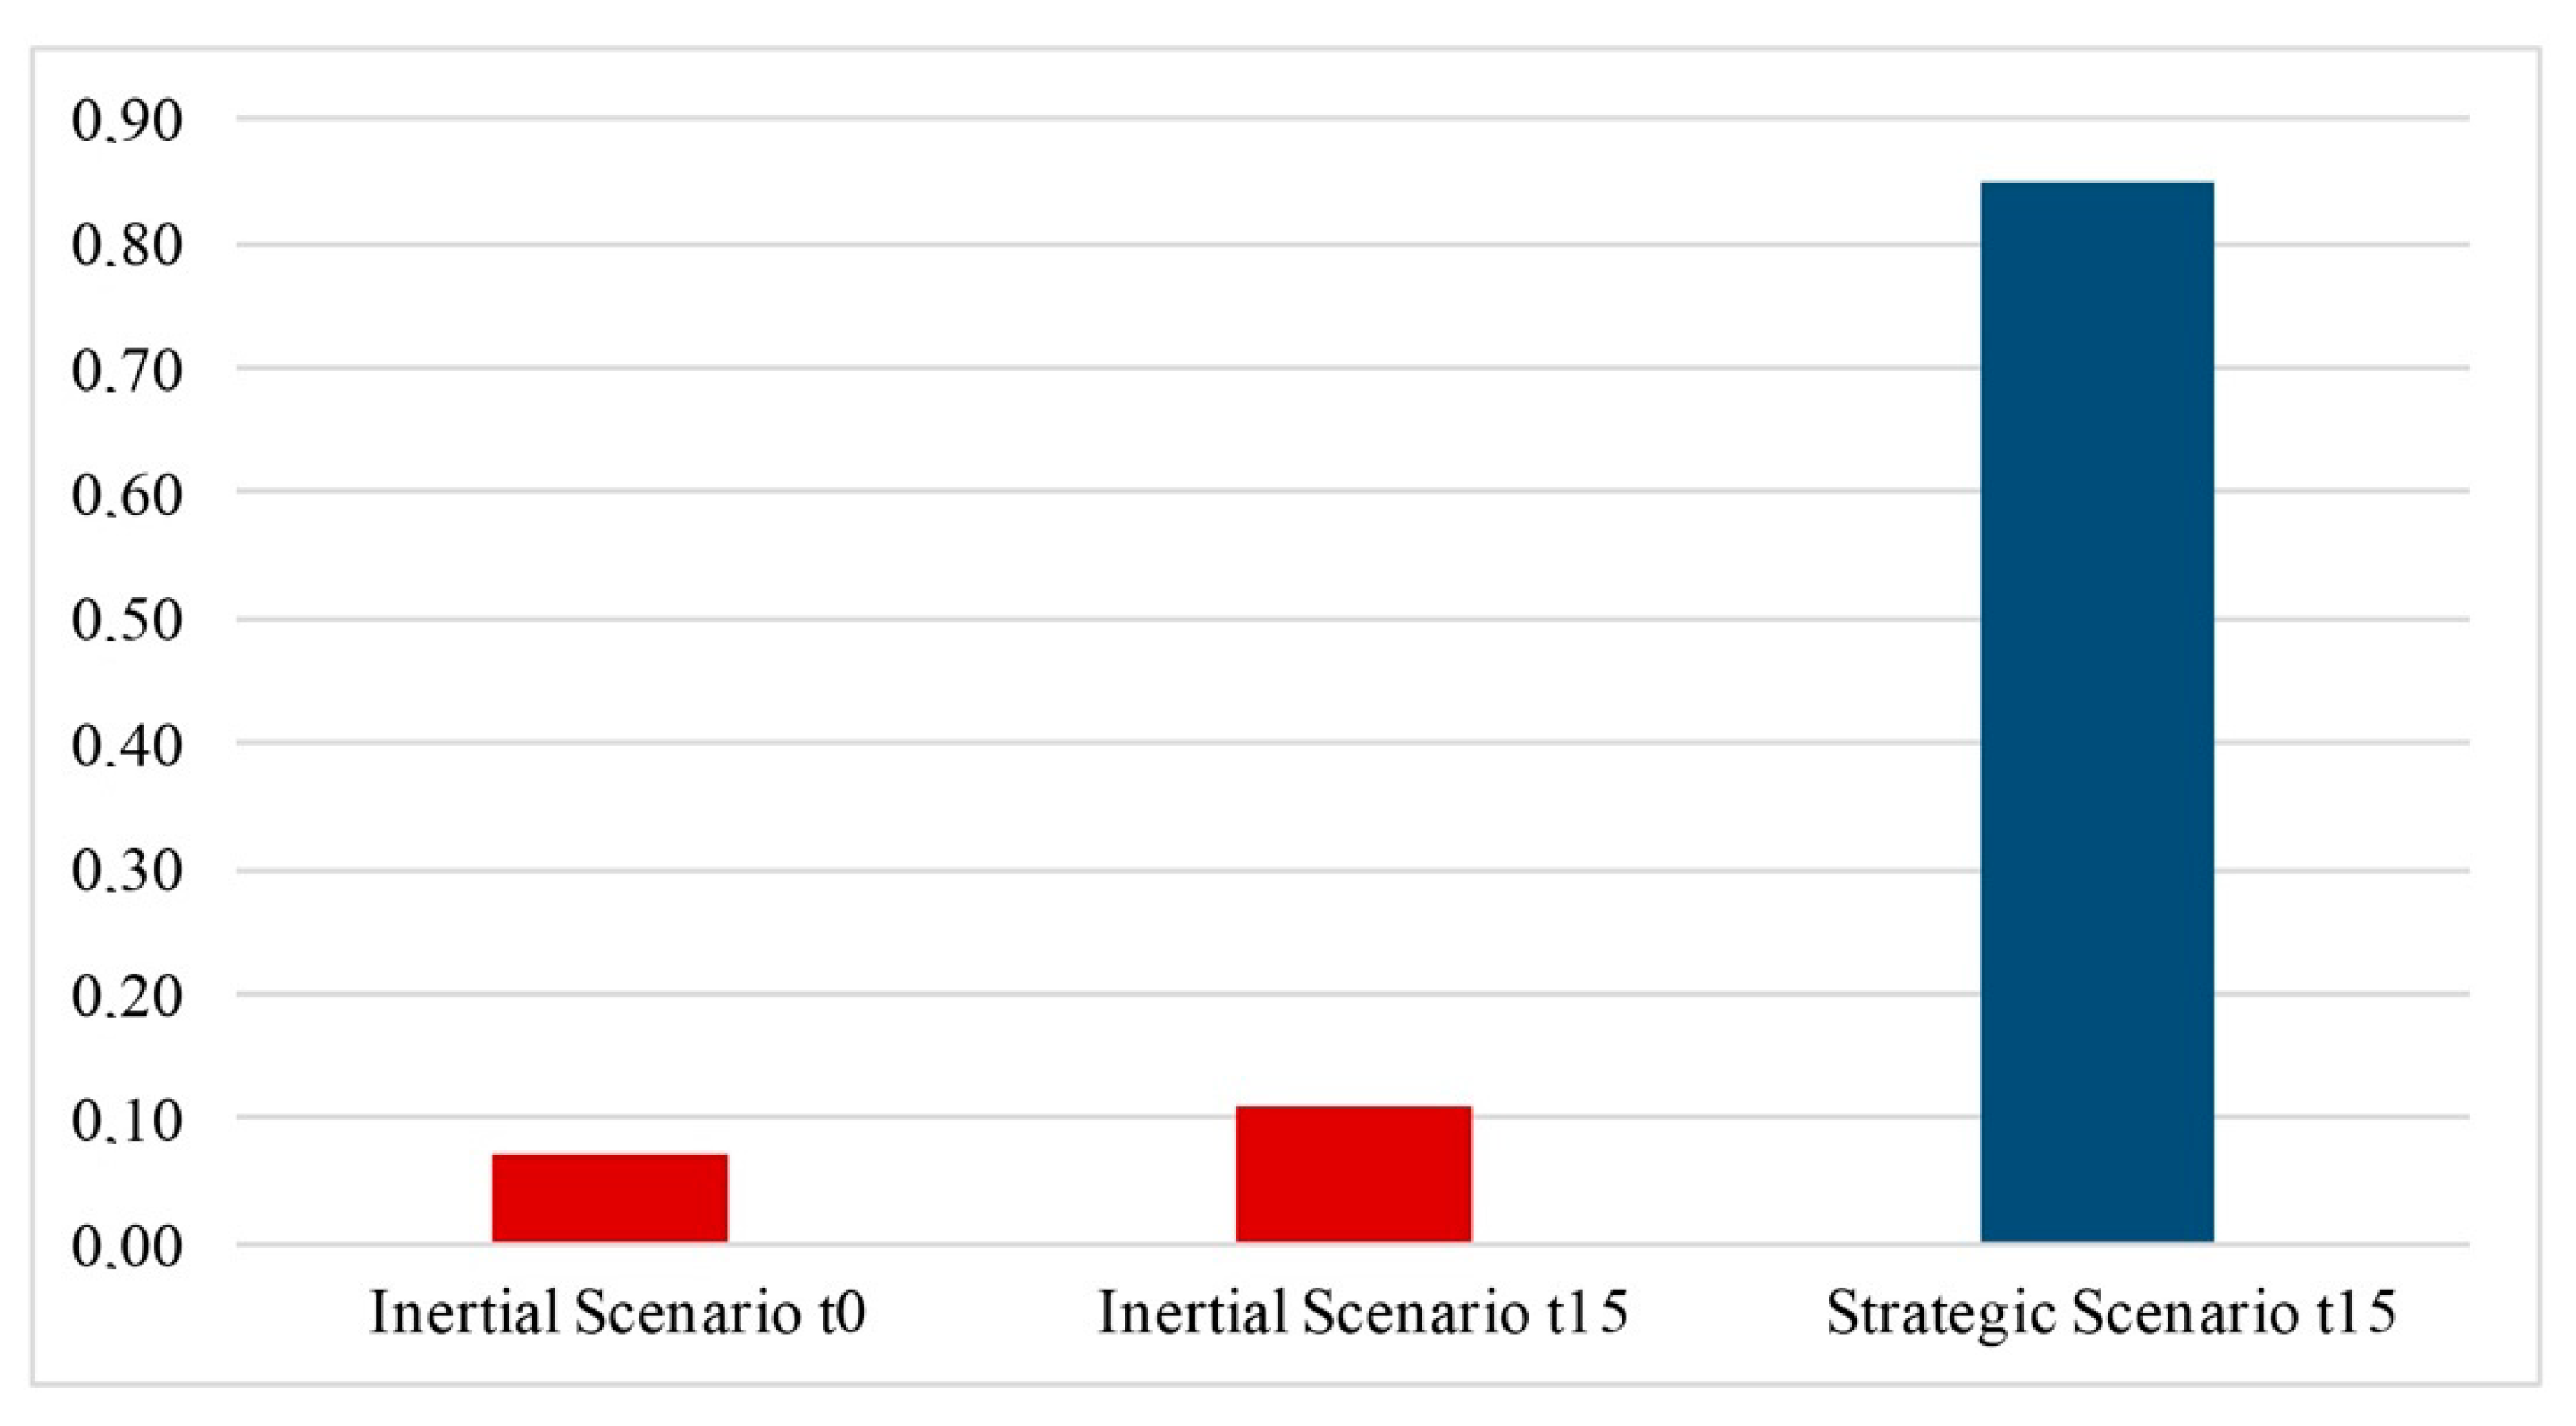
| Governance | Risk reduction | 0–1 | 0 | 0.03 | 0 | 1 |
| Funding availability | 0–1 | 0 | 1 | 0 | 1 | |
| Multi-stakeholders decision planning and decision making | 0–1 | 0 | 0.03 | 0 | 0.03 | |
| Recovery and requalification | 0–1 | 0 | 0.3 | 0 | 0.3 |
Appendix B
| Built Environment | Economy | Environment | Governance | Society | ||||||||||||
|---|---|---|---|---|---|---|---|---|---|---|---|---|---|---|---|---|
| Building Exposed to Hazards | New Construction | Regeneration | New Business | Number of Jobs | Brownfield | Permeable Surface | Soil Consumption | Funding Availability | Multistakeholders | Recovery and Restoration | Risk Reduction | Health and Safety | Mixitè Index | Pop. Composition | ||
| Built Environment | Building exposed to hazards | 0.000 | 0.000 | 1.000 | 0.000 | 0.000 | 0.000 | 0.000 | 0.000 | 0.000 | 0.000 | 0.2500 | 0.2500 | 0.000 | 0.000 | 0.000 |
| New Construction | 0.000 | 0.000 | 0.000 | 0.000 | 0.000 | 0.000 | 0.000 | 0.000 | 0.000 | 0.000 | 0.000 | 0.000 | 0.000 | 1.000 | 0.000 | |
| Regeneration | 0.000 | 0.000 | 0.000 | 0.000 | 0.000 | 0.000 | 0.000 | 0.000 | 0.000 | 0.000 | 0.7500 | 0.7500 | 0.000 | 0.000 | 0.000 | |
| Economy | New Business | 0.000 | 1.000 | 0.000 | 0.000 | 0.000 | 1.000 | 0.000 | 0.000 | 0.000 | 0.000 | 0.000 | 0.000 | 0.000 | 0.000 | 0.000 |
| Number of jobs | 0.000 | 0.000 | 0.000 | 1.000 | 0.000 | 0.000 | 0.000 | 0.000 | 0.000 | 0.000 | 0.000 | 0.000 | 0.000 | 0.000 | 0.000 | |
| Environment | Brownfield | 0.000 | 0.000 | 0.9000 | 0.000 | 0.000 | 0.000 | 0.000 | 0.000 | 0.000 | 0.000 | 1.000 | 1.000 | 0.000 | 0.000 | 0.000 |
| Permeable Surface | 0.000 | 0.85714 | 0.000 | 0.000 | 0.000 | 0.000 | 0.000 | 1.000 | 0.000 | 0.000 | 0.000 | 0.000 | 0.000 | 0.000 | 0.000 | |
| Soil Consumption | 0.000 | 0.14285 | 0.10000 | 0.000 | 0.000 | 0.000 | 0.000 | 0.000 | 0.000 | 0.000 | 0.000 | 0.000 | 0.000 | 0.000 | 0.000 | |
| Governance | Funding availability | 0.000 | 0.000 | 0.000 | 0.000 | 0.000 | 0.000 | 0.000 | 0.000 | 0.000 | 0.000 | 0.000 | 0.000 | 0.000 | 0.000 | 0.000 |
| Multistakeholders | 0.000 | 0.000 | 0.000 | 0.000 | 0.000 | 0.000 | 0.000 | 0.000 | 1.000 | 0.000 | 0.000 | 0.000 | 0.000 | 0.000 | 0.000 | |
| Recovery and restoration | 0.000 | 0.000 | 0.000 | 0.000 | 0.000 | 0.000 | 0.000 | 0.000 | 0.000 | 0.500 | 0.000 | 0.000 | 0.000 | 0.000 | 0.000 | |
| Risk Reduction | 0.000 | 0.000 | 0.000 | 0.000 | 0.000 | 0.000 | 0.000 | 0.000 | 0.000 | 0.500 | 0.000 | 0.000 | 0.000 | 0.000 | 0.000 | |
| Society | Health and safety | 1.0000 | 0.000 | 0.000 | 0.000 | 0.000 | 0.8571 | 1.0000 | 0.000 | 0.000 | 0.8571 | 1.000 | 1.000 | 0.000 | 0.000 | 0.000 |
| Mixitè index | 0.000 | 0.000 | 1.0000 | 0.000 | 0.000 | 0.1428 | 0.000 | 0.000 | 0.000 | 0.1428 | 0.000 | 0.000 | 0.000 | 0.000 | 0.000 | |
| Pop. Composition | 0.000 | 0.000 | 0.000 | 1.0000 | 1.0000 | 0.000 | 0.000 | 0.000 | 0.000 | 0.000 | 0.000 | 0.000 | 1.000 | 0.000 | 0.000 | |
Appendix C
| Built Environment | Economy | Environment | Governance | Society | ||||||||||||
|---|---|---|---|---|---|---|---|---|---|---|---|---|---|---|---|---|
| Building Exposed to Hazards | New Construction | Regeneration | New Business | Number of Jobs | Brownfield | Permeable Surface | Soil Consumption | Funding Availability | Multistakeholders | Recovery and Restoration | Risk Reduction | Health and Safety | Mixitè Index | Pop. Composition | ||
| Built Environment | Building exposed to hazards | 0.000 | 0.000 | 0.22269 | 0.000 | 0.000 | 0.000 | 0.000 | 0.000 | 0.000 | 0.000 | 0.049695 | 0.049695 | 0.000 | 0.000 | 0.000 |
| New Construction | 0.000 | 0.000 | 0.000 | 0.000 | 0.000 | 0.000 | 0.000 | 0.000 | 0.000 | 0.000 | 0.000 | 0.000 | 0.000 | 1.000 | 0.000 | |
| Regeneration | 0.000 | 0.000 | 0.000 | 0.000 | 0.000 | 0.000 | 0.000 | 0.000 | 0.000 | 0.000 | 0.149084 | 0.149084 | 0.000 | 0.000 | 0.000 | |
| Economy | New Business | 0.000 | 0.11386 | 0.000 | 0.000 | 0.000 | 0.5000 | 0.000 | 0.000 | 0.000 | 0.000 | 0.000 | 0.000 | 0.000 | 0.000 | 0.000 |
| Number of jobs | 0.000 | 0.000 | 0.000 | 0.5000 | 0.000 | 0.000 | 0.000 | 0.000 | 0.000 | 0.000 | 0.000 | 0.000 | 0.000 | 0.000 | 0.000 | |
| Environment | Brownfield | 0.000 | 0.000 | 0.6061 | 0.000 | 0.000 | 0.000 | 0.000 | 0.000 | 0.000 | 0.000 | 0.68252 | 0.68252 | 0.000 | 0.000 | 0.000 |
| Permeable Surface | 0.000 | 0.75954 | 0.000 | 0.000 | 0.000 | 0.000 | 0.000 | 1.000 | 0.000 | 0.000 | 0.000 | 0.000 | 0.000 | 0.000 | 0.000 | |
| Soil Consumption | 0.000 | 0.12659 | 0.06734 | 0.000 | 0.000 | 0.000 | 0.000 | 0.000 | 0.000 | 0.000 | 0.000 | 0.000 | 0.000 | 0.000 | 0.000 | |
| Governance | Funding availability | 0.000 | 0.000 | 0.000 | 0.000 | 0.000 | 0.000 | 0.000 | 0.000 | 0.000 | 0.000 | 0.000 | 0.000 | 0.000 | 0.000 | 0.000 |
| Multistakeholders | 0.000 | 0.000 | 0.000 | 0.000 | 0.000 | 0.000 | 0.000 | 0.000 | 1.000 | 0.000 | 0.000 | 0.000 | 0.000 | 0.000 | 0.000 | |
| Recovery and restoration | 0.000 | 0.000 | 0.000 | 0.000 | 0.000 | 0.000 | 0.000 | 0.000 | 0.000 | 0.27248 | 0.000 | 0.000 | 0.000 | 0.000 | 0.000 | |
| Risk Reduction | 0.000 | 0.000 | 0.000 | 0.000 | 0.000 | 0.000 | 0.000 | 0.000 | 0.000 | 0.27248 | 0.000 | 0.000 | 0.000 | 0.000 | 0.000 | |
| Society | Health and safety | 1.0000 | 0.000 | 0.000 | 0.000 | 0.000 | 0.4285 | 1.0000 | 1.000 | 0.000 | 0.39002 | 0.11870 | 1.000 | 0.000 | 0.000 | 0.000 |
| Mixitè index | 0.000 | 0.000 | 0.10384 | 0.000 | 0.000 | 0.1428 | 0.071429 | 0.000 | 0.000 | 0.06500 | 0.000 | 0.000 | 0.000 | 0.000 | 0.000 | |
| Pop. Composition | 0.000 | 0.000 | 0.000 | 0.5000 | 1.0000 | 0.000 | 0.000 | 0.000 | 0.000 | 0.000 | 0.000 | 0.000 | 1.000 | 0.000 | 0.000 | |
References
- UN Office for Disaster Risk Reduction. How to Make Cities More Resilient; UNISDR: Geneva, Switzerland, 2012. [Google Scholar]
- World Economic Forum. The Global Risks Report 2018, 13th ed.; World Economic Forum: Geneva, Switzerland, 2013; ISBN 978-1-944835-15-6. [Google Scholar]
- UNISDR Hyogo Framework for Action 2005–2015. In Proceedings of the United Nations International Strategy for Disaster Reduc, Sendai, Japan, 14–18 March 2015.
- Grimm, N.; Faeth, S.; Golubiewski, N.; Redman, C.; Wu, J.; Bai, X.; Briggs, J. Global Change and the Ecology of Cities. Science 2008, 319, 756–760. [Google Scholar] [CrossRef] [PubMed]
- UNISDR (United Nations Office for Disaster Risk Reduction). Sendai Framework Data Readiness Review 2017, Disaster-related Data for Sustainable Development; UNISDR: Geneva, Switzerland, 2017. [Google Scholar]
- Sharifi, A.; Yamagata, Y. Resilience-Oriented Urban Planning. In Lecture Notes in Energy; Springer: Berlin/Heidelberg, Germany, 2018; pp. 3–27. ISBN 9783319757971. [Google Scholar]
- Desouza, K.C.; Flanery, T.H. Designing, planning, and managing resilient cities: A conceptual framework. Cities 2013. [Google Scholar] [CrossRef]
- Suárez, M.; Gómez-Baggethun, E.; Benayas, J.; Tilbury, D. Towards an urban resilience index: A case study in 50 Spanish cities. Sustainability 2016, 8, 774. [Google Scholar] [CrossRef]
- Masnavi, M.R.; Gharai, F.; Hajibandeh, M. Exploring urban resilience thinking for its application in urban planning: A review of literature. Int. J. Environ. Sci. Technol. 2019, 16, 567–582. [Google Scholar] [CrossRef]
- Vaništa Lazarević, E.; Keković, Z.; Antonić, B. In search of the principles of resilient urban design: Implementability of the principles in the case of the cities in Serbia. Energy Build. 2018. [Google Scholar] [CrossRef]
- Yamagata, Y.; Maruyama, H. Urban Resilience. A Trasformative Approach; Yamagata, Y., Maruyama, H., Eds.; Advanced Sciences and Technologies for Security Applications; Springer International Publishing: Cham, Switzerland, 2016; ISBN 978-3-319-39810-5. [Google Scholar]
- Ahern, J. From fail-safe to safe-to-fail: Sustainability and resilience in the new urban world. Landsc. Urban Plan. 2011. [Google Scholar] [CrossRef]
- Sharifi, A.; Yamagata, Y. Principles and criteria for assessing urban energy resilience: A literature review. Renew. Sustain. Energy Rev. 2016, 60, 1654–1677. [Google Scholar] [CrossRef]
- Sharifi, A. A critical review of selected tools for assessing community resilience. Ecol. Indic. 2016, 69, 629–647. [Google Scholar] [CrossRef]
- Sharifi, A.; Yamagata, Y. Urban Resilience Assessment: Multiple Dimensions, Criteria, and Indicators. In Urban Resilience. A Trasformative Approach. Advanced Sciences and Technologies for Security Applications; Yamagata, Y., Maruyama, H., Eds.; Springer: Cham, Switzerland, 2016; pp. 259–276. ISBN 978-3-319-39810-5. [Google Scholar]
- Moghadas, M.; Asadzadeh, A.; Vafeidis, A.; Fekete, A.; Kötter, T. A multi-criteria approach for assessing urban flood resilience in Tehran, Iran. Int. J. Disaster Risk Reduct. 2019, 35, 101069. [Google Scholar] [CrossRef]
- Sellberg, M.M.; Wilkinson, C.; Peterson, G.D. Resilience assessment: A useful approach to navigate urban sustainability challenges. Ecol. Soc. 2015, 20, 1–26. [Google Scholar] [CrossRef]
- Ilmola, L. Approaches to Measurement of Urban Resilience. In Urban Resilience. A Trasformative Approach. Advanced Sciences and Technologies for Security Applications; Yamagata, Y., Maruyama, H., Eds.; Springer: Cham, Switzerland, 2016; pp. 207–237. [Google Scholar]
- Quinlan, A.E.; Berbés-Blázquez, M.; Haider, L.J.; Peterson, G.D. Measuring and assessing resilience: Broadening understanding through multiple disciplinary perspectives. J. Appl. Ecol. 2016, 53, 677–687. [Google Scholar] [CrossRef]
- Meerow, S.; Newell, J.P.; Stults, M. Defining urban resilience: A review. Landsc. Urban Plan. 2016, 147, 38–49. [Google Scholar] [CrossRef]
- Meerow, S.; Newell, J. Resilience and Complexity: A Bibliometric Review and Prospects for Industrial Ecology. J. Ind. Ecol. 2015, 19. [Google Scholar] [CrossRef]
- Leichenko, R. Climate change and urban resilience. Curr. Opin. Environ. Sustain. 2011, 164–168. [Google Scholar] [CrossRef]
- Coaffee, J. Risk, resilience, and environmentally sustainable cities. Energy Policy 2008, 36, 4633–4638. [Google Scholar] [CrossRef]
- Chelleri, L.; Waters, J.J.; Olazabal, M.; Minucci, G. Resilience trade-offs: Addressing multiple scales and temporal aspects of urban resilience. Environ. Urban. 2015. [Google Scholar] [CrossRef]
- Chelleri, L.; Olazabal, M.; Kunath, A.; Minucci, G.; Waters, J.J.; Yumalogava, L. Multidisciplinary perspectives on urban resilience. Workshop Report 1st edition. Basqu. Cent. Clim. Chang. 2012. Available online: https://www.preventionweb.net/publications/view/32309 (accessed on 15 July 2020).
- Holling, C.S. Resilience and Stability of Ecological Systems. Annu. Rev. Ecol. Syst. 1973, 4, 1–23. [Google Scholar] [CrossRef]
- UN-Habitat. Trends in Urban Resilience; 2017; ISBN 9789211327434. Available online: http://urbanresiliencehub.org/wp-content/uploads/2017/11/Trends_in_Urban_Resilience_2017.pdf (accessed on 15 July 2020).
- Da Silva, J.; Moench, M. City Resilience Framework. Arup 2014. Available online: http://www.seachangecop.org/files/documents/URF_Bo (accessed on 15 July 2020).
- Flax, L.; Armstrong, A.; Yee, L. Measuring Urban Resilience As You Build It—Insights from 100 Resilient Cities. IRGC Resour. Guid. Resil. 2016. Available online: https://irgc.org/flax-measuring-urban-resilience-as-you-build-it/ (accessed on 15 July 2020).
- The Rockefeller Foundation, City Resilience Framework. City resilience Index. 2014. Available online: https://www.urban-response.org/system/files/content/resource/files/main/city-resilience-framework-arup-april-2014.pdf (accessed on 15 July 2020).
- Folke, C.; Carpenter, S.R.; Walker, B.; Scheffer, M.; Chapin, T.; Rockström, J. Resilience thinking: Integrating resilience, adaptability and transformability. Ecol. Soc. 2010. [Google Scholar] [CrossRef]
- Carpenter, S.; Walker, B.; Anderies, J.M.; Abel, N. From Metaphor to Measurement: Resilience of What to What? Ecosystems 2001, 4, 765–781. [Google Scholar] [CrossRef]
- Fu, X.; Wang, X. Developing an integrative urban resilience capacity index for plan making. Environ. Syst. Decis. 2018. [Google Scholar] [CrossRef]
- Monteiro, A.; Carvalho, V.; Velho, S.; Sousa, C. Assessing and monitoring urban resilience using COPD in Porto. Sci. Total Environ. 2012. [Google Scholar] [CrossRef] [PubMed]
- Walker, B.; Salt, D.; Reid, W. Resilience Thinking: Sustaining Ecosystems and People in A Changing World; Bibliovault OAI Repos. Univ. Chicago Press: Chicago, IL, USA, 2006. [Google Scholar]
- Walker, B.; Hollin, C.S.; Carpenter, S.; Kinzig, A. Resilience, Adaptability and Transformability in Social-Ecological Systems. Ecol. Soc. 2004, 9, 1–9. [Google Scholar] [CrossRef]
- Schwind, N.; Minami, K.; Maruyama, H.; Ilmola, L.; Inoue, K. Computational Framework of Resilience. In Urban Resilience. A Trasformative Approach. Advanced Sciences and Technologies for Security Applications; Yamagata, Y., Maruyama, H., Eds.; Springer: Cham, Switzerland, 2016; pp. 239–257. [Google Scholar]
- Pagano, A.; Pluchinotta, I.; Giordano, R.; Vurro, M. Drinking water supply in resilient cities: Notes from L’Aquila earthquake case study. Sustain. Cities Soc. 2017. [Google Scholar] [CrossRef]
- Bottero, M.; Comino, E.; Dell’Anna, F.; Dominici, L.; Rosso, M. Strategic assessment and economic evaluation: The case study of Yanzhou Island (China). Sustainability 2019, 11, 1076. [Google Scholar] [CrossRef]
- Saaty, T.L.; Özdemir, M.S. The Encyclicon: A Dictionary of Decisions with Dependence and Feedback Based on the Analytic Network Process; The Encyclicon: A Dictionary of Decisions with Dependence and Feedback Based on the Analytic Network Process; RWS Publications: Pittsburgh, PA, USA, 2005; ISBN 9781888603057. [Google Scholar]
- Saaty, T.L. Decision making—The Analytic Hierarchy and Network Processes (AHP/ANP). J. Syst. Sci. Syst. Eng. 2004, 13, 1–35. [Google Scholar] [CrossRef]
- Forrester, J.W. Principles of Systems; System dynamics series; Productivity Press: New York, NY, USA, 1990; ISBN 9780915299874. [Google Scholar]
- Forrester, J.W. Lessons from system dynamics modeling. Syst. Dyn. Rev. 1987, 3, 136–149. [Google Scholar] [CrossRef]
- Forrester, J.W. Industrial Dynamics; Wright Allen Series in System Dynamics; M.I.T. Press: Cambridge, MA, USA, 1961; ISBN 9780262560016. [Google Scholar]
- Guan, D.; Gao, W.; Su, W.; Li, H.; Hokao, K. Modeling and dynamic assessment of urban economy-resource-environment system with a coupled system dynamics—Geographic information system model. Ecol. Indic. 2011. [Google Scholar] [CrossRef]
- Wu, D.; Ning, S. Dynamic assessment of urban economy-environment-energy system using system dynamics model: A case study in Beijing. Environ. Res. 2018, 164, 70–84. [Google Scholar] [CrossRef]
- Feliciotti, A.; Romice, O.; Porta, S. Design for change: Five proxies for resilience in the urban form. Open House Int. 2016, 41, 23–30. [Google Scholar]
- Ernstson, H.; der Leeuw, S.; Redman, C.; Meffert, D.; Davis, G.; Alfsen, C.; Elmqvist, T. Urban Transitions: On Urban Resilience and Human-Dominated Ecosystems. Ambio 2010, 39, 531–545. [Google Scholar] [CrossRef]
- Feliciotti, A.; Romice, O.; Porta, S. Urban regeneration, masterplans and resilience: The case of Gorbals, Glasgow. Urban Morphol. 2017, 21, 61–79. [Google Scholar]
- Datola, G.; Bottero, M.; Angelis, E. How Urban Resilience Can Change Cities: A System Dynamics Model Approach. In International Conference on Computational Science and Its Applications; Springer: Cham, Switzerland, 2019; pp. 108–122. ISBN 978-3-030-24304-3. [Google Scholar]
- Figueira, J.; Greco, S.; Ehrgott, M. Multiple Criteria Decision Analysis, State of the Art Surveys. Mult. Criteria Decis. Anal. State Art Surv. 2005, 78. [Google Scholar] [CrossRef]
- Kheybari, S.; Rezaie, F.M.; Farazmand, H. Analytic network process: An overview of applications. Appl. Math. Comput. 2020. [Google Scholar] [CrossRef]
- Saaty, T.L. Fundamentals of the analytic network process—Dependence and feedback in decision-making with a single network. J. Syst. Sci. Syst. Eng. 2004. [Google Scholar] [CrossRef]
- Vargas, L.G. An overview of the analytic hierarchy process and its applications. Eur. J. Oper. Res. 1990. [Google Scholar] [CrossRef]
- Saaty, T.L. Theory and Applications of the Analytic Network Process: Decision Making with Benefits, Opportunities, Costs, and Risks; RWS Publications: Pittsburgh, PA, USA, 2005; ISBN 9781888603064. [Google Scholar]
- Ishizaka, A.; Nemery, P. Multi-criteria Decision Analysis: Methods and Software; Wiley: Hoboken, NJ, USA, 2013; ISBN 9781118644928. [Google Scholar]
- Bottero, M.; Lami, I. Analytic Network Process and sustainable mobility: An application for the assessment of different scenarios. J. Urban. 2010, 3, 275–293. [Google Scholar] [CrossRef]
- Bottero, M.; Mondini, G.; Valle, M. The use of the Analytic Network Process for the sustainability assessment of an urban transformation project. In International Conference on Whole Life Urban Sustainability and its Assessment; SUEMoT: Glasgow, UK, 2007. [Google Scholar]
- Saaty, T. The analytic hierarchy and analytic network measurement processes: Applications to decisions under risk. Eur. J. Pure Appl. Math. [electronic only] 2008, 1, 122–196. [Google Scholar]
- Bottero, M.; Ferretti, V. Integrating the analytic network process (ANP) and the driving force-pressure-state-impact- responses (DPSIR) model for the sustainability assessment of territorial transformations. Manag. Environ. Qual. An Int. J. 2010, 21, 618–644. [Google Scholar] [CrossRef]
- Alizadeh, M.; Ngah, I.; Hashim, M.; Pradhan, B.; Pour, A. A Hybrid Analytic Network Process and Artificial Neural Network (ANP-ANN) Model for Urban Earthquake Vulnerability Assessment. Remote Sens. 2018, 10, 975. [Google Scholar] [CrossRef]
- Sayyadi, R.; Awasthi, A. An integrated approach based on system dynamics and ANP for evaluating sustainable transportation policies. Int. J. Syst. Sci. Oper. Logist. 2020, 7, 182–191. [Google Scholar] [CrossRef]
- De Lotto, R.; Gazzola, V.; Gossenberg, S.; di Popolo, C.; Venco, E. Proposal to Reduce Natural Risks: Analytic Network Process to Evaluate Efficiency of City Planning Strategies. In International Conference on Computational Science and Its Applications; Springer: Cham, Switzerland, 2016; Volume 9789, pp. 650–664. [Google Scholar]
- Cui, P.; Li, D. Measuring the Disaster Resilience of an Urban Community Using ANP-FCE Method from the Perspective of Capitals. Soc. Sci. Q. 2019, 100. [Google Scholar] [CrossRef]
- Chan, S.-L.; Wey, W.-M.; Chang, P.-H. Establishing Disaster Resilience Indicators for Tan-sui River Basin in Taiwan. Soc. Indic. Res. 2014, 115. [Google Scholar] [CrossRef]
- Thompson, B.; Bank, L. Use of system dynamics as a decision-making tool in building design and operation. Build. Environ. 2010, 45, 1006–1015. [Google Scholar] [CrossRef]
- Bala, B.K.; Arshad, F.M.; Noh, K.M. Systems Thinking: System Dynamics. In System Dynamics: Modelling and Simulation; Springer Singapore: Singapore, 2017; pp. 15–35. ISBN 978-981-10-2045-2. [Google Scholar]
- Yao, H.; Shen, L.; Tan, Y.; Hao, J. Simulating the impacts of policy scenarios on the sustainability performance of infrastructure projects. Autom. Constr. 2011. [Google Scholar] [CrossRef]
- Chen, M.; Ho, T.; Jan, C. A System Dynamics Model of Sustainable Urban Development: Assessing Air Purification Policies at Taipei City. Asian Pac. Plan. Rev. 2006, 4, 29–52. [Google Scholar]
- Zhang, X.; Wu, Y.; Shen, L.; Skitmore, M. A prototype system dynamic model for assessing the sustainability of construction projects. Int. J. Proj. Manag. 2014. [Google Scholar] [CrossRef]
- Egilmez, G.; Tatari, O. A dynamic modeling approach to highway sustainability: Strategies to reduce overall impact. Transp. Res. Part A Policy Pract. 2012, 46, 1086–1096. [Google Scholar] [CrossRef]
- Pejic Bach, M.; Tustanovski, E.; Ip, W.H.; Yung, K.; Roblek, V. System dynamics models for the simulation of sustainable urban development: A review and analysis and the stakeholder perspective. Kybernetes 2020, 49. [Google Scholar] [CrossRef]
- Shepherd, S. A review of system dynamics models applied in transportation. Transp. B Transp. Dyn. 2014, 2. [Google Scholar] [CrossRef]
- Shen, G.; Chen, Q.; Tang, B.-S.; Yeung, S.; Hu, Y.; Cheung, G. A system dynamics model for the sustainable land use planning and development. Habitat Int. 2009, 33, 15–25. [Google Scholar] [CrossRef]
- Yu, C.; Chen, C.; Lin, C.; Liaw, S. Development of a system dynamics model for sustainable land use management. J. Chin. Inst. Eng. 2003, 26, 607–618. [Google Scholar] [CrossRef]
- Yuan, H.; Chini, A.R.; Lu, Y.; Shen, L. A dynamic model for assessing the effects of management strategies on the reduction of construction and demolition waste. Waste Manag. 2012. [Google Scholar] [CrossRef] [PubMed]
- Güneralp, B.; Seto, K. Environmental impacts of urban growth from an integrated dynamic perspective: A case study of Shenzhen, South China. Glob. Environ. Chang. 2008, 18, 720–735. [Google Scholar] [CrossRef]
- Tan, Y.; Jiao, L.; Shuai, C.; Shen, L. A system dynamics model for simulating urban sustainability performance: A China case study. J. Clean. Prod. 2018, 199, 1107–1115. [Google Scholar] [CrossRef]
- Park, M.; Kim, Y.; Lee, H.S.; Han, S.; Hwang, S.; Choi, M.J. Modeling the dynamics of urban development project: Focusing on self-sufficient city development. Math. Comput. Model. 2013. [Google Scholar] [CrossRef]
- Kuznecova, T.; Romagnoli, F. System Dynamics approach within the context of city resilience and urban metabolism. In Proceedings of the 9th International Conference Environmental Engineering, Vilnius, Lithua, 22–23 May 2014. [Google Scholar]
- Brans, J.P.; Macharis, C.; Kunsch, P.L.; Chevalier, A.; Schwaninger, M. Combining multicriteria decision aid and system dynamics for the control of socio-economic processes. An iterative real-time procedure. Eur. J. Oper. Res. 1998. [Google Scholar] [CrossRef]
- Bottero, M.; Datola, G.; Monaco, R. Exploring the resilience of urban systems using fuzzy cognitive maps. In Proceedings of the Lecture Notes in Computer Science. Computational Science and Its Applications—ICCSA 2017; ICCSA 2017; Gervasi, O., Murgante, B., Misra, S., Borruso, G., Torre, C.M., Rocha, A.M.A.C., Taniar, D., Apduhan, B.O., Stankova, E., Cuzzocrea, A., Eds.; Springer: Cham, Szitzerland, 2017. [Google Scholar]
- Sterman, J. Business Dynamics, System Thinking and Modeling for a Complex World. 2000. Available online: http://lst-iiep.iiep-unesco.org/cgi-bin/wwwi32.exe/[in=epidoc1.in]/?t2000=013598/(100) (accessed on 15 July 2020).
- Manetsch, T.J.; Park, G.L. Systems Analysis and Simulation with Applications to Economic and Social Systems; Department of Electrical Engineering and System Science, Michigan State University: East Lansing, MI, USA, 1972. [Google Scholar]
- Bottero, C.; Caprioli, C.; Berta, M. Un approccio multilivello per la valutazione di interventi di rigenerazione urbana: Il caso dell’area di Basse di Stura a Torino A multi-level approach for assessing urban regeneration programs: The case of the Basse di Stura area in Turin. Atti Rass. Tec. 2019, 131–137. Available online: http://art.siat.torino.it/wp-content/uploads/2020/03/ART_LXXIII_2_ATTI.pdf (accessed on 15 July 2020).
- Bottero, M.; Caprioli, C.; Berta, M. Urban problems and patterns of change: The analysis of a downgraded industrial area in Turin. Green Energy Technol. 2020, 385–401. [Google Scholar] [CrossRef]
- Procedura, T.; Vica, C. Provincia di Torino Determinazione del Dirigente del Servizio Valutazione Impatto Ambientale, Pianificazione e Gestione Attività Estrattive Il Dirigente del Servizio Valutazione Impatto Ambientale. Pianificazione e Gestione Attività Estrattive. 2003, pp. 1–11. Available online: http://www.cittametropolitana.torino.it/cms/risorse/ambiente/dwd/via/provvedimenti-verifica/ver1-50/DD_n.46-190387.pdf (accessed on 15 July 2020).
- Godet, M.; Coates, J.F.; Radford, K. Creating Futures: Scenario Planning as a Strategic Management Tool; Brookings Institution Press: Washington, DC, USA, 2001; ISBN 9782717841893. [Google Scholar]
- Cutter, S.L.; Ash, K.D.; Emrich, C.T. The geographies of community disaster resilience. Glob. Environ. Chang. 2014. [Google Scholar] [CrossRef]
- Figueiredo, L.; Honiden, T.; Schumann, A. Indicators for Resilient Cities. OECD Reg. Dev. Work. Pap. 2018. [Google Scholar] [CrossRef]
- Bottero, M.; Datola, G.; Monaco, R. The use of fuzzy cognitive maps for evaluating the reuse project of military barracks in northern Italy. In New Metropolitan Perspectives. ISHT 2018. Smart Innovation, Systems and Technologies; Calabrò, F., Della Spina, L., Bevilacqua, C., Eds.; Springer: Cham, Switzerland, 2019; ISBN 9783319920986. [Google Scholar]
- Forrester, J.W. Urban Dynamics; M.I.T. Press: Cambridge, MA, USA, 1979; ISBN 9780262060264. [Google Scholar]
- Assumma, V.; Bottero, M.; Datola, G.; De Angelis, E.; Monaco, R. Dynamic models for exploring the resilience in territorial scenarios. Sustainability 2020, 12, 3. [Google Scholar] [CrossRef]
- Assumma, V.; Bottero, M.; Datola, G.; Pezzoli, A. Climate Change and Urban Resilience. Preliminary Insights from an Integrated Evaluation Framework. 2021; 1–10, in press. [Google Scholar]
- Assumma, V.; Bottero, M.; Monaco, R.; Soares, A.J. An integrated evaluation methodology to measure ecological and economic landscape states for territorial transformation scenarios: An application in Piedmont (Italy). Ecol. Indic. 2019, 105, 156–165. [Google Scholar] [CrossRef]


| Value | Definition | Explanation |
|---|---|---|
| 1 | Equally important | Two decision elements equally influence the parent decision element |
| 3 | Moderately / more important | One decision element is moderately more influential than the other. |
| 5 | Much more important | One decision element has more influence than the other |
| 7 | Very much more important | One decision element has significantly more influence over the other. |
| 9 | Extremely more important | The difference between influences of the two decision elements is extremely significant. |
| 2,4,6,8 | The difference between influences of the two decision elements is extremely significant. | Judgment values between equally, moderately, much, very much and extremely influential. |
| Dimension | Indicators | Description | Unit | Direction of Preference |
|---|---|---|---|---|
| Economy | New businesses | Number of new businesses created in the area and in the surroundings | [Num.] | Maximize |
| Number of jobs | Total number of jobs: existing and new jobs created | [Num.] | Maximize | |
| Society | Population Composition | This indicator allows us to describe the population differentiation, based on age, sex and ethnicity, in percentages | [%] | Maximize |
| Mixitè Index | Index describing the differentiation of the functions located in this area | [0,1] | Maximize | |
| Health and Safety of Inhabitants | This indicator describes the general conditions of the inhabitants in terms of health and safety | [%] | Maximize | |
| Built Environment | Regeneration | Total of the surface area recovered | [Hectare] | Maximize |
| New Construction | New construction land area | [Hectare] | Minimize | |
| Number of Buildings exposed to hazards | Number of existing buildings exposed to different hazards (for example: collapse) | [Num.] | Minimize | |
| Environment | Permeable Surface | Total of permeable surface | [Hectare] | Maximize |
| Soil Consumption | Total of area converted into urban area | [Hectare] | Minimize | |
| Brownfield | Total of area covered by brownfield | [Hectare] | Minimize | |
| Governance | Risk Reduction | Integration of risk–based planning in the strategy | Qualitative (present–not present) [0,1] | Maximize |
| Funding availability | Municipal budget available to be spent on public services, social protection, investments | Qualitative (present–not present) [0,1] | Maximize | |
| Multi-stakeholder decision planning and decision making | Level of stakeholder participation in the process of the identification of strategies, objectives and actions | Qualitative (present–not present) [0,1] | Maximize | |
| Recovery and Restoration | Integration of the recovery and restoration in the action plan | Qualitative (present–not present) [0,1] | Maximize |
| Built Environment | 9 | 8 | 7 | 6 | 5 | 4 | 3 | 2 | 1 | 2 | 3 | 4 | 5 | 6 | 7 | 8 | 9 | Environment |
| Permeable Surface | 9 | 8 | 7 | 6 | 5 | 4 | 3 | 2 | 1 | 2 | 3 | 4 | 5 | 6 | 7 | 8 | 9 | Soil Consumption |
| Permeable Surface | 9 | 8 | 7 | 6 | 5 | 4 | 3 | 2 | 1 | 2 | 3 | 4 | 5 | 6 | 7 | 8 | 9 | Brownfield |
| Brownfield | 9 | 8 | 7 | 6 | 5 | 4 | 3 | 2 | 1 | 2 | 3 | 4 | 5 | 6 | 7 | 8 | 9 | Soil Consumption |
| Final Priorities Vector | |
|---|---|
| New businesses | 0.016 |
| Number of jobs | 0.016 |
| Population Composition | 0.044 |
| Mixitè Index | 0.006 |
| Health and Safety of Inhabitants | 0.155 |
| Regeneration | 0.094 |
| New Construction | 0.052 |
| Buildings exposed to hazards | 0.060 |
| Permeable Surface | 0.102 |
| Soil Consumption | 0.048 |
| Brownfield | 0.348 |
| Risk Reduction | 0.022 |
| Funding availability | 0.007 |
| Multi-stakeholder decision planning and decision making | 0.003 |
| Recovery and Restoration | 0.019 |
© 2020 by the authors. Licensee MDPI, Basel, Switzerland. This article is an open access article distributed under the terms and conditions of the Creative Commons Attribution (CC BY) license (http://creativecommons.org/licenses/by/4.0/).
Share and Cite
Bottero, M.; Datola, G.; De Angelis, E. A System Dynamics Model and Analytic Network Process: An Integrated Approach to Investigate Urban Resilience. Land 2020, 9, 242. https://doi.org/10.3390/land9080242
Bottero M, Datola G, De Angelis E. A System Dynamics Model and Analytic Network Process: An Integrated Approach to Investigate Urban Resilience. Land. 2020; 9(8):242. https://doi.org/10.3390/land9080242
Chicago/Turabian StyleBottero, Marta, Giulia Datola, and Elena De Angelis. 2020. "A System Dynamics Model and Analytic Network Process: An Integrated Approach to Investigate Urban Resilience" Land 9, no. 8: 242. https://doi.org/10.3390/land9080242
APA StyleBottero, M., Datola, G., & De Angelis, E. (2020). A System Dynamics Model and Analytic Network Process: An Integrated Approach to Investigate Urban Resilience. Land, 9(8), 242. https://doi.org/10.3390/land9080242